Article

Lightning Protection of the Explosion Airflow Arc-Quenching Gap for 110 kV Transmission Lines

1
Department of Mechanical and Control Engineering, Guilin University of Technology, Guilin 541000, China
2
The Key Laboratory of High Voltage, Department of Electrical Engineering, Guangxi University, Nanning 530004, China
*
Author to whom correspondence should be addressed.
Energies 2021, 14(16), 5126; https://doi.org/10.3390/en14165126
Submission received: 13 July 2021 / Revised: 16 August 2021 / Accepted: 17 August 2021 / Published: 19 August 2021
(This article belongs to the Topic Power Distribution Systems)

Abstract

:
With the increase in the voltage level and number of transmission lines, the probability of lightning strikes on transmission lines is significantly increased, while lightning breakage accidents occur frequently. Therefore, an explosion airflow arc-quenching gap for 110 kV transmission lines was developed based on the idea of rapid extinction. A mathematical model of the detonation wave based on the CJ (Chapman–Jouget) detonation wave theory was developed to calculate the detonation air pressure and analyze its influencing factors. ANSYS software and the magnetohydrodynamic (MHD) model were used to simulate the process of detonation airflow coupled with an arc, and the simulation results indicated that the power frequency arc was evidently suppressed with the influence of airflow, which can effectively prevent arcing. A combined impulse and power frequency test and arc-quenching tests were performed to verify the effectiveness of the arc-quenching gap. The results of the combined test indicated that the arc burn time was 0.1 ms and that no power frequency continuous current was displayed. The results ensured the accuracy of the simulation model. The results of the arc-quenching tests proved that the explosion airflow can extinguish a power frequency arc with an amplitude of 40 kA in half of a power frequency arc cycle.

1. Introduction

Lightning strike accidents are common and serious in power systems. According to the fault situations published by the International Council on Large Electric Systems (CIGRE) in twelve countries, lightning accidents accounted for 40–60% of these faults. According to the statistics of the State Grid Corporation of China from 2010 to 2015, the lightning outage rate of 330 kV or above accounted for 39.4–50.8% of the total number of trips on lines. However, the lightning outage rate of 110 kV or above in China Southern Power Grid lines accounted for 66.81% of total trips in 2016. [1,2]. The basic reason for a trip caused by lightning is that the stable power frequency electric arc can burn the insulators, leading to lightning trip-out of the transmission line. Therefore, lightning strikes are still the main reason for trip-outs of transmission lines.
Currently, conventional protection methods in China are divided into “dredging type” and “blocking type”. The level of lightning resistance and insulation of transmission lines is low, and direct lightning overvoltage and induced lightning overvoltage can cause the insulation to flash and affect the reliability of the power supply [3,4,5,6,7,8]. Traditional lightning protection methods primarily include the installation of a coupled ground wire, the reduction of the grounding resistance of the tower, the reinforcement of insulation, the installation of automatic reset devices, etc. However, traditional methods do not effectively prevent lightning accidents.
Consequently, lightning protection measures such as the dredging-type have been proposed. The principle behind dredging lighting protection methods is to install parallel gaps on both sides of the insulator string. Compared to insulators, the parallel gap can be broken, preferably by lightning overvoltage, thus transferring the impulse flashover path between parallel electrodes. The subsequent power frequency arc drifts rapidly at the end of the electrode under the action of electromagnetic force, so as to prevent the insulator string from being burned by the arc. [9]. The most typical lightning protection measure of the dredging type is to install a parallel gap. For example, Wei-jiang Chen developed an arc-guided protection device for distribution lines with covered conductors, to protect against lightning strikes. The mechanism of arc-guided protection devices is that an AC power frequency arc can be guided to a special metal electrode to prevent the covered conductor from being burned and broken, and the arc burns on a special metal electrode of a large size to prevent burn-off [10,11,12,13,14,15]. However, it has no arc-quenching function. Professor Sima Wenxia’s team from Chongqing University has developed a fast arc-extinguishing structure adapted to parallel gaps, based on the idea of microporous multi-storey arc quenching. [16,17,18,19,20]. In recent years, G. V. Podporkin’s research group has developed a new type of multichamber arc-quenching device. The energy decomposes the chemical materials in the inner wall and triggers a high-speed airflow, to extinguish the arc [21]. Domestically, professor Zhou Wenjun’s team at Wuhan University developed a 10 kV multichamber arc-extinguishing structure and a 110 kV composite discharge gap surge arrester after theoretical analysis and experimental research. The composite discharge gap surge arrester has a good capability for interrupting power frequency continuous current, and the arc will not reignite [22]. However, in these measures, the power frequency arc-quenching energy has hysteresis.
To effectively prevent lightning accidents caused by lightning flashovers, an arc suppression device of the dredging type, called an explosion airflow arc-quenching gap (EAAG), has been developed. The mechanism behind this device is that an AC power frequency arc can be guided from a high-voltage electrode to a low-voltage electrode to prevent the insulators from being burned, while the lightning current pulse signal is captured by the signal collector. Then, a gas pill is triggered synchronously to generate an explosion airflow with high speed and pressure, which propagates axially along the arc-quenching chamber and blows the arc intensely and vertically. Finally, the arc will be cut off and extinguished by the explosion airflow. The design of the EAAG is mainly based on the idea of rapid extinction. Combined with the general law of the arc development process, the principle of electromagnetic induction is used to trigger the arc-quenching gas pill at the initial stage of arc combustion. Meanwhile, a high-speed airflow is generated to extinguish the arc, and the recovery strength of the medium is enhanced, which causes the arc to be extinguished in the impact phase. In this paper, an explosion airflow arc-quenching gap is introduced, and its characteristics, the motion process of the arc, and experimental results are presented. Furthermore, the application effect of the device is analyzed; thus, verifying the validity and reliability of the device.

2. Operation Principle of the EAAG

2.1. Operation Principle

Based on the concept of lightning protection by dredging, the EAAG was developed to reduce lightning accidents. In this paper, the structural parameters and arc-quenching performance of the EAAG are investigated.
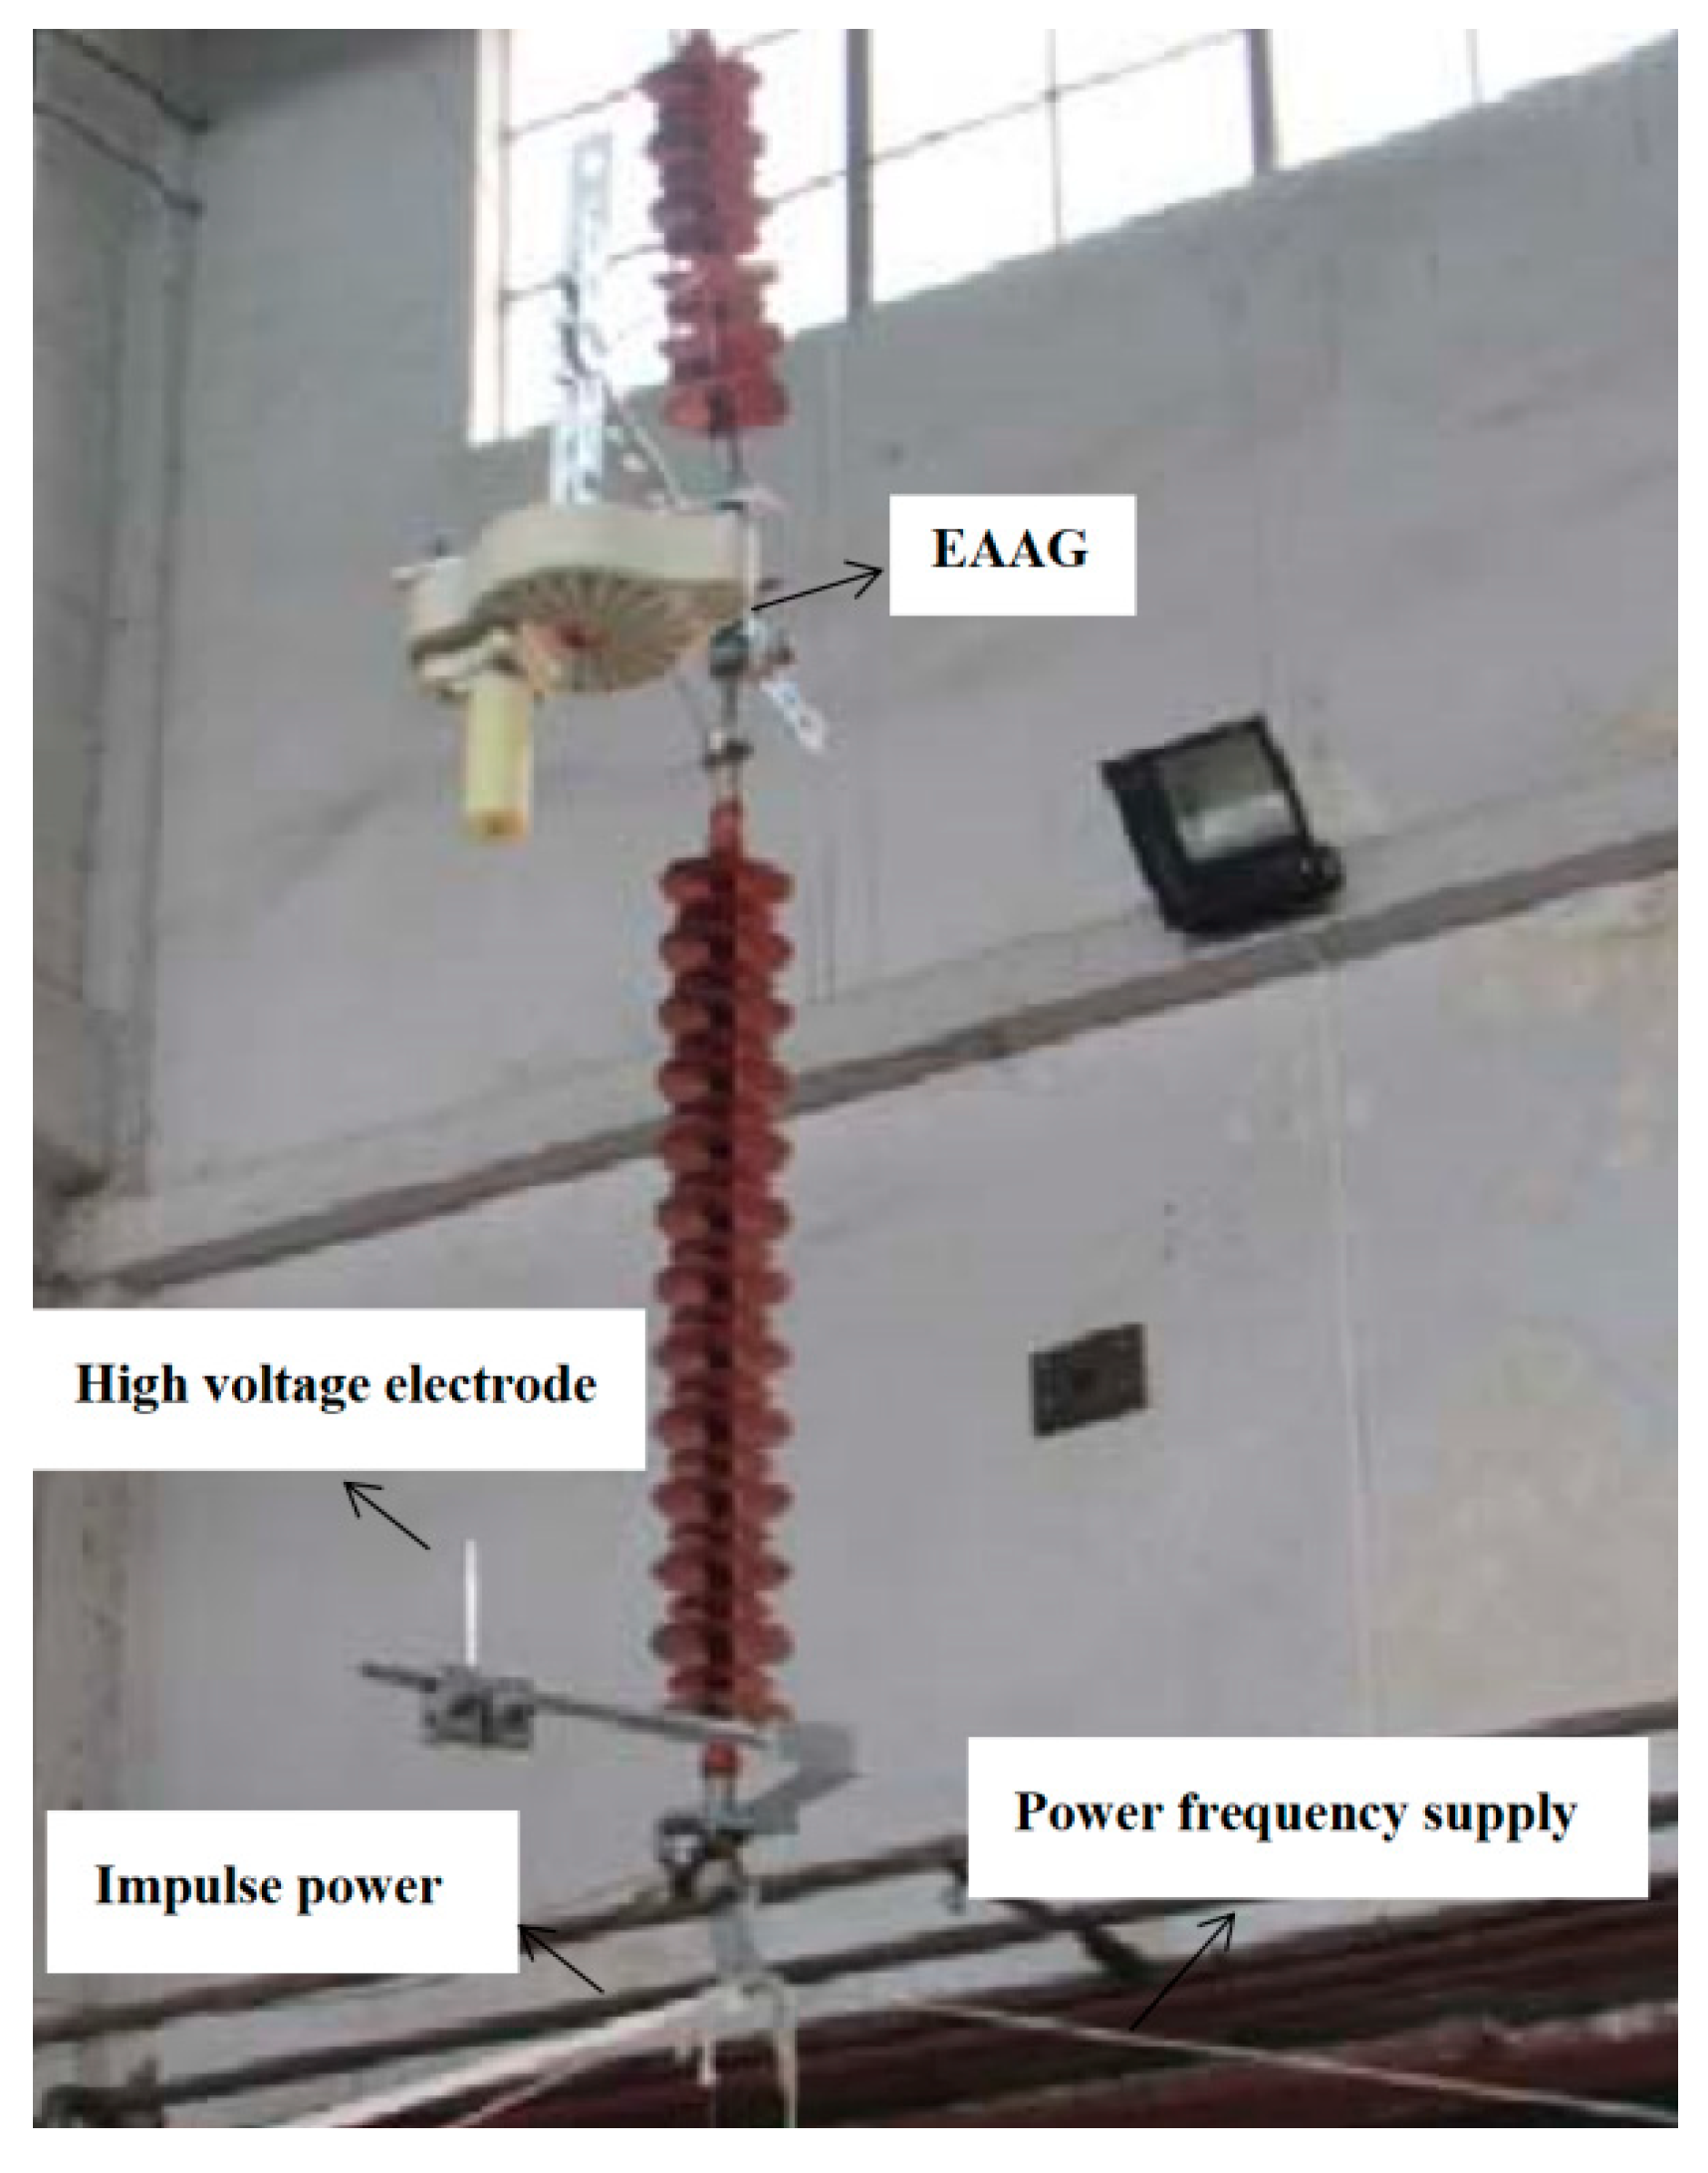
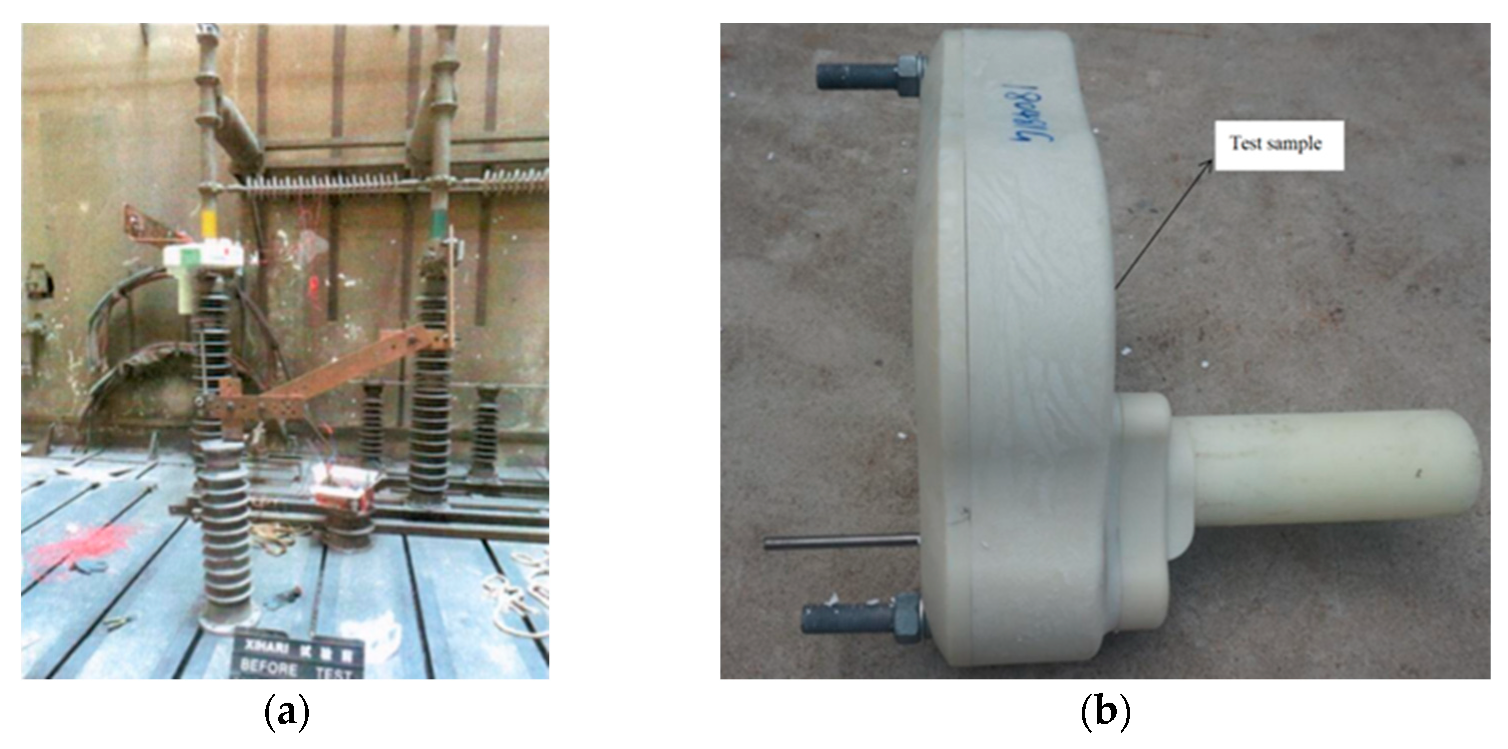
Figure 1 depicts the structure of an EAAG. Figure 1a shows the schematic installation diagram of the device. As shown in Figure 1a, an EAAG is composed of a high-voltage electrode, a low-voltage electrode, and an arc-quenching chamber. The use of a piercing fixture can stabilize the high-voltage electrode on the transmission line. The angle between the high-voltage electrode and the transmission line is 90°. If the angle is deviated during installation, the gap distance in Figure 1 will be altered, which will affect the arcing path and arc-quenching performance of the EAAG. Figure 1b shows the structure of the arc-quenching chamber. As shown in Figure 1b, a low-voltage electrode is placed inside the device and is used as an arc guide electrode. A plurality of arc-quenching gas pills are arranged inside the device. When a lightning strike occurs, the arc-extinguishing gas pills are triggered, to produce a high-speed air flow that acts axially on the arc, speeding up the deionization process. The temperature and conductivity of the arc suddenly decrease, and the energy of the arc rapidly disintegrates, causing a fracture of the arc. Finally, the arc is extinguished by the airflow. The spatial arrangement of the arc quenching chamber comprises a small opening and a cylindrical shape, which results in the compression of the arc. The EAAG is installed on a tower cross arm. In addition, an air gap, formed between the high-voltage electrode and the low-voltage electrode and the air gap, is arranged between the device and the transmission line. The distance of the air gap is 0.84 m, which depends on the type of insulator, insulation distance of the insulator, temperature, humidity, and pressure of the surrounding environment, etc. The insulator model selected in this paper is FXBW-110/70-1, which has an insulation distance of 1 m. Therefore, there is a lot of space for the arc to stretch out, and then, the arc is easily extinguished.
Due to the lightning overvoltage difference between the insulator and the device, an arc is initially guided to the side of the equipment using the specified insulation to prevent the insulator from being burned when a lightning strike occurs. The arc-building process and arc-quenching process occur simultaneously. An arc-quenching gas pill is triggered by the lightning pulse, to generate a high-speed and high-pressure airflow in the arc-quenching chamber. The airflow response time is so fast that the arc is always in the transient development process, which prevents the energy of the arc from being fully released. Meanwhile, an arc forms in the arc-quenching chamber because of the breakdown of the air gap, and the arc is extremely compressed as a result of the structure of the arc-quenching chamber. This procedure favors an increase in arc-quenching energy. Under the impact of the airflow, the arc is forced to stretch and deform intensively. The energy fracture appears in the arc, and the dissociation effect is reinforced. Finally, the arc is extinguished. When the amplitude of the lightning current is low, the arc is extinguished during transient development.
If the energy supply is sufficient, the impulse arc develops into a power frequency arc. The EAAG still extinguishes the power frequency follow current. The action time of the arc-quenching gas pills runs throughout the arc generation and extinction process. Even if the arc is rekindled, another arc-quenching gas pill will be triggered to extinguish the arc. As a result, the successful development of the device is useful for eliminating the occurrence of lightning damage and reducing economic losses.

2.2. Theoretical Analysis

To study how the detonation airflow can extinguish the arc and prevent the arc from reburning, the maximum pressure and action time of the detonation airflow are calculated and analyzed. The mathematical model for the calculation of the parameters of the detonation wave is established. Figure 2 is the CJ detonation wave model.
As shown in Figure 2, the primitive explosive enters the wave vibration surface at a speed of D v 0 and flows out of the wave front at a speed of D v j . The incoming mass on the wave vibration surface per unit of time is equal to the outgoing mass. Consequently, the mass conservation equation is derived as follows:
ρ 0 ( D v 0 ) = ρ j ( D v j )
where D is the velocity of spread of the detonation wave; v0 and vj are the velocities of the primitive explosive and the product formed after the detonation; ρ0 and ρj are the densities of the primitive explosive and the product formed after the detonation.
The sum of the impulse on the action medium per unit of time equals its change in momentum. Therefore, the momentum conservation equation is derived as follows:
p j p 0 = ρ 0 ( D v 0 ) ( v j v 0 )
where p 0 and p j are the pressure of the primitive explosive and the product formed after the detonation. The left side of Equation (2) is the change of impulse per unit of time, and the right side of Equation (2) is the change of momentum.
The energy entering from the wave vibration surface per unit time and per unit surface is equal to the energy exiting the wave vibration surface. The total energy comprises three elements: the total internal energy of the explosive product, the potential pressure energy, and the kinetic energy. The energy conservation equation is derived as follows:
ρ 0 ( D v 0 ) U 0 + p 0 ( D v 0 ) + 1 2 ρ 0 ( D v 0 ) 3 = ρ j ( D v j ) U j + p j ( D v j ) + 1 2 ρ j ( D v j ) 3
where U0 and Uj are the total internal energies of the primitive explosive and the product formed after the detonation, respectively. The first, second, and third terms of Equation (3) are the total internal energy, pressure potential energy, and kinetic energy of the explosive products, respectively.
The velocity equations of the detonation wave are obtained by resolving Equations (1) and (2):
D = v 0 p j p 0 v 0 v j
μ j = ( v 0 v j ) p j p 0 v 0 v j
where μj is the velocity of particulates.
Chapman–Jouguet (C–J) condition equation:
p j p 0 v 0 v j = k j p j v j
The equation of the Hugoniot detonation wave is obtained by resolving Equations (3)–(6):
p j v j k j 1 p 0 v 0 k 0 1 = 1 2 ( p j + p 0 ) ( v 0 v j ) + q v
where k0 is the initial adiabatic index; kj is the actual adiabatic index; qv is the constant volumetric heat of the reaction.
At present, many countries use the Becker–Kistiakowsky–Wilson (BKW) equation of state to calculate the parameters of the detonation wave. Its general expression is as follows:
p j = N g R T r j W ( 1 + k H r j ( T + q ) a e x p [ b k H r j ( T + q ) a ] )
where Ng is the mole of detonation products per gram of explosive; W is the mass fraction of explosives converted into gas products; α, β, k, and θ are experiential parameters; H is a constant; R is the gas constant; T is temperature.
Equations (7) and (8) are solved to obtain the pressure in the arc-quenching chamber. Equation (8) shows that the detonation pressure is related to the number of moles of detonation product, the density and the mass fraction of explosives converted into gas products. As the density and number of moles of the detonation products increase, the detonation pressure increases. As the mass fraction of explosives converted into gas products increases, the detonation pressure decreases. Additionally, the value is related to the structure of the entire arc-quenching chamber.
Due to the increased pressure in the arc-quenching chamber, the coupling of airflow and arc will form a jet phenomenon at the outlet of the arc-quenching pipe, it is therefore important to analyze the characteristics of the arc column jet at the arc-quenching pipe outlet.
Momentum equation of an arc column jet:
( ρ U · ) U = ( J × B ) P l
where ρ , P l , and U are the density, axial pressure, and flow rate of the arc, respectively, and J × B is the Lorentz force.
Integration via streamline l, Equation (9) can be transformed as:
l ρ · ( U 2 / 2 ) d l + l P l d l = l ( J × B ) d l
Equation (10) is simplified, to result in:
P l + ρ U 2 2 = l ( J × B ) d l + C 0
where C0 is a constant.
Figure 3 shows the force analysis diagram of the pipe outlet. As shown in Figure 3, point 1, point 2, point 3, and point 4 are located at the center of the pipe exit, lateral to point 1, on an axis within the arc column spray, and somewhere outside the area of apparent arc column spray expansion, respectively. Since points 1 and 3 are on the same arc column axis and the same profile, for all points of the arc column axis:
l ( J × B ) d l = 0
Equations (11) and (12) are combined to obtain:
P l + ρ U 2 2 = C 0
U max = 2 P l ρ
Therefore, the maximum flow velocity of the arc column jet is determined by the maximum axial pressure and fluid density, and the higher the maximum axial pressure at the pipe outlet, the larger the arc column spray expansion.

3. Simulation of the Arc-Quenching Process

3.1. Magnetohydrodynamic (MHD) Model

Assume that the interrupter field accords with the local thermodynamic equilibrium (LTE), a three-dimensional MHD numerical model based on Navier–Stokes equations is established.
Mass-conservation equation:
ρ t + ( ρ u ) x + ( ρ v ) y + ( ρ w ) z = 0
where ρ is the density of the airflow and u, v, and w are the velocity components in the x, y, and z directions of the airflow.
Momentum conservation equation:
( ρ u ) t + ( ρ u u ) x + ( ρ u v ) y + ( ρ u w ) z = p x + τ x x x + τ y x y + τ z x z + F x
( ρ v ) t + ( ρ v u ) x + ( ρ v v ) y + ( ρ v w ) z = p y + τ x y x + τ y y y + τ z y z + F y
( ρ w ) t + ( ρ w u ) x + ( ρ w v ) y + ( ρ w w ) z = p z + τ x z x + τ y z y + τ z z z + F z
where p is the pressure of the airflow; t is the time; F = J × B; Fx, Fy, and Fz are the components of the Lorentz force in the x, y, and z directions, respectively; τxx, τyx, τzx, τxy, τyy, τzy, τxz, τyz, and τzz are the stresses in each direction; J is the current density; and B is the magnetic induction strength.
Energy conservation equation:
( ρ H ) t + ( ρ u S ) x + ( ρ v S ) y + ( ρ w S ) z = · ( k T ) + p t + Q S R
where S is enthalpy; Q is Joule heating; SR is the heat radiation term.
Calculation formula for Joule heating:
Q = J 2 σ
where σ is the arc conductivity;
Calculation formula for the heat radiation term:
S R = 4 d φ ( T 4 T 0 4 )
where d and φ are constant; T0 is the ambient temperature.
Gas state equation:
p = λ R T
where λ is the gas correction factor; R is the gas constant.
Ohm’s law:
J = σ E
where σ is the arc conductivity; E is the electric field strength.
Magnetic field equation:
× B = μ 0 J
where µ0 is vacuum permeability.
× E = B t
The geometry of the elements can be configured as shown in Figure 4. In Figure 4, the red zone indicates the arc, the blue zone indicates the air, and the green zone indicates an arc-extinguishing energy group. The whole arc-quenching structure is cylindrical.
Figure 5 shows the distribution of Gaussian point positions in the arcing cylinder. As shown in Figure 5, there are five Gaussian points in the arc-quenching chamber. And the Gaussian points 1, 2, 3, 4, and 5 are located respectively near the point of det-onation, in the middle of the arc-quenching chamber, and at the outlet of the arc-quenching chamber.

3.2. Simulation and Analysis Results

When the gap between the device and high-voltage electrode breaks down, the impulse arc induces the action of an arc-quenching gas pill, which generates a high-energy compression wave acting on the arc. The arc is lengthened, which accelerates the process of dissociation, and ultimately, the arc is extinguished. The pressure variation curves for each observation point in the arc chamber are shown in Figure 6. Figure 6a shows the pressure variation curve at each monitoring point, taking into consideration the influence of the arc; Figure 6b shows the pressure variation curve at each monitoring point, without taking into consideration the influence of the arc.
Based on a comparison of Figure 6a,b, the maximum pressure in the arc-quenching chamber is shown at the root of the arc, which is the point where the arc is easily extinguished. As shown in Figure 6a, the pressures at the three control points outside the arc-quenching chamber are not elevated, because of the arc-blocking effect. Compared with Figure 6b, the pressure at the No. 2 observation point sharply increases when t = 0.04 ms in Figure 6a. At this time, the airflow effectively acts on the arc, the arc is elongated, the process of dissociation and separation is reinforced, positive and negative ions rapidly recombine, and the arc temperature is reduced.
The cloud diagram of the pressure distribution in the arc-quenching chamber during the entire arc-quenching process is shown in Figure 7. Figure 7a–d are the stress contours of the arc-quenching chamber collected at t = 29 µs, 41 µs, 57 µs, and 80 µs, respectively. As shown in Figure 6a and Figure 7b, the pressure of the explosion reaches the peak value at the No. 2 Gaussian point at 0.041 ms. Due to the arc blocking effect, the arc at the exit of the arc quenching chamber shows a mushroom cloud form as a whole, as shown in Figure 7c. As shown in Figure 7d, the total time of the arc quenching process is 0.08 ms, which is much less than half a cycle of the power frequency arc. There is evidence that the arc-quenching time is significantly reduced by the action of the arc-coupled airflow.

4. Experimental Verification

4.1. Lightning Impulse Discharge Experiment

To test the insulation coordination of the device and insulators, a lightning impulse discharge experiment was performed, in which a 110 kV insulator flashover caused by a lightning strike was simulated. The equivalent test circuit of the impulse voltage generator is illustrated in Figure 8. The left side of Figure 8 shows the lightning wave generating circuit, and the right side shows the test sample. C1 and C2 are H.V/L.V arm-capacitance, which are used to measure the discharge voltage at both ends of the sample.
The parameters of the impulse voltage generator are shown in Table 1. The maximum voltage generated was 3000 kV. The wave front and half-peak time of the lightning wave in the test were 1.2 and 50 μs, respectively.
The entire impulse voltage discharge test was performed in accordance with the national standards for high-voltage tests. To observe the airflow-arc coupling process inside the arc-quenching chamber, it is made of transparent materials and has high temperature and high pressure resistance. Figure 9 shows an action snapshot of the device. Figure 9a–h are pictures of the action of the arc-extinguishing device collected by the high-speed camera at various times. As shown in Figure 9a–d, the arc was generated (Figure 9a), the arc-quenching gas pill was triggered by the arc, and the airflow response time was extremely fast; essentially synchronized with the arcing time. Then, high-energy compression waves moved along the axial direction of the arc-quenching chamber, and a jet was formed at the outlet of the arc chamber, as in the simulation diagram. Figure 9e–h depicts the complete process of arc energy attenuation. As shown in Figure 9e, the arc started to appear fractured, and the energy of the arc was greatly reduced by the action of the high-energy compressive waves until the arc was extinguished.
Table 2 shows the data from the insulation coordination test. The success rate of the EAAG was 100% when the gap distance was 0.89 m in wet conditions. When the gap distance was greater than 0.89 m, the side of the arc path could not be controlled onto the device side and could not guarantee a 100% success rate. During field operation, the device should be guaranteed to trigger 100% of the time, to effectively extinguish the arc.
Figure 10 shows the voltage–time curve of the device, which is based on the data in Table 3.

4.2. Power Frequency Resistance Voltage Test

The power frequency resistance voltage test was designed to test the external insulation’s ability to withstand the arc-quenching chamber voltage and to lay the foundation for future grid applications. The power frequency resistance voltage test circuit is shown in Figure 11. The power frequency test generator can generate the maximum voltage value and the energy value of 750 kV and 3000 J, respectively. C1 and C2 are H.V/L.V arm-capacitance, which were used to measure the power frequency voltage at both ends of the sample.
General data from the test environment and measurement data are shown in Table 4.
As shown in Table 4, the output voltage of the total power frequency resistance test system is 180.3 kV for 1 min, and the final test results indicate no gap flashover.

4.3. Combined Impulse and Power Frequency Test

To realistically simulate a lightning-triggered device arcing scenario, a combined impulse and power frequency test was performed. The test circuit consisted of an impulse power supply and a power frequency power supply. Figure 12 shows the power frequency continuous current interruption test circuit. As shown in Figure 12, DIVM is an impulse voltage measuring system, which is used to measure the voltage across the sample and the current flowing through the sample. The impulse voltage generator shown in the figure can produce a voltage value of up to 2400 kV and the power frequency test transformer can generate a power frequency voltage of up to 800 kV.
Figure 13 shows a diagram of the field installation of the test system. The gap distance between this sample and the high-voltage electrode was 0.84 m. The power frequency voltage was initially maintained at 102 kV. At the same time, the lightning impulse voltage was applied with a certain phase angle, thereby causing the discharge.
The arc current and voltage waveforms are shown in Figure 14a,b. As shown in Figure 14a, the arc-quenching time was 0.1 ms; only the initiating current component appears in the current waveform and no power frequency current component appears. Therefore, the arc is extinguished in the impulse arc-building stage, and no subsequent power frequency continuous current appears. Table 5 shows a comparison between test and simulation data. As shown in Table 5, there is a small error between this time and the arc-quenching time in the simulation results, which was caused by the incomplete agreement between the test environment and the simulation environment. The reason for this error is that the magnetic fluid model used in this article is simplified, and only the laminar flow model was taken into account, while the complex turbulence model was not taken into account. However, the error was still in an acceptable range, so the test results can verify the accuracy of the simulation model.

4.4. High-Current Arc-Quenching Test

To test the arc-extinguishing effect under the action of a high-amplitude power frequency arc, a high-current arc-extinguishing test was performed. The experimental circuit is shown in Figure 15. The circuit is the equivalent circuit schematic for the simulation of a single-phase ground fault of a three-phase conductor.
Table 6 shows the parameters of the power supply. As shown in Table 6, the capacity of the power supply is 800 MVA. The system can fully satisfy the 40 kA high-frequency power generation requirements.
The pre-test installation scheme is illustrated in Figure 16a, a clearer picture of the test sample is added to the realization of arc extinguishing, as shown in Figure 16b. The device is installed in phase B, and the lower electrode is installed in the ground phase.
The test procedure was as follows:
(1)
Pictures of the samples are taken before the test, and the preparations are completed. The circuit breaker shutdown operation is completed.
(2)
Power is started, and the short-circuit generator starts running. The opening operation of the circuit breaker is performed to generate a 40 KA short-circuit current.
(3)
The device is triggered to complete the arc-quenching process, and the test waveform is captured.
Figure 17 shows the current waveform of the short circuit. The waveform of the first row corresponds to the waveform of the short circuit Ib. As shown in Figure 17, the system detection device failed to capture the short-circuit waveform from the time the circuit breaker closed to the time the circuit breaker was opened. The sample successfully extinguished a power frequency arc with an amplitude of 40 KA. In the following time period, the arc showed no signs of reignition.

5. Real Operational Effects

Beihai is an area in Guangxi with a high level of thunderstorms, and the annual average thunderstorm days in several areas are more than 100 days. Among the outages on the power transmission lines of the Beihai electricity grid, lightning outages account for more than 85%, which seriously affects the safe operation of the power transmission lines. Therefore, EAAGs are installed on each tower of a line with a high number of lightning outage accidents to improve the reliability of power transmission.
An actual photograph of the installed 110 KV EAAGs is shown in Figure 18a. As shown in Figure 18a, the red circle represents the EAAGs. Figure 18b is a picture when the EAAGs are not installed. Additionally, Table 7 presents the parameters of the transmission lines. The higher the humidity in the outdoor environment or in the rainy season, the lower the insulation resistance to lightning; at the same time, the surface of the insulator easily conducts electricity, and the arc is susceptible to flashing on the surface of the insulator, which will result in a failure of the arc-extinguishing capability of the EAAG. Therefore, the insulator material should be a hydrophobic material. Meanwhile, the distance of the air gap in this article was chosen to simulate the actual situation in a high humidity environment, to ensure that the arc path is controlled on the device side.
Based on the parameter data given in Table 7, the lightning outage rate of the entire line after the EAAGs are installed can be calculated, which can verify the validity and reliability of the EAAG. The specific calculation steps are as follows:
(1) Calculation of the lightning outage rate of direct lightning strikes after EAAG installation:
Lightning resistance levels for a direct lightning strike I1:
I 1 = U 50 % R c h + L g t / 2.6 + h / 2.6
Lightning resistance levels during lightning shielding I2:
I 2 = U 50 % 100
P i = 1 1 + ( I i / a ) b ( i = 1 , 2 )
where Pi is the probability of the current magnitude being greater than or equal to Ii; I1 and I2 are the lightning resistance levels for a direct lightning strike and lightning shielding, respectively; a = 31; and b = 2.6.
n 1 = N η ( g P 1 + P 2 g P 2 )
where n1 is the lightning outage rate caused by a direct lightning strike; N is the number of lightning strikes; g is the lightning striking rate; and η is the probability of arc-quenching.
(2) Calculation of the lightning outage rate of induced lightning after EAAG installation:
A coordinate system was established, with the ground at a distance of 5 h from the conductor as the origin, the point and line of the first base tower and the connecting direction of the tower perpendicular to the first base tower and second base tower as the z-axis, and perpendicular to the z-axis direction as the y-axis. The ground near the conductor lightning falling area was divided into a number of small areas, in accordance with Δx (unit m) the adjacent minefield in a number of equal parts up to an infinite length.
The number of lightning strikes per year in this arbitrarily divided zone Ni:
N i = 0.01 γ · L · T d · x
where L is the length of the transmission lines; Td is thunderstorm days; γ is ground flash density.
In any small area, the minimum lightning current that can flash on the insulator:
I = U 50 % 25 h ( x i + 5 h )
Equation (32) is obtained by resolving Equations (28)–(31).
P ( x i ) = 1 1 + ( U 50 % ( x i + 5 h ) 25 × 31 h ) 2.6
The lightning outage rate on the line within this arbitrarily divided zone during one year:
n i = N i η P ( x i ) = 0.01 L · γ · T d · x · η 1 1 + ( U 50 % ( x i + 5 h ) 25 × 31 h ) 2.6
Then, the induced lightning trip rate on both sides of the line during one year is:
n 2 = 2 × 0.01 L · γ · T d · η 0 1 1 + ( U 50 % ( x + 5 h ) 25 a h ) 2.6 d x
where n2 is the lightning outage rate caused by an induced lightning strike.
n = n 1 + n 2
where n is the lightning outage rate of the transmission line.
Therefore, the lightning outage rate caused by a direct lightning strike can be solved by solving Equation (29), and the lightning outage rate caused by an induced lightning strike can be solved by solving Equation (34). Finally, after installation of the device, the total lightning outage rate can be calculated based on the above formula, which is shown in Table 8. As shown in Table 8, the lightning outage rate after EAAGS installation in 2020 showed a significant 84% reduction compared to pre-installation data in 2019. The lightning outage rate data calculated in the practical application showed that the EAAG can reduce the lightning outage rate to a certain extent and reduce the frequency of lightning accidents.

6. Conclusions

In this paper, a simulation and experiments of a 110 kV EAAG for transmission lines are described.
  • The simulation results show that the arc-quenching airflow is extremely rapid and the arc-extinguishing time is 0.08 ms under the detonation airflow, which is less than half the power frequency arc cycle.
  • The test results show that the device can completely extinguish an arc within half a cycle of the power frequency arc. The external insulation of the entire sample is not damaged by the power frequency arc with an amplitude of 40 kA, and the overall resistance to the power frequency arc is strong.
  • The simulation results and the test results also show that the high-energy compression wave is generated extremely quickly under the condition of arc triggering, creating a good environment for arc quenching.
  • In the combined impulse and power frequency test, as the detonation air generation time triggered by the arc was very fast, the arc-quenching time was 0.1 ms, the global arc was extinguished at the stage of construction of the impulse arc, and no power frequency continuous current appeared.
The benchmark table that summarizes a recent research work as compared to the current work is shown in Table 9. As seen in Table 9, future prototype products will be suitable for higher-voltage transmission lines, and the source of the arc-quenching gas will be studied in the direction of new materials. In the future, our research group will conduct in-depth research into detonation airflow arc-extinguishing devices of different voltage levels.

Author Contributions

Conceptualization, D.W. and J.-f.W.; methodology, D.W.; software, D.W.; validation, D.W. and J.-f.W.; formal analysis, D.W.; investigation, D.W.; resources, D.W. and J.-f.W.; data curation, D.W.; writing—original draft preparation, D.W.; writing—review and editing, D.W.; visualization, D.W.; supervision, D.W.; project administration, D.W.; funding acquisition, J.-f.W. All authors have read and agreed to the published version of the manuscript.

Funding

This work was supported by National Natural Science Foundation of China (50867002), Doctoral Research Initiation Fund of Guilin University of Technology (GUTQDJJ2018068) and 2020 Guangxi University Middle-aged and Young Teachers’ Basic Research Ability Improvement Project (2020KY06024).

Acknowledgments

This research was supported by the National Natural Science Foundation of China (51467002), Doctoral Research Initiation Fund of Guilin University of Technology (GUTQDJJ2018068) and 2020 Guangxi University Middle-aged and Young Teachers’ Basic Research Ability Improvement Project (2020KY06024). The authors wish to thank the staff of the high-voltage laboratory at Guangxi University and MDPI.

Conflicts of Interest

The authors declare no conflict of interest.

Nomenclature

The following nomenclature is used in this manuscript:
SymbolsDefinitionUnit
DPropagation speed of detonation wavem/s
v0, vjVelocity of the primitive explosive and the product formed after the detonationm/s
ρ0, ρjDensity of the primitive explosive and the product formed after the detonationkg/m3
p0, pjPressure of the primitive explosive and the product formed after the detonationPa
U0, UjTotal internal energy of the primitive explosive and the product formed after the detonationJ/kg
μjvelocity of particulates.m/s
k0, kjInitial adiabatic index and actual adiabatic index/
qvconstant volumetric heat of the reaction.J
NgMoles of detonation products per gram of explosive.g/mol
WMass fraction of explosives converted into gas products.g
α, β, k, θ, G, C0, d, φ, λ, a, bConstant./
PDensity of the airflow.kg/m3
PlAxial pressure of the arc.Pa
UFlow rate of the arc.m/s
JCurrent density.A/m2
BMagnetic induction strength.T
UmaxMaximum flow velocity of the arc column jet.m/s
u, v, wVelocity components in the x, y, and z directions of the airflow.m/s
Fx, Fy, FzComponents of the Lorentz force in the x, y, and z directions.N/m3
τxx, τyx, τzx, τxy, τyy, τzy, τxz, τyz, τzzStress in each direction.N/m2
SEnthalpy.J
QJoule heating.J
SRHeat radiation term.J
T, T0Temperature of the arc and ambient temperature.K
RGas constant./
σArc conductivity.S/m
EElectric field strength.N/C
µ0Vacuum permeability./
CDischarge capacitance.μF
Rf, RtWavefront resistance and half wave peak resistance.Ω
C1 and C2H.V/L.V arm-capacitance.F
LSpan.km
hConductor height.m
γGround flash density.times/km2⋅a
LgtInductance.μH
TdThunderstorm day.d
RchGrounding resistance.Ω
n1, n2, nLightning outage rate caused by a direct lightning strike, lightning outage rate caused by an induced lightning strike, lightning outage rate of the transmission line.times/100 km⋅a
g, ηLightning striking rate, probability of arc-quenching./
NiNumber of lightning strikes per year in this arbitrarily divided zone.times
I1, I2, ILightning resistance levels for a direct lightning strike, lightning resistance levels during lightning shielding, and the minimum lightning current that can flash on the insulator.kA
PiProbability of the current magnitude being greater than or equal to Ii./

References

  1. He, J.; Cai, H.; He, H.; Jia, L.; Liu, G.; Zhao, X.; Yang, R.; Chen, S.; Li, T. Review on Lightning Performance Estimation of EHV and UHV Overhead Transmission Lines in China Southern Power Grid. South. Power Syst. Technol. 2016, 10, 1–10+29. [Google Scholar]
  2. Chen, J.; Zhao, C.; Gu, S.; Xiang, N.; Wang, Y.; Li, M. Present Status and Development Trend of Lightning Detection and Protection Technology of Power Grid in China. High Volt. Eng. 2016, 42, 3361–3375. [Google Scholar]
  3. Yao, C.; Wu, H.; Mi, Y.; Ma, Y.; Shen, Y.; Wang, L. Finite difference time domain simulation of lightning transient electromagnetic fields on transmission lines. IEEE Trans. Dielectr. Electr. Insul. 2013, 20, 1239–1246. [Google Scholar]
  4. He, J.; Zeng, R.; Chen, S. Lightning Protection Study of Transmission Line, Part Ⅲ: Protection Measures. High Volt. Technol. 2009, 35, 2917–2923. [Google Scholar]
  5. Okabe, S.; Tsuboi, T.; Takami, J. Analysis of Aspects of Lightning Strokes to Large-sized Transmission Lines. IEEE Trans. Dielectr. Electr. Insul. 2010, 18, 182–191. [Google Scholar] [CrossRef]
  6. Chen, W.; Gu, S.; He, J.; Yin, B. Development of Arc-Guided Protection Devices Against Lightning Breakage of Covered Conductors on Distribution Line. IEEE Trans. Power Deliv. 2010, 25, 196–205. [Google Scholar] [CrossRef]
  7. Taniguchi, S.; Tsuboi, T.; Okabe, S.; Nagaraki, Y.; Takami, J.; Ota, H. Improved Method of Calculating Lightning Stroke Rate to Large-sized Transmission Lines Based on an Electric geometry model. IEEE Trans. Dielectr. Electr. Insul. 2010, 17, 53–62. [Google Scholar] [CrossRef]
  8. Zeng, R.; Zhuang, C.; Zhou, X.; Chen, S. Survey of recent progress on lightning and lightning protection research. High Volt. 2016, 1, 2–10. [Google Scholar] [CrossRef]
  9. Wang, J.; Liu, J.; Guo, W.; Wu, G.; Liu, Q. Detonation Airflow Arc Extinguishing Method for Insulator Series and Parallel Protection Gaps. Power Syst. Technol. 2014, 38, 1358–1365. [Google Scholar]
  10. He, Y.; Fu, Z.; Jiang, A.; Wu, A.; Wang, G. Impact of distribution line insulated tower head and cross arms on lightning surges in 10 kV substations. In Proceedings of the 32th International Conference on Lightning protection, Shanghai, China, 11–18 November 2014; pp. 936–941. [Google Scholar]
  11. Chino, T.; Iwata, M.; Imoto, S.; Nakayama, M.; Sakamoto, H.; Matsushita, R. Development of Arcing Horn Device for Interrupting Ground-fault Current of 77kV Overhead Lines. IEEE Trans. Power Deliv. 2005, 20, 2570–2575. [Google Scholar] [CrossRef]
  12. Shariatinasab, R.; Safar, J.G.; Falaghi, H. Optimisation of arrester location in risk assessment in distribution network. IET Gener. Transm. Distrib. 2014, 8, 151–159. [Google Scholar] [CrossRef]
  13. Chen, H.; Peng, X.; Yu, Z. Research on impulse discharge characteristics of parallel gap. In Proceedings of the 7th Asia-Pacific International Conference on Lightning, Chengdu, China, 1–4 November 2011; pp. 1002–1006. [Google Scholar]
  14. He, Z.; Ge, D.; Zhang, C. Application investigation on parallel gap of composite insulators for 110kV transmission line in high intensity lightning area. In Proceedings of the 7th Asia-Pacific International Conference on Lightning, Chengdu, China, 1–4 November 2011; pp. 288–291. [Google Scholar]
  15. Gu, S.; He, J.; Zhang, B.; Xu, G.; Han, S. Movement simulation of long electric arc along the surface of insulator string in free air. IEEE Trans. Magn. 2006, 42, 1359–1362. [Google Scholar]
  16. Sima, W.; Jia, W.; Yuan, T.; Xu, H.; Yang, M. Magnetic fluid model of arc in multi-segment microporous structure and simulation of gas blowing arc extinguishing performance. High Volt. Technol. 2016, 42, 3376–3382. [Google Scholar]
  17. Rachidi, F. A Review of Field-to-Transmission Line Coupling Models with Special Emphasis to Lightning-Induced Voltages on Overhead Lines. IEEE Trans. Electromagn. Compat. 2012, 54, 898–911. [Google Scholar] [CrossRef]
  18. Wang, Q.; Li, X.; Chen, D.; Rong, M. Simulation of the Venting Configuration Effects on Arc Plasma Motion in Low-Voltage Circuit Breaker. IEEE Trans. Plasma Sci. 2010, 38, 2300–2305. [Google Scholar] [CrossRef]
  19. Schlitz, L.Z.; Garimella, S.V.; Chan, S.H. Gas dynamics and electromagnetic processes in high-current arc plasmas. Part I: Model formulation and steady-state solutions. J. Appl. Phys. 1999, 85, 2540–2546. [Google Scholar] [CrossRef]
  20. Wu, X.; Li, Z.-B.; Tian, Y.; Mao, W.; Xie, X. Investigate on the Simulation of Black-box Arc Model. In Proceedings of the 1st International Conference on Electric Power Equipment-Switching Technology, Xi’an, China, 23–27 October 2011; pp. 629–636. [Google Scholar]
  21. Podporkin, G.V.; Pilshikov, V.E.; Sivaev, A.D. Development of long flashover arresters with multi-electrode system for lightning over-voltage and conductor-burn protection of 6 to 35 kV overheadlines. In Proceedings of the 28th International Conference on Lightning Protection, Kanazawa, Japan, 18–22 September 2006; pp. 980–984. [Google Scholar]
  22. Guo, T.; Zhou, W.; Su, Z.; Li, H.; Yu, J. A multigap Structure for Power Frequency Arc Quenching in 10-kV Systems. IEEE Trans. Plasma Sci. 2016, 44, 2622–2631. [Google Scholar] [CrossRef]
Figure 1. Structural schematic diagram of the device. (a) The schematic installation diagram of the device. (b) The structure of the arc-quenching chamber.
Energies 14 05126 g001
Figure 2. CJ detonation wave model.
Energies 14 05126 g002
Figure 3. Force analysis diagram of the pipe outlet.
Energies 14 05126 g003
Figure 4. Spatial modeling of each element in the simulation.
Energies 14 05126 g004
Figure 5. Distribution of Gaussian point positions in the arcing cylinder.
Energies 14 05126 g005
Figure 6. Pressure curves at each Gaussian point. (a) The pressure variation curve at each monitoring point, taking into consideration the influence of the arc; (b) The pressure variation curve at each monitoring point, without taking into consideration the influence of the arc.
Energies 14 05126 g006
Figure 7. Stress contours in explosion airflow arc quenching. (a) Stress contours at t = 0.029 ms. (b) Stress contours at t = 0.041 ms. (c) Stress contours at t = 0.057 ms. (d) Stress contours at t = 0.08 ms.
Energies 14 05126 g007aEnergies 14 05126 g007b
Figure 8. Lightning impulse discharge equivalent test circuit.
Energies 14 05126 g008
Figure 9. Action snapshot of the device. (a) Action snapshot at t = 12 µs, (b) Action snapshot at t = 17 µs, (c) Action snapshot at t = 22 µs, (d) Action snapshot at t = 27 µs, (e) Action snapshot at t = 32 µs, (f) Action snapshot at t = 37 µs, (g) Action snapshot at t = 42 µs, (h) Action snapshot at t = 50 µs.
Energies 14 05126 g009
Figure 10. Voltage–time curve of the device.
Energies 14 05126 g010
Figure 11. Power frequency resistance voltage test. TT: testing transformer; G: generator; Rp: protection resistance; TO: test object; C1/C2: H.V/L.V arm-capacitance; R: damping resistance; PVMS: power frequency voltage measuring system.
Energies 14 05126 g011
Figure 12. Power frequency continuous current interruption test circuit. CT: current transformer; S1: protection gap; MOA: arrester; L: inductance; DIVM: measuring system.
Energies 14 05126 g012
Figure 13. Diagram of the field installation of the test system.
Energies 14 05126 g013
Figure 14. Arc current and voltage waveforms. (a) Arc current waveform, (b) Arc voltage waveform.
Energies 14 05126 g014
Figure 15. Experimental circuit.
Energies 14 05126 g015
Figure 16. Test installation diagram before the test. (a) Pre-test installation scheme. (b). A clearer picture of the test sample.
Energies 14 05126 g016
Figure 17. Current waveform of the short circuit.
Energies 14 05126 g017
Figure 18. EAALPGs operating on 110 kV transmission lines. (a) An actual photograph of the installed 110 kV EAAGs. (b) A picture when the EAAGs are not installed.
Energies 14 05126 g018
Table 1. Parameters of the impulse voltage generator.
Rated
Voltage
Rated CapacityCRfRtRatio (C2/C1)Wave Front Time/Half-Peak Time
3000 kV675 kJ0.15 μF400 Ω1440 Ω1658:11.2/50 μs
Table 2. Data from the insulation coordination test.
Gap DistanceNumber of DischargesSuccess Rate of the EAAG
0.89 m1000 times100%
1 m1000 times80%
1.1 m1000 times20%
Table 3. Data of the volt-second characteristics test (T = 29.9 °C, P = 95.6 kPa, RH = 46%).
Test SequenceBreakdown VoltageBreakdown Time
1898 kV2.51 μs
2813.8 kV3.01 μs
3759.6 kV3.54 μs
4689.1 kV3.92 μs
5659.3 kV5.00 μs
6592.9 kV5.86 μs
7571.0 kV7.46 μs
8553.8 kV8.18 μs
9548.4 kV9.09 μs
Table 4. Data of the power frequency resistance voltage test.
Test Environment Gap
Distance
Measured VoltagePressurization TimeTest Results
P = 95.6 kPa, T = 29.9 °C,
RH = 46%
0.89 m180.3 kV1 minNot flashed
Table 5. Comparative table of test data and simulation data.
Extinguishing Time in the SimulationExtinguishing Time in the TestError
0.08 ms0.1 ms0.02 ms
Table 6. Parameters of the power supply.
CapacityFrequencyVoltageCurrentImpedancePower Factor
800 MVA50 Hz20 kV40 kA0.5 Ω<0.15
Table 7. Parameters of the transmission lines.
Span (L)InsulatorConductor Height (h)Ground Flash Density (γ)
46.62 kmLXY1-7025 m0.05 times/km2·a
U50%Inductance (Lgt)Thunderstorm Day (Td)Grounding Resistance (Rch)
729.6 kV16.4 μH120 d10 Ω
Table 8. Lightning outage rate of the transmission line.
YearInstallationLightning Trip-Out Rate (n)
2019Before4.9 times/100 km⋅a
2020After0.08 times/100 km⋅a
Table 9. Benchmark table to summarize a recent research work as compared to the current work.
Research WorkVoltage LevelExtinguishing Medium
Recent research work110 kVFixed component gas
Current research work500 kVNew mixed gas
Publisher’s Note: MDPI stays neutral with regard to jurisdictional claims in published maps and institutional affiliations.

