
An Experimental Study of the Possibility of In Situ Hydrogen Generation within Gas Reservoirs

 ,
, 
 ,
,  ,
,
Abstract
:1. Introduction
2. Materials and Methods
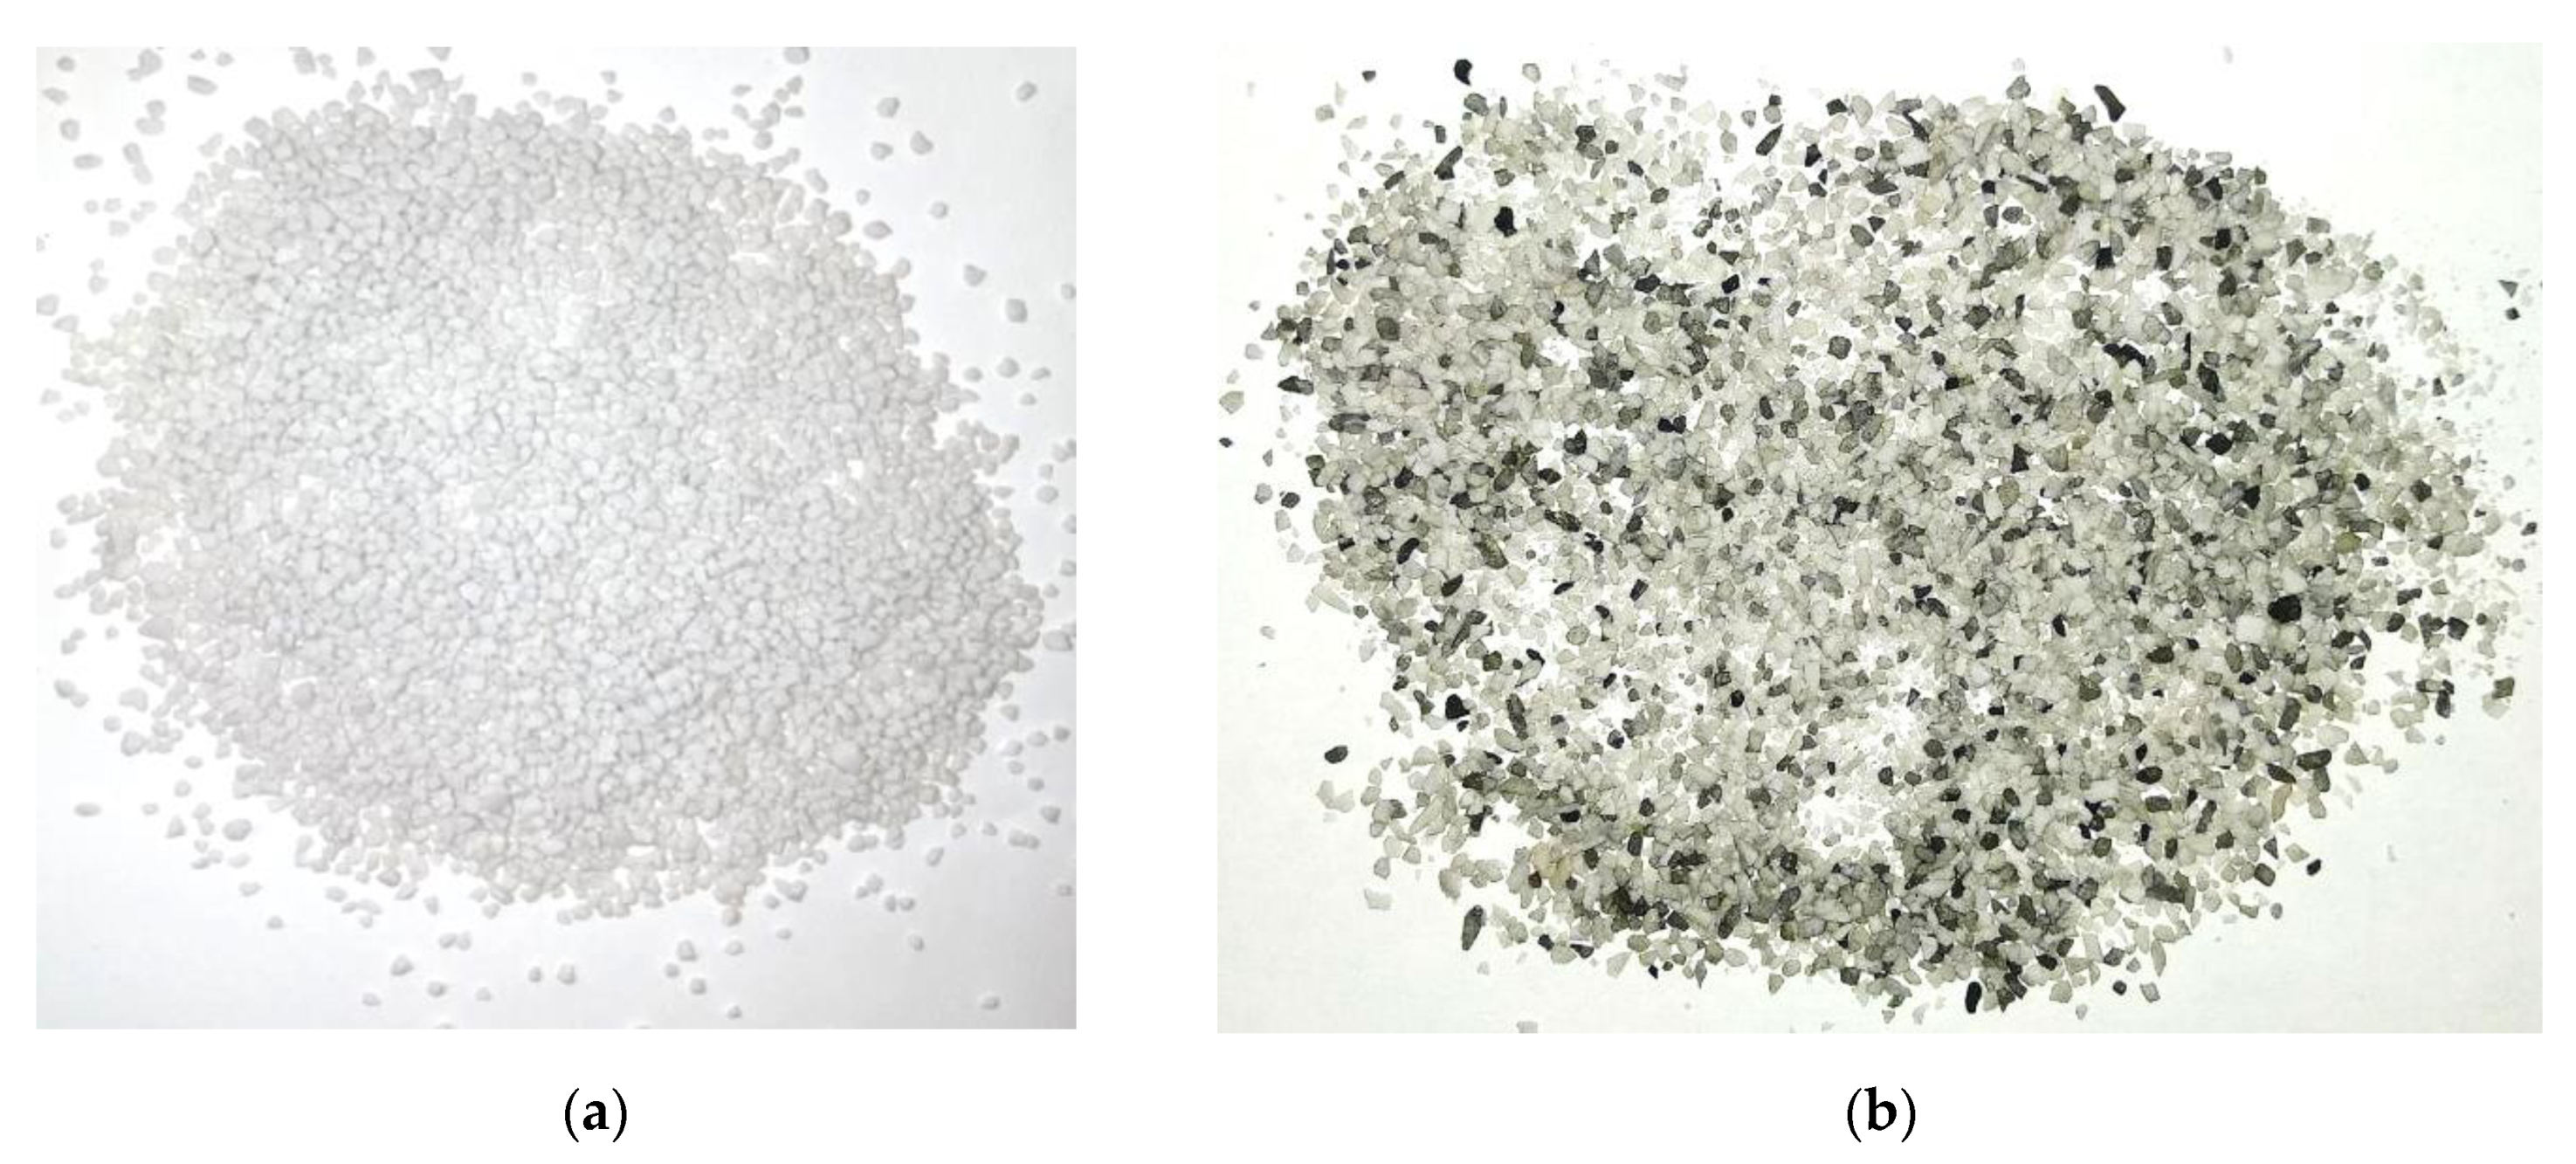
2.1. Porous Medium
2.2. Catalyst Preparation Procedure
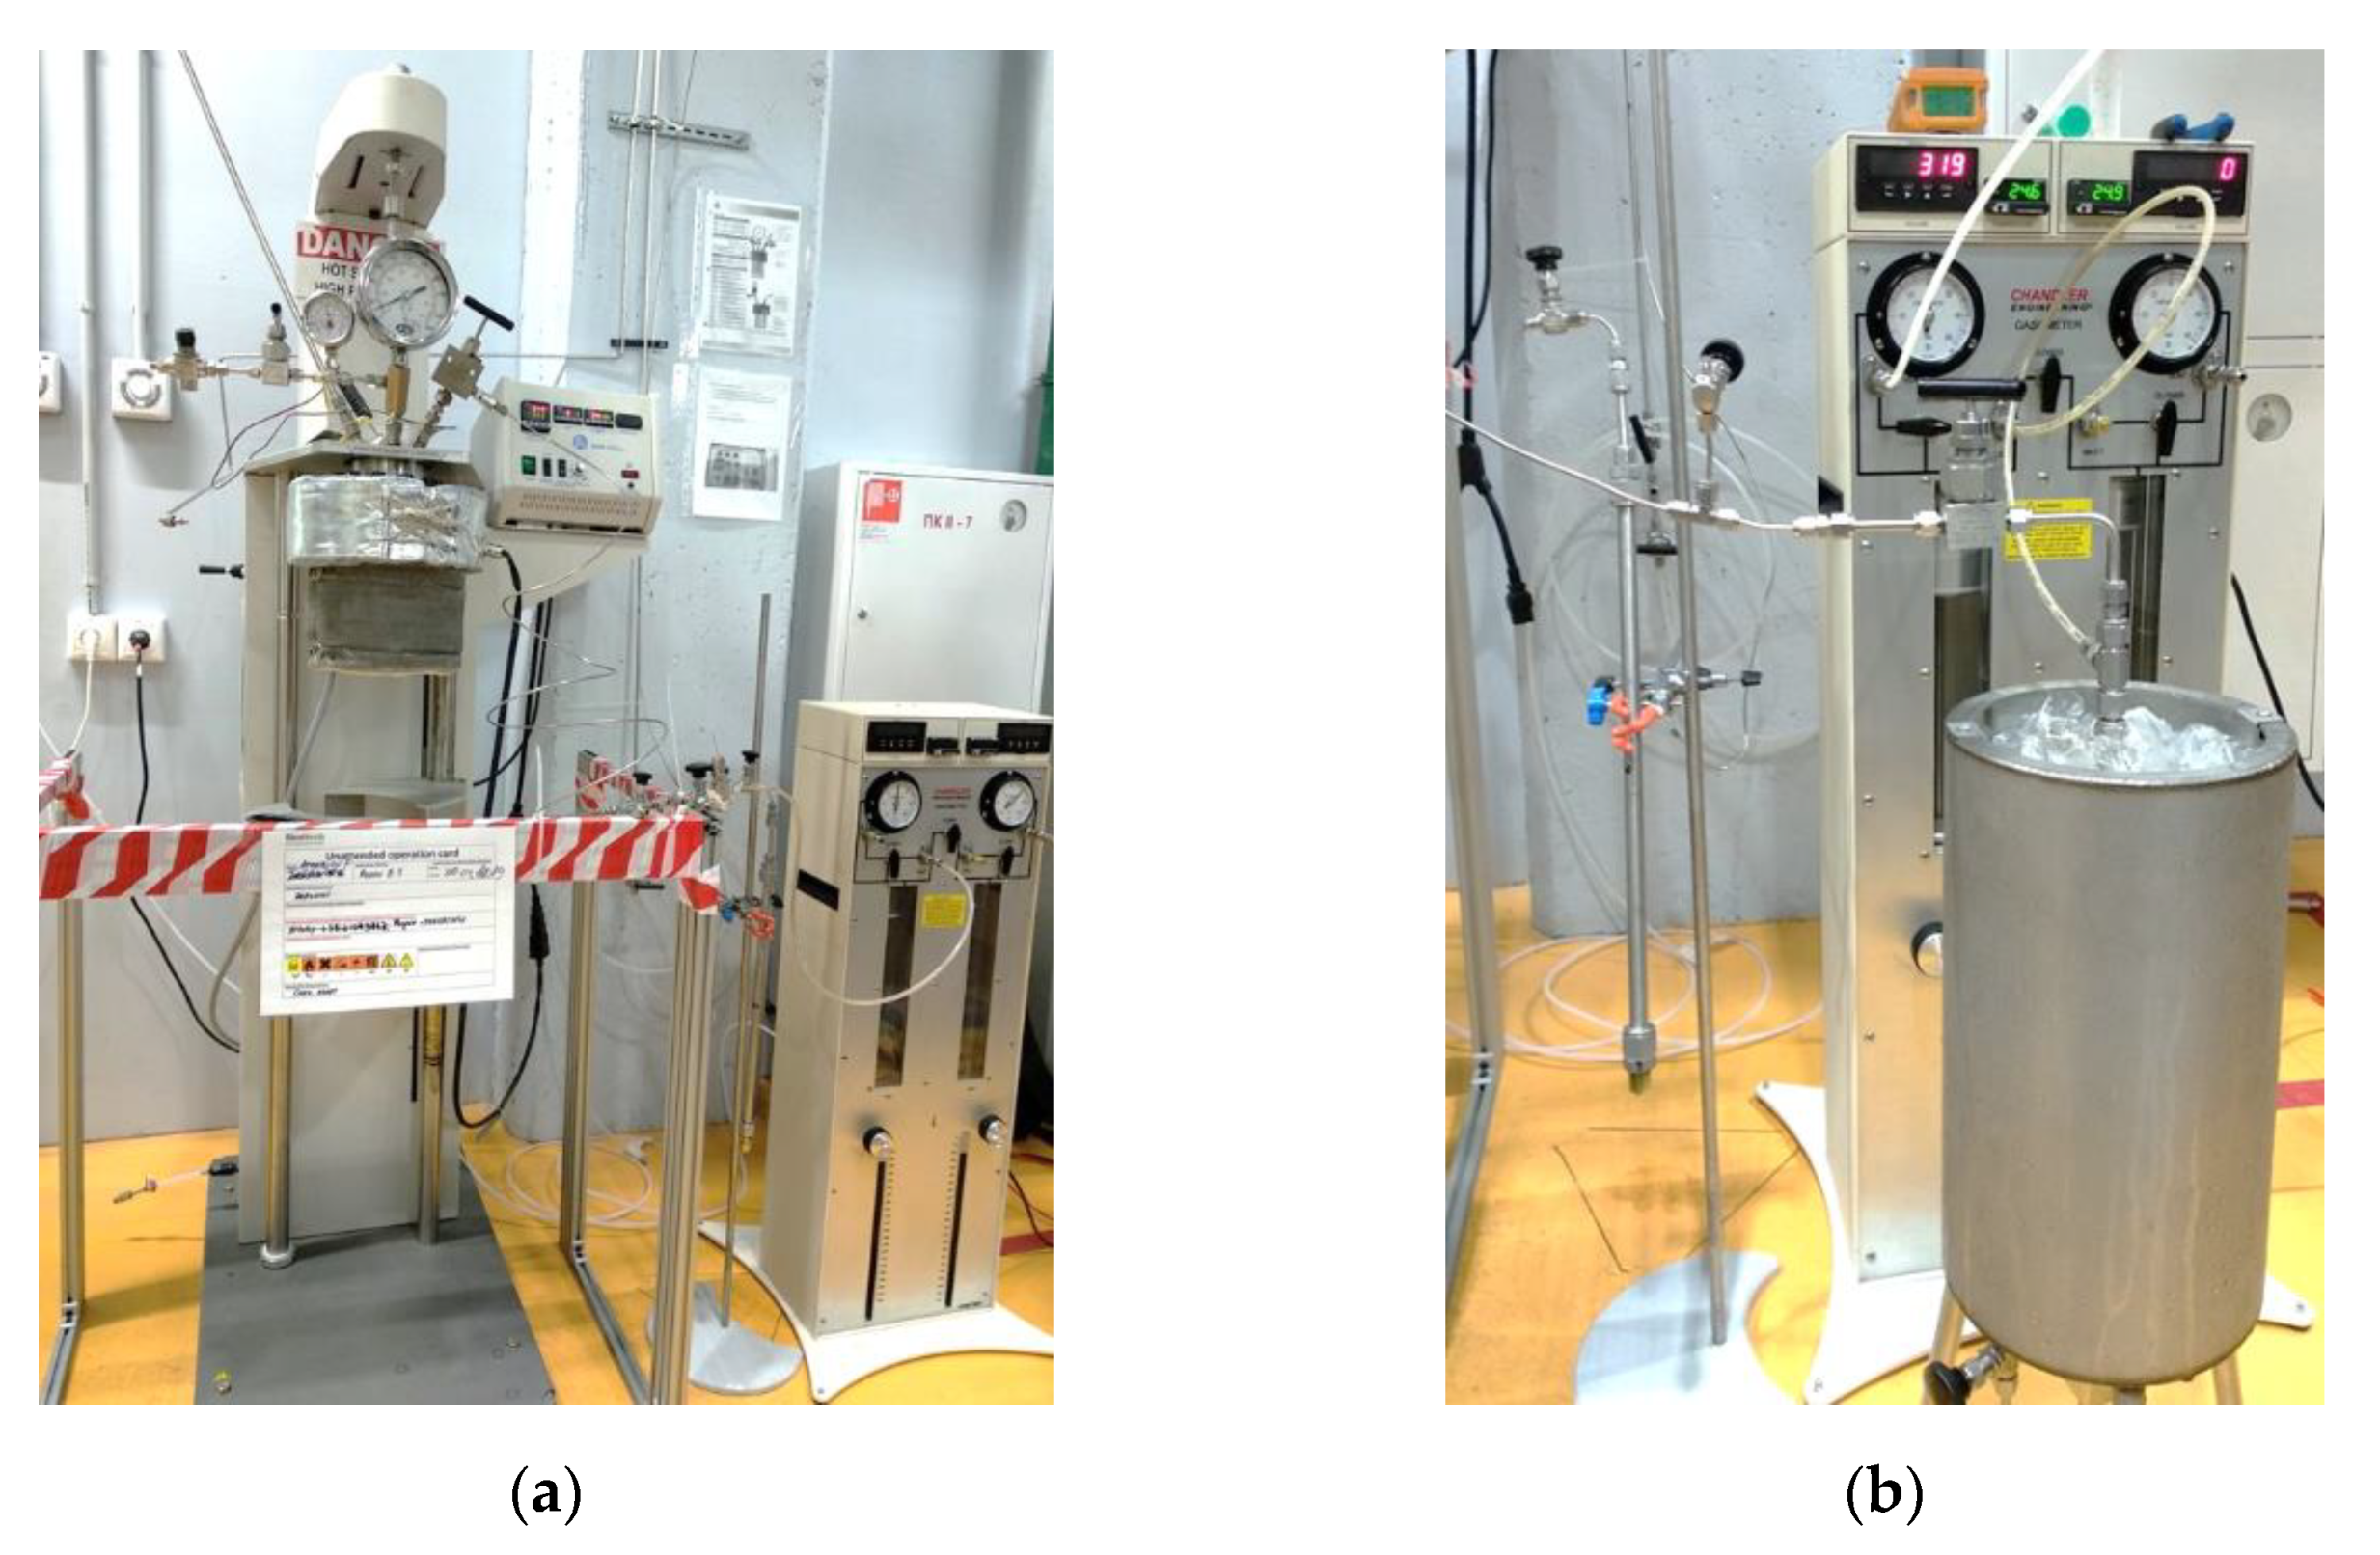
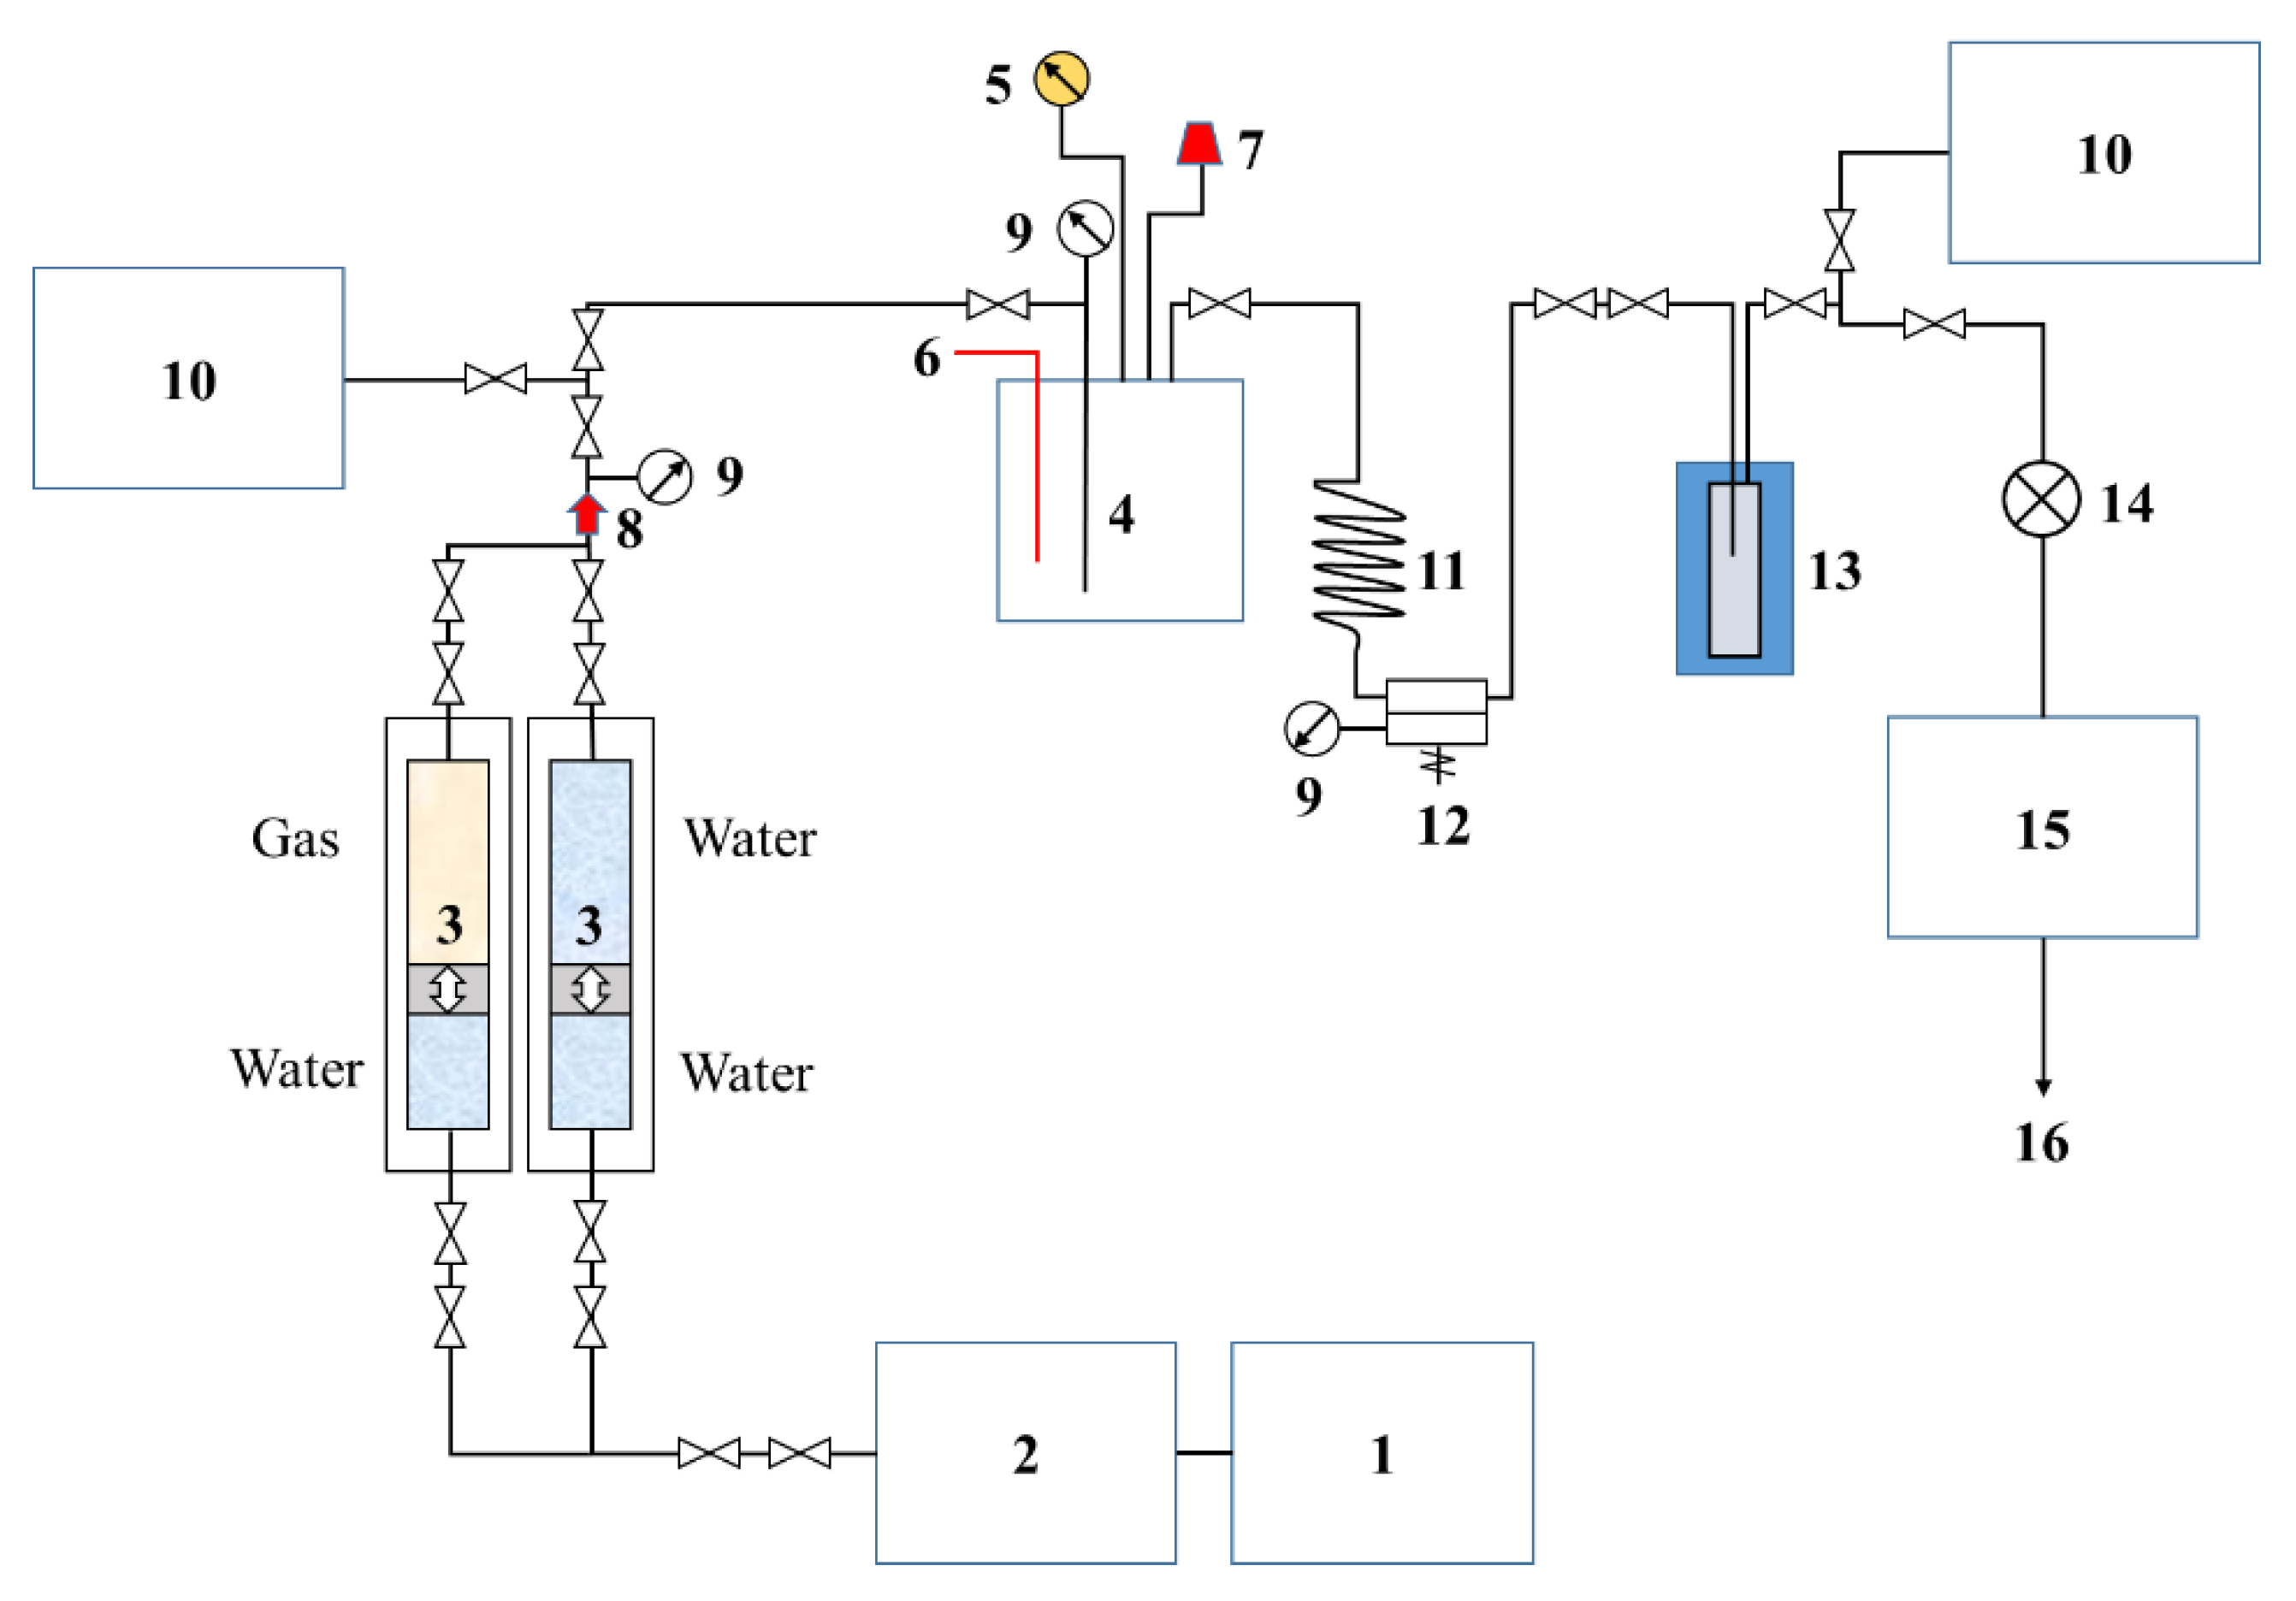
2.3. Experimental Setup
2.4. Experimental Procedure
3. Results
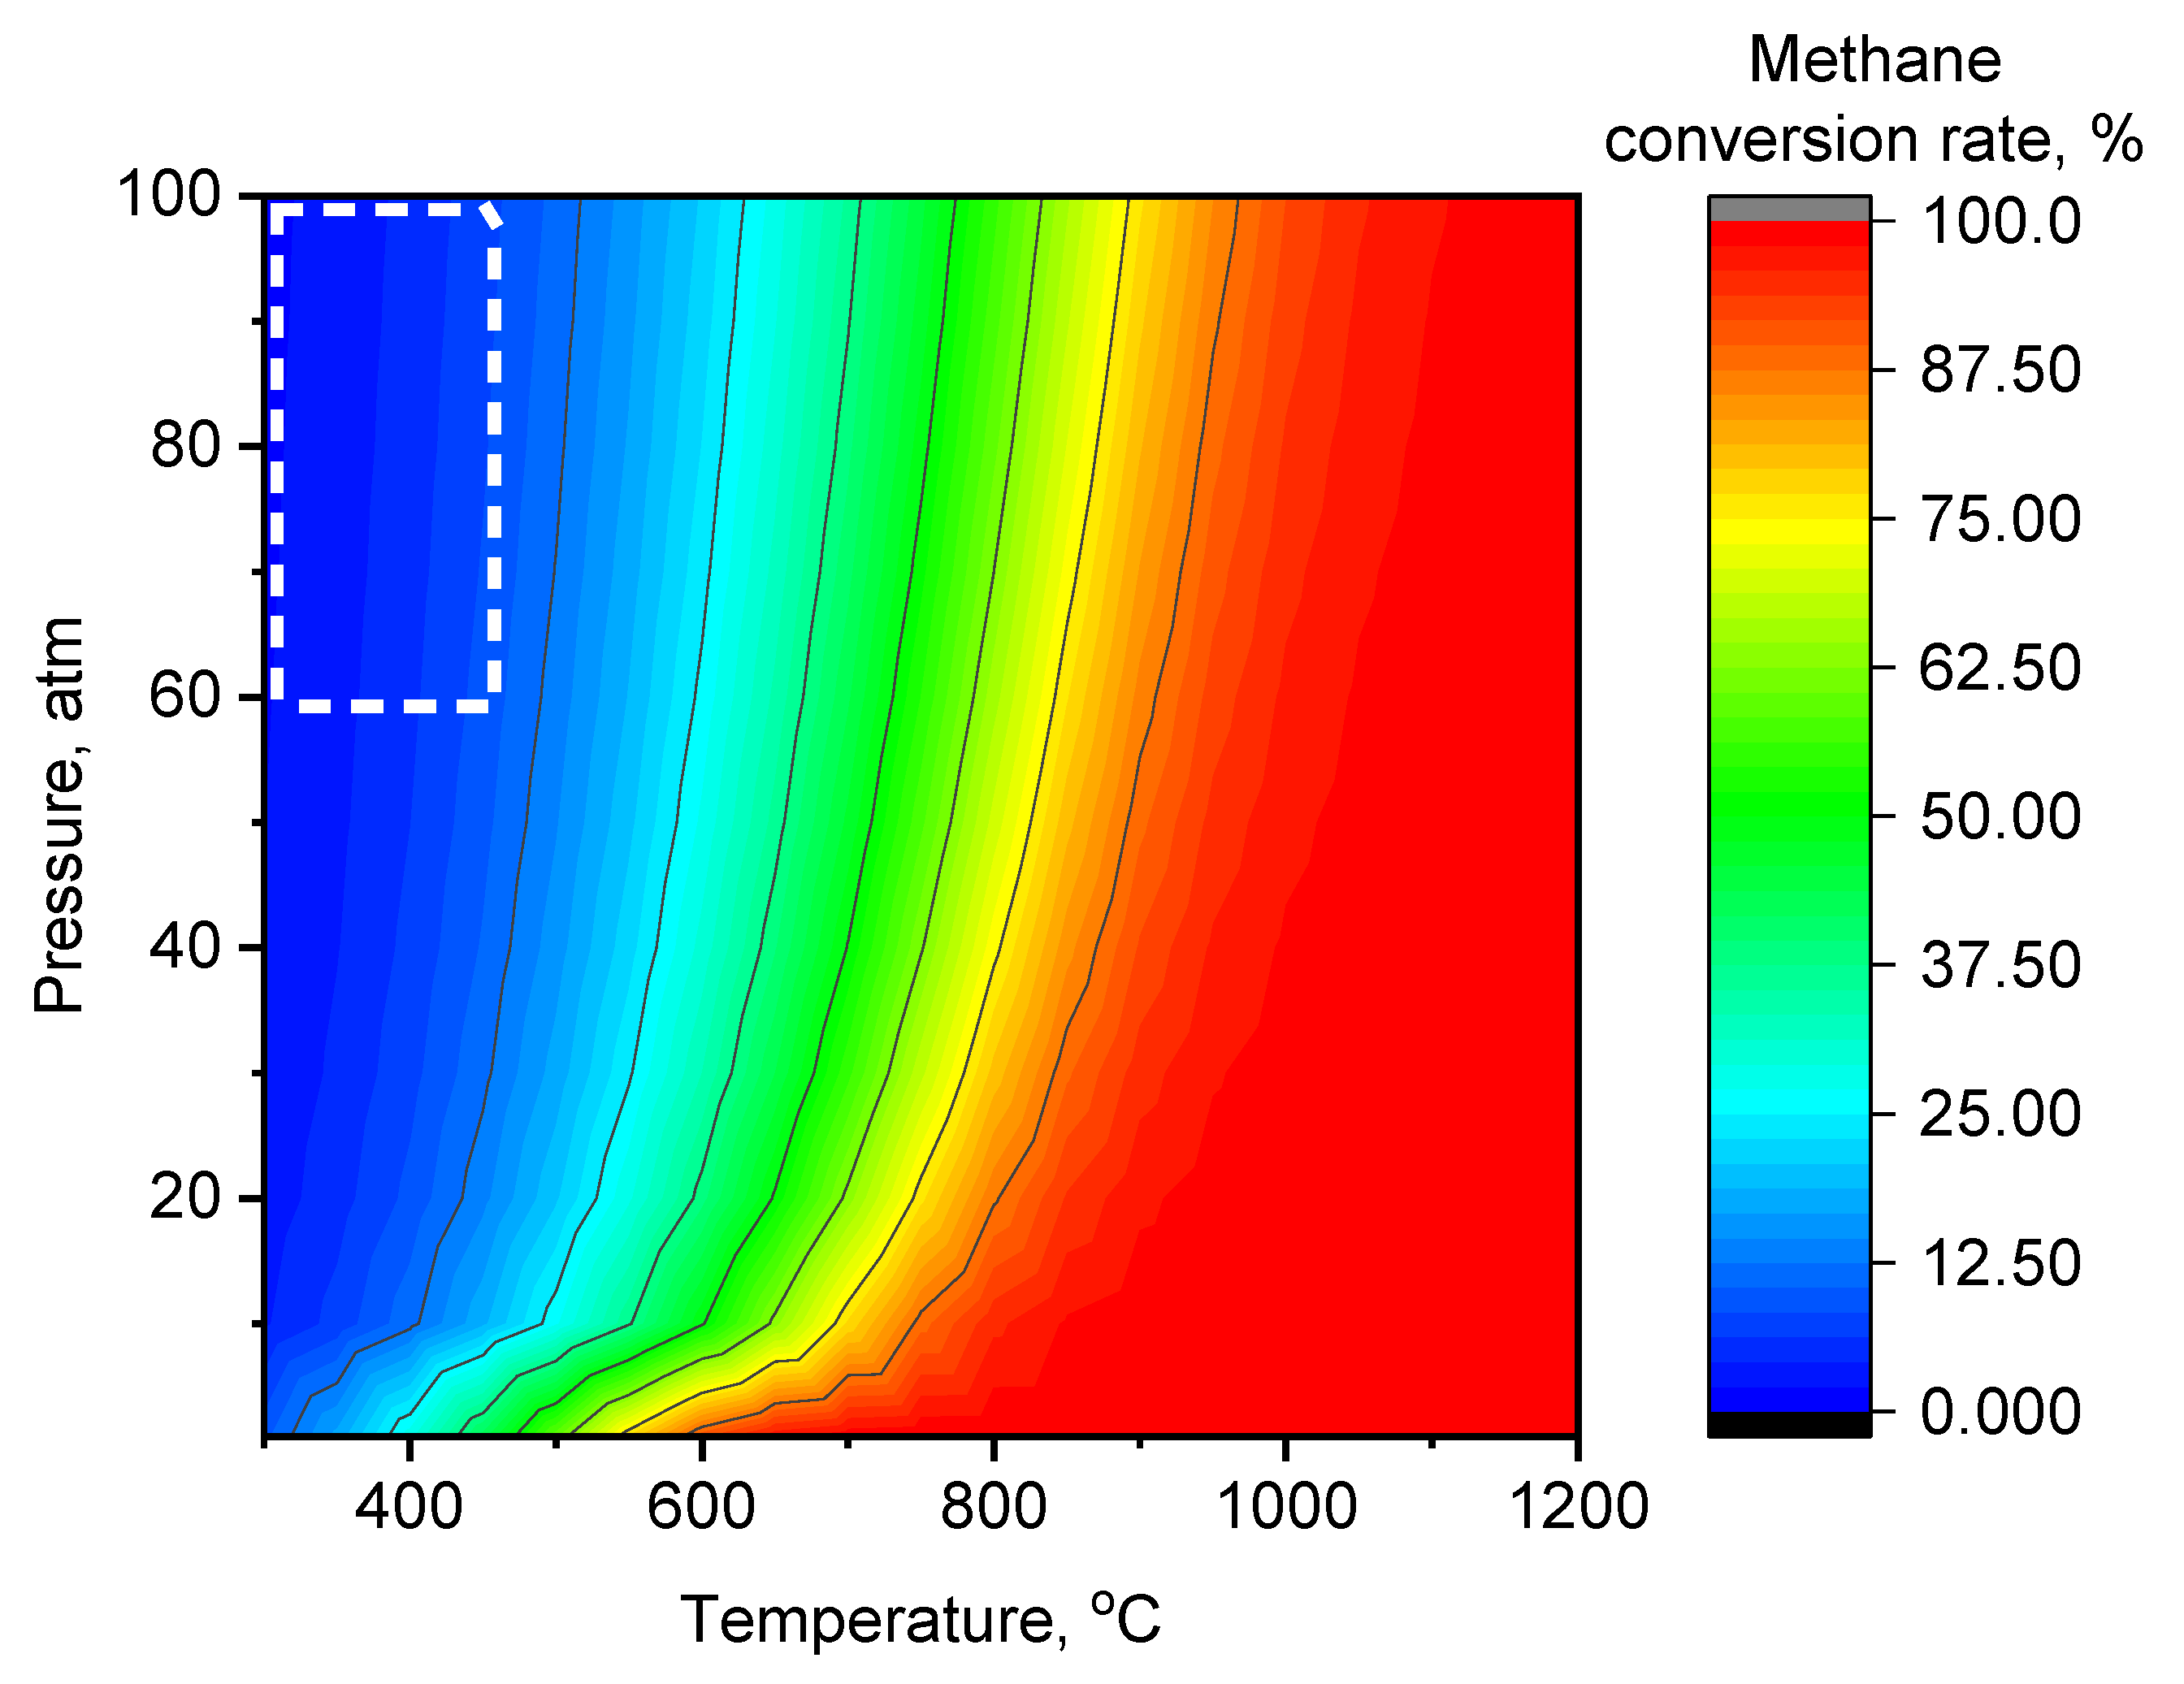
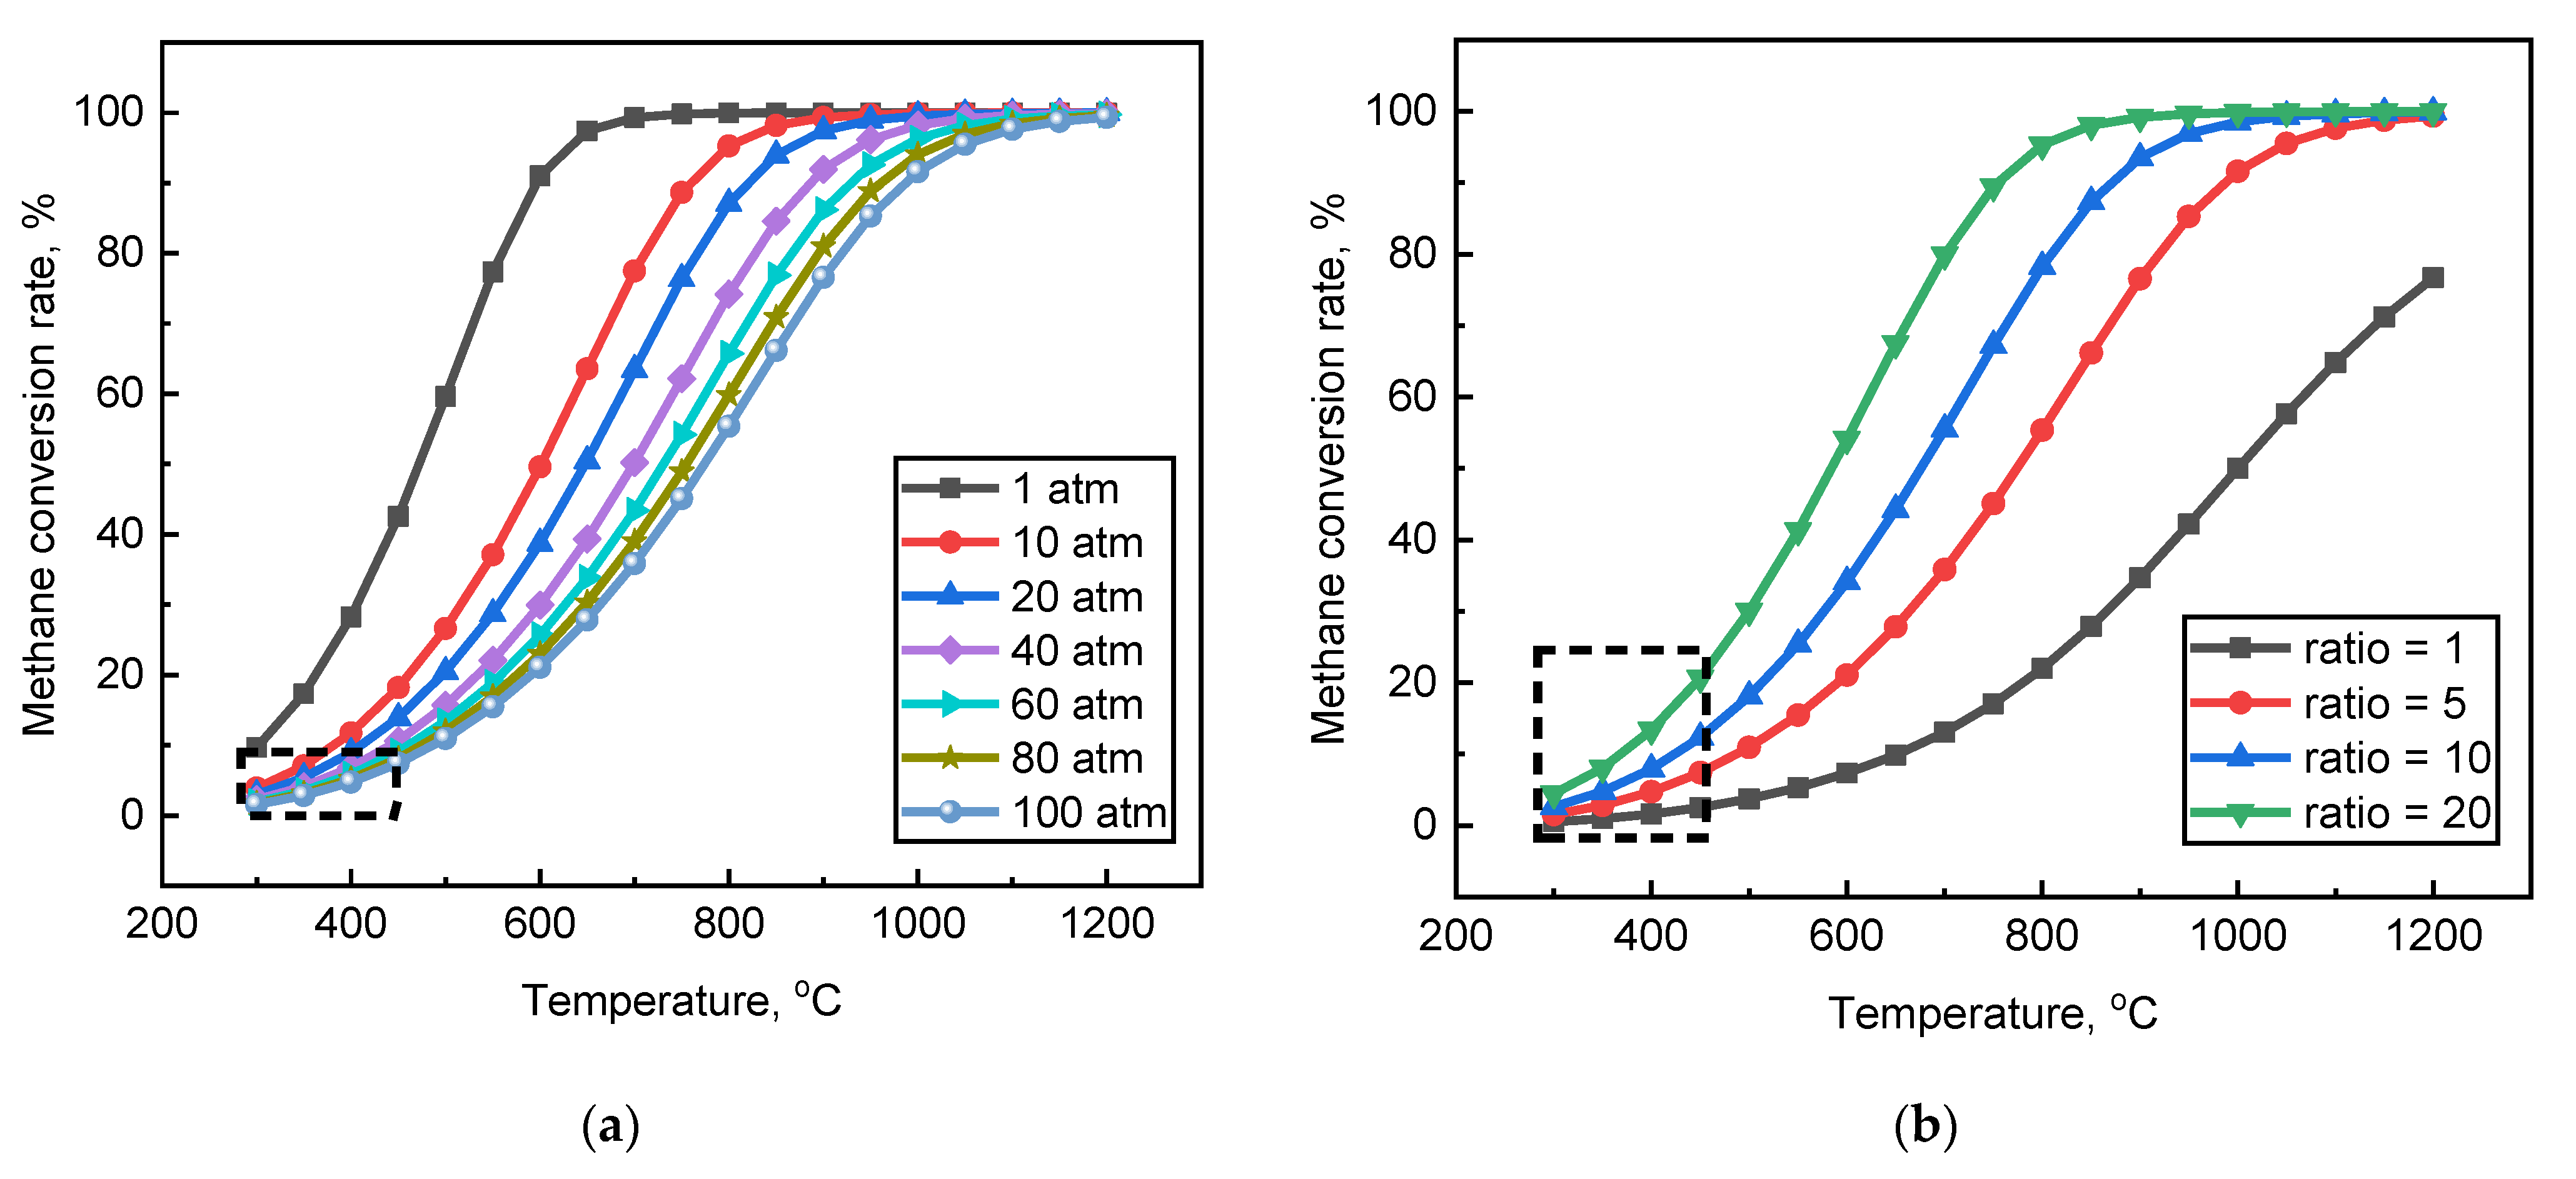
3.1. Determining of Thermodynamic Constraints
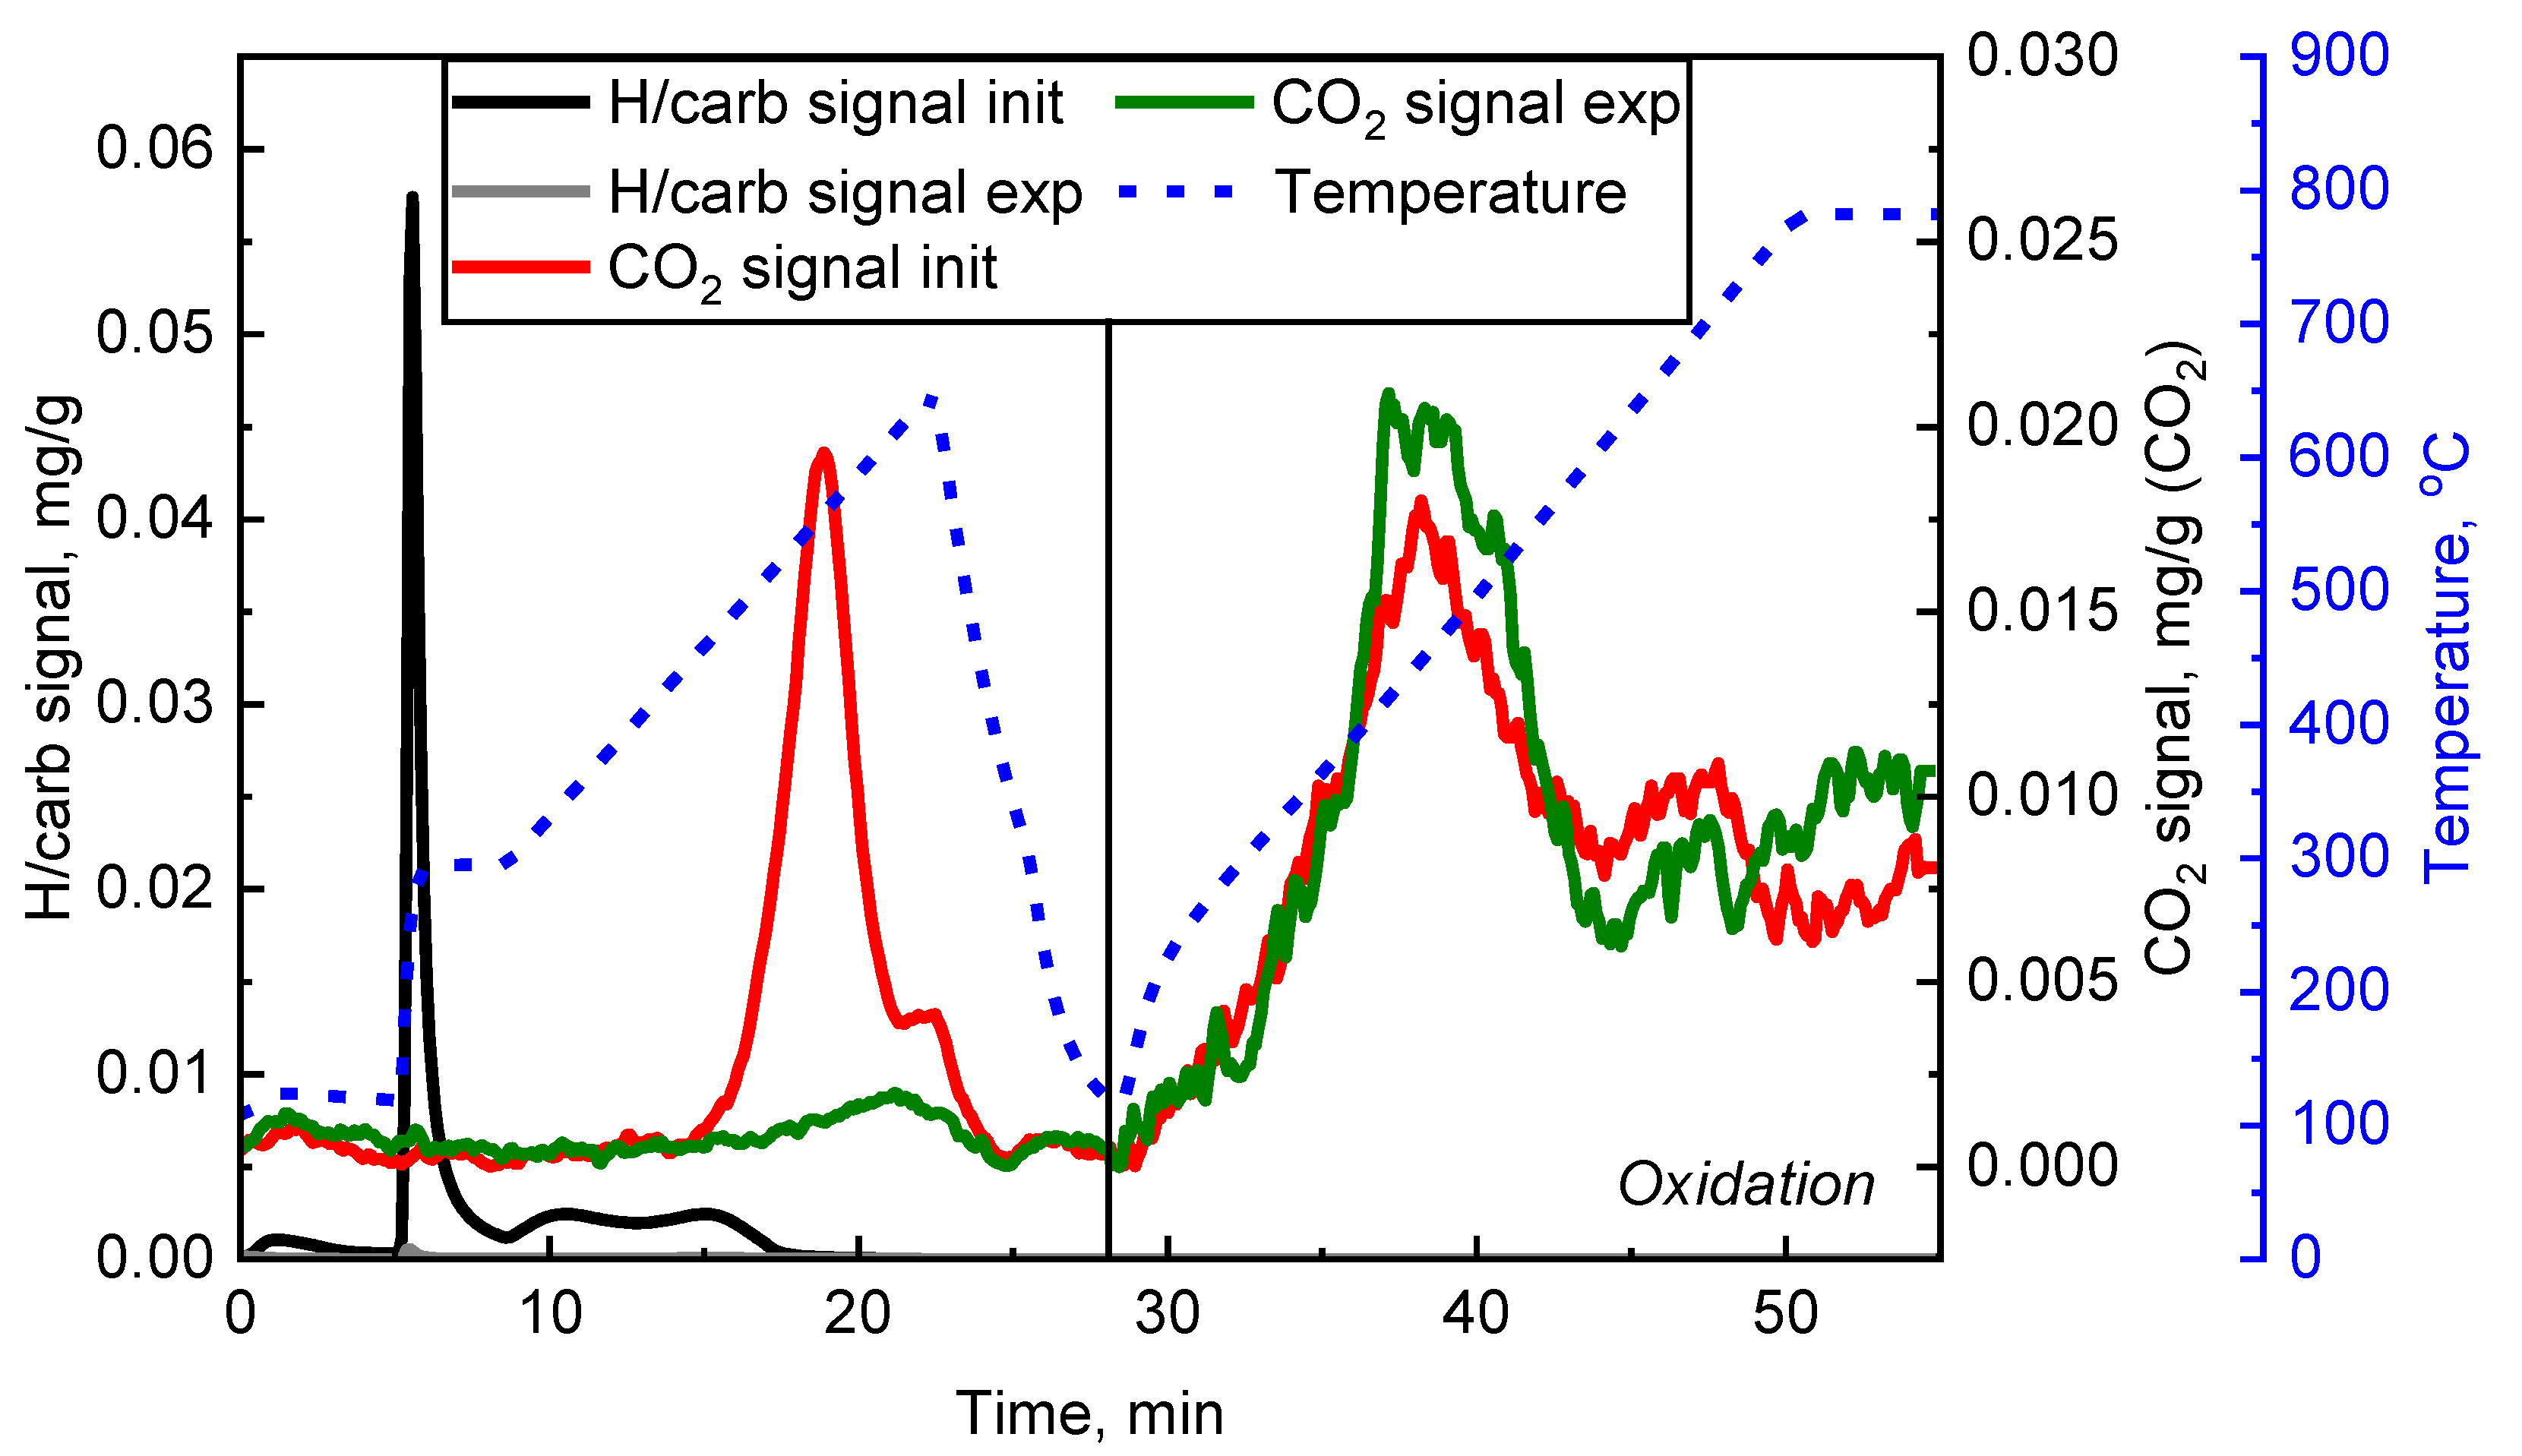
3.2. Experimental
4. Discussion
4.1. Applicability of Different Forms of Catalyst
4.2. Effect of Temperature on the CMC
4.3. Effect of a Packed Model on the CMC
4.4. Effect of Steam to Methane Ratio on the CMC
4.5. Difference between Hydrogen Concentration and Methane Conversion Rate
5. Conclusions
- The experimental results prove the activity of used Ni-based catalyst supported on Al2O3 substrate in the CMC. At the same time, the possibility of reducing the oxide phase of the catalyst with the formation of an active metal phase directly in the reactor during the experiment is confirmed;
- The temperature of 350 °C is insufficient for realizing the CMC in the presence of the considered catalyst and porous media. The process becomes possible at a temperature of 450 °C, with the achievement of methane conversion rates of the order of 4–6%;
- The packed model, which is a simulated reservoir rock, plays a key role in the process. It increases the catalytic surface area. It also includes transition metal atoms, which can promote the main catalytic effect. Thus, the highest hydrogen concentrations were detected in experiments with crushed ceramics and crushed core models. In turn, the absence of a porous media negatively affected the hydrogen yield;
- Based on the results of experiment No. 3, at a temperature of 450 °C, hydrogen generation from methane can occur both by the mechanism of the catalytic SMR and by the mechanism of catalytic methane cracking;
- An ex situ prepared catalyst in an amount of 0.3 wt.% successfully catalyzed the CMC. The catalyst remained active during the whole experiment, even in the presence of relatively high amounts of hydrogen sulfide in the reactor (8.91 mol.%. in experiment No. 6);
- The heat treatment of core material of the target gas field at the temperature of 450 °C leads to the decomposition of the mineral (carbonate) and organic matter with the release of additional amounts of carbon dioxide and light hydrocarbons, respectively;
- An increase in the steam/methane ratio leads to a shift in the thermodynamic equilibrium of the component system towards the products and, consequently, to an increase in the amount and concentration of synthesized hydrogen. In this case, an increase in the steam/methane ratio above 10 is impractical.
Author Contributions
Funding
Acknowledgments
Conflicts of Interest
References
- Hydrogen Council. Hydrogen Scaling Up. United Nations. 2017. Available online: https://hydrogencouncil.com/wp-content/uploads/2017/11/Hydrogen-scaling-up-Hydrogen-Council.pdf (accessed on 13 November 2017).
- T-raissi, A. Hydrogen: Automotive fuel of the future. IEEE Power Energy Mag. 2004, 2, 40–45. [Google Scholar] [CrossRef]
- Balcombe, P.; Speirs, J.; Johnson, E.; Martin, J.; Brandon, N.; Hawkes, A. The carbon credentials of hydrogen gas networks and supply chains. Renew. Sustain. Energy Rev. 2018, 91, 1077–1088. [Google Scholar] [CrossRef]
- IEA. The future of Fuel: The Future of Hydrogen; France. 2019. Available online: https://iea.blob.core.windows.net/assets/9e3a3493-b9a6-4b7d-b499-7ca48e357561/The_Future_of_Hydrogen.pdf (accessed on 15 June 2019).
- IEAGHG. Techno-Economic Evaluation of SMR Based Standalone (Merchant) Hydrogen Plant with CCS. UK. 2017. Available online: https://ieaghg.org/exco_docs/2017-02.pdf (accessed on 15 February 2017).
- Hallam, R.J.; Hajdo, L.E.; Donnelly, J.K. Thermal Recovery of Bitumen at Wolf Lake. SPE Reserv. Eng. 1989, 4, 178–186. [Google Scholar] [CrossRef]
- Hajdo, L.E.; Hallam, R.J.; Vorndran, L.D.L. Hydrogen Generation During In-Situ Combustion. In Proceedings of the SPE 1985 California Regional Meeting, Bakersfield, CA, USA, 27–29 March 1985; pp. 675–689. [Google Scholar] [CrossRef]
- Kapadia, P.R.; Kallos, M.S.; Gates, I.D. A Comprehensive Kinetic Theory to Model Thermolysis, Aquathermolysis, Gasification, Combustion, and Oxidation of Athabasca Bitumen. In Proceedings of the SPE Improved Oil Recovery Symposium, Tulsa, OK, USA, 24–28 April 2010; pp. 1–31. [Google Scholar] [CrossRef]
- Kapadia, P.R.; Kallos, M.S.; Leskiw, C.; Gates, I.D. Potential for Hydrogen Generation during In situ Combustion of Bitumen. In Proceedings of the SPE EUROPEC/EAGE Annual Conference and Exhibition, Amsterdam, The Netherlands, 8–11 June 2009; pp. 1–14. [Google Scholar] [CrossRef]
- Kapadia, P.R.; Wang, J.J.; Kallos, M.S.; Gates, I.D. Practical process design for in situ gasification of bitumen. Appl. Energy 2013, 107, 281–296. [Google Scholar] [CrossRef]
- Self, S.J.; Reddy, B.V.; Rosen, M.A. Review of underground coal gasification technologies and carbon capture. Int. J. Energy Environ. Eng. 2012, 3, 1–8. [Google Scholar] [CrossRef] [Green Version]
- Cui, Y.; Liang, J.; Wang, Z.; Zhang, X.; Fan, C.; Wang, X.; Syngas, H.Á. Experimental forward and reverse in situ combustion gasification of lignite with production of hydrogen-rich syngas. Int. J. Coal Sci. Technol. 2014, 1, 70–80. [Google Scholar] [CrossRef] [Green Version]
- Scott, E. Production of Hydrogen from Underground Coal Gasification. Patent WO 2008/033268 Al, 7 October 2008. [Google Scholar]
- Surguchev, L.; Berenblym, R.; Dmitrievsky, A. Process for Generating Hydrogen. U.S. Patent 8763697 B2, 2014. [Google Scholar]
- Gates, I.; Davidson, S. In-Situ Process to Produce Hydrogen from Underground Hydrocarbon Reservoirs. Patent WO 2017/136924 Al, 2017. [Google Scholar]
- Surguchev, L.; Berenblyum, B. In-situ H2 generation from hydrocarbons and CO2 storage in the reservoir. In Proceedings of the Fourth EAGE CO2 Geological Storage Workshop, Stavanger, Norway, 22–24 April 2014. [Google Scholar]
- Zhang, Y.; Smith, K.J. Carbon formation thresholds and catalyst deactivation during CH4 decomposition on supported Co and Ni catalysts. Catal. Lett. 2004, 95, 7–12. [Google Scholar] [CrossRef]
- Amin, A.; Epling, W.; Croiset, E. Reaction and Deactivation Rates of Methane Catalytic Cracking over Nickel. Ind. Eng. Chem. Res. 2011, 50, 12460–12470. [Google Scholar] [CrossRef]
- Gazprom Export. Blue Fuel-Gazprom Export Global Newsletter. 48. 2018. Available online: http://www.gazpromexport.ru/files/BLUE_FUEL_48326.pdf (accessed on 18 December 2018).
- Zhang, J.; Chen, Z. Chapter 9: Formation Damage by Thermal Methods Applied to Heavy Oil Reservoirs. In Formation Damage during Improved Oil Recovery: Fundamentals and Applications; Yuan, B., Wood, A.D., Eds.; Elsevier Inc.: Amsterdam, The Netherlands, 2018; ISBN 9780128137833. [Google Scholar] [CrossRef]
- Ahmed, T.; Meehan, D.N. Chapter 6: Introduction to Enhanced Oil Recovery. In Advanced Reservoir Management and Engineering, 2nd ed.; Elsevier Inc.: Amsterdam, The Netherlands, 2012; pp. 541–585. ISBN 9780123855480. [Google Scholar] [CrossRef]
- Espitalie, J.; Bordenave, M.L. Rock-Eval pyrolysis. In Applied Petroleum Geochemistry; Technip: Paris, France, 1993; pp. 237–361. [Google Scholar]
- Espitalie, J.; Drouet, S.; Marquis, F. Petroleum evaluation by using the petroleum evaluation workstation (a Rock-Eval connected with computer). Geol. Oil Gas 1994, 1, 23–32. [Google Scholar]
- Amrollahi Biyouki, A.; Hosseinpour, N.; Bahramian, A.; Vatani, A. In-situ upgrading of reservoir oils by in-situ preparation of NiO nanoparticles in thermal enhanced oil recovery processes. Colloids Surfaces A Physicochem. Eng. Asp. 2017, 520, 289–300. [Google Scholar] [CrossRef] [Green Version]
- Brockner, W.; Ehrhardt, C.; Gjikaj, M. Thermal decomposition of nickel nitrate hexahydrate, Ni(NO3)2·6H2O, in comparison to Co(NO3)2·6H2O and Ca(NO3)2·4H2O. Thermochim. Acta 2007, 456, 64–68. [Google Scholar] [CrossRef]
- Małecka, B.; Łącz, A.; Drozdz, E.; Małecki, A. Thermal decomposition of d-metal nitrates supported on alumina. J. Therm. Anal. Calorim. 2015, 119, 1053–1061. [Google Scholar] [CrossRef] [Green Version]
- Rashidi, H.; Ebrahim, H.A.; Dabir, B. Reduction kinetics of nickel oxide by methane as reducing agent based on thermogravimetry. Thermochim. Acta 2013, 561, 41–48. [Google Scholar] [CrossRef]
- Kharatyan, S.L.; Chatilyan, H.A.; Manukyan, K.V. Kinetics and Mechanism of Nickel Oxide Reduction by Methane. J. Phys. Chem. C 2019, 123, 21513–21521. [Google Scholar] [CrossRef]
- Rodriguez, J.A.; Hanson, J.C.; Frenkel, A.I.; Kim, J.Y.; Pérez, M. Experimental and theoretical studies on the reaction of H2 with NiO: Role of O vacancies and mechanism for oxide reduction. J. Am. Chem. Soc. 2002, 124, 346–354. [Google Scholar] [CrossRef] [PubMed]
- Jeangros, Q.; Hansen, T.W.; Wagner, J.B.; Damsgaard, C.D.; Dunin-Borkowski, R.E.; Hébert, C.; Van Herle, J.; Hessler-Wyser, A. Reduction of nickel oxide particles by hydrogen studied in an environmental TEM. J. Mater. Sci. 2013, 48, 2893–2907. [Google Scholar] [CrossRef] [Green Version]
- Hou, K.; Hughes, R. The kinetics of methane steam reforming over a Ni/α-Al2O catalyst. Chem. Eng. J. 2001, 82, 311–328. [Google Scholar] [CrossRef]
- Xu, J.; Froment, G.F. Methane Steam Reforming, Methanation and Water-Gas Shift: 1. Intrinsic Kinetics. AIChE J. 1989, 35, 88–96. [Google Scholar] [CrossRef]
- Glushko, V.P.; Gurvich, L.V.; Weitz, I.V.; Medvedev, V.A.; Hachkuruzov, G.A.; Jungmann, V.S.; Bergman, G.F.; Baibuz, V.F.; Iorish, V.S. Thermodynamic Properties of Substances in 6 Volumes; Nauka: Moscow, Russia, 1979. [Google Scholar]
- Zhavoronkov, N.M.; Kisil, I.M.; Olevskiy, V.M.; Kharlamov, V.V. Nitrogenman’s Handbook, 2nd ed.; Khimia: Moscow, Russia, 1986. [Google Scholar]
- Matsumura, Y.; Nakamori, T. Steam reforming of methane over nickel catalysts at low reaction temperature. Appl. Catal. A Gen. 2004, 258, 107–114. [Google Scholar] [CrossRef]
- Kho, E.T.; Scott, J.; Amal, R. Ni/TiO2 for low temperature steam reforming of methane. Chem. Eng. Sci. 2016, 140, 161–170. [Google Scholar] [CrossRef]
- Dan, M.; Mihet, M.; Biris, A.R.; Marginean, P.; Almasan, V.; Borodi, G.; Watanabe, F.; Biris, A.S.; Lazar, M.D. Supported nickel catalysts for low temperature methane steam reforming: Comparison between metal additives and support modification. React. Kinet. Mech. Catal. 2012, 105, 173–193. [Google Scholar] [CrossRef]
- Lai, G.H.; Lak, J.H.; Tsai, D.H. Hydrogen Production via Low-Temperature Steam-Methane Reforming Using Ni-CeO2-Al2O3 Hybrid Nanoparticle Clusters as Catalysts. ACS Appl. Energy Mater. 2019. [Google Scholar] [CrossRef]
- Khzouz, M.; Gkanas, E.I. Experimental and numerical study of low temperature methane steam reforming for hydrogen production. Catalysts 2018, 8, 5. [Google Scholar] [CrossRef] [Green Version]
- Rostrup-Nielsen, J.R. Sulfur poisoning. In Progress in Catalyst Deactivation. NATO Advanced Study Institutes Series; Figueiredo, J.L., Ed.; Martinus Nijhoff Publisher: Leiden, The Netherlands, 1982; pp. 209–227. [Google Scholar] [CrossRef]
- Luo, Y.H.; Zhu, D.Q.; Pan, J.; Zhou, X.L. Thermal decomposition behaviour and kinetics of Xinjiang siderite ore. Trans. Inst. Min. Metall. Sect. C Miner. Process. Extr. Metall. 2016, 125, 17–25. [Google Scholar] [CrossRef]
- Warne, S.S.J.; French, D.H. The decomposition of anhydrous carbonate minerals in coal and oil shale ashes produced at temperatures of 400 and 575 C. Thermochim. Acta 1984, 75, 139–149. [Google Scholar] [CrossRef]
- Giammaria, G.; Lefferts, L. Catalytic effect of water on calcium carbonate decomposition. J. CO2 Util. 2019, 33, 341–356. [Google Scholar] [CrossRef]


| Mineral | Value, wt.% |
|---|---|
| Mullite | 68.1 |
| Quartz | 31.9 |
| Mineral | Value, wt.% |
|---|---|
| Albite | 12.4 |
| Anhydrite | 0.8 |
| Calcite | 10.3 |
| Halite | 4.1 |
| Illite | 1.2 |
| Pyrite | 0.1 |
| Quartz | 71.1 |
| Exp. No. | Water, mL | Methane, L | Catalyst, g | Porous Medium | T, °C |
|---|---|---|---|---|---|
| 1 | 30.0 | 18.5 | 34.5 1 | - | 350 |
| 2 | 29.3 | 7.3 | 1.0 1 | - | 350–450 |
| 3 | 20.1 | 2.5 | 5.9 | Ceramics | 450 |
| 4 | 20.0 | 2.5 | 4.5 1 | River sand | 450 |
| 5 | 33.3 | 2.5 | 37.5 | Alumina | 450 |
| 6 | 42.4 | 2.5 | 5.4 | Core | 300–450 |
| 7 | 88.7 | 7.4 | 7.2 | Core | 450 |
| Exp. No. | Max P, atm | Max Concentration of Main Product Gas Components, mol.%. | Other Gas Components | ||
|---|---|---|---|---|---|
| Hydrogen | Methane | Carbon Dioxide | |||
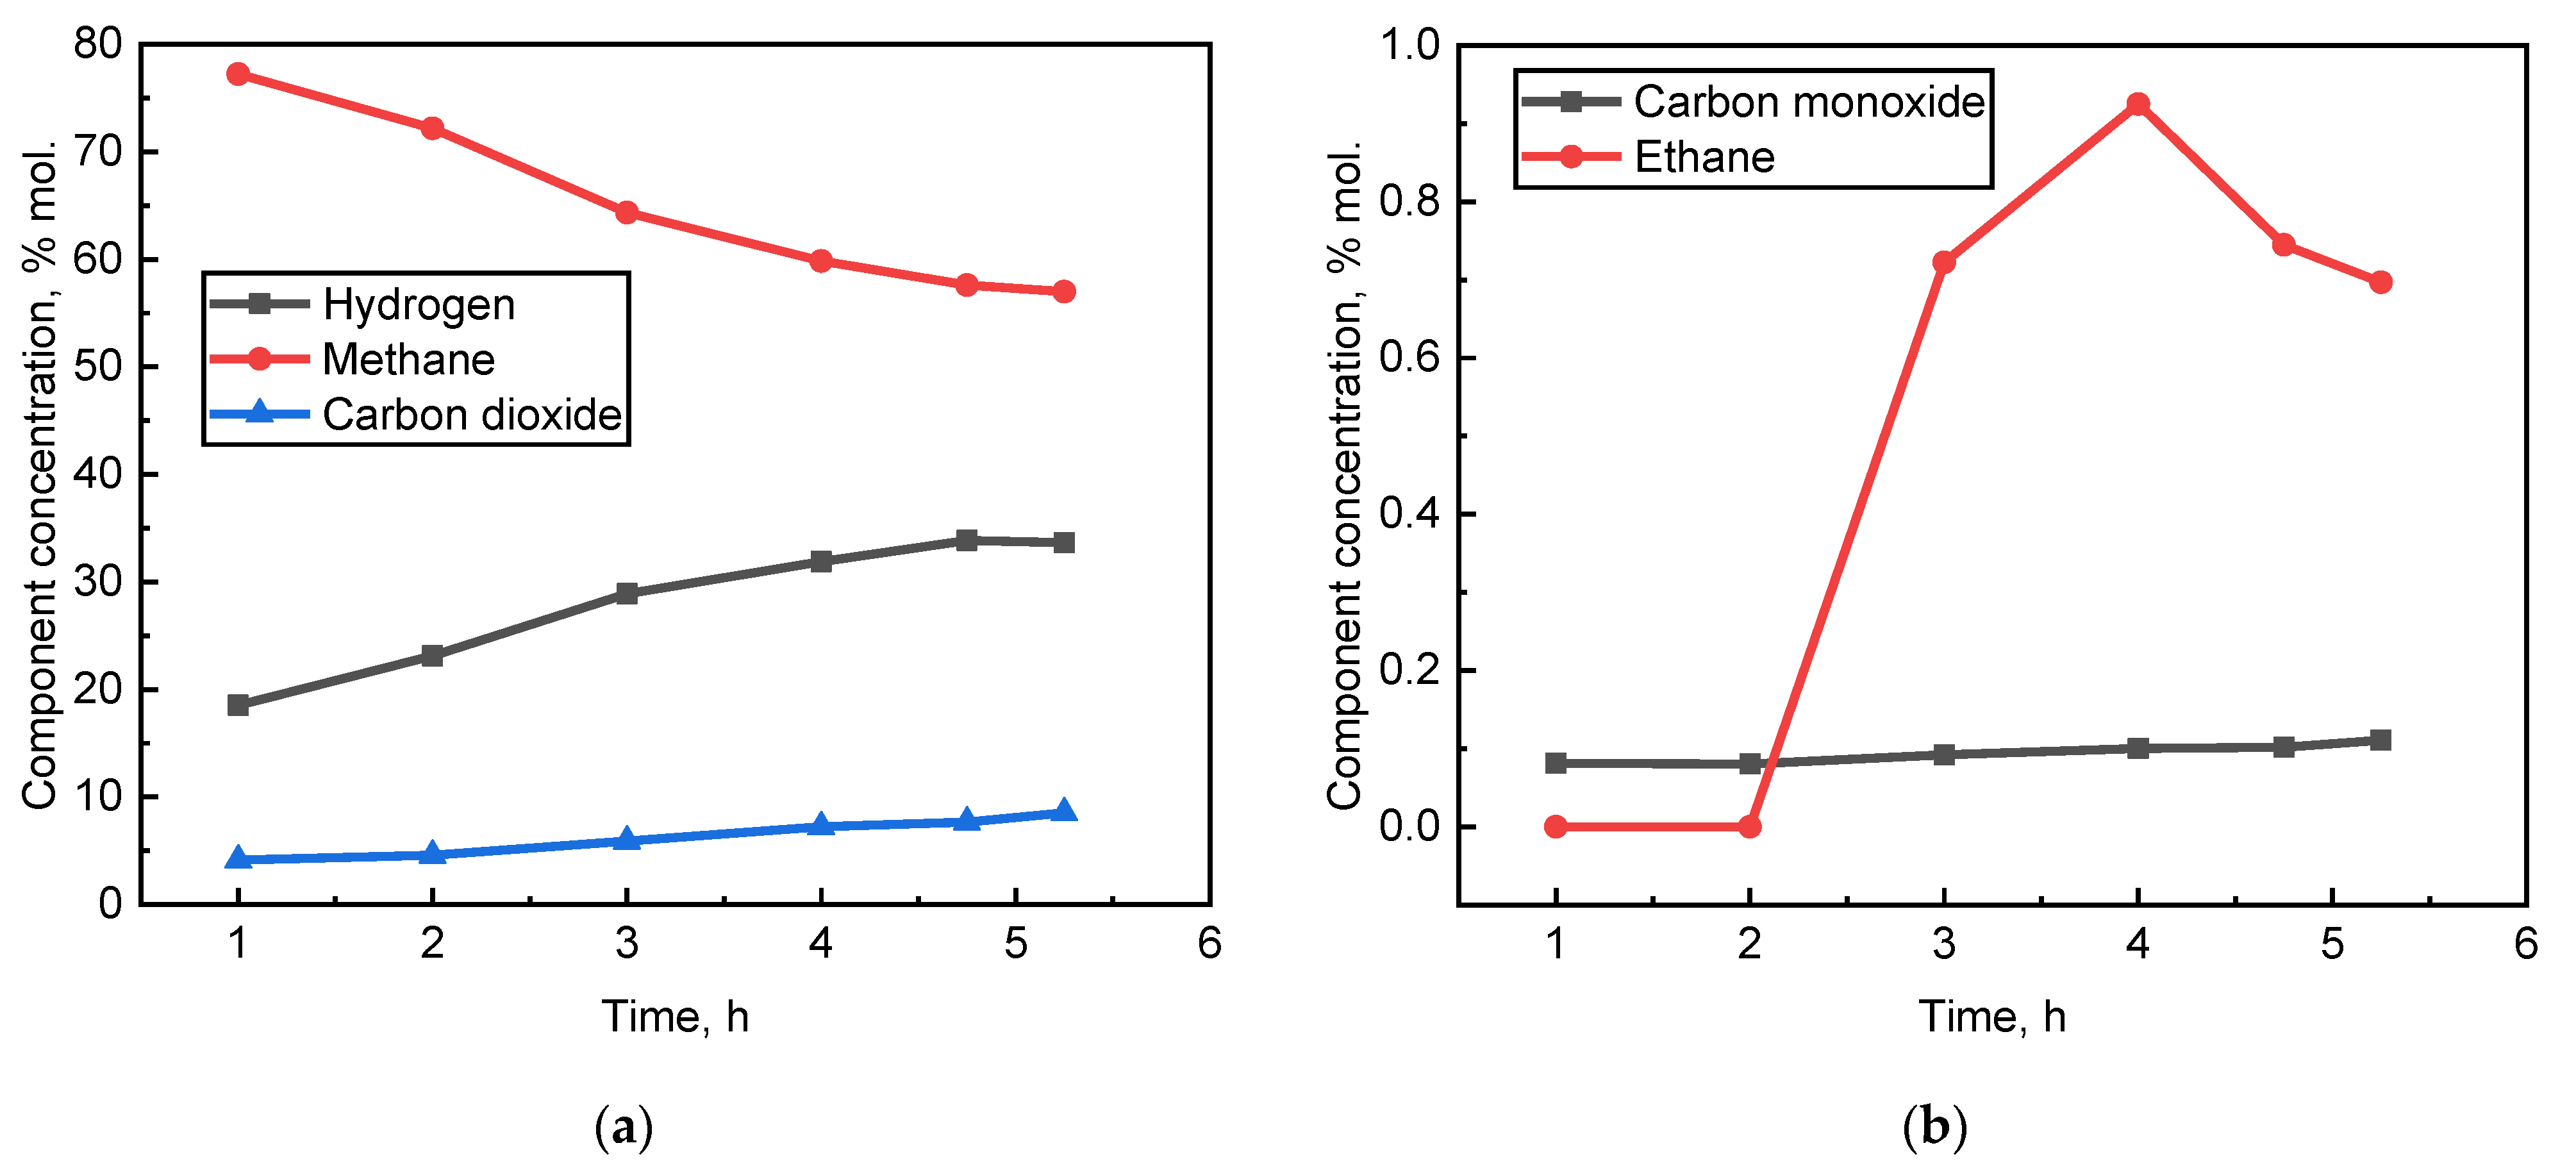
| 1 | 115 | 0.002 | 78.00 | 13.00 | NO, NO2, N2 |
| 2 | 64 | 0.011 | 98.24 | 0.97 | CO, NO2, N2 |
| 3 | 138 | 35.300 | 56.90 | 8.00 | CO, C2H6 |
| 4 | 103 | 0.100 | 98.50 | 0.26 | CO, N2 |
| 5 | 120 | 3.100 | 93.00 | 0.40 | N2 |
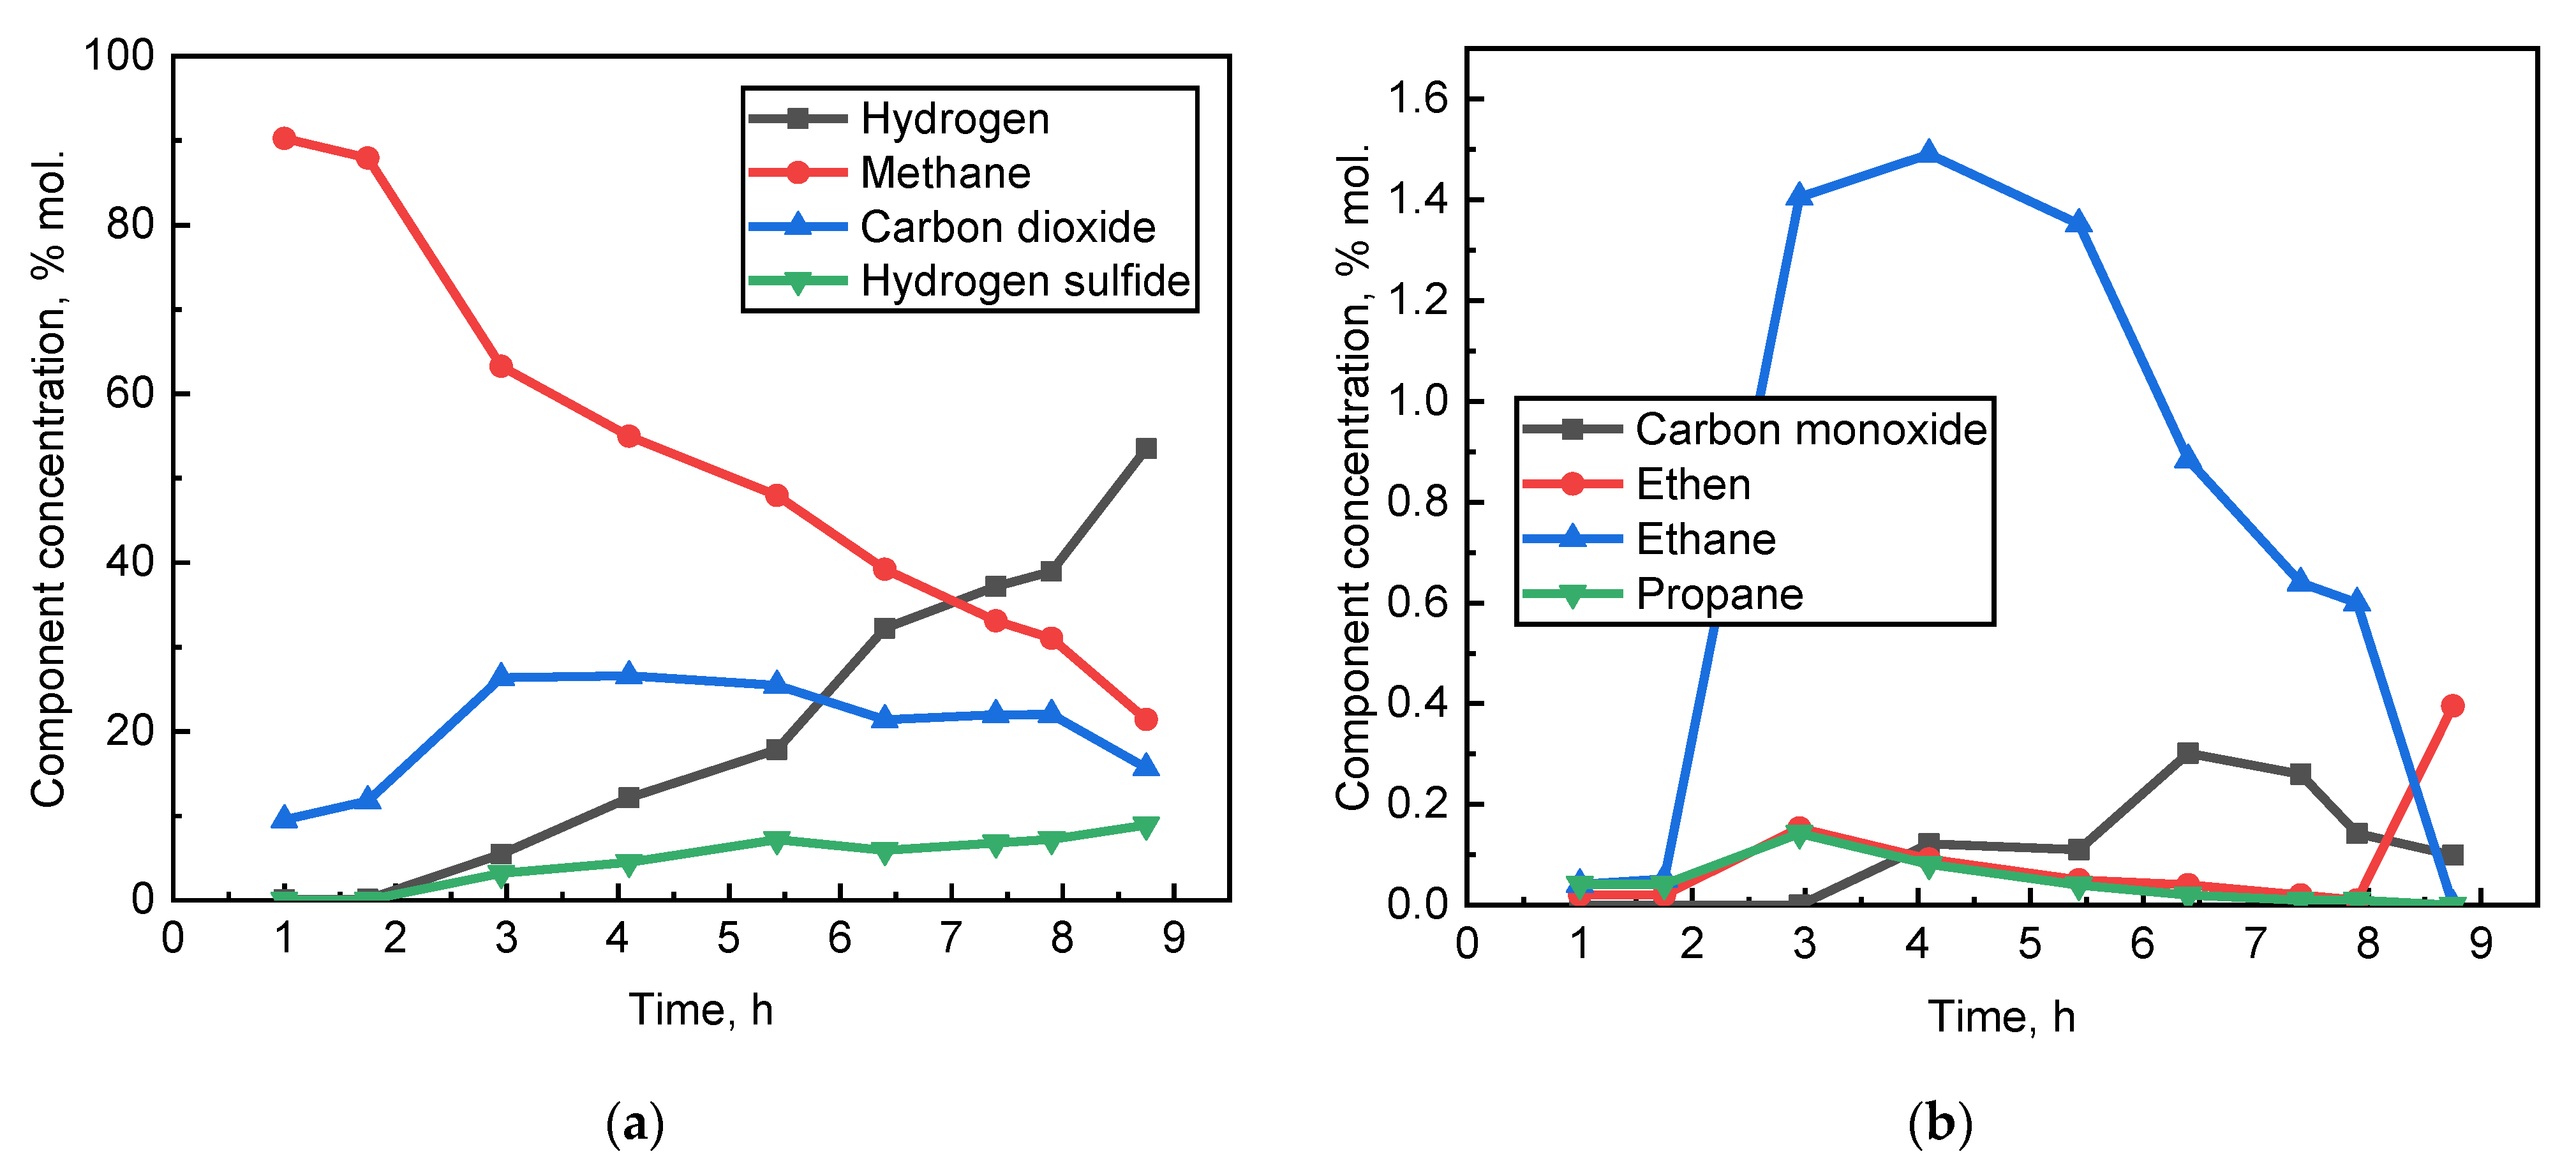
| 6 | 207 | 53.500 | 21.42 | 15.67 | CO, H2S, C2H4, C2H6, C3H8 |
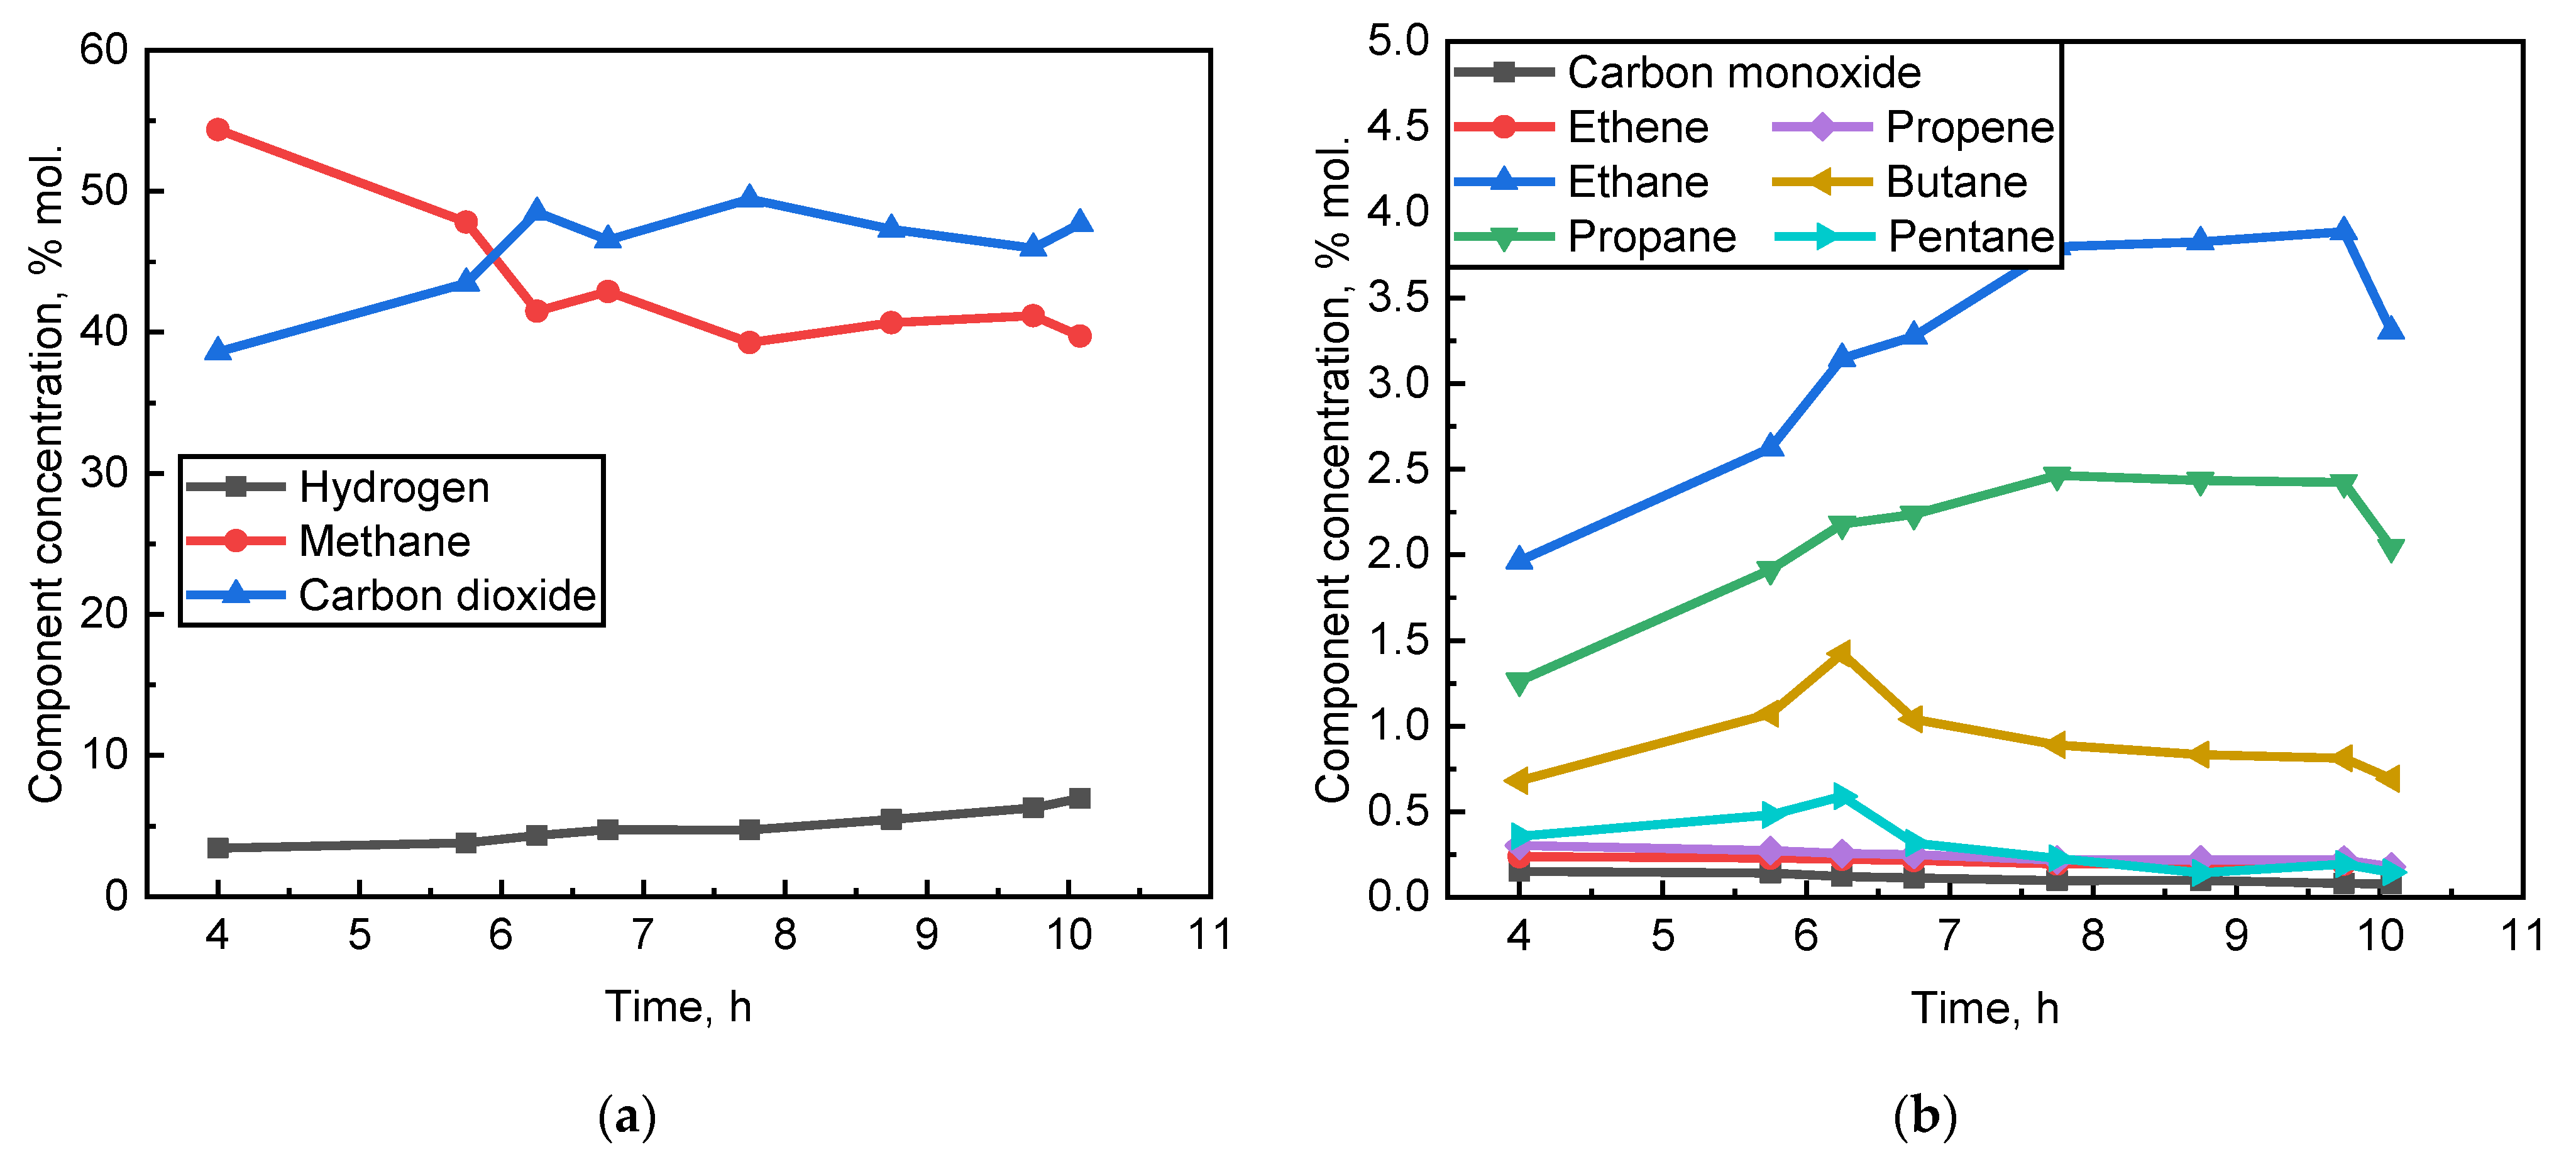
| 7 | 140 | 6.970 | 39.74 | 47.70 | CO, C2H4, C2H6, C3H6, C3H8, C4H10, C5H12 |
| Catalyst | Methane Conv., % | T, °C | P, atm | Steam to Methane Ratio | Reference |
|---|---|---|---|---|---|
| 10 wt.% Ni/Al2O3 1 | 0.0 | 500 | 1 | 2 | [35] |
| 10 wt.% Ni/Al2O3 | 15.0 | 500 | 1 | 2 | |
| 10 wt.% Ni/Al2O3 | 9.0 | 400 | 1 | 1 | [36] |
| 10 wt.% Ni/Al2O3 | 31.0 | 500 | 1 | 1 | |
| 7 wt.% Ni/Al2O3 + 1 wt.% Ag | 75.0 | 500 | 1 | 4 | [37] |
| Ni/Al2O3 2 | 25.0 | 450 | 1 | 2 | [38] |
| 10 wt.% Ni/Al2O3 | 32.0 | 500 | 1 | 3 | [39] |
| 16.2 wt.% Ni/Al2O3 | 5.8 | 450 | 207 | 21 | Current study |
Publisher’s Note: MDPI stays neutral with regard to jurisdictional claims in published maps and institutional affiliations. |
© 2021 by the authors. Licensee MDPI, Basel, Switzerland. This article is an open access article distributed under the terms and conditions of the Creative Commons Attribution (CC BY) license (https://creativecommons.org/licenses/by/4.0/).
Share and Cite
Afanasev, P.; Popov, E.; Cheremisin, A.; Berenblyum, R.; Mikitin, E.; Sorokin, E.; Borisenko, A.; Darishchev, V.; Shchekoldin, K.; Slavkina, O. An Experimental Study of the Possibility of In Situ Hydrogen Generation within Gas Reservoirs. Energies 2021, 14, 5121. https://doi.org/10.3390/en14165121
Afanasev P, Popov E, Cheremisin A, Berenblyum R, Mikitin E, Sorokin E, Borisenko A, Darishchev V, Shchekoldin K, Slavkina O. An Experimental Study of the Possibility of In Situ Hydrogen Generation within Gas Reservoirs. Energies. 2021; 14(16):5121. https://doi.org/10.3390/en14165121
Chicago/Turabian StyleAfanasev, Pavel, Evgeny Popov, Alexey Cheremisin, Roman Berenblyum, Evgeny Mikitin, Eduard Sorokin, Alexey Borisenko, Viktor Darishchev, Konstantin Shchekoldin, and Olga Slavkina. 2021. "An Experimental Study of the Possibility of In Situ Hydrogen Generation within Gas Reservoirs" Energies 14, no. 16: 5121. https://doi.org/10.3390/en14165121