Article

The Effect of Ammonia Toxicity on Methane Production of a Full-Scale Biogas Plant—An Estimation Method

by
Sotirios D. Kalamaras
1,
Georgios Vitoulis
1,
Maria Lida Christou
1,
Themistoklis Sfetsas
2,
Spiridon Tziakas
3,
Vassilios Fragos
1,
Petros Samaras
4 and
Thomas A. Kotsopoulos
1,*
1
Laboratory of Agricultural Structures & Equipment, Department of Hydraulics, Soil Science and Agricultural Engineering, School of Agriculture, Aristotle University of Thessaloniki, GR-54124 Thessaloniki, Greece
2
Research, Analytical & Quality Control Laboratory, QLAB Private Company, GR-57008 Thessaloniki, Greece
3
Biogas Lagada S.A. Biogas Plant, Organic Waste Treatment & Electricity Generation, Plot 677 Kolchikou, GR-57200 Kolchiko Lagada, Greece
4
Department of Food Science and Technology, School of Geotechnical Sciences, International Hellenic University, GR-57400 Thessaloniki, Greece
*
Author to whom correspondence should be addressed.
Energies 2021, 14(16), 5031; https://doi.org/10.3390/en14165031
Submission received: 12 July 2021 / Revised: 5 August 2021 / Accepted: 11 August 2021 / Published: 16 August 2021
(This article belongs to the Topic Anaerobic Digestion Processes)

Abstract

:
Ammonia accumulation in biogas plants reactors is becoming more frequently encountered, resulting in reduced methane (CH4) production. Ammonia toxicity occurs when N-rich substrates represent a significant part of the biogas plant’s feedstock. The aim of this study was to develop an estimation method for the effect of ammonia toxicity on the CH4 production of biogas plants. Two periods where a biogas plant operated at 3200 mg·L−1 (1st period) and 4400 mg·L−1 (2nd period) of ammonium nitrogen (NH4+–N) were examined. Biomethane potentials (BMPs) of the individual substrates collected during these periods and of the mixture of substrates with the weight ratio used by the biogas plant under different ammonia levels (2000–5200 mg·L−1 NH4+–N) were determined. CH4 production calculated from the substrates’ BMPs and the quantities used of each substrate by the biogas plant was compared with actual CH4 production on-site. Biogas plant’s CH4 production was 9.9% lower in the 1st and 20.3% in the 2nd period in comparison with the BMP calculated CH4 production, of which 3% and 14% was due to ammonia toxicity, respectively. BMPs of the mixtures showed that the actual CH4 reduction rate of the biogas plant could be approximately estimated by the ammonia concentrations levels.

Graphical Abstract

1. Introduction

Organic waste treatment technologies are becoming more and more inextricably linked to renewable energy production and they are an integral part of pollution reduction strategies and policies. The biogas sector contributes a significant part of the renewable energy production in EU, an industry under rapid expansion as more than 18,000 plants were operating in 2019 in contrast with approximately 6000 in 2009 [1]. Promotion of environmental awareness along with favourable legal framework and the high efficiency of the anaerobic digestion technology were the main reasons for the development of the biogas industry [2]. Biogas is a gaseous mixture consisted mainly by CH4 and carbon dioxide (CO2) and it derives from the degradation of organic raw materials by microorganisms under anaerobic conditions [3]. Biogas yield is directly depended on the energy content of the feedstock that can be transformed into CH4.
The availability of raw materials is directly related to the viability and profitability of biogas plants. Managers must establish strong financial interconnections with raw materials suppliers that are preferably located near to their plants to secure long term feedstock supply. However, the expected growth of the biogas sector will in some cases lead to a competition for the acquisition of raw materials from the same sources, therefore affecting the viability of biogas plants [4]. Moreover, a supply interruption of the raw materials from one or more sources may occur for technical and financial reasons. For example, an animal farm herd reduction or high acquisition prices for corn silage caused by market volatility will consequently affect the biogas plant production. Raw materials transportation cost has a major impact on the operational expenses of the biogas plant and strongly influences the decision on whether a substrate will be finally utilized [5]. Therefore, organic waste that earlier were not considered worthy or being recommended for the biogas plants, are becoming essential for the biogas industry viability due to arising competition or substrates supply interruptions.
Organic substrates that are rich in proteins have a high CH4 potential [6]. However, when these substrates constitute a significant part of the supply feedstock, they are often related with biogas production instability. The reason behind this instability is that during anaerobic digestion of substrates rich in nitrogen, such as proteins and urea, ammonia is released which above a concentration threshold disrupts the biological process. Ammonia inhibition results in significant financial losses for the biogas plants [7]. High ammonia levels significantly affect the community structure of archaea, which are responsible for CH4 production [8]. Inhibition of archaea leads to an accumulation of Volatile Fatty Acids (VFAs) and consequently to the reduction of the pH value inside the digester. The interactions between free ammonia, VFAs and pH result in an inhibited steady state, where the anaerobic process is stable but a lower CH4 production is accomplished [9,10]. This inhibited steady state is not uncommon in full scale biogas digesters and occurs more frequently as the competition for suitable substrates increases between biogas plants. Fotidis et al. reported that six Danish centralized biogas plants treating mainly manure were operating under an inhibited steady state attributed to increased ammonia levels [11]. Moreover, Nielsen and Angelidaki examined process imbalances of full-scale biogas reactors and reported an approximately 32% decrease of biogas production when a rich in nitrogen waste was added to the reactor that treated mainly manure and organic industrial waste [12]. The authors concluded that the most frequent process imbalances were related with inadequate knowledge of substrate characteristics and their performance under anaerobic digestion especially regarding toxicity level, by-product formation and CH4 potential [12].
The aim of the biogas plant manager is to maintain the highest profit from the installed electric production capacity. Revenues are strongly linked to the produced electric energy and retaining biogas production at a level that will meet the rated electrical power output is of paramount importance. As aforementioned, the substantial increase of the biogas plants during the late years resulted in an increasing demand for substrates. As a result, even substrates with a high nitrogen content, previously not chosen for biogas production due to a potential ammonia toxicity, now they could not be excluded by the operators. On the other side, when a biogas plant’s reactor has a lower CH4 production than the anticipated, managers often overcharge the reactor by increasing the amount of substrates to meet the electricity capacity of the Combined Heat and Power (CHP) engine. They often add organic wastes which instead of contributing to their goal cause a reduced CH4 production per weight of added substrate. Reactor overcharging often causes imbalances between the different phases of anaerobic digestion, especially between hydrolysis/acidogenesis and methanogenesis [13]. Moreover, when protein-rich substrates are used in large quantities, CH4 production is decreased due to ammonia toxicity [14]. Under these conditions, substrates’ residual biogas potential will be released later into the atmosphere as greenhouse gases, by microorganisms’ metabolism, upon their discharge in lagoons as digestate [15]. In addition, digestate quality and chemical composition will significantly change affecting its subsequent utilization, which is important for the viability of the biogas plant [16,17,18]. However, an accurate calculation method of the CH4 reduction rate of a biogas plant’s reactor, operating under short time fluctuations of ammonia concentrations due to the addition of different substrates, is currently not available. Therefore, a method needs to be developed for the estimation of methane production linked to substrate ammonia content, which will enable a stable operation of the biogas plants, thus preventing economic losses and protecting the environment from residual emissions caused by inadequate anaerobic digestion process.
The aim of the present study is to develop a laboratory approach to evaluate the ammonia toxicity effect on CH4 production in a full-scale biogas plant and help managers to achieve a cost-effective anaerobic reactor operation. A detailed valuation of the operating conditions of the biogas plant’s anaerobic treatment process prevailing during two periods with NH4+–N concentrations of 3200 mg·L−1 (1st period) and 4400 mg·L−1 (2nd period), was performed. A comparison of the calculated total methane potential with the actual methane production of the biogas plant during these two periods and for a Hydraulic Retention Time (HRT) of 30 days was done. An estimation of the reduction rate of CH4 production took place in the case of a sharp increase of the ammonia concentration in the content of the biogas reactor.

2. Materials and Methods

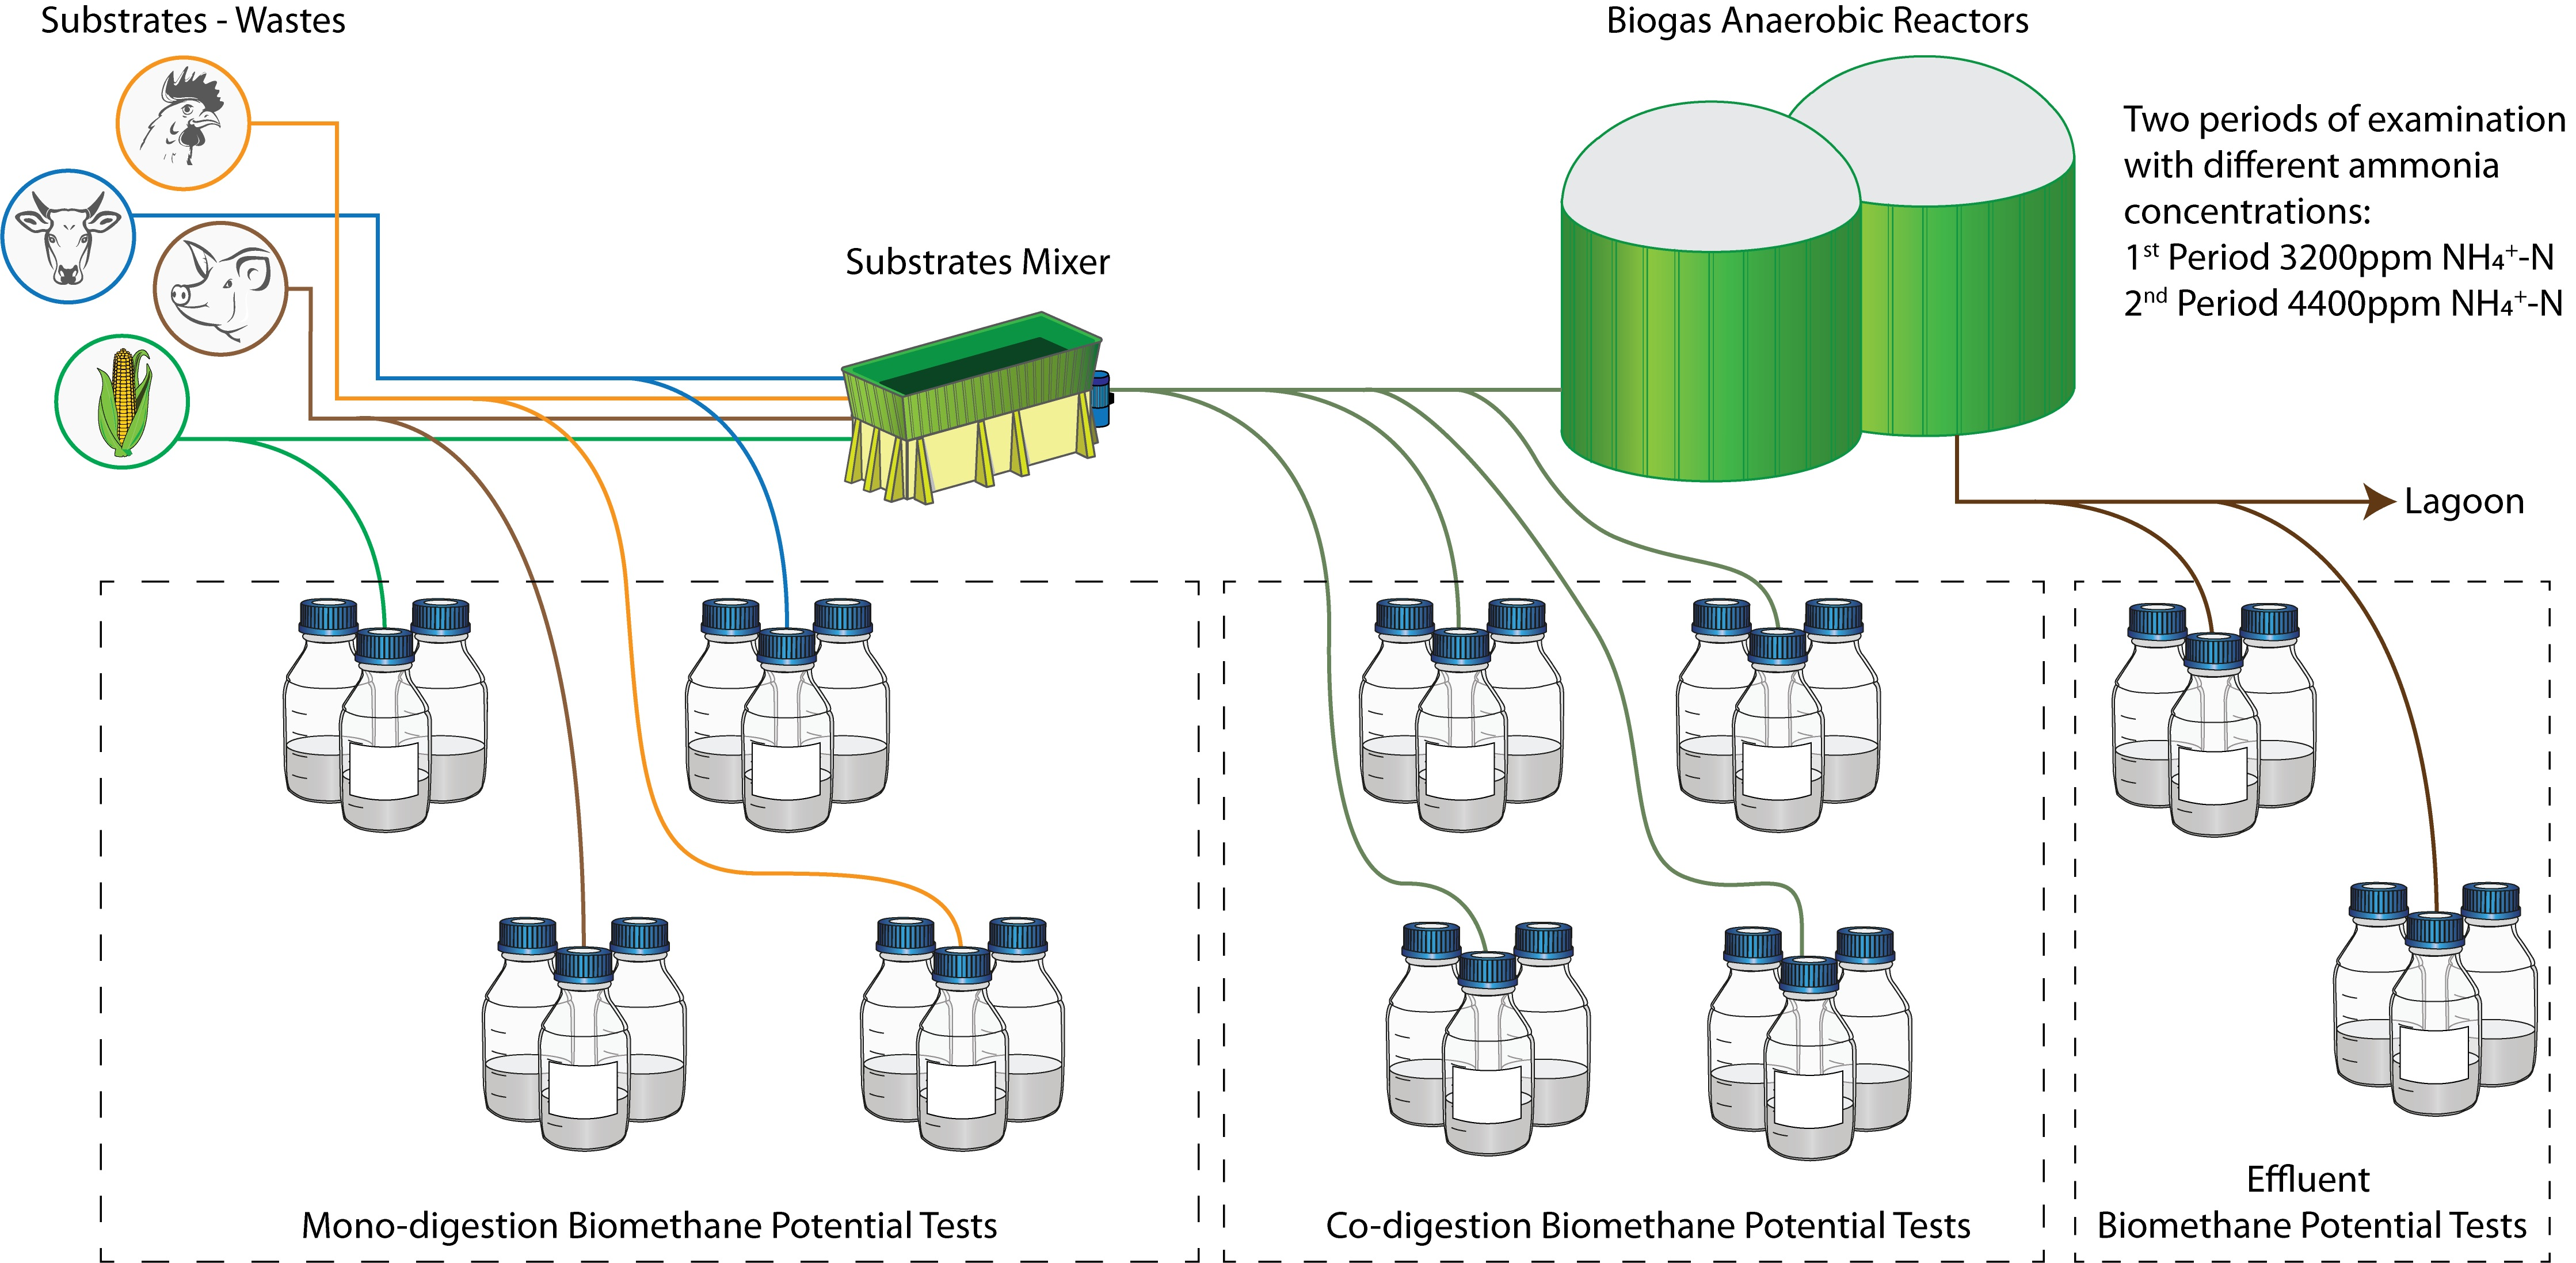
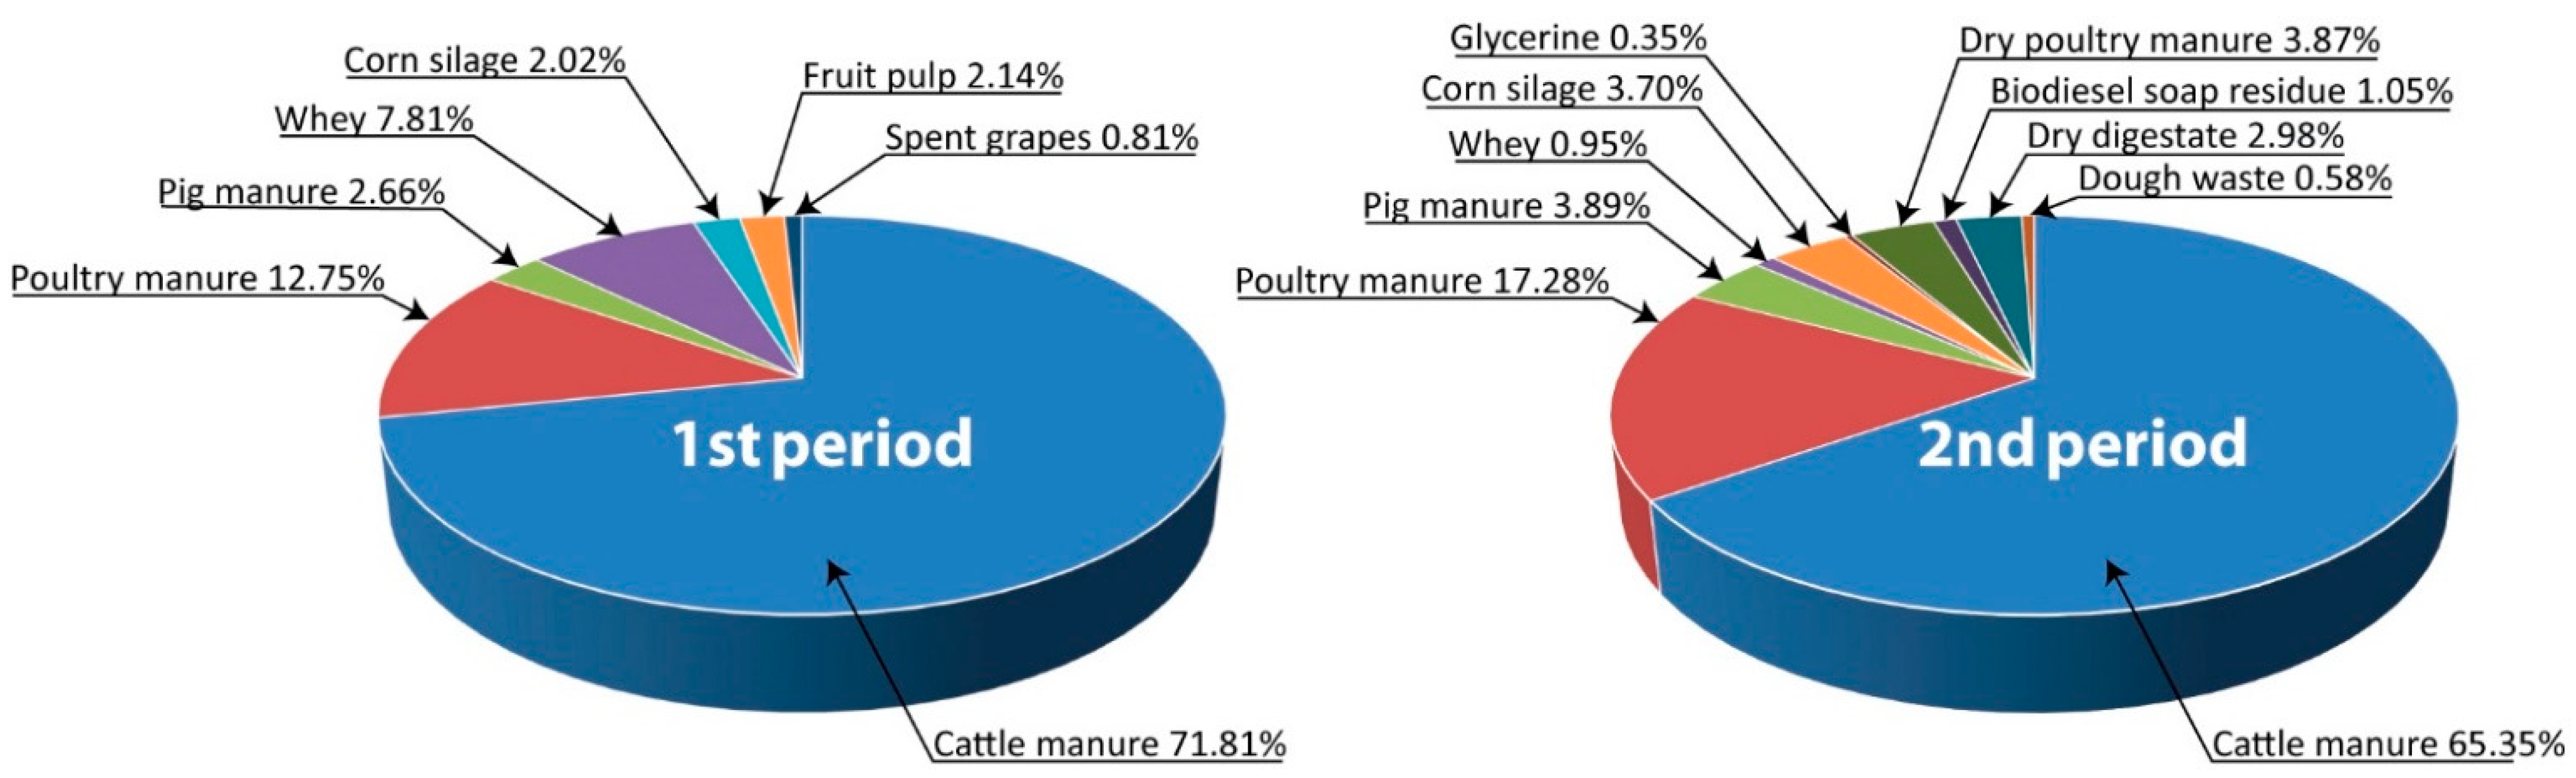
2.1. Substrates and Inoculum

The biogas plant is in the Region of Central Macedonia in Greece with an electric power capacity of 1MW, owned by Biogas Lagada S.A. (Lagadas, Central Macedonia, Greece). It is operated in the mesophilic temperature range and an HRT of about 30 days. The biogas plant consists of two anaerobic digestion reactors D1 and D2 that operate in series and each of them with a working volume of 3800 m3. The examination of the ammonia toxicity effect on CH4 production was performed for two different periods. The ammonia concentration in the 1st period between June and July of 2018 was 3200 mg·L−1 NH4+–N and in the 2nd period in September of 2018 was 4400 mg·L−1 NH4+–N. The daily input of substrates in the biogas plant was 247 tons and their characteristics measured after laboratory analyses of samples obtained by each of the waste streams utilized by the biogas plant are presented in Table 1. The input substrates ratio for the two periods under examination are shown in Figure 1. The substrates used by the biogas plant in these two periods were also used in this study for the determination of CH4 potential.
The inoculum was collected from the effluent of the D1 anaerobic reactor of the same biogas plant. At the day of collection, it was stored at 37 °C for 7 days to reduce the residual CH4 production. The same inoculum was used for all the Biomethane Potential (BMP) tests performed in this study. Inoculum characteristics are presented in Table 1 and some additional characteristics are reported in Table S8 (Supplementary Material).

2.2. Experimental Design

In order to calculate the actual impact of ammonia toxicity on the biogas plant, a BMP test of each different substrate used during these two periods was performed. The results of the substrates’ BMP tests of each period were compared with the corresponding biogas plant’s CH4 production. BMP is a laboratory scale test carried out on batch reactors where a portion of a homogenized sample is digested by a suitable inoculum [19]. It should be noted that BMP tests are used to determine the maximum CH4 content that could be recovered by the organic fraction of a substrate. Substrate’s methane yield achieved at a full-scale reactor is expected to be lower than the CH4 potential determined by BMP tests as in the continuous operation of a full-scale reactors different parameters have an effect on methane production [19]. However, Mönch-Tegeder et al. reported negligible differences between the BMP tests of grinded substrates and the full-scale actual methane production of a digester equipped with a pre-treatment device [20]. Therefore, in this study the difference between BMP tests and actual CH4 production was further investigated. The total CH4 production of each period was calculated by multiplying the CH4 production per quantity used in the substrates BMP tests with the actual quantity that was introduced into the biogas plant reactor. When the actual CH4 production from the biogas plant is substantially lower than the calculated CH4 production by the substrates BMP tests, it is a first indication of an inhibition of the anaerobic digestion process. Due to the biogas plant’s ammonia levels being relatively high during these periods, this reduction in CH4 production was possibly by ammonia toxicity. To clarify which percentage of the reduction was due to the ammonia toxicity, effluent samples from the biogas plant were obtained during the two periods of examination and their VFAs concentrations were measured. Moreover, an effluent sample from the 1st period and a 1:1 v/v diluted sample of the same effluent with water were used in triplicates and anaerobic conditions were created on site to measure their residual CH4 potential. The CH4 production measurements from the effluent samples were started on the same day they were collected and prepared.
In parallel, co-digestion BMP tests were performed by mixing the substrates of the 1st period to the exact weight ratio that was used in the biogas plant (Figure 1) to accurately calculate the effect of ammonia toxicity on CH4 production under different ammonia concentrations. The mixing of the substrates resulted in 2060 mg·L−1 (2N) of ammonium nitrogen (NH4+–N). Co-digestion BMP tests were performed at higher concentrations of ammonia by addition of an ammonium chloride solution to predict the CH4 reduction rate of the biogas plant in the case of a sharp increase of reactor’s ammonia concentration. The nominal concentrations used were 3000 mg·L−1 (3N), 4000 mg·L−1 (4N) and 5000 mg·L−1 (5N) of NH4+–N. These ammonia levels were previously observed at the biogas plant depending on the seasonality and availability of substrates.

2.3. BMP Tests

The CH4 production from each substrate used during the two examination periods and from the co-digestion of substrates were determined by BMP tests. All substrates and created substrates mixtures were homogenized. The inoculum to single substrate and inoculum to substrates ratio were 1:1 in terms of Volatile Solids (VS). For the 1st period substrates, co-digestion experiment and the effluent residual CH4 potential tests, batch glass reactors equipped with gas tight rubber stoppers were used and had a total and working volume of 297.66 mL and 100.00 mL, respectively. All the BMP tests were performed at the temperature of 37 ± 0.5 °C. Anaerobic conditions were created by flashing a mixture gas of nitrogen (80% N2) and 20% CO2 into reactors for 2 min. Single substrate and co-digestion of substrates BMP tests were done in triplicate, and they were vigorously mixed by hand once per day. Three reactors filled only with inoculum were used to monitor residual CH4 production from the inoculum. For substrates of the 2nd period the batch reactors that were used had a total and working volume of 2300.00 mL and 2000.00 mL, respectively and stirring was performed by the Biogas Endeavour device.

2.4. Analytical Methods

The measurement of Total Solids (TS), Volatile Solids (VS), Total Kjeldahl Nitrogen (TKN) and Total Ammonium Nitrogen (TAN) was performed according to APHA’s Standard Methods [21]. The pH value was measured with a digital pH meter, Jenway 3520 (Cole and Palmer, Staffordshire, UK).
Biogas quantity and composition from the mono-digestion and co-digestion of substrates used in the 1st period, as well as from the 1st period effluent residual CH4 potential tests were determined daily by measuring the headspace pressure of the reactors with a gas chromatography analysis. The gas chromatograph-GC2010 plus AT (Shimadzu, Japan) for biogas analysis was equipped with a Thermal Conductivity Detector (TCD) and two connected columns Valco-PLOT Hayesep D and VP-Molesieve Column FS of the same length (15 m) and internal diameter (0.53 mm) [22]. The injection volume was 0.15 mL, and it was done with a gas-tight syringe. CH4 potential from the substrates of the 2nd period was measured via the device Gas Endeavour (Bioprocess Control, Lund, Sweden) [23]. VFAs analysis was performed in a gas chromatograph GC−2010plusAT (Shimadzu, Japan) equipped with a Flame Ionization Detector (FID) and a high polarity column ZB-FFAP (Phenomenex, Torrance, Los Angeles, CA, USA) with 30 m length and 0.53 mm internal diameter. Samples were injected to the GC-FID with the help of an autosampler AOC−20s (Shimadzu, Japan) and the volume injected was 1 μL. Helium was the carrier gas for both gas chromatographers.
Statistical analysis of data was performed with the IBM SPSS Statistics, version 25. One-way analysis of variance was used for the comparison of the means for the co-digestion BMP experiments, and the pair-wise differences were assessed with the post hoc analysis (statistically significant difference if p < 0.05).

3. Results and Discussion

3.1. BMPs of Substrates and Comparison with the Actual Methane Production of the Biogas Plant—Preliminary Assessment of Ammonia Toxicity

The waste quantities introduced in the biogas reactor for each period, their CH4 potential and the calculated CH4 production based on the added quantity and the BMP potential of each substate are presented in Table 2. Water was added to reach the working volume of the reactors used for the mono-digestion BMP tests of substrates and the final ammonia concentration did not exceed 1150 m L−1 of NH4+–N for each of the reactors. The total CH4 production (m3) for each examination period (30 days) was calculated by adding the CH4 production (m3) of each substrate, which was calculated by multiplying the input quantity (t) with the CH4 potential of each substrate (m3 t−1), similar to a calculation performed by Hollinger et al. [24]. This total methane production indicates the maximum production that could occur by exploitation of the degradable matter of each individual substrate of the feedstock under anaerobic digestion in a period of 30 days.
The highest CH4 potential between wastes of both periods was obtained by glycerine (428.33 m3 CH4 t−1) and dough waste (268.58 m3 CH4 t−1). However, both wastes formed the smallest fractions of the total feedstock of the 2nd period, thus affecting less the total CH4 production for this period. On the other hand, poultry manure with 79.38 m3 CH4 t−1 was accounted for most of the total CH4 production in the 2nd period (36%), due to the large quantity (17%) that was introduced into the reactors. For the same reason, cattle manure with 15.68 m3 CH4 t−1 was responsible for the 44% of the total feedstock in the 1st period. Regarding the CH4 yield of the substrates, similar results were reported by previous studies about the BMP of cattle manure [25], pig manure [26], poultry manure [27], glycerine [28], corn silage [29], cheese whey [30] and grape pomace [31].
Concentrations of NH4+–N, the CH4 production of the biogas plant, and the total CH4 production for each period are given in Table 3. The NH4+–N concentration was increased by 1200 mg·L−1 in the 2nd period in comparison with the 1st. This increase was due to the different substrates that were used in the 2nd period. Specifically, poultry manure, dry poultry manure and dried digestate which are characterized with a high nitrogen content (Table 1) were accounted for 24.14% of the total waste input in the 2nd period, where in the 1st period, poultry manure was the only high content nitrogen source which was representing a 12.74% of the total waste input. The biogas plant’s CH4 production for both periods was calculated based on the characteristics of the Combined Heat and Power (CHP) engine provided by the biogas plant. The actual CH4 production was the same during the two periods of examination as the roof of the biogas plant reactors was equipped with a single-layered gas storage system suitable to store the excess produced biogas and supply it to the CHP engine at a period of lower production. In combination with the steady stream of wastes to the reactor the CHP engine was running at a maximum electric capacity and the emergency biogas flare was never put into operation during these two periods. The CHP efficiency in electric power was 40.07%, the low heating value for CH4 (65%) was 6.5 KWh, and the daily output was 23.35 MWh. As expected, the calculated CH4 production from the substrates’ mono-digestion BMP tests was greater than the biogas plant’s in both periods. However, the biogas plant’s CH4 production in the 2nd period was 20.3% lower from the calculated total CH4 production, in contrast with only a 9.9% reduction in the 1st period. In combination with the higher concentration of ammonia nitrogen and VFAs concentration as shown below during the 2nd period, it is strongly indicated that ammonia inhibited the methanogenic process in this period.
The Volatile Fatty Acids (VFAs) concentrations act as a good indicator of process imbalance in anaerobic digestion [32,33]. The VFAs concentrations of the biogas plant effluent samples from the two periods are presented in Table 4. In the 1st study period, all the VFAs concentrations where lower than those of the 2nd period, thus revealing a toxicity effect but as not as strong as it was in the 2nd period. The acetic and propionic acid concentrations during the 2nd period of examination were very high, revealing the presence of toxicity in the anaerobic reactor of the biogas plant. It was reported that the increased concentration of acetic acid is associated to the absence or restricted growth of aceticlastic methanogens, which was probably due to high concentrations of ammonia [10]. Furthermore, Wang et al. reported that when the concentration of propionic acid exceeded the threshold of 900 mg·L−1, the bacteria concentration was decreased with detrimental effects on their activity [34]. Inhibition of methanogens growth was observed in an anaerobic reactor at a similar propionic acid concentration of 950 mg·L−1 [35].
From the stoichiometry of the CH4 biological production (Equation (1)) and based on the assumption that 1 mole of gas under standards conditions has 22.4 NL of volume, it turns out that from 1 mmol of acetic acid and 1 mmol of propionic acid could be produced 22.4 N mL and 39.2 N mL of CH4, respectively [36]. If the amounts of these two acids in the 2nd study period (Table 4) had been converted to CH4, an additional volume of 1817.5 mL CH4 kg−1 or 1.8175 m3 CH4 t−1 of input substrates would be produced. The above calculations correspond to a net loss of 13,467 m3 (30 days HRT * 247 t day−1 * 1.81745 m3 CH4 t−1) of CH4 for the 2nd study period without considering the reduction in methane production due to the instability of the anaerobic process.
C n H a O b + ( n a 4 b 2 ) H 2 O ( n 2 + a 8 b 4 )   CH 4 + ( n 2 a 8 + b 4 )   CO 2  
The reduction by 9.9% of the total calculated CH4 production in the 1st period was probably due also to other factors, as the VFAs concentrations were not high enough as to be considered responsible for this reduction. To determine the reduction rate caused by toxicity of ammonia or to other factors, effluent from the biogas reactor was collected during the 1st period for further examination. A dilution with water of the biogas effluent was performed to minimize any toxicity effect and the CH4 potential of the diluted and undiluted effluent sample was determined. The cumulative methane production in mL CH4 g−1 of effluent for both samples is presented in Figure 2 and the VFAs concentrations at the end of BMP tests are depicted in Table S1 (Supplementary Material). The diluted sample had a 28.88% increase in CH4 production in comparison with the undiluted sample. Furthermore, 60% of the total CH4 production was produced in 12 days for the diluted effluent sample, where the undiluted reach the same level of production in 20 days. This difference in CH4 production is caused by toxicity factors and probably by the inhibitory action of ammonia.
According to data provided by the biogas plant, the daily waste input in the reactor was approximately 247 tons with a simultaneous equal amount of effluent discharge. Therefore, it should be noted that according to the above results, during the 1st study period, the biogas plant did not exploit a daily production capacity equal to 864.5 m3 day−1 of CH4, which a fraction of 192.66 m3 day−1 was probably due to ammonia toxicity, calculated from the difference of CH4 production from the diluted and undiluted sample. This fraction corresponds to a reduction in total methane production of 3% (100 × 192.66 m3 day−1 × 30 day/190,958.13 m3). The remaining reduction (6.9%) is attributable to other factors, such as a longer HRT was required to anaerobically degrade the substrates. The measured CH4 production from the undiluted and diluted effluent samples in combination with the volatile solids reduction of 31.7% and 40.5%, respectively, proves that the 6.9% decrease is due to other factors independent of toxicity. Similar results were reported by other researchers that studied the scale effect on calculated CH4 production from BMPs of different substrates compared with the CH4 production of a full-scale biogas plant, where the overestimation was on average 6.0 ± 6.8% and concluded that the reasons were the different TS solids content and the particle size of the substrates [24].

3.2. Comparison of Methane Production by Anaerobic Co-Digestion of Substrates with Different Ammonia Concentrations

Anaerobic co-digestion experiments were performed to find the effect of ammonia toxicity on methane production under different concentrations of ammonia that were previously reported at the biogas plant. For this reason, a mixture of substrates used at the 1st period was prepared and the mixing ratio was identical to the one used by the biogas plant. The final concentrations of Ν–ΝH4+ after anaerobic digestion process in 2N (3157 mg·L−1) and 3N (4580 mg·L−1) were close to the ammonia concentrations during the biogas plant operation in the 1st and 2nd period, respectively. The increase of the ammonia concentration during anaerobic digestion was expected due to the biodegradation of proteins and urea hydrolysis.
The cumulative CH4 production of the co-digestion batch reactors for 30 days (biogas plant’s HRT operation), as also the total CH4 productions after 60 days of anaerobic digestion are illustrated in Figure 3. Results from the statistical analysis of the data from the BMP co-digestion tests are presented in Tables S2–S7 (Supplementary Material). The total CH4 production was strongly affected by the increase of the ammonia concentration in the batch reactors. The highest CH4 production was observed by 2N, and its exponential increase was completed in a shorter time among all treatments. This was possibly because of the inoculum’s microbial population acclimatization to the ammonia concentration range of 2060 to 3158 mg·L−1 which was previously maintained at the biogas plant during the 1st period (Table 1, inoculum’s ΝH4+–Ν concentration). If the 2N CH4 potential of 330.68 mL g−1 of VS (30 days) is multiplied by the 579.78 tons of VS of substrates that were used for a 30-day HRT in the 1st period results to 197,721.65 m3 of CH4, which is almost the same (0.4% deviation) with the total CH4 volume calculated by the mono-digestion BMP tests of substrates for the same period (Table 2). This result indicates that a co-digestion synergetic or antagonistic effect was not apparent and probably the inoculum’s microbial population was efficient under the specific range of ammonia concentration. Similar results were reported when co-digestion of different organic substrates did improve the anaerobic digestion kinetics, but the ultimate methane potential was not affected [37]. An analytical presentation of the estimated rates of CH4 potential losses when the biogas plant operates under different ammonia concentrations for an HRT of 30 days is shown in Table 5.
The calculated decrease in CH4 production derived from the substates mono-digestion BMP tests for the 2nd period is in line with the results of the 3N co-digestion treatment. The ammonia concentration in 3N treatment was at the same level with the biogas plant’s reactor during the 2nd period of examination (Table 3 and Table 5). The results from the comparison of the biogas plant’s CH4 production with the total calculated CH4 production (substrates mono-digestion) of 2nd period exposed a reduction rate of 20.3% (Table 3). Moreover, in the 1st period from the total 9.9% reduction rate, the 6.9% was allocated to other factors as the 3% was proved by the dilution of the effluent to be due to toxicity factors. The BMP co-digestion tests revealed a 14% CH4 reduction rate of 3N in comparison with 2N treatment which was exclusively caused by ammonia toxicity as all the other experimental conditions were the same for these two treatments (Table 5). Based on the assumption that the 6.9% CH4 reduction rate would be also present in the 2nd period as the feedstock’s residual potential was not exploited due to short HRT or other operational factors of the biogas plant, the total CH4 reduction rate would be equivalent to around 20% as it was calculated before with the mono-digestion BMP tests. From these results, it is indicated that the co-digestion BMP tests are a sufficient method to predict the biogas plant’s CH4 performance only by acknowledging the ammonia concentration.
The accumulative CH4 production of 4N seems to increase after the thirtieth day and probably the microbial population was efficient in higher levels of ammonia. However, the total CH4 production in the 4N treatment was statistically significantly lower by almost 20% compared to the 2N treatment after 60 days. The treatment with the highest ammonia concentration was the 5N and compared with the 2N, it had a less CH4 production rate of 35% and greater than 25% in 30 days and 60 days of anaerobic digestion, respectively. Therefore, it is indicated that the microbial population of the biogas plant (represented by the inoculum in this study) could not be efficient after a sharp increase of ammonia, which could be materialized by the addition of a substrate with high nitrogen concentration into reactor, such as poultry manure. Previous researchers had reported that CH4 production by anaerobic digestion would stop at a concentration of 4000 mg·L−1 of NH4+ when non-acclimated microbial consortiums to high NH4+ concentrations were used [38]. This was verified in this study by the direct exposure of the microbial population to high levels of ammonia, where an acclimatization was not observed even after 60 days of anaerobic digestion.
One significant difference between the substrates of the 1st and 2nd period was the utilization of wastes with high nitrogen content such as dry poultry manure and dried digestate. These two wastes represented almost 7% of the total quantity of substrates introduced in the biogas reactor in a period of 30 days. If the above percent were replaced by different substrates or with an increase of the substrates already in use with a lower nitrogen content, as it was done during the 1st study period, the specific reduction of 20.3% in the calculated CH4 production potential would probably not be observed. Moreover, the additional transport costs for the biogas plant would have been probably avoided, as well as the residual CH4 potential would not have been released into the environment, thus avoiding the cause of pollution.

4. Conclusions

The results of this study showed that is possible to estimate the CH4 reduction of a biogas plant caused by high ammonia concentrations depending on the nitrogen composition of the raw influent wastes. The steps taken in this study can potentially be applied by biogas plants that need to predict the drop in methane production when N-rich substrates are used. The BMP co-digestion tests that were conducted within the range of the biogas plant’s ammonia concentration almost predicted the reduction of the actual CH4 production during the 2nd period. During the 1st period (3200 mg·L−1 NH4+–N) of examination only 3% reduction of the calculated CH4 potential could correspond to ammonia toxicity, where 6.9% reduction was caused by other factors, such as a short HRT. Ammonia inhibition was strong during the 2nd period (4400 mg·L−1 NH4+–N) resulting in almost 14% reduction of the calculated CH4 potential. It was estimated by this study approach that operation of the specific biogas plant under ammonia concentrations within the range of 5300 to 6437 mg·L−1 of NH4+–N will result in 35% reduction of CH4 production, causing significant financial losses. The microbial population of the biogas plant during the period of examination could not efficiently withstand a sudden increase of ammonia concentration by utilization of high quantities of substrates with significant nitrogen concentrations. Therefore, the ammonia content of the anaerobic reactors of the biogas plants as also of the substrates that will be finally utilized should be monitored constantly to prevent the inhibitory effect of ammonia toxicity on CH4 production.

Supplementary Materials

The following are available online at https://www.mdpi.com/article/10.3390/en14165031/s1, Table S1: Volatile Fatty Acids (VFAs) concentrations at the end of BMP tests of the diluted with water (1:1 volume ratio) and undiluted biogas plant’s effluent from the 1st period, Table S2: Descriptive statistics for the co-digestion BMP tests and for the duration of 1 HRT (30 days). Methane potential is expressed as mL CH4 g−1 VS added, Table S3: ANOVA for the co-digestion BMP tests and for the duration of 1 HRT (30 days). Methane potential is expressed as mL CH4 g−1 VS added, Table S4: Multiple comparisons for the co-digestion BMP tests and for the duration of 1 HRT (30 days). Methane potential is expressed as mL CH4 g−1 VS added, Table S5: Descriptive statistics for the co-digestion BMP tests and for the duration of 60 days. Methane potential is expressed as mL CH4 g−1 VS added, Table S6: ANOVA for the co-digestion BMP tests and for the duration of 60 days. Methane potential is expressed as mL CH4 g−1 VS added, Table S7: Multiple comparisons for the co-digestion BMP tests and for the duration of 60 days. Methane potential is expressed as mL CH4 g−1 VS added, Table S8: Additional characteristics of the inoculum.

Author Contributions

Conceptualization, S.D.K. and T.A.K.; methodology, S.D.K. and T.A.K.; validation, S.D.K., M.L.C. and T.S.; formal analysis, S.D.K., G.V., T.S. and T.A.K.; investigation, S.D.K., G.V., M.L.C. and T.S.; resources, S.T., P.S., T.S., V.F. and T.A.K.; writing—original draft preparation, S.D.K.; writing—review and editing, S.D.K., V.F., P.S. and T.A.K.; visualization, S.D.K.; supervision, V.F. and T.A.K.; project administration, T.S., S.T., P.S. and T.A.K.; funding acquisition, T.S. and T.A.K. All authors have read and agreed to the published version of the manuscript.

Funding

This research has been co-financed by the European Regional Development Fund of the European Union and Greek national funds through the Operational Program Competitiveness, Entrepreneurship and Innovation, under the call RESEARCH—CREATE—INNOVATE (project code: T1EDK−00406).

Institutional Review Board Statement

Not applicable.

Informed Consent Statement

Not applicable.

Data Availability Statement

The data presented in this study are available on request from the corresponding author.

Acknowledgments

This research has been co-financed by the European Regional Development Fund of the European Union and Greek national funds through the Operational Program Competitiveness, Entrepreneurship and Innovation, under the call RESEARCH—CREATE—INNOVATE (project code: T1EDK−00406).

Conflicts of Interest

The authors declare no conflict of interest.

References

  1. Arnau, Á.S.; Pflüger, S.; Giacomazzi, M.; Decorte, M.; Genua, M. Annual Report 2020. European Biogas Association: Brussels, Belgium. Available online: https://www.europeanbiogas.eu/eba-annual-report-2020/ (accessed on 5 July 2021).
  2. Xue, S.; Song, J.; Wang, X.; Shang, Z.; Sheng, C.; Li, C.; Zhu, Y.; Liu, J. A systematic comparison of biogas development and related policies between China and Europe and corresponding insights. Renew. Sustain. Energy Rev. 2020, 117, 109474. [Google Scholar] [CrossRef]
  3. Kougias, P.; Kotsopoulos, T.; Martzopoulos, G. Anaerobic co-digestion of pig waste with olive mill wastewater under various mixing conditions. Fresenius Environ. Bull. 2010, 19, 1682–1686. [Google Scholar]
  4. Wellisch, M.; Green, J.; McCabe, B.; Rasi, S.; Siemens, W.; Ammenberg, J.; Liebetrau, J.; Bochmann, G.; Murphy, J.D. Drivers for Successful and Sustainable Biogas Projects: International Perspectives. In Proceedings of the Report of a Symposium in Association with Canadian Biogas Association held on line via GoToMeetings, 26 March 2020. [Google Scholar]
  5. Dagnall, S.; Hill, J.; Pegg, D. Resource mapping and analysis of farm livestock manures—Assessing the opportunities for biomass-to-energy schemes. Bioresour. Technol. 2000, 71, 225–234. [Google Scholar] [CrossRef]
  6. Bücker, F.; Marder, M.; Peiter, M.R.; Lehn, D.N.; Esquerdo, V.M.; Antonio de Almeida Pinto, L.; Konrad, O. Fish waste: An efficient alternative to biogas and methane production in an anaerobic mono-digestion system. Renew. Energy 2020, 147, 798–805. [Google Scholar] [CrossRef]
  7. Rajagopal, R.; Massé, D.I.; Singh, G. A critical review on inhibition of anaerobic digestion process by excess ammonia. Bioresour. Technol. 2013, 143, 632–641. [Google Scholar] [CrossRef]
  8. Yang, Z.; Wang, W.; He, Y.; Zhang, R.; Liu, G. Effect of ammonia on methane production, methanogenesis pathway, microbial community and reactor performance under mesophilic and thermophilic conditions. Renew. Energy 2018, 125, 915–925. [Google Scholar] [CrossRef]
  9. Chen, Y.; Cheng, J.J.; Creamer, K.S. Inhibition of anaerobic digestion process: A review. Bioresour. Technol. 2008, 99, 4044–4064. [Google Scholar] [CrossRef]
  10. Angelidaki, I.; Ahring, B.K. Thermophilic anaerobic digestion of livestock waste: The effect of ammonia. Appl. Microbiol. Biotechnol. 1993, 38, 560–564. [Google Scholar] [CrossRef]
  11. Fotidis, I.A.; Karakashev, D.; Angelidaki, I. The dominant acetate degradation pathway/methanogenic composition in full-scale anaerobic digesters operating under different ammonia levels. Int. J. Environ. Sci. Technol. 2014, 11, 2087–2094. [Google Scholar] [CrossRef] [Green Version]
  12. Nielsen, H.B.; Angelidaki, I. Codigestion of manure and industrial organic waste at centralized biogas plants: Process imbalances and limitations. Water Sci. Technol. 2008, 58, 1521–1528. [Google Scholar] [CrossRef] [PubMed] [Green Version]
  13. Braz, G.H.R.; Fernandez-Gonzalez, N.; Lema, J.M.; Carballa, M. Organic overloading affects the microbial interactions during anaerobic digestion in sewage sludge reactors. Chemosphere 2019, 222, 323–332. [Google Scholar] [CrossRef]
  14. Polizzi, C.; Alatriste-Mondragón, F.; Munz, G. The role of organic load and ammonia inhibition in anaerobic digestion of tannery fleshing. Water Resour. Ind. 2018, 19, 25–34. [Google Scholar] [CrossRef]
  15. Akbulut, A. Techno-economic analysis of electricity and heat generation from farm-scale biogas plant: Çiçekdağı case study. Energy 2012, 44, 381–390. [Google Scholar] [CrossRef]
  16. Urbanowska, A.; Kabsch-Korbutowicz, M. The Use of Flat Ceramic Membranes for Purification of the Liquid Fraction of the Digestate from Municipal Waste Biogas Plants. Energies 2021, 14, 3947. [Google Scholar] [CrossRef]
  17. Urbanowska, A.; Kabsch-Korbutowicz, M.; Wnukowski, M.; Seruga, P.; Baranowski, M.; Pawlak-Kruczek, H.; Serafin-Tkaczuk, M.; Krochmalny, K.; Niedzwiecki, L. Treatment of Liquid By-Products of Hydrothermal Carbonization (HTC) of Agricultural Digestate Using Membrane Separation. Energies 2020, 13, 262. [Google Scholar] [CrossRef] [Green Version]
  18. Urbanowska, A.; Polowczyk, I.; Kabsch-Korbutowicz, M.; Seruga, P. Characteristics of Changes in Particle Size and Zeta Potential of the Digestate Fraction from the Municipal Waste Biogas Plant Treated with the Use of Chemical Coagulation/Precipitation Processes. Energies 2020, 13, 5861. [Google Scholar] [CrossRef]
  19. Koch, K.; Hafner, S.D.; Weinrich, S.; Astals, S.; Holliger, C. Power and Limitations of Biochemical Methane Potential (BMP) Tests. Front. Energy Res. 2020, 8, 63. [Google Scholar] [CrossRef]
  20. Mönch-Tegeder, M.; Lemmer, A.; Oechsner, H. Enhancement of methane production with horse manure supplement and pretreatment in a full-scale biogas process. Energy 2014, 73, 523–530. [Google Scholar] [CrossRef]
  21. APHA. Standard Methods for the Examination of Water and Wastewater; APHA: Washington, DC, USA, 2005. [Google Scholar]
  22. Kalamaras, S.D.; Kotsopoulos, T.A. Anaerobic co-digestion of cattle manure and alternative crops for the substitution of maize in South Europe. Bioresour. Technol. 2014, 172, 68–75. [Google Scholar] [CrossRef]
  23. Liu, J.; van Gorp, R.; Nistor, M. The New Gas Endeavour System from Bioprocess Control AB for In Vitro Assessment of Animal feeds. In Proceedings of the 9th Nordic Feed Science Conference, Uppsala, Sweden, 12–13 June 2018; Udén, P., Eriksson, T., Spörndly, R., Rustas, B.-O., Liljeholm, M., Eds.; Swedish University of Agricultural Sciences, Department of Animal Nutrition and Management: Uppsala, Sweden, 2018; pp. 135–142. [Google Scholar]
  24. Holliger, C.; Fruteau de Laclos, H.; Hack, G. Methane Production of Full-Scale Anaerobic Digestion Plants Calculated from Substrate’s Biomethane Potentials Compares Well with the One Measured On-Site. Front. Energy Res. 2017, 5, 12. [Google Scholar] [CrossRef] [Green Version]
  25. Adghim, M.; Abdallah, M.; Saad, S.; Shanableh, A.; Sartaj, M. Assessment of the biochemical methane potential of mono- and co-digested dairy farm wastes. Waste Manag. Res. 2020, 38, 88–99. [Google Scholar] [CrossRef]
  26. Kafle, G.K.; Chen, L. Comparison on batch anaerobic digestion of five different livestock manures and prediction of biochemical methane potential (BMP) using different statistical models. Waste Manag. 2016, 48, 492–502. [Google Scholar] [CrossRef] [PubMed] [Green Version]
  27. Batista, J.M.; Salazar, L.; Castro, L.; Escalante, H. Anaerobic co-digestion of vinasse and chicken manure: Alternative for Colombian agrowaste management. Rev. Colomb. Biotecnol. 2016, 18, 6–12. [Google Scholar]
  28. Siles, J.A.; Martín, M.A.; Chica, A.F.; Martín, A. Anaerobic co-digestion of glycerol and wastewater derived from biodiesel manufacturing. Bioresour. Technol. 2010, 101, 6315–6321. [Google Scholar] [CrossRef]
  29. Kreuger, E.; Nges, I.A.; Björnsson, L. Ensiling of crops for biogas production: Effects on methane yield and total solids determination. Biotechnol. Biofuels 2011, 4, 44. [Google Scholar] [CrossRef] [PubMed] [Green Version]
  30. Escalante, H.; Castro, L.; Amaya, M.P.; Jaimes, L.; Jaimes-Estévez, J. Anaerobic digestion of cheese whey: Energetic and nutritional potential for the dairy sector in developing countries. Waste Manag. 2018, 71, 711–718. [Google Scholar] [CrossRef]
  31. El Achkar, J.H.; Lendormi, T.; Hobaika, Z.; Salameh, D.; Louka, N.; Maroun, R.G.; Lanoisellé, J.-L. Anaerobic digestion of grape pomace: Biochemical characterization of the fractions and methane production in batch and continuous digesters. Waste Manag. 2016, 50, 275–282. [Google Scholar] [CrossRef]
  32. Franke-Whittle, I.H.; Walter, A.; Ebner, C.; Insam, H. Investigation into the effect of high concentrations of volatile fatty acids in anaerobic digestion on methanogenic communities. Waste Manag. 2014, 34, 2080–2089. [Google Scholar] [CrossRef] [Green Version]
  33. Ahring, B.K.; Sandberg, M.; Angelidaki, I. Volatile fatty acids as indicators of process imbalance in anaerobic digestors. Appl. Microbiol. Biotechnol. 1995, 43, 559–565. [Google Scholar] [CrossRef]
  34. Wang, Y.; Zhang, Y.; Wang, J.; Meng, L. Effects of volatile fatty acid concentrations on methane yield and methanogenic bacteria. Biomass Bioenergy 2009, 33, 848–853. [Google Scholar] [CrossRef]
  35. Demirel, B.; Yenigün, O. The Effects of Change in Volatile Fatty Acid (VFA) Composition on Methanogenic Upflow Filter Reactor (UFAF) Performance. Environ. Technol. 2002, 23, 1179–1187. [Google Scholar] [CrossRef] [PubMed]
  36. Angelidaki, I.; Karakashev, D.; Batstone, D.J.; Plugge, C.M.; Stams, A.J.M. Chapter Sixteen—Biomethanation and Its Potential. In Methods in Enzymology; Rosenzweig, A.C., Ragsdale, S.W., Eds.; Academic Press: Cambridge, MA, USA, 2011; Volume 494, pp. 327–351. [Google Scholar]
  37. Astals, S.; Batstone, D.J.; Mata-Alvarez, J.; Jensen, P.D. Identification of synergistic impacts during anaerobic co-digestion of organic wastes. Bioresour. Technol. 2014, 169, 421–427. [Google Scholar] [CrossRef] [PubMed] [Green Version]
  38. Tan, L.; Cheng, Q.-S.; Sun, Z.-Y.; Tang, Y.-Q.; Kida, K. Effects of ammonium and/or sulfide on methane production from acetate or propionate using biochemical methane potential tests. J. Biosci. Bioeng. 2019, 127, 345–352. [Google Scholar] [CrossRef] [PubMed]
Figure 1. Mixing weight ratio of the different substrates utilized in the 1st and 2nd period of examination by the biogas plant for the creation of the feedstock.
Energies 14 05031 g001
Figure 2. Accumulative methane production of diluted and undiluted effluent samples from the biogas plant.
Energies 14 05031 g002
Figure 3. Accumulative methane production of co-digestion under different concentrations of ammonia. Different letters signify distinct statistical groups (p < 0.05) between the different co-digestion samples.
Energies 14 05031 g003
Table 1. Characteristics of the inoculum and wastes used in the two periods of examination by the biogas plant. Allocation of the waste based on the period utilized for the creation of a co-digestion mixture by the biogas plant.
SubstrateTS (%w/w)VS (% TS)NH4+–N (mg·L−1)TKN (mg·L−1)pHPeriod Utilized
Cattle manure5.78 ± 0.0679.67 ± 0.58486 ± 142112.63 ± 846.651st and 2nd
Poultry manure24.55 ± 0.2572.33 ± 0.584533 ± 15619,074.97+1257.51st and 2nd
Pig manure4.45 ± 0.0773.48 ± 0.281791 ± 453262 ± 246.781st and 2nd
Whey6.72 ± 0.0684.05 ± 138 ± 41277.77 ± 454.721st and 2nd
Fruit pulp14.29 ± 0.4197.34 ± 0.57224 ± 421568 ± 143.51st
Corn silage36.55 ± 0.2496.5 ± 0.7169 ± 84300 ± 1313.831st and 2nd
Spent grapes44.75 ± 0.7871.00 ± 9.19258 ± 83072 ± 1583.941st
Glycerine85.34 ± 6.7181.38 ± 6.55NM *1149 ± 3948.62nd
Dry poultry manure74.88 ± 15.0463.81 ± 10.76NM *31,217 ± 16,1608.22nd
Biodiesel soap residue10.27 ± 4.41 10.11 ± 4.3612 ± 1.04229 ± 185 9.3 2nd
Dried digestate25.95 ± 2.01 23.71 ± 2.765584 ± 145523,300 ± 34128.72nd
Dough waste74.5173.52NM18,4324.32nd
Inoculum4.94 ± 0.0571.67 ± 0.583200 ± 1125176.5 ± 788.14
* NM: Not Measured.
Table 2. Input quantities of each waste for the two periods under examination, their methane potential, and the calculated total methane production for each period.
Substrate1st Period (30 days)2nd Period (30 days) *
Input (t)m3 CH4 t−1Total CH4 (m3)Input (t)m3 CH4 t−1Total CH4 (m3)
Cattle manure5313.6015.6883,317.473747.2516.9863,628.31
Poultry manure943.2062.0158,490.82990.6979.3078,561.72
Pig manure196.8012.842526.33222.816.331411.12
Whey578.4032.3118,687.1954.6619.831084.02
Fruit pulp158.4051.848210.67nu **nunu
Corn silage150.00128.1019,215.18212.30117.4824,941.00
Spent grapes60.008.51510.47nununu
Glycerinenununu19.82428.838999.41
Dry poultry manurenununu222.0093.4420,743.68
Biodiesel soap residuenununu59.8216.771003.14
Dry digestatenununu170.5343.137354.96
Dough wastenununu32.62268.588760.99
Total CH4 production190,958.13Total CH4 production215,988.35
*: Effluent water was daily added during the 2nd period due to the high TS content of the substrates. ** nu: not used.
Table 3. NH4+–N concentrations and comparison of the actual biogas plant’s CH4 production with the total calculated CH4 production from substrates’ mono-digestion BMP tests of each study period.
PeriodNH4+–N Concentration (mg·L−1)Actual Biogas Plant’s CH4 Production (m3)Total Calculated CH4
Production (m3) *
Reduction Rate (%)
First Period of study3200172,136.61190,958.139.9
Second period of study4400172,136.61215,988.3520.3
*: Values from Table 2. Calculated from the sum of CH4 potential of each substrate multiplied with the added quantity of each substrate in the reactor for each study period.
Table 4. Volatile Fatty Acids (VFAs) concentrations of the biogas plant’s effluent from the 1st and 2nd period.
Volatile Fatty Acid-VFAEffluent 1st Period Effluent 2nd Period
Acetic acid (mM)3.7441.86
Propionic acid (mM)0.0822.45
Isobutyric acid (mM)ND0.38
Butyric acid (mM)ND0.11
Isovaleric acid (mM)0.020.72
n-Valeric acid (mM)ND0.09
Isocaproic acid (mM)0.060.03
n-Caproic acid (mM)ND0.03
Heptanoic acid (mM)0.010.02
ND: Not Detected.
Table 5. Estimated methane reduction rates of the biogas plant’s substrates at different ranges of ammonia concentration.
Treatment (Initial and Final NH4+−N mg·L−1)3N (3358–4580)4N (4331–5222)5N (5304–6437)
2N (2060–3157)−14.02% CH4−20.56% CH4−35.00% CH4
3N (3358–4580) −7.60% CH4−24.40% CH4
4N (4331–5222) −18.17% CH4
Publisher’s Note: MDPI stays neutral with regard to jurisdictional claims in published maps and institutional affiliations.

