Article

Development of a Novel Gasoline Particulate Filter Loading Method Using a Burner Bench

1
Institute for Combustion Engines VKA, RWTH Aachen University, 52074 Aachen, Germany
2
FEV Europe GmbH, 52078 Aachen, Germany
*
Author to whom correspondence should be addressed.
Energies 2021, 14(16), 4914; https://doi.org/10.3390/en14164914
Submission received: 5 July 2021 / Revised: 5 August 2021 / Accepted: 9 August 2021 / Published: 11 August 2021
(This article belongs to the Special Issue Fuel Consumption of Hybrid Vehicles)

Abstract

:
In view of the deliberations on new Euro 7 emission standards to be introduced by 2025, original equipment manufacturers (OEMs) are already hard at work to further minimise the pollutant emissions of their vehicles. A particular challenge in this context will be compliance with new particulate number (PN) limits. It is expected that these will be tightened significantly, especially by including particulates down to 10 nm. This will lead to a substantially increased effort in the calibration of gasoline particulate filter (GPF) control systems. Therefore, it is of great interest to implement advanced methods that enable shortened and at the same time more accurate GPF calibration techniques. In this context, this study presents an innovative GPF calibration procedure that can enable a uniquely efficient development process. In doing so, some calibration work packages involving GPF soot loading and regeneration are transferred to a modern burner test bench. This approach can minimise the costly and time-consuming use of engine test benches for GPF calibration tasks. Accurate characterisation of the particulate emissions produced after a cold start by the target engine in terms of size distribution, morphology, and the following exhaust gas backpressure and burn-off rates of the soot inside the GPF provides the basis for a precise reproduction and validation process on the burner test bench. The burner test bench presented enables the generation of particulates with a geometric mean diameter (GMD) of 35 nm, exactly as they were measured in the exhaust gas of the engine. The elemental composition of the burner particulates also shows strong similarities to the particulates produced by the gasoline engine, which is further confirmed by matching burn-off rates. Furthermore, the exhaust backpressure behaviour can accurately be reproduced over the entire loading range of the GPF. By shifting GPF-related calibration tasks to the burner test bench, total filter loading times can be reduced by up to 93%.

1. Introduction

Up until 2017, the aftertreatment system of a gasoline engine-powered vehicle mostly consisted of a three-way catalytic converter (TWC). The focus was mainly on reducing gaseous emissions, while little regard was given to particulate matter (PM) emissions. With the introduction of the Euro 6d-TEMP regulations, strict particulate number (PN) limits have also been introduced, giving greater weight to PN emissions. Consequently, OEMs were pushed to develop additional aftertreatment solutions since TWCs alone were no longer sufficient to bring down all pollutant emissions to the extent necessary to comply with the newly established emission standards.
Two main solution paths have been followed: the first focuses on advanced engine control strategies aiming at minimising engine-out particulate emissions, and the second, and the most influential, is the introduction of a gasoline particulate filter (GPF). GPFs were first introduced by Daimler and proved to be significantly effective in reducing PM and PN emissions [1]. As a result, most OEMs followed suit and introduced GPFs in their aftertreatment systems, which is now considered standard. Over time, several developments have been made, such as coated GPFs [2]. In comparison to an uncoated or bare GPF whose sole functionality is to capture and limit soot emissions, coated GPFs also serve the role of gaseous emissions conversion, i.e., reducing nitrogen oxides (NOx) and oxidising carbon monoxide (CO), as well as unburnt hydrocarbons (HC). Descriptions of the different concepts can be found in the literature [3,4,5,6].
With all measures for Euro 6d compliance in place, OEMs have now turned their attention to the expected Euro 7 exhaust emission standards, which could see the inclusion of sub-23 nm particulates for the PN legislative limit, currently set at 6 × 10¹¹ #/km [7,8]. This is due to the abundance of medical research that indicates the adverse health effects of ultrafine aerosol particles [9,10,11]. Several investigations indicate that neglecting sub-23 nm particulates during the development process could lead to significant additional efforts to comply with future Euro 7 emission limits [12,13,14,15]. Ultimately, the end goal is having an internal combustion engine with zero tailpipe pollutant emissions, such as the study presented by Thewes et al. [16].
With the increase in powertrain hybridisation and the introduction of advanced exhaust aftertreatment systems (EATS) to meet the Euro 7 real driving emissions (RDE) legislation, system complexity continues to increase and so does the workload for calibration [17]. To reduce the effort needed for engine control unit (ECU) calibration and validation, novel methodologies need to be adapted. In this context, novel strategies for ensuring RDE compliance have already been developed to cope with the extensive test matrix required to effectively cover all possible RDE scenarios [18,19,20,21]. Furthermore, as part of ‘Road-to-Rig-to-Desktop’ initiatives, several approaches towards virtual powertrain development, including so-called X-in-the-loop approaches, have already extensively been discussed in the literature [22,23,24,25,26,27,28,29].
Acknowledging the aforementioned information, this paper presents an innovative GPF calibration procedure that enables a highly efficient development process. In doing so, calibration work packages involving GPF soot loading and regeneration are transferred to a modern burner test bench. This approach minimises the costly and time-consuming use of prototype vehicles and test resources such as climate chambers and engine test benches for GPF calibration tasks. Accurate characterisation of the cold-start soot particles produced by the vehicle in terms of size distribution, morphology, and the following exhaust backpressure behaviour and burn-off rates of the soot inside the GPF provides the basis for a precise reproduction and validation process on the burner test bench.
An essential aspect of the GPF development is the calibration of the relevant ECU functionalities for the soot load control. Since this is an additional system that will be integrated into the EATS, the integration of the GPF requires complex calibration tasks. The different calibration steps that must be performed during the GPF development phase are presented in Figure 1.
As seen in Figure 1, the first step during a state-of-the-art GPF calibration is to characterise the engine-specific soot particles in terms of their differential pressure drop effect across the GPF. The characterisation of the soot properties in terms of size and morphology is only performed as part of the novel approach proposed in this work. The second step is the soot emission model calibration. It is derived from engine test bench (ETB) measurements and measurements performed on the vehicle (with the same target engine) after the engine’s base calibration has already been optimised regarding PM and PN emissions. Typically, characterising the soot emission consumes significant time at engine test benches. However, it is critical to produce an accurate calibration that will be the basis of the ECU soot load monitoring model and, in turn, an adequate demand for regeneration measures.
For step 2, measurements conducted at the target engine and vehicle are mandatory. The third calibration task (Figure 1, step 3), which also occurs on engine test benches during a conventional calibration process, is the calibration of soot load monitoring based on the pressure drop across the GPF. For the pressure drop model to be parametrised, the GPF (along with the entire EATS) is installed on the engine test bench where the pressure drop behaviour of the exhaust system for different soot loadings is being characterised. The detailed steps to perform this calibration task are shown in Table 1. After finalising the pressure drop model, the soot burn-off model calibration takes place. The aim of this fourth step is to characterise soot oxidation rates at different GPF operating conditions. Using current methodologies, this step is also performed solely on ETBs. The fifth and last calibration task to be performed, referred to as ‘regeneration manager,’ is related to defining the different regeneration measures and strategies. This includes defining the critical soot mass to trigger active regeneration, defining the active regeneration strategy (spark timing, relative air–fuel ratio, exhaust temperature, possible secondary air feeding, and overall duration). Another aspect of the ‘regeneration manager’ is to ensure a safe GPF operation with appropriate component protection.
The novel calibration approach proposed and presented in this work mainly focuses on gaining advantages in terms of project time and resource utilisation during steps 3 and 4 of Figure 1. The extension of step 1, ‘soot characterisation’, is an essential prerequisite that has to be performed in order to ensure the accurate reproduction of the soot particles in the following steps on the burner test bench. In this investigation, steps 3 and 4 will be performed in parallel on a state-of-the-art burner test bench and an ETB to enable a much more efficient soot-loading procedure (significant time reduction) while being able to exactly match the soot properties characterised in the first step.

2. Materials and Methods

The measurements presented in this paper were conducted with a vehicle that has a state-of-the-art GDI engine and EATS. It is an eight-cylinder engine with > 4 L of displacement and a twin turbocharger system. The specifications of the vehicle, the engine, and the equipped GPF are summarised in Table 2, Table 3 and Table 4.
The GPF was equipped with radially and axially installed thermocouples along its length to monitor the temperature inside the GPF. In addition, pressure sensors were installed both upstream (uGPF) and downstream of the GPF (dGPF) to monitor the soot loading state based on the differential pressure.
For the ‘soot characterisation’ phase (Figure 1, step 1), the exhaust gas system was equipped with an extraction point downstream of the TWC (dTWC). This enables sampling the exhaust gas and analysing the size of the particulates. The cold starts were performed in a climatic chamber in order to control the ambient temperature and thus the engine coolant (start) temperature. To characterise cold-start soot particles in terms of size and concentration, a DMS500 from Cambustion was used. A main selection criterion for the particulate analyser was the ability to measure particle sizes well down to the sub-23 nm range since it was assumed that cold-start soot particles consist mainly of particles in the nucleation mode. In a detailed study by Giechaskiel et al. [30], it was reported that GDI engines have a sub-23 nm particle fraction of around 35–50%. The DMS500 is capable of measuring particles ranging from 5 nm to 1000 nm. Moreover, it allows the accumulation mode to be distinguished from the nucleation mode, and it provides size spectrum graphs and contour plots.
As for soot reproduction and for the calibration work packages involving GPF soot loading and regeneration (Figure 1, steps 3 and 4), the chosen setup was a modern burner test bench. The burner test bench is a setup that was initially designed for thermal ageing of catalytic converters and ash deposition (using oil injection) on gasoline and diesel particulate filters. The burner technology allows exhaust gas aftertreatment systems to be tested within their operating limits and their operating behaviour towards the end of their service life. It is operated with three media: fuel, air, and recirculated exhaust gas (EGR), and multiple controllers. One controls the relative air–fuel ratio (AFR) by regulating the directly injected fuel. Another controller defines the exhaust mass flow rate and the summarised mass of air and EGR. A third controller defines the temperature by calculating the ratio of air used for fresh hot exhaust and cooled EGR. Its main advantage over typical calibration techniques using engine test benches as the source of the exhaust gas is the higher degrees of freedom at hand. Due to an independent fuel supply, the AFR can be easily controlled. The AFR is defined in Equation (1), where m a i r is defined as the actual air mass in the cylinder, and m a i r ,   s t o i c h the air mass theoretically necessary for stoichiometric combustion.
A F R = m a i r m a i r ,   s t o i c h
Additionally, the use of EGR allows the exhaust gas temperature ( T e x h ) to be changed independently of the exhaust mass flow rate ( m ˙ e x h ) and the AFR. Being able to control the operating parameters of the burner (AFR, T e x h and m ˙ e x h ) independently is essential to be able to accurately control the size of the emitted particulate matter.
Several burner-related studies have already been presented by Sterlepper et al. [31,32,33]. These studies thoroughly describe the detailed burner bench setup, operating principles, technical specifications, and typical use cases in the field of EATS ageing and characterisation. However, the use of such a technique to load GPFs with engine-like soot particles instead of ash for calibration purposes has not been published in the literature up to this point in time. The entire schematic of the burner test bench setup (including the GPF and the sampling point for the DMS500) is shown in Figure 2.
The measurement of particle sizes in aerosols is usually not a straightforward task. Solid particulates are often not spherical and have odd shapes. Thus, various parameters such as the mode diameter, the count mean, and the count median diameters are used to characterise the particulate size [34]. However, the geometric mean diameter (GMD) is the parameter that is usually used with aerosol particulates having a bimodal size distribution and this is the value calculated by the DMS500. Consequently, when referring to the geometrical size of soot particles in this paper, the GMD value was solely used. The GMD is defined in Equation (2) as the nth root of the product of n values, where d p n is defined as the particulate diameter.
G M D = d p 1 d p 2 d p n n
Two methods of soot characterisation were employed as follows:
  • PN size distribution: this was measured by the DMS500 in real time, and the parameter characterising the particulate size was the geometric mean diameter (GMD).
  • Particulate morphology: this was analysed using two different chemical analysis methods performed on the collected soot particles—scanning electron microscope (SEM) and energy-dispersive X-ray analysis (EDX). The SEM is an electron microscope that generates images of a given sample by scanning the surface with a narrowly focused beam of electrons. The electrons interact with atoms in the respective sample and produce various signals that contain information about the samples’ surface topography and composition. EDX is a method commonly used to list the elemental make-up of a material sample as well as the percentage of the concentration of each element in the sample. Data that are generated from the EDX analysis are characterised by spectra with different peaks that correspond to the different elements found in the analysed sample.
In parallel with the loading measurements to characterise the relationship between soot loading and pressure drop over the GPF, the soot particles themselves were characterised by size and concentration using the DMS500. In all tests, the reference fuel EPA Tier 3 (E10) with a vapor pressure of 75.9 kPa was used. To recreate the worst-case conditions for cold-start soot particles, the starts were performed at 2 extreme cold temperatures (engine coolant temperature, T C o o l a n t ): T C o o l a n t = 15   ° C and T C o o l a n t = 30   ° C . The following presented data focus on the results obtained for the cold starts at T C o o l a n t = 15   ° C , owing to the fact that a cold start at T C o o l a n t = 30   ° C is less than likely to occur in a real-world scenario.

3. Results

In this chapter, the results of the cold-start soot characterisation in the climate chamber and the following reproduction measurements on the burner test bench in terms of PN size distribution, concentration, and morphology are presented. The following results indicate how the burner test bench is able to support GPF-related calibration tasks.

3.1. Cold-Start Soot Characterisation and Reproduction

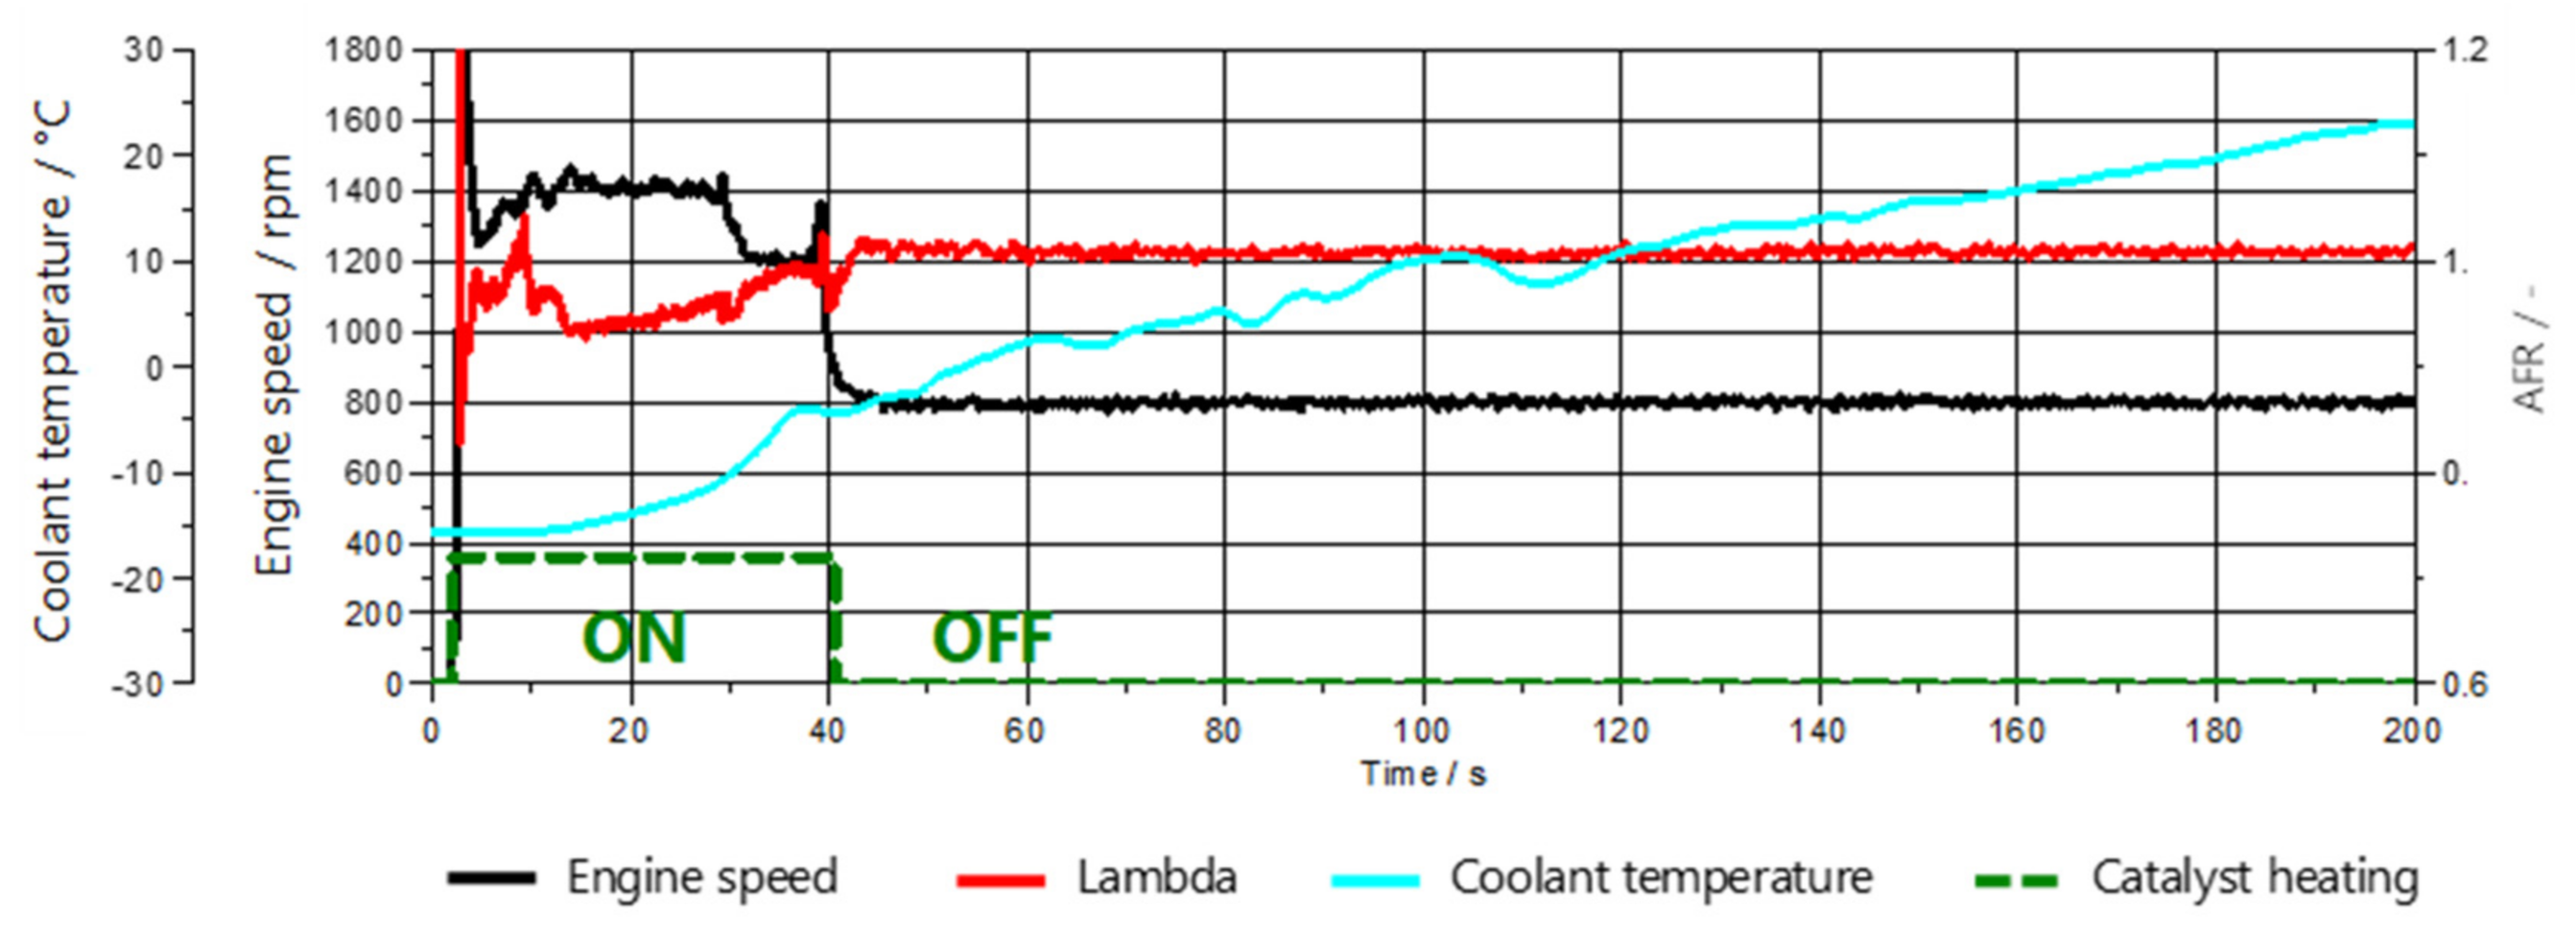
Figure 3 exemplary shows the engine start and operation during the engine warm-up phase after soaking the vehicle in the climatic chamber for 12 h at a temperature of −15 °C. It can be observed that during the initial 40 s, the catalyst heating functionality is activated. Starting with T C o o l a n t = 15   ° C , fuel enrichment is utilised to ensure stable combustion. Additionally, a high engine idle speed of 1400 rpm, which later drops down to 800 rpm, is visible as part of the catalyst heating strategy. The respective signals presented in Figure 3 are obtained by measurement with the software INCA from ETAS via the vehicles’ open ECU.
The DMS500 contour plots of two warm-up measurements at −15 °C are shown in Figure 4. Figure 4a corresponds to the measurement in Figure 3. The contour plots are three-dimensional maps that show the particulate diameter on the Y-axis, the time on the X-axis, and the PN concentration on the Z-axis.
The unit displayed for the PN concentration (dN/dlog dp/cc) is a normalised PN concentration that can be easily converted into a normal concentration (#/cc) using the device’s resolution.
By looking at both plots (a) and (b) in Figure 4, a few statements can be made as follows:
  • During the first 40 s (i.e., the catalyst heating phase), the PN concentration is substantially higher than after the heating is switched off. This is exemplified by the sudden decrease in PN concentration at 40 s. After the catalyst heating phase (from the 40 s onwards), the PN concentration starts to gradually decrease with time (i.e., the PN concentration decreases with increasing engine temperature);
  • During the entire period of the engine operation, the highest concentrations can be observed in the range for nucleation mode particulates (Dp < 50 nm);
  • Sub-23 nm particulates are strongly represented;
  • Comparing both warm-up measurements (Figure 4a,b), the engine-out PN emissions in terms of concentration and size spectrum are almost identical, thus ensuring the accuracy and the repeatability of the measurements. To accurately characterise the size of the particulates, size spectral density curves, as exemplarily shown in Figure 5, are established using the DMS500 software. Both plots show the abovementioned phenomena; gradually decreasing PN with time and nucleation mode domination.
The exact GMDs of the emitted particulate matter for all T C o o l a n t = 15   ° C cold start measurements performed are shown in Table 5. The average GMD of the soot particles dTWC was calculated to be approximately 35 nm. Assessing the results presented in Figure 3, Figure 4 and Figure 5 and Table 5, and taking into consideration that the plots are representative for all cold start measurements conducted, reliable and reproducible characterisation results were ensured.
The ultimate goal was achieving a set of burner operating parameters that produce soot particles that have the same size (average GMD) as that measured on the vehicle (GMD = 35 nm), and a high total PM emission to enable accelerated soot loading on the GPF. As mentioned before, the GMD best describes the general size distribution and can be used as a reference parameter for comparison. To ensure accurate soot reproduction, the most relevant combustion parameters in terms of soot formation are varied, as listed in Table 6.
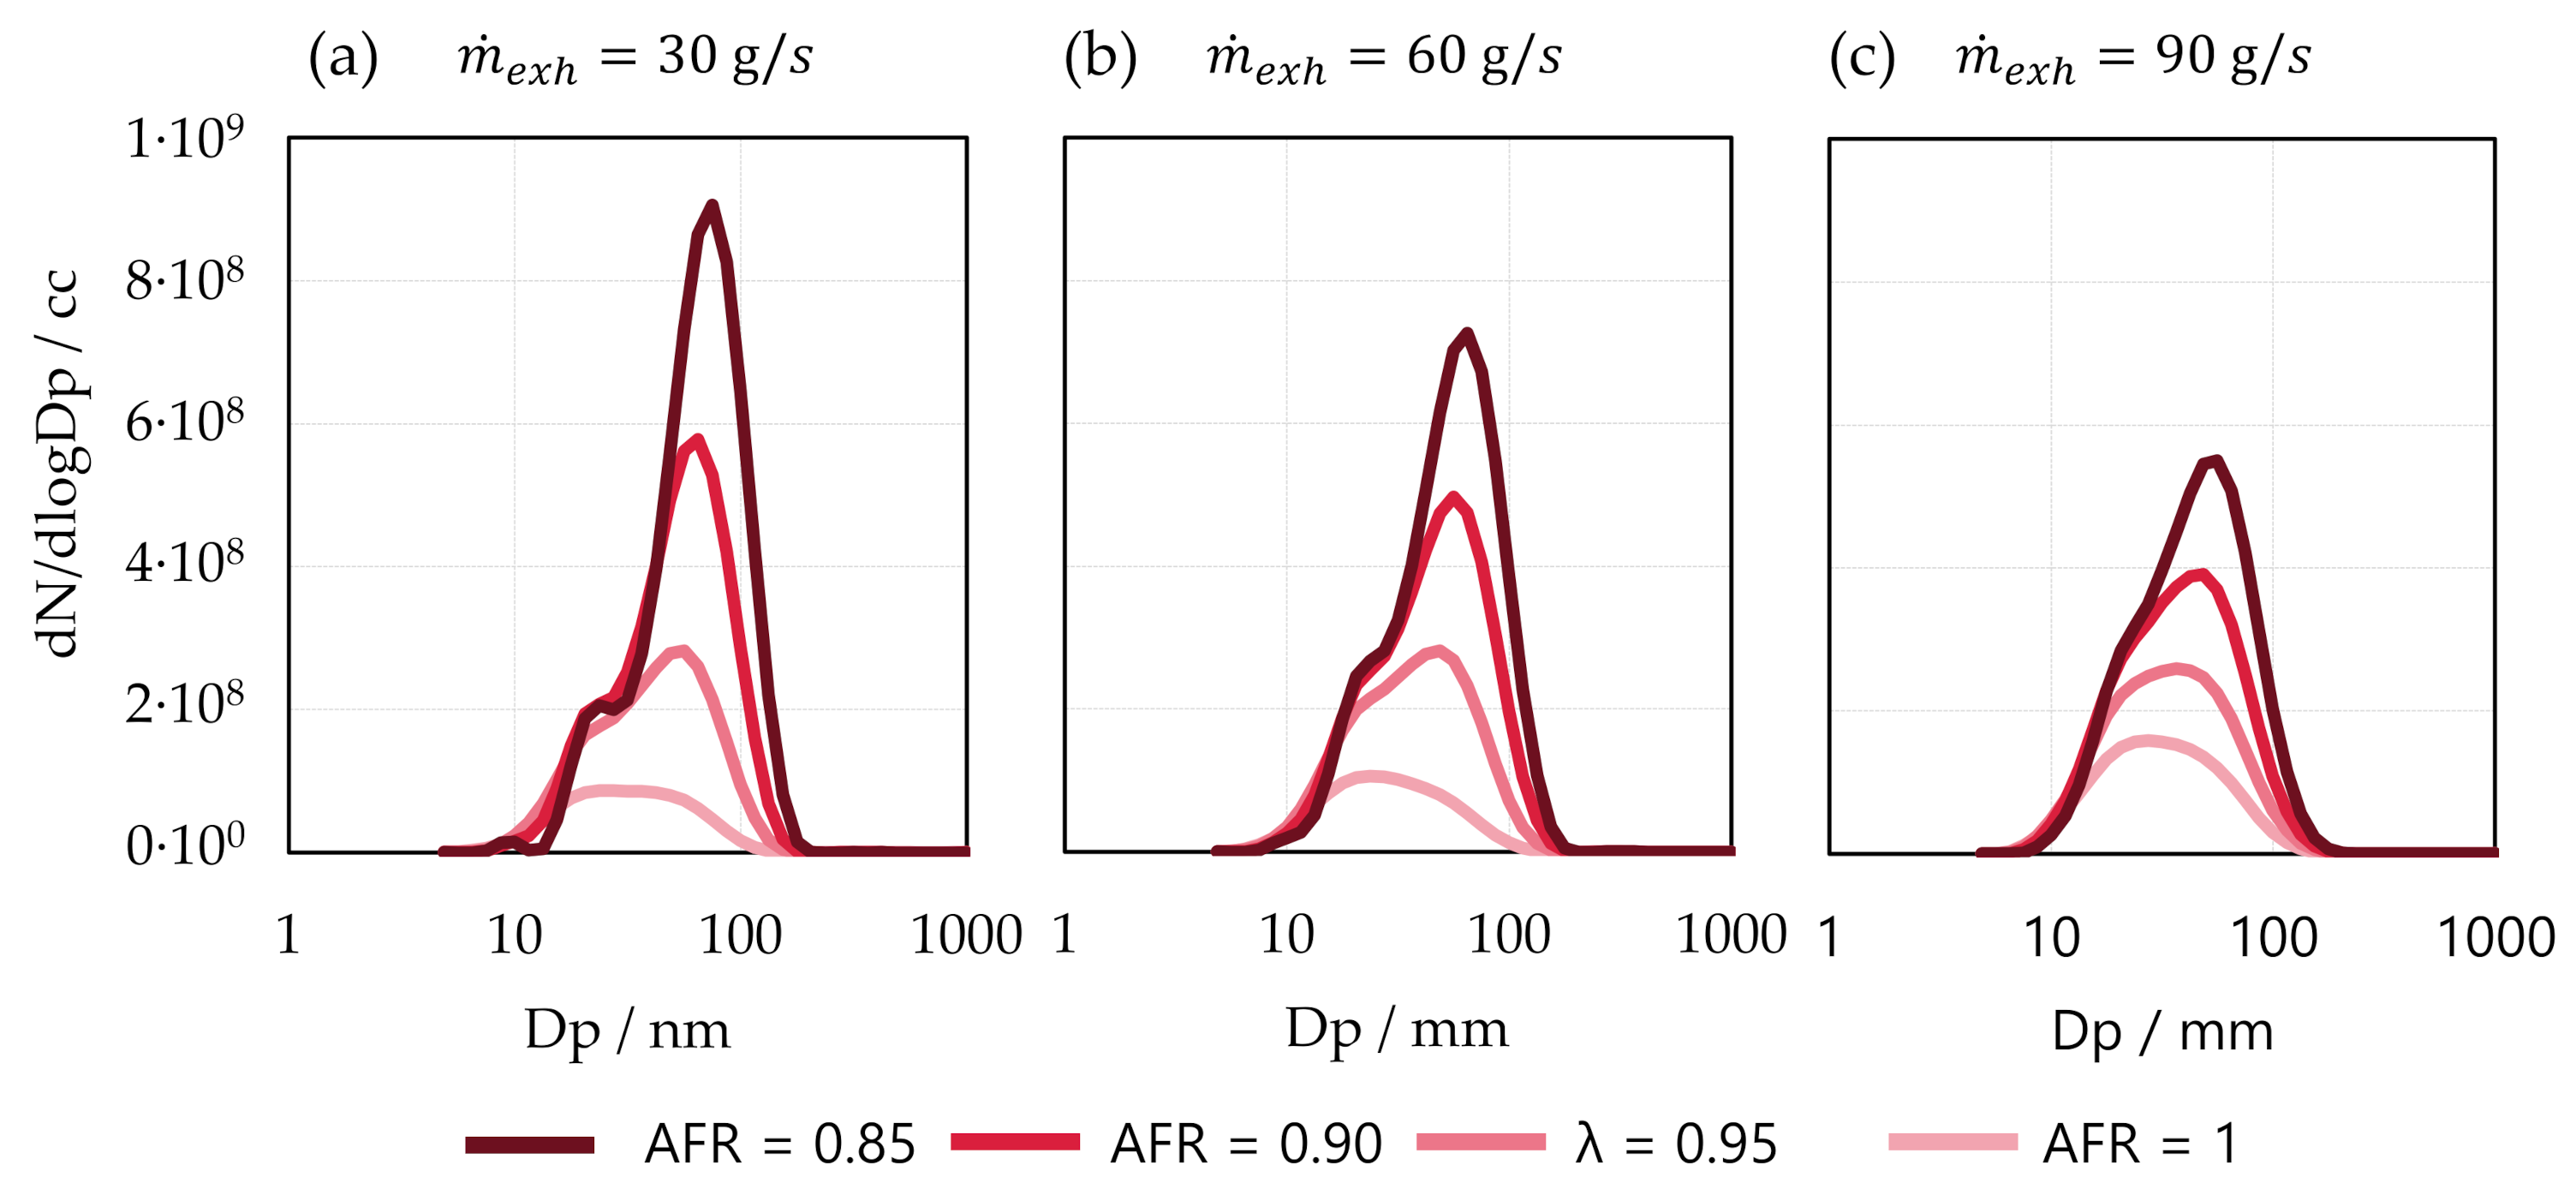
At a constant exhaust temperature of T e x h = 600   ° C , a matrix of 12 individual tests was performed. Fuel and air temperature were kept constant close to a standard room temperature of 23 °C. For each respective operating point, the burner was made to run for at least 5 min to ensure steady-state conditions were reached. The size spectral density curves were plotted for each operating point, as shown in Figure 6. The behaviour of PN concentration and the size distribution depending on exhaust gas mass flow rate and AFR have already intensively being discussed in the literature [35,36].
Out of these plots, the respective GMDs and the maximum PN concentrations are derived, which are presented in Figure 7.
For the third parameter variation (exhaust gas temperature T e x h ), the mass flow rate and temperature were kept constant. Derived from Figure 7, the operating point with m ˙ e x h = 60 g/s and AFR = 0.95 is the most suitable, since the emitted soot particles have a GMD = 36 nm, which is almost identical to the target GMD of 35 nm (measured during cold start of the vehicle), as well as having relatively high PN emissions, which is advantageous for rapid soot loading.
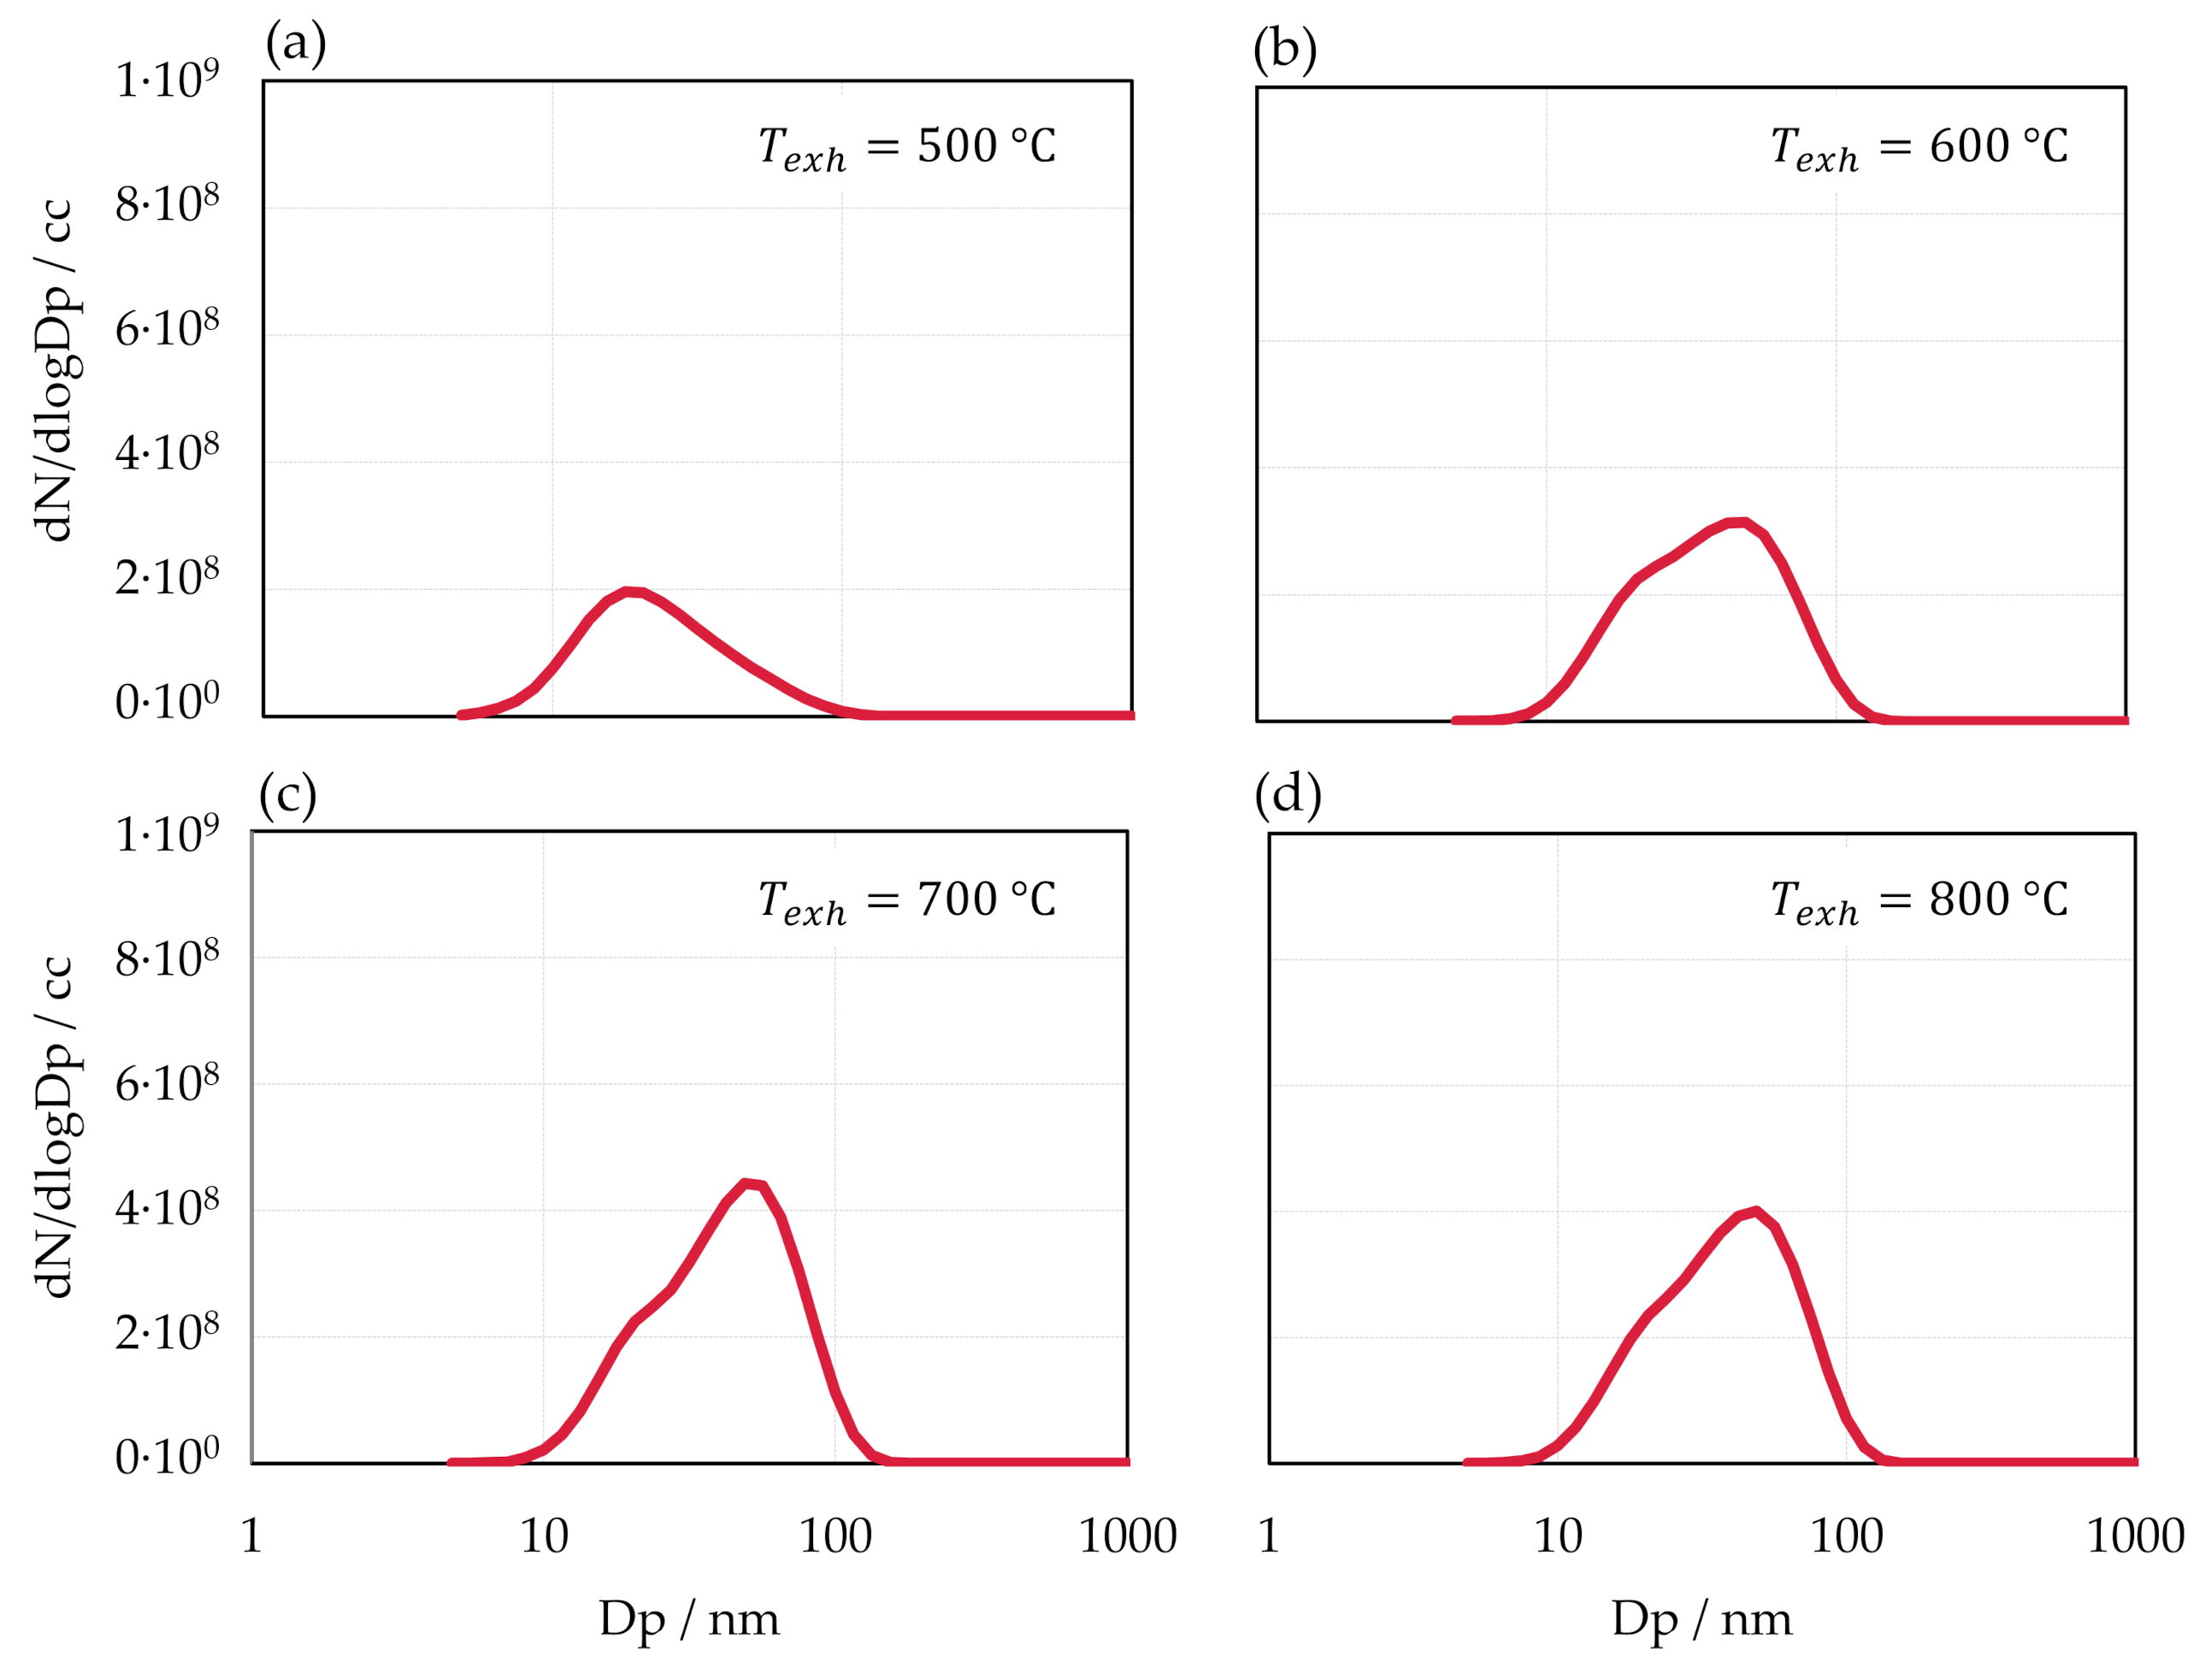
The exhaust gas temperature (measured at the inlet of the GPF) at the burner bench was adjusted by controlling the EGR rate. For higher exhaust gas temperatures, the proportion of EGR was reduced relative to the fresh exhaust and vice versa. The size spectral density curves associated with the temperature variations are shown in Figure 8.
It can be observed that for increasing exhaust gas temperature, the total PN concentration and the GDM increase in the T e x h = 500 700   ° C range. This relationship is a consequence of controlling the temperature via exhaust gas recirculation. As already briefly mentioned in the chapter ‘Material and Methods’, the EGR is taken from the stack and fed to the burner test bench for cooling purposes. However, if higher exhaust gas temperatures are desired, the EGR fraction, which has already passed through the particulate filter and only contains a low concentration of particulates, decreases. Since the entire exhaust gas mass flow rate will now consist largely of fresh, unfiltered air, the particle concentration in the exhaust gas also increases as a result. Moving from T e x h = 700   ° C to T e x h = 800   ° C , the PN concentration decreases, which is counterintuitive to the aforementioned explanation. However, this reversed trend can be explained by the so-called Boudouard reaction that commonly occurs between temperatures of 700 and 800 °C [37,38].
Combining all the knowledge gained from the parameter variation campaign conducted on the burner bench, the operating point that shows the highest resemblance in terms of the emitted soot characteristics to that of the vehicle has the following parameters:
Derived from Figure 6, Figure 7 and Figure 8, the parameter combination listed in Table 7 was used for the subsequent soot loading and regeneration investigations. Considering Figure 7, a GMD of 36 nm and a maximum PN concentration of 3.0 · 10 8   # c m 3 for the respective operating point were generated.
Figure 9 shows DMS500 contour plots depicting the size distribution of cold-start soot particles produced in the vehicle at T C o o l a n t = 15   ° C versus the soot particles reproduced with the burner bench using the parameters listed in Table 7. Both top and mid (33–63 s zoom of the top diagram) diagrams show that the size distribution measured dTWC at the vehicle is centred around the 35 nm area during the catalyst heating phase. Comparing this to the bottom diagram of Figure 9, a comparable size distribution can be observed.
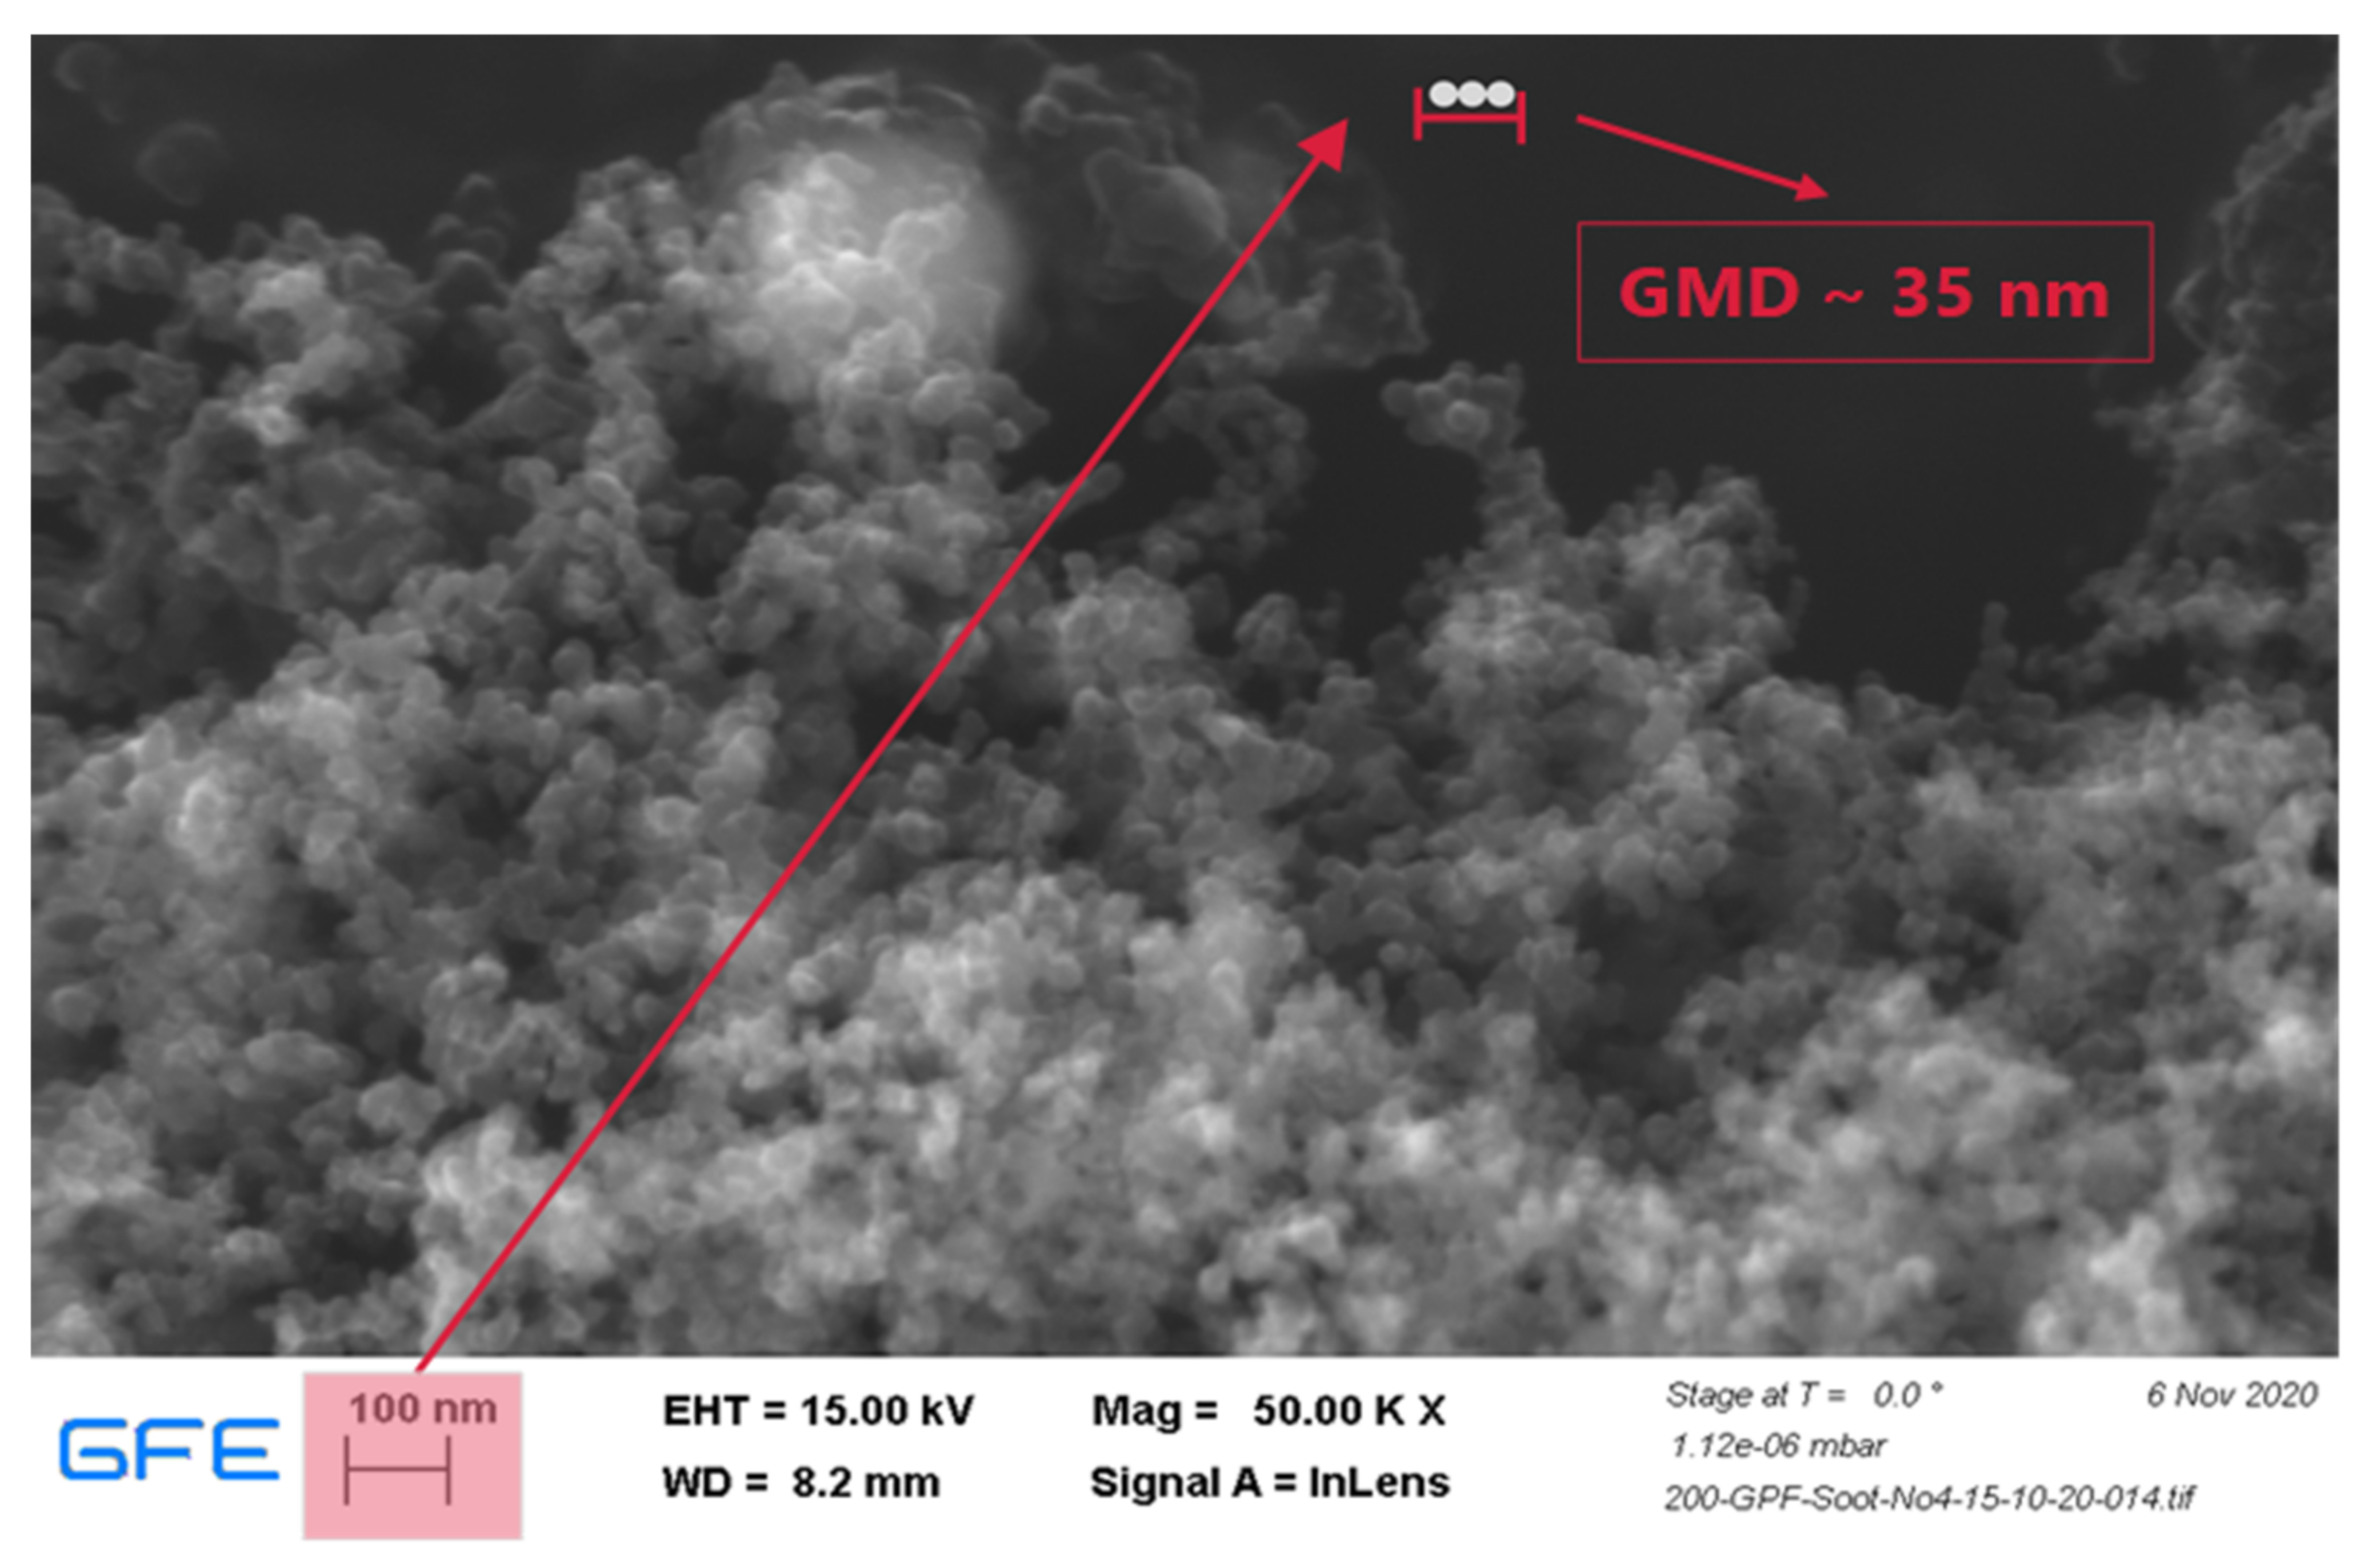
To further validate the quality of the soot particles produced at the burner bench, its chemical morphology had to be compared to that of what is typically produced by a GDI engine during cold starts. A sample of the burner soot particles was collected from the GPF’s inlet side monolith and inspected using a scanning electron microscope (SEM) and energy-dispersive X-ray analysis (EDX).
Figure 10 shows an SEM image of the burner soot particles at a magnification of 50,000×. At this high magnification, the individual soot particles (carbonaceous spheres) can actually be seen and their size (35 nm diameter) can be easily, compared relative to the 100 nm scale shown at the bottom left corner.
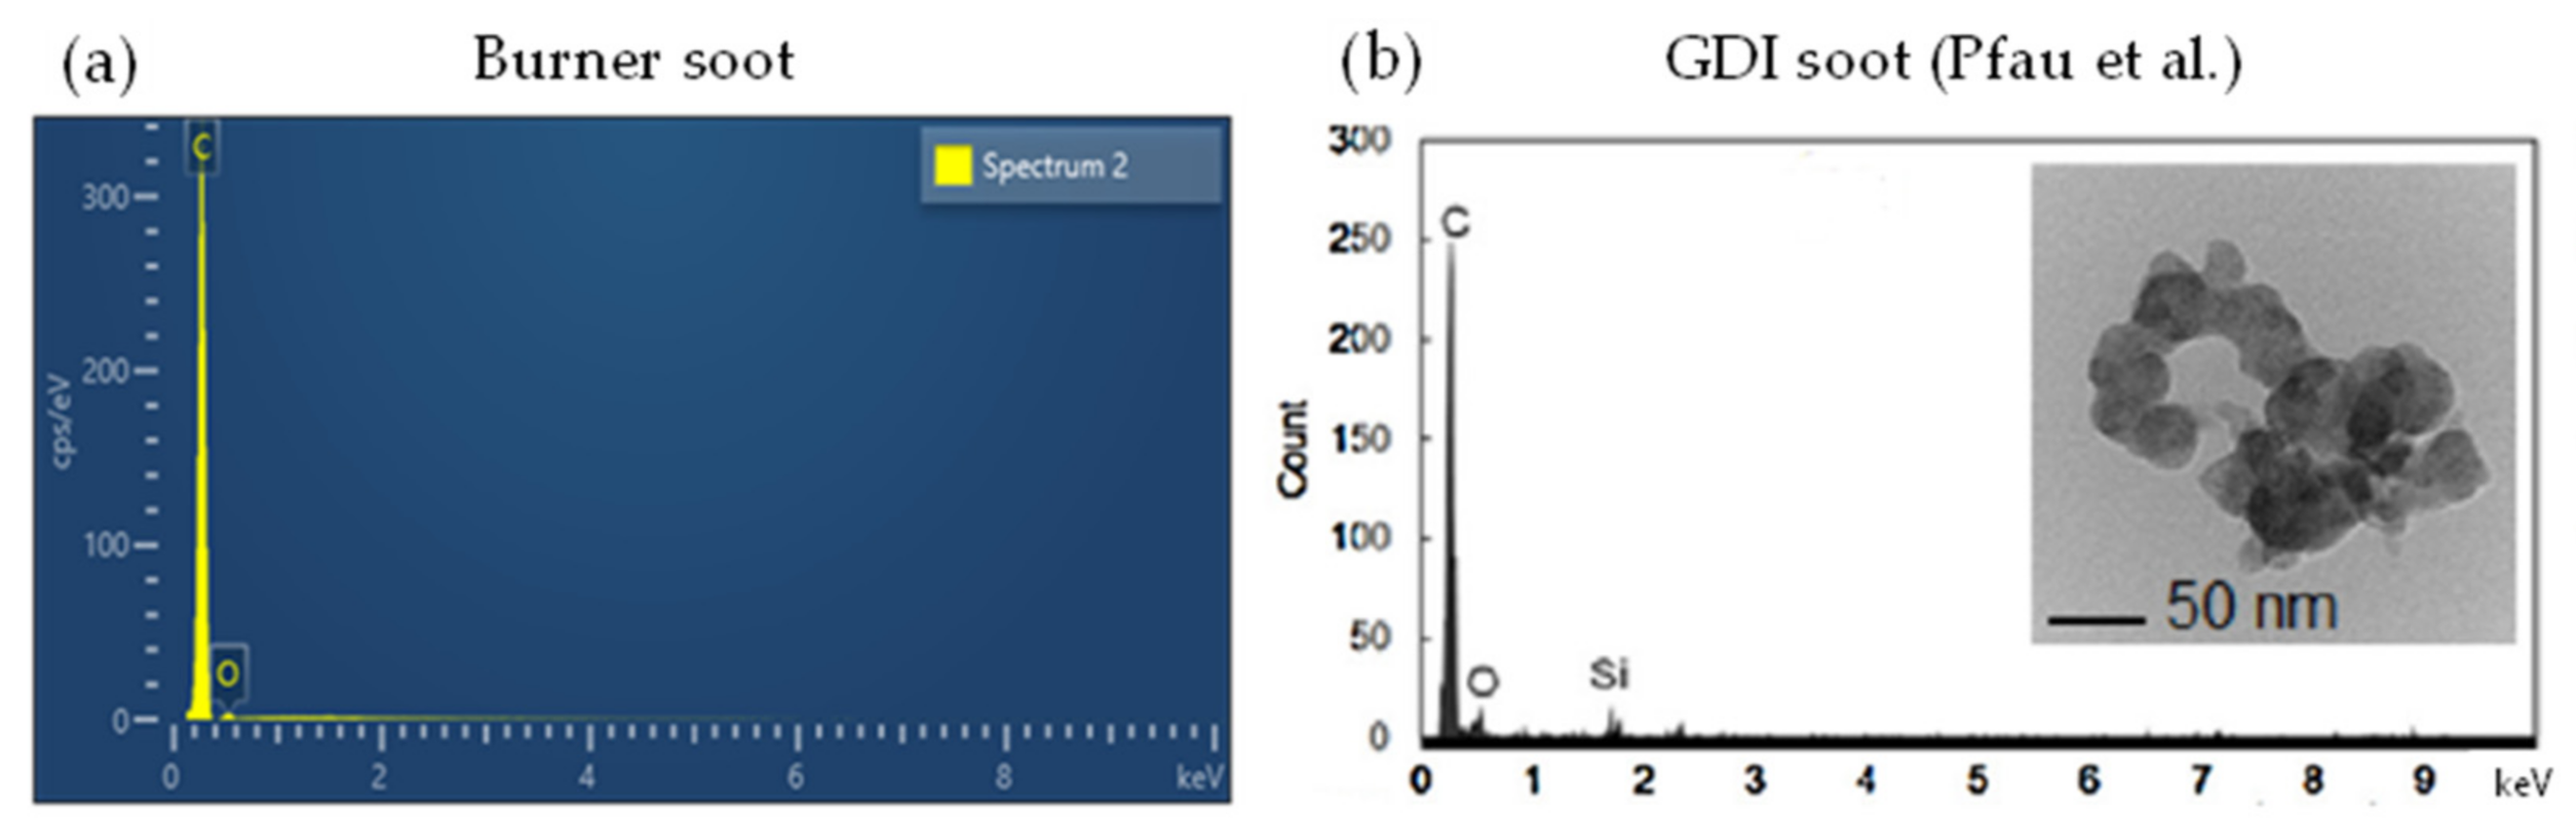
The EDX analysis of the sample inspected in Figure 10 is shown below in Figure 11a. The single peak of carbon further verifies the carbonaceous nature of the soot particles. Comparing it to similar EDX analysis performed by Pfau et al. and Maskey et al. on GDI emitted soot particles, the burner soot particles show almost identical results [39,40].
Having the same morphology as cold-start soot particles, the following step was to examine the appropriateness of conducting two GPF calibration work packages on the burner test bench setup to validate the functionality of the entire proposed process.

3.2. GPF Loading and Regeneration

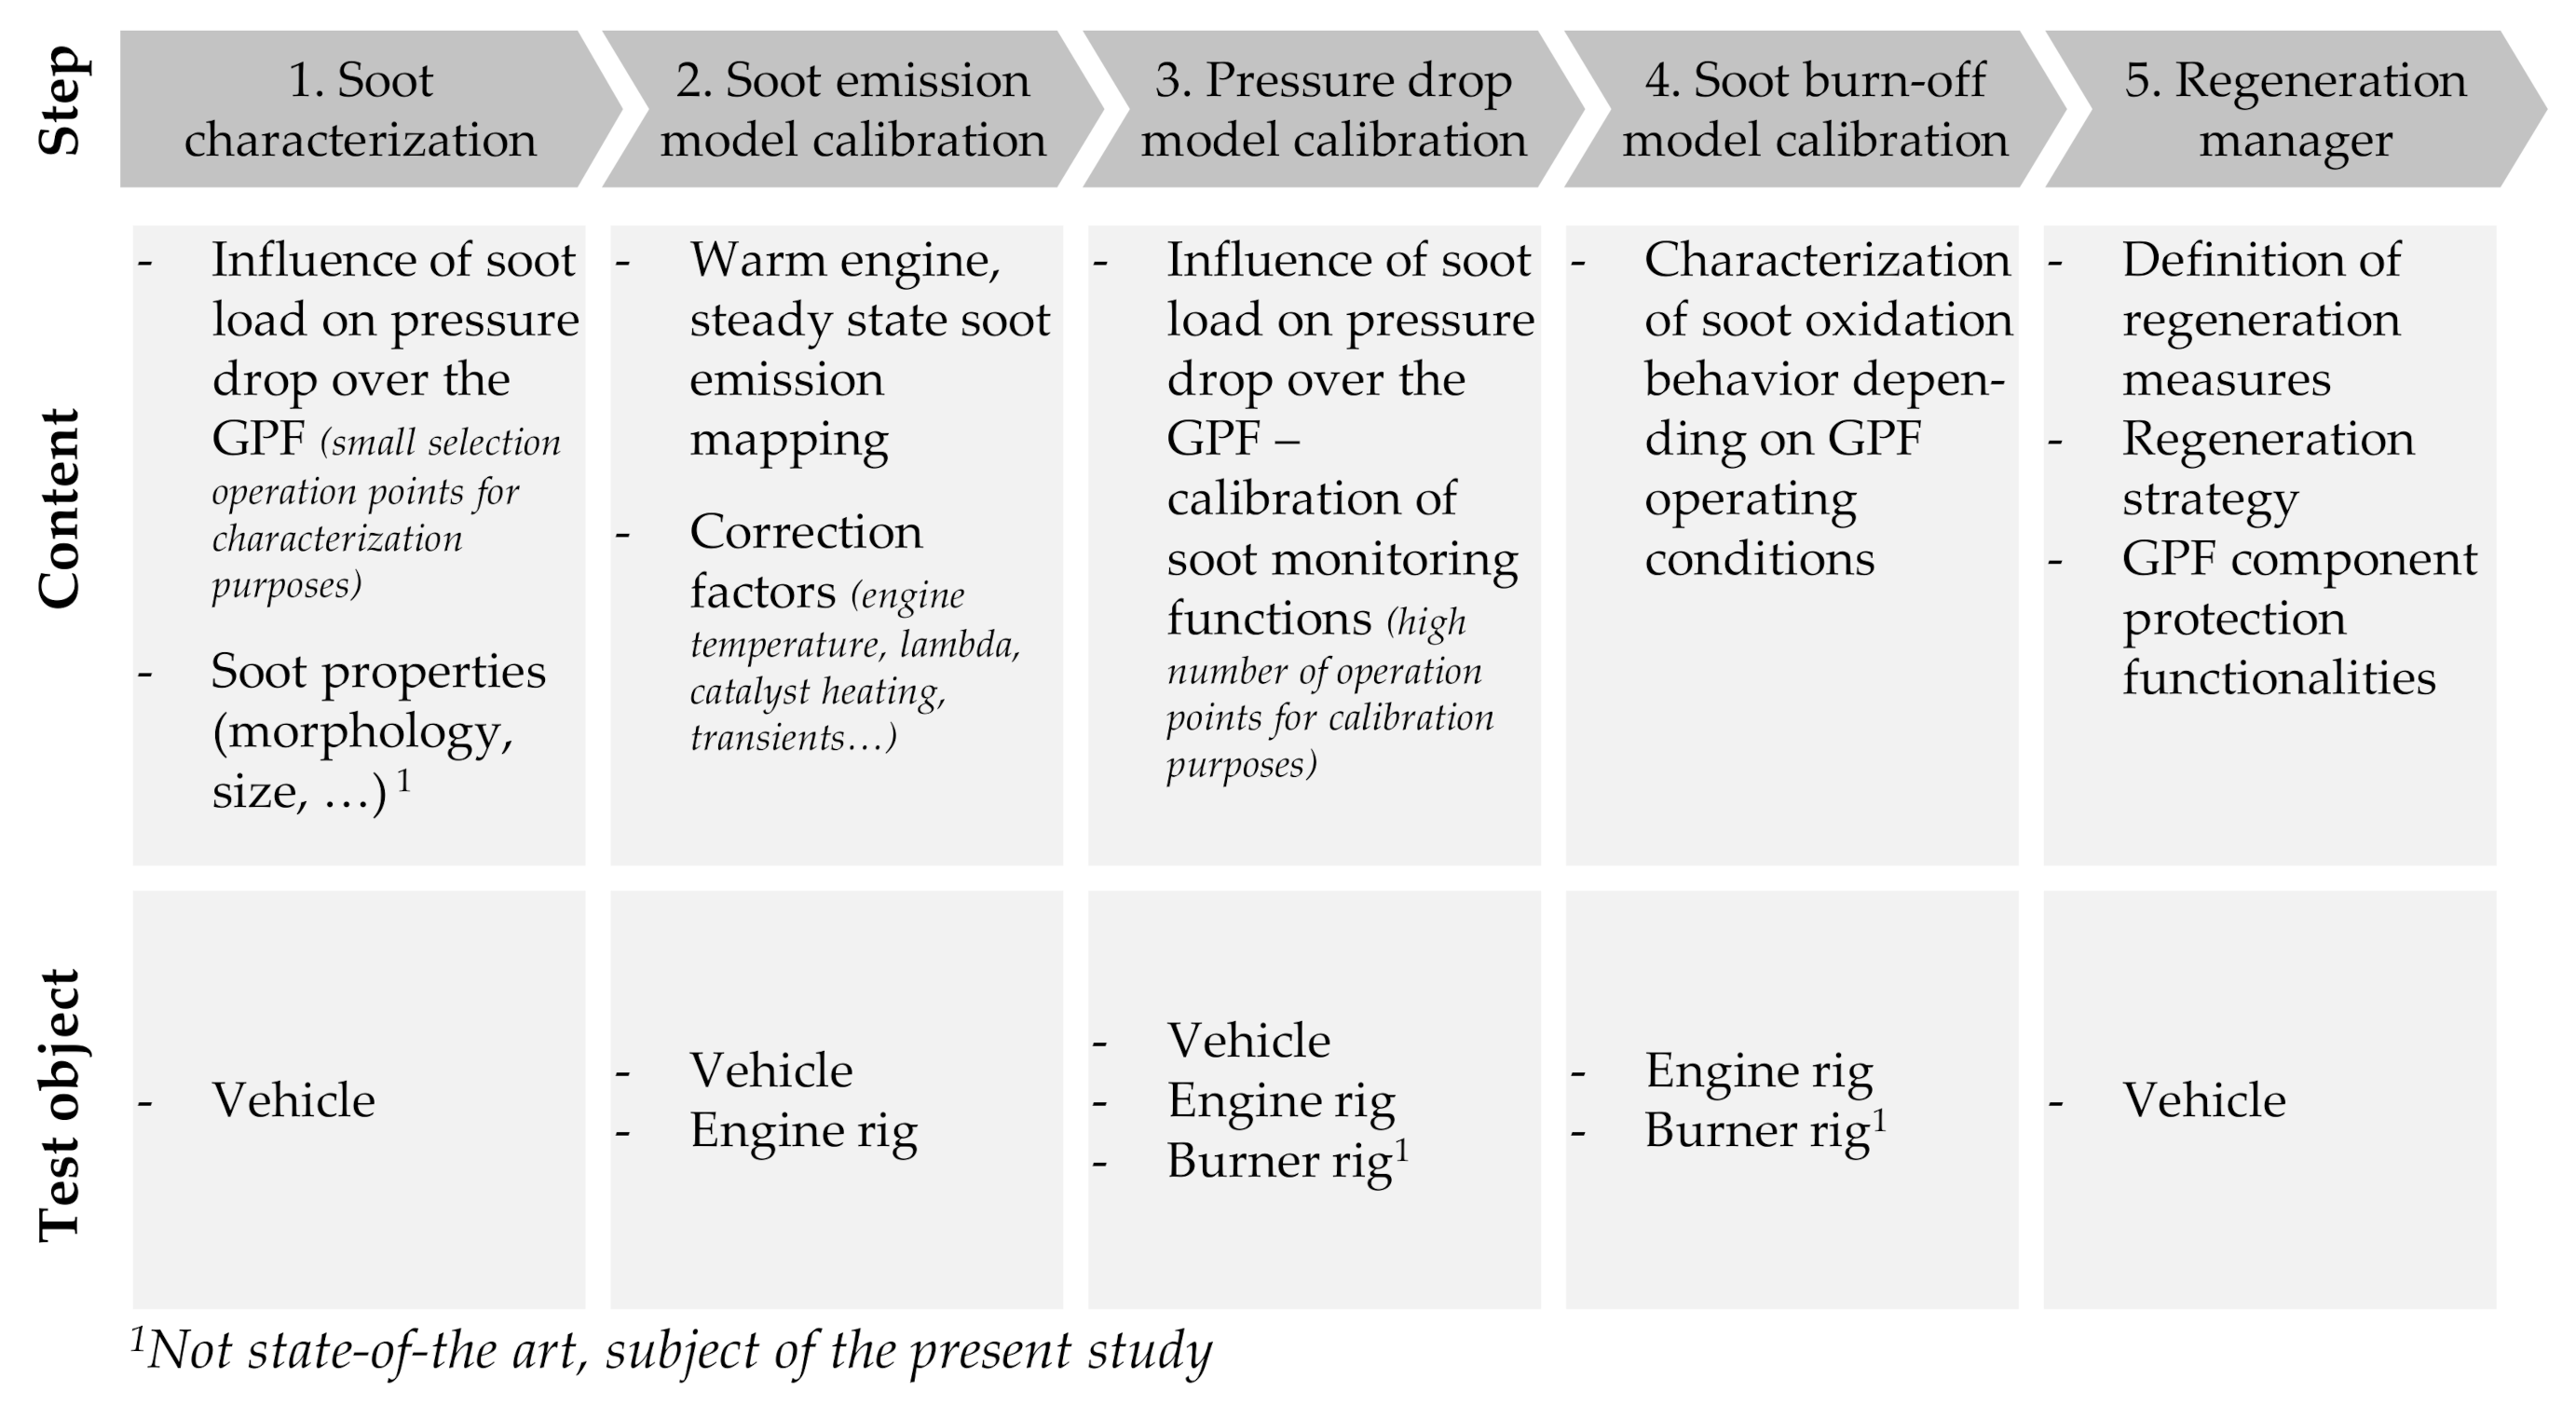
The final demonstration to verify the feasibility of the proposed methodology relates to the investigation of how well GPF calibration activities such as backpressure and regeneration calibration (Figure 1, steps 3 and 4) can be performed on the burner test bench. In order to perform these two work packages, the GPF was loaded with the accurately produced cold-start soot particles, with immense advantages in terms of reduced soot loading time and independent execution from the engine test bench. This is described in detail in the following section.
Figure 12 shows the relationship between the soot mass loaded and the time required to generate that mass. With the burner bench, around 30 min of operation is required to load the GPF with 7 g of vehicle-like cold-start soot particles, while it takes an average of 7 h of engine operation on the ETB to produce the same amount of soot particles (extrapolation of the engine test bench results). In other words, the soot loading time can be shortened by more than 93% with the burner bench.
For calibration of the ECU’s pressure drop model (Figure 1, step 3), backpressure measurements for various filter soot loads need to be performed. To transfer this work from ETB to a burner test bench, a similar backpressure behaviour must be ensured. For the respective differential pressure measurements (Table 1, step 4), the burner was made to operate with the parameters, listed in Table 8, such that it produces exhaust gases identical to that on the ETB. In this way, the pressure drop across the GPF caused by burner soot particles could be compared with the respective ETB measurements.
The behaviour of the differential pressure across the GPF at different soot loads is shown in Figure 13.
To validate the truthfulness of the GPF backpressure behaviour on the burner test bench, it is compared to ETB measurements which are performed in parallel using the same boundary conditions as listed in Table 8. It is also important to mention that the ETB soot is already aimed at matching the differential pressure data obtained from the vehicle during cold starts. However, the soot characteristics were not morphologically verified in the current work. Figure 13 compares the backpressure behaviour of the GPF when exhaust gas was applied at the burner bench, on the ETB, and during the vehicle tests.
It is obvious that the backpressure behaviour caused by the soot particles produced by the burner corresponds well to that measured on the engine test bench and during the vehicle tests.
The second category of calibration work packages to be carried out using the burner test bench is the calibration of the soot burn-off model (Figure 1, step 4). Here, too, the results obtained on the burner test bench are compared with the results of measurements already performed on the ETB in order to check the adequacy and robustness of the process.
Two different aspects are selected as main points of comparison; the maximum GPF temperature reached during the regeneration process and the average soot oxidation rate. As before, the active regeneration campaign was conducted with the same exact operating parameters that were selected during the parallel campaign at the ETB. These parameters, which are typical for an active regeneration event, are listed in Table 9.
Figure 14 shows the regeneration phase (~200 s, AFR > 1) and compares the maximum GPF temperatures during the regeneration process at the burner test bench and during ETB operation. The recorded maximum temperature at the burner test bench was 699.5 °C, compared to 700.4 °C at the ETB; this corresponds to a difference of less than 0.2%.
The second important aspect for the comparison is the average soot oxidation rate. For this purpose, the GPF was weighed before ( m s o o t , b _ r e g e n ) and after the regeneration event ( m s o o t , a _ r e g e n ), and the resulting soot mass difference was divided by the regeneration duration ( t r e g e n ) as defined in Equation (3).
m ˙ s o o t _ o x i = m s o o t , b _ r e g e n m s o o t , a _ r e g e n t r e g e n
The soot oxidation rate can indirectly be monitored by looking at the pressure drop across the GPF during the regeneration process. As the regeneration occurs, the soot particles become oxidised, the filter becomes less restricted, the flow resistance decreases, and thus the pressure drop (at a constant mass flow rate) gradually declines. This is displayed in Figure 15, where the pressure drops across the GPF (at the burner and ETB) are plotted over the 200 s of regeneration. Similar to the GPF temperature behaviour, the pressure drop profiles are almost identical.
For the burner test bench measurements, the initial soot load is 4.2 g, and the final load after regeneration is 2.7 g. For the ETB measurements, these numbers are at 3.97 g and 2.8 g, respectively. This results in a soot oxidation rate of 0.38 g/min at the burner test bench, compared to 0.35 g/min at the ETB.

4. Discussion

The contour plots for both cold-start measurements at T C o o l a n t = 15   ° C depicted in Figure 4, which are representative for all the cold-start measurements conducted in the vehicle, prove the reproducibility of the DMS500 system for measurements executed on, e.g., different weekdays. Both size distribution curves (Figure 5) which are derived from Figure 4 do not follow the usual bimodal shape where two peaks exist (see, e.g., Giechaskiel et al. [30] and Tabata et al. [41]), one in the nucleation mode and one in the accumulation mode. On the contrary, the measurements show that during the cold start of the engine, PN downstream the TWC has a distinct size distribution curve characterised by a single peak centred around the nucleation mode in the 20–30 nm range. This modal shape is in line with cold-start investigations conducted by Badshah et al. [42]. Comparing the size distributions curves presented by Giechaskiel et al. [30] and Tabata et al. [41] versus the results documented by Badshah et al. [42] and the results from Figure 4 and Figure 5, it can be concluded that soot properties for soot obtained during warm engine operation versus cold-start soot differs strongly in terms of their size distribution. As explained by, e.g., Dorscheidt et al. [12], the size distribution of the soot could have a significant effect on the penetration depth of the particulates into the filter wall and on the ratio deep-bed versus soot cake filtration depending on the soot load, hence on the backpressure behaviour of the respective component. Therefore, being able to reproduce comparable size distribution curves is one elementary prerequisite to shifting GPF calibration activities to the burner test bench.
As shown in the contour plot in Figure 9, the burner test bench is able to reproduce vehicle cold-start soot produced during the catalyst heating phase with similar size distribution characteristics and concentration levels at a burner operating point of A F R = 0.95 , T e x h = 600   ° C and m ˙ e x h = 60 g s . The use of the burner test bench as an artificial soot generator offers the following advantages:
  • As can be seen in Figure 6Figure 7 and Figure 8, soot properties in terms of size distribution and concentration can be freely regulated by independently controlling the exhaust gas mass flow rate, the exhaust gas temperature, and the airflow rate. This is a mandatory requirement for the transfer of GPF-related calibration tasks to the burner test bench, as each engine configuration is likely to emit soot with varying properties.
  • From a closer look at Figure 9, it can be concluded that the burner test bench is able to maintain the soot properties at a constant level over a long period of time. This fact allows for reproducible and robust results when a large number of GPF loading tests for calibration purposes are required. Comparing the burner with the vehicle measurement results in Figure 9 also suggests that maintaining the respective soot properties allows very fast GPF loading, as the cold-start soot properties are continuously provided.
  • The burner setup can be extended with additional hardware functionalities to increase the degrees of freedom in terms of soot reproduction. Adding an oil injection unit for example, as already presented by Sterlepper et al. [31], enables the burner bench to produce soot with a bi-model-shaped size distribution curve (Tabata et al. [41]). This feature may be a compelling requirement for reproducing soot characteristics for some engine configurations. However, the effect of oil injection on soot morphology and the following reactivity needs further investigation.
In addition to the size distribution, the morphology, which has a direct effect on the soot reactivity, is according to Figure 10 and Figure 11 using the method of SEM and EDX analysis also closely in line with that of gasoline soot. Since the comparison with gasoline soot presented in this study is just based on the literature, more detailed fundamental investigations into the morphology of cold-start soot must be carried out in the future (e.g., STA analysis) in order to determine the cold-start soot reactivity under a wide range of cold start temperature and engine operating conditions. However, Figure 12, Figure 13, Figure 14 and Figure 15 show that the soot quality produced by the burner is already suitable for the execution of several GPF related calibration tasks such as pressure drop calibration (Figure 1, step 3) and soot burn-off model calibration (Figure 1, step 4) and, moreover, that significant advantages in terms of GPF soot loading time can be achieved.
  • By comparing the soot load vs. loading time trendline of both engine test bench and burner test bench (Figure 12), a 93% reduction in the GPF soot loading time can be achieved for a soot loading range of 0–7 g. As an indicative value for an exemplary calibration, a filter load of 2 g/L is usually set to trigger measures enabling active GPF regeneration. GPF loading measurements with loadings greater than 2 g/L (mostly up to 4 g/L) are required to verify the characteristics of an overloaded filter and to calibrate the measures for an active workshop regeneration accordingly. Therefore, the method covers the entire loading range which is required for GPF control calibration.
  • Since one is able to produce soot at the burner test bench with the same characteristics in terms of its size distribution, a realistic backpressure behaviour for the loading measurements has already been presumed in an early stage of the investigations. The final prove is depicted in Figure 13, where the pressure drop behaviour over the GPF is compared to the ones obtained in the vehicle and the engine test bench. It is showing its typical characteristic, namely, the change in slope that can be observed around the 0.7 g point. This point marks the so-called soot knee, where the transition from deep-bed to soot cake filtration occurs. Such differential pressure behaviour is expected and is described in detail by Chiavola et al. [43] The correct calibration of the pressure drop model (Figure 1, step 3), which is included in the soot simulation model, is of great importance, as it is used to estimate the actual GPF loading on which the correct initiation of the (active) regeneration measures rely. Too early GPF regenerations can cause unnecessary regeneration events, which have a strong impact on pollutant emissions (e.g., lean operation causes increased NOx emissions) and/or fuel consumption (e.g., ignition retardation for GPF heating purposes causes engine efficiency losses). Too late GPF regenerations could lead to engine operation with an unnecessarily high exhaust backpressure and thus negatively influence the fuel consumption of the engine. Furthermore, an underestimating loading model can lead to unexpectedly excessive component temperatures due to the exothermic reaction of soot during regeneration which can lead to a component malfunction.
  • From a relative difference of 7.8% between the soot oxidation rates determined during a regeneration event at both burner and engine test bench (Figure 15) and an absolute difference of only <1 °C between the respective maximum GPF temperatures (Figure 14), a comparable soot reactivity can be assumed. The differences are well within the acceptable accuracies given the small difference in initial soot loading and the measurement errors typically associated with the GPF weighing procedures. With this prove, a transfer of soot burn-off model calibration tasks (Figure 1, step 4) to the burner test bench can be ensured. The importance of a valid soot simulation model, which includes the soot burn-off model, has already been explained in the previous subitem.

5. Conclusions

From the significant reduction in GPF soot loading time at the burner test bench, while maintaining the exact soot properties required for GPF control calibration purposes (e.g., backpressure, regeneration temperature, and soot burn-off behaviour), the following conclusions for the presented method can be derived:
  • If the same number of gravimetrical weighings for GPF pressure drop and soot burn-off calibration (Figure 1; steps 3 and 4) is maintained, a strong reduction in total project time and thus costs can be achieved.
  • If no project time reduction is aimed, the number of gravimetrical weighings can be greatly increased. This results in a significant increase in the robustness of the weighing results and thus the final calibration. Obviously, a specific combination of points 1 and 2 would be conceivable as well.
  • Eliminating the use of the respective target engine to perform selected calibration work packages allows for a significantly more flexible development process that does not heavily rely solely on expensive resources, such as engine test benches and prototype engines.

6. Patents

DE 10 2021 002 516—‘Verfahren zum Beladen und/oder Regenerieren eines Partikelfilters mit Ruß und/oder Asche und zum Kalibieren einer Steuerungseinrichtung’.

Author Contributions

Conceptualisation, F.D. and P.S.; methodology, F.D. and P.S.; validation, A.M.A.; formal analysis, A.M.A.; investigation, A.M.A.; resources, M.G.; data curation, A.M.A.; writing—original draft preparation, F.D. and A.M.A.; writing—review and editing, S.P., J.C., S.K., and S.S.; visualisation, F.D. and A.M.A.; supervision, M.N. and M.G.; project administration, F.D. All authors have read and agreed to the published version of the manuscript.

Funding

The presented research was carried out at the Center for Mobile Propulsion (CMP) of RWTH Aachen University, funded by the German Science Council ‘Wissenschaftsrat’ (WR) and the German Research Foundation ‘Deutsche Forschungsgemeinschaft’ (DFG).

Institutional Review Board Statement

Not applicable.

Informed Consent Statement

Not applicable.

Acknowledgments

The authors thank Jim Cox and Daniel Eiling from the department Hybrid Powertrain Calibration of FEV Europe GmbH for their support.

Conflicts of Interest

The authors declare no conflict of interest.

References

  1. Lanzerath, P.; Wunsch, R.; Schön, C. The first series-production particulate filter for Mercedes-Benz gasoline engines. In Internationales Stuttgarter Symposium, 17th ed.; Bargende, M., Reuss, H.-C., Wiedemann, J., Eds.; Springer: Wiesbaden, Germany, 2017; pp. 851–865. ISBN 978-3-658-16987-9. [Google Scholar]
  2. BASF. Four Ways to a Clean Gasoline Engine, Compact Catalytic Converter System from BASF Removes Gaseous Pollutants as Well as Particulates; BASF: Ludwigshafen, Germany, 2014. [Google Scholar]
  3. Hentschel, L.; Demmelbauer-Ebner, W.; Theobald, J.; Wendt, W.; Thiele, M.; Blume, H. The New 1.0 l TSI with 85 kW and Petrol Particulate Filter—Clean, Efficient Performance for the Up! GTI. In Aachener Kolloquium, 26th ed.; Aachener Kolloquium: Aachen, Germany, 2017. [Google Scholar]
  4. Achleitner, E.; Frenzel, H.; Grimm, J.; Maiwal, O.; Rösel, G.; Senft, P.; Zhang, H. Systemansatz für ein Fahrzeug mit Benzindirekteinspritzung und Partikel Filter im RDE. In Proceedings of the 39th Internationales Wiener Motorensymposium, Wien, Austria, 26–27 April 2018; Lenz, H.P., Geringer, B., Eds.; Springer: Wiesbaden, Germany, 2018. [Google Scholar]
  5. Proust, M.; Arandyelovitch, A.; Trochet, P.; Mohsen, O.; Gödecke, T.; Koch, P.; Maass, T.; Schnüpke, H. The New 1.0-Liter Turbo Gasoline Engine from the Renault-Nissan Alliance—HR10DDT. In Proceedings of the 27th Aachener Kolloquium, Aachen, Germany, 8–10 October 2018. [Google Scholar]
  6. Görgen, M.; Sterlepper, S.; Herrmann, S.; Hendrikx, M.; Nijs, M.; Scharf, J. Gasoline Particulate Filters: Market and Technology Trends and their Impact on Calibration. In Proceedings of the SIA Powertrain, Versailles, France, 7–8 June 2017. [Google Scholar]
  7. Archer, G. Principles for Euro Final Standards. In European Comission Stakeholder Meeting; European Comission: Brussels, Belgium, 2018. [Google Scholar]
  8. CLOVE Consortium. Study on Post-EURO 6/VI Emission Standards in Europe; CLOVE: Brussels, Belgium, 2021. [Google Scholar]
  9. Morakinyo, O.M.; Mokgobu, M.I.; Mukhola, M.S.; Hunter, R.P. Health Outcomes of Exposure to Biological and Chemical Components of Inhalable and Respirable Particulate Matter. Int. J. Environ. Res. Public Health 2016, 13, 592. [Google Scholar] [CrossRef] [PubMed]
  10. Gerlofs-Nijland, M. SUREAL-23 Final Workshop: Health Effect of Engine Exhaust Nanoparticles; SUREAL-23: Lyon, France, 2019. [Google Scholar]
  11. Lucking, A.J.; Lundbäck, M.; Barath, S.L.; Mills, N.; Sidhu, M.K.; Langrish, J.P.; Boon, N.A.; Pourazar, J.; Badimon, J.J.; Gerlofs-Nijland, M.E.; et al. Particle Traps Prevent Adverse Vascular and Prothrombotic Effects of Diesel Engine Exhaust Inhalation in Men. Circulation 2011, 123, 1721–1728. [Google Scholar] [CrossRef] [PubMed] [Green Version]
  12. Dorscheidt, F.; Sterlepper, S.; Görgen, M.; Nijs, M.; Claßen, J.; Yadla, S.K.; Maurer, R.; Pischinger, S.; Krysmon, S.; Abdelkader, A. Gasoline Particulate Filter Characterization Focusing on the Filtration Efficiency of Nano-Particulates Down to 10 nm. In SAE Technical Paper Series; SAE International: Warrendale, PA, USA, 2020. [Google Scholar]
  13. Giechaskiel, B.; Lähde, T.; Drossinos, Y. Regulating particle number measurements from the tailpipe of light-duty vehicles: The next step. In Environmental Research; Elsevier: Amsterdam, The Netherlands, 2019; Volume 172, pp. 1–9. [Google Scholar]
  14. Papaioannou, E.; Zarvalis, D.; Vlachos, N.; Zinola, S.; Nicol, G. SUREAL-23 Final Workshop: Measuring and Regulating SUB-23 nm Particle Emissions from Measuring and Regulating Sub-23 nm Particle Emissions from Light duty Powertrains: Questions and Answers from 3 years of h2020 Research; SUREAL-23: Lyon, France, 2019. [Google Scholar]
  15. Focsa, C. Measuring Traffic-Related Sub-23 nm Particles: The PEMS4Nano Project; SUREAL-23: Lyon, France, 2019. [Google Scholar]
  16. Thewes, M.; Balazs, A.; Yadla, S.K.; Walter, V.; Görgen, M.; Scharf, J.; Sterlepper, S.; Voßhall, T. Zero-Impact Combustion Engine. In Proceedings of the 28th Aachener Kolloquium, Aachen, Germany, 7–9 October 2019. [Google Scholar]
  17. Krysmon, S.; Dorscheidt, F.; Claßen, J.; Düzgün, M.; Pischinger, S. Real Driving Emissions—Conception of a Data-Driven Calibration Methodology for Hybrid Powertrains Combining Statistical Analysis and Virtual Calibration Platforms. Energies 2021, 14, 4747. [Google Scholar] [CrossRef]
  18. Claßen, J.; Krysmon, S.; Dorscheidt, F.; Sterlepper, S.; Pischinger, S. Real Driving Emission Calibration—Review of Current Validation Methods against the Background of Future Emission Legislation. Appl. Sci. 2021, 11, 5429. [Google Scholar] [CrossRef]
  19. Claßen, J.; Pischinger, S.; Krysmon, S.; Sterlepper, S.; Dorscheidt, F.; Doucet, M.; Reuber, C.; Görgen, M.; Scharf, J.; Nijs, M.; et al. Statistically supported real driving emission calibration: Using cycle generation to provide vehicle-specific and statistically representative test scenarios for Euro 7. Int. J. Engine Res. 2020, 21, 1783–1799. [Google Scholar] [CrossRef]
  20. Claßen, J.; Sterlepper, S.; Dorscheidt, F.; Görgen, M. RDE-Cycle-Generation—A Statistical Approach to Provide a Secure Base to Approve RDE Legislation Compliance. In Symposium for Combustion Control; Symposium for Combustion Control: Aachen, Germany, 2019. [Google Scholar]
  21. Claßen, J.; Sterlepper, S.; Dorscheidt, F.; Görgen, M.; Scharf, J.; Nijs, M.; Alt, N.; Balazs, A.; Böhmer, M.; Doucet, M.; et al. RDE cycle generation—A statistical approach to cut down testing effort and provide a secure base to approve RDE legislation compliance. In Internationaler Motorenkongress 2019; Liebl, J., Beidl, C., Maus, W., Eds.; Springer: Wiesbaden, Germany, 2019; pp. 37–56. ISBN 978-3-658-26527-4. [Google Scholar]
  22. Dorscheidt, F.; Düzgün, M.; Claßen, J.; Krysmon, S.; Pischinger, S.; Görgen, M.; Dönitz, C.; Nijs, M. Hardware-in-the-Loop Based Virtual Emission Calibration for a Gasoline Engine. In SAE Technical Paper Series; SAE International: Warrendale, PA, USA, 2021. [Google Scholar]
  23. Heusch, C.; Guse, D.; Dorscheidt, F.; Claßen, J.; Fahrbach, T.; Pischinger, S.; Tegelkamp, S.; Görgen, M.; Nijs, M.; Scharf, J. Analysis of Drivability Influence on Tailpipe Emissions in Early Stages of a Vehicle Development Program by Means of Engine-in-the-Loop Test Benches. In SAE Technical Paper Series, Proceedings of the WCX SAE World Congress Experience, Detroit, MI, USA, 21–23 April 2020; SAE International: Warrendale, PA, USA, 2020. [Google Scholar]
  24. Xia, F.; Dorscheidt, F.; Lücke, S.; Andert, J.; Gardini, P.; Scheel, T.; Walter, V.; Tharmakulasingam, J.K.R.; Böhmer, M.; Nijs, M. Experimental Proof-of-Concept of HiL Based Virtual Calibration for a Gasoline Engine with a Three-Way-Catalyst. In SAE Technical Paper Series, Proceedings of the JSAE/SAE Powertrains, Fuels and Lubricants, Kyoto, Japan, 26 August 2019; SAE International: Warrendale, PA, USA, 2019. [Google Scholar]
  25. Görgen, M.; Nijs, M.; Thewes, M.; Balazs, A.; Yadla, S.K.; Scharf, J.; Uhlmann, T.; Claßen, J.; Dorscheidt, F.; Krysmon, S.; et al. Holistic Hybrid RDE Calibration Methodology for EU7. In Internationalen Motorenkongress Baden-Baden; Springer: Wiesbaden, Germany, 2021. [Google Scholar]
  26. Meli, M.; Dönitz, C.; Kansagara, J.; Nijs, M. Proof of Concept for Hardware-in-the-Loop Based Knock Detection Calibration. In SAE Technical Paper Series; SAE International: Warrendale, PA, USA, 2021. [Google Scholar]
  27. Andert, J.; Xia, F.; Klein, S.; Guse, D.; Savelsberg, R.; Tharmakulasingam, R.; Thewes, M.; Scharf, J. Road-to-rig-to-desktop: Virtual development using real-time engine modelling and powertrain co-simulation. Int. J. Engine Res. 2018, 20, 686–695. [Google Scholar] [CrossRef] [Green Version]
  28. Lee, S.-Y.; Andert, J.; Pischinger, S.; Ehrly, M.; Schaub, J.; Koetter, M.; Ayhan, A.S. Scalable Mean Value Modeling for Real-Time Engine Simulations with Improved Consistency and Adaptability. In SAE Technical Paper Series, Proceedings of the WCX SAE World Congress Experience, Detroit, MI, USA, 9 April 2019; SAE International: Warrendale, PA, USA, 2019. [Google Scholar]
  29. Xia, F.; Griefnow, P.; Klein, S.; Tharmakulasingam, R.; Balazs, A.; Thewes, M.; Andert, J. Crank Angle Resolved Real-Time Engine Modeling for HiL Based Component Testing. In Proceedings of the 19th APAC 2017 SAE China Congress & Exhibition, Shanghai, China, 24–26 October 2017; pp. 1663–1670. [Google Scholar]
  30. Giechaskiel, B.; Vanhanen, J.; Väkevä, M.; Martini, G. Investigation of vehicle exhaust sub-23 nm particle emissions. Aerosol Sci. Technol. 2017, 51, 626–641. [Google Scholar] [CrossRef] [Green Version]
  31. Sterlepper, S.; Claßen, J.; Pischinger, S.; Cox, J.; Görgen, M.; Lehn, H.; Scharf, J. Design of a Novel Gasoline Particulate Filter Aging Method. Emiss. Control. Sci. Technol. 2020, 6, 151–162. [Google Scholar] [CrossRef]
  32. Sterlepper, S.; Claßen, J.; Pischinger, S.; Görgen, M.; Cox, J.; Nijs, M.; Scharf, J. Relevance of Exhaust Aftertreatment System Degradation for EU7 Gasoline Engine Applications. In Proceedings of the WCX SAE World Congress Experience, Detroit, MI, USA, 21–23 April 2020; SAE Technical Paper Series. SAE International: Warrendale, PA, USA, 2020. [Google Scholar]
  33. Sterlepper, S.; Claßen, J.; Pischinger, S.; Schernus, C.; Görgen, M.; Cox, J.; Nijs, M.; Scharf, J.; Rose, D.; Boger, T. Analysis of the Emission Conversion Performance of Gasoline Particulate Filters Over Lifetime. In Proceedings of the 14th International Conference on Engines & Vehicles, Capri, Italy, 15–19 September 2019; SAE Technical Paper Series. SAE International: Warrendale, PA, USA, 2019. [Google Scholar]
  34. Schlatter, J. Measurement of Particles in Aerosols—Challenge and Solutions. CHIMIA 2009, 63, 665–669. [Google Scholar] [CrossRef]
  35. Kittelson, D.B. Engines and nanoparticles. J. Aerosol Sci. 1998, 29, 575–588. [Google Scholar] [CrossRef]
  36. Kittelson, D.; Kraft, M. Particle Formation and Models. In Encyclopedia of Automotive Engineering; Crolla, D., Foster, D.E., Kobayashi, T., Vaughan, N., Eds.; John Wiley & Sons, Ltd.: Chichester, UK, 2014; pp. 1–23. ISBN 9781118354179. [Google Scholar]
  37. Hunt, J.; Ferrari, A.; Lita, A.; Crosswhite, M.; Ashley, B.; Stiegman, A.E. Microwave-Specific Enhancement of the Carbon–Carbon Dioxide (Boudouard) Reaction. J. Phys. Chem. C 2013, 117, 26871–26880. [Google Scholar] [CrossRef]
  38. Basu, P. Biomass Gasification, Pyrolysis and Torrefaction: Practical Design and Theory, 2nd ed.; Elsevier: New York, NY, USA, 2013; ISBN 9780123964885. [Google Scholar]
  39. Pfau, S.; La Rocca, A.; Haffner-Staton, E.; Rance, G.; Fay, M.; Brough, R.; Malizia, S. Comparative nanostructure analysis of gasoline turbocharged direct injection and diesel soot-in-oil with carbon black. Carbon 2018, 139, 342–352. [Google Scholar] [CrossRef]
  40. Maskey, S.; Chae, H.; Lee, K.; Dan, N.P.; Khoi, T.T.; Park, K. Morphological and elemental properties of urban aerosols among PM events and different traffic systems. J. Hazard. Mater. 2016, 317, 108–118. [Google Scholar] [CrossRef] [PubMed]
  41. Tabata, K.; Takahashi, M.; Takeda, K.; Tsurumi, K.; Kiya, Y.; Tobe, S.; Ogura, A. Studies on Characteristics of Nanoparticles Generated in a Gasoline Direct-Injection Engine. In SAE Technical Paper Series, Proceedings of the 2019 JSAE/SAE Powertrains, Fuels and Lubricants, Kyoto, Japan, 26 August 2019; SAE International: Warrendale, PA, USA, 2019. [Google Scholar]
  42. Badshah, H.; Kittelson, D.; Northrop, W. Particle Emissions from Light-Duty Vehicles during Cold-Cold Start. SAE Int. J. Engines 2016, 9, 1775–1785. [Google Scholar] [CrossRef]
  43. Chiavola, O.; Chiatti, G.; Sirhan, N. Impact of Particulate Size During Deep Loading on DPF Management. Appl. Sci. 2019, 9, 3075. [Google Scholar] [CrossRef] [Green Version]
Figure 1. State-of-the-art GPF calibration workflow.
Energies 14 04914 g001
Figure 2. Schematic overview of burner test bench set-up.
Energies 14 04914 g002
Figure 3. Engine operating parameters at a −15 °C cold start.
Energies 14 04914 g003
Figure 4. DMS500 contour plots (a,b), both representing a cold start at −15 °C (dTWC sampling).
Energies 14 04914 g004
Figure 5. Size spectral density curves (a,b), both representing a cold start at −15 °C (dTWC sampling).
Energies 14 04914 g005
Figure 6. Spectral density curves, obtained at the burner test bench, at T e x h = 600   ° C and considering AFR variations at various constant exhaust mass flow rates: (a)   m ˙ e x h = 30 g s ; (b) m ˙ e x h = 60 g s ; (c) m ˙ e x h = 90 g s .
Energies 14 04914 g006
Figure 7. GMD and max. PN concentration values for exhaust gas mass flow rate and AFR variations at T e x h = 600   ° C , obtained on the burner test bench.
Energies 14 04914 g007
Figure 8. Spectral density curves, obtained at the burner test bench, at m ˙ e x h = 60 g s and A F R = 0.95 considering exhaust gas temperature variations: (a)   T e x h = 500   ° C ; (b) T e x h = 600   ° C ; (c)   T e x h = 700   ° C ; (d) T e x h = 800   ° C .
Energies 14 04914 g008
Figure 9. DMS500 contour plot comparison between a vehicle cold start at −15 °C (a), zoom 33–63 s (b), and the burner test bench (c) operated with the parameter set presented in Table 7.
Energies 14 04914 g009
Figure 10. SEM image of the burner soot particles, produced at m ˙ e x h = 60 g/s, AFR = 0.95 and T e x h = 600 °C.
Energies 14 04914 g010
Figure 11. EDX analysis of burner soot particles, produced at m ˙ e x h = 60 g/s, AFR = 0.95 and T e x h = 600 °C (a) and EDX analysis of GDI soot particles by Pfau et al. [39] (b).
Energies 14 04914 g011
Figure 12. Soot load depending on loading time. Engine test bench vs. burner test bench.
Energies 14 04914 g012
Figure 13. Backpressure behaviour on the burner test bench, engine test bench, and during vehicle tests.
Energies 14 04914 g013
Figure 14. GPF temperature and AFR for an active regeneration event—burner test bench (a) vs. engine test bench (b).
Energies 14 04914 g014
Figure 15. Pressure drop across the GPF during an active regeneration event—burner test bench vs. engine test bench.
Energies 14 04914 g015
Table 1. Pressure drop calibration procedure.
StepDescription
1. Determination of the optimal soot loading pointA representative engine operating point in terms of soot emissions is chosen.
2. Loading of the GPF up to a defined backpressureThe engine is operated at the aforementioned soot loading point for a predetermined time.
3. Gravimetrical weighing of the GPFThe GPF is taken out and weighed on an accurate digital scale.
4. Backpressure measurement at high volumetric flow rateA backpressure measurement is performed to record the differential pressure across the GPF at this particular soot mass. The measurement is performed at a selected high volumetric exhaust flow rate that is kept constant at all similar measurements.
5. Regeneration of the GPFAfter conducting the backpressure measurements, the GPF is regenerated by completely oxidising the soot.
6. Repetition of steps 2–5 to investigate pressure drop behaviour over relevant soot massesRepeating the steps for tens of points to finally come up with a pressure drop versus soot mass characteristic.
Table 2. Reference vehicle specifications.
DescriptionSpecification
Vehicle TypeJ-Segment
DriveAll-wheel drive (AWD)
Transmission8-speed AT
Vehicle weight>2000 kg
Table 3. GPF specifications.
DescriptionSpecification
TypeCoated
PositionClose-coupled (one GPF per bank)
MaterialCordierite
Table 4. Engine specifications.
DescriptionSpecification
Engine ArchitectureV8
Engine displacement>4000 cm3
Maximum power>400 kW
Maximum torque>700 Nm
Injection typeGDI spray guided
Boosting system2 Twin scroll turbochargers
Valve trainVariable intake and exhaust valve timing
Table 5. Geometric mean diameter (GMD) for several cold start measurements.
Cold StartSamplingTCoolant, StartTCoolant. EndGMD at TCoolant. End
1dTWC−15 °C45 °C34 nm
2dTWC−15 °C47 °C34 nm
3dTWC−15 °C44 °C33 nm
4dTWC−15 °C45 °C38 nm
5dTWC−15 °C46 °C39 nm
Average GMD =35 nm
Table 6. Parameter variations.
Combustion ParameterUnitParameter Variations
Exhaust mass flow rate m ˙ e x h g/s30, 60, 90
Relative air–fuel ratio (AFR)-1, 0.95, 0.9, 0.85
Exhaust temperature T e x h °C500, 600, 700, 800
Table 7. Final parameter set for engine-like soot reproduction (soot loading) on the burner test bench.
Combustion ParameterUnitValue
Exhaust mass flow rate m ˙ e x h g/s60
Relative air–fuel ratio (AFR)-0.95
Exhaust temperature T e x h °C600
Table 8. Parameter set backpressure measurements (burner and ETB).
Combustion ParameterUnitValue
Exhaust mass flow rate m ˙ e x h g/s100
Relative air–fuel ratio (AFR)-0.90
Exhaust temperature T e x h °C650
Table 9. Parameters used to simulate an active regeneration event on the burner test bench.
Parameter for Active RegenerationUnitValue
Soot loadg4
Exhaust mass flow rate m ˙ e x h g/s39
Relative air–fuel ratio (AFR)-1.05
Exhaust temperature T e x h °C650
Target regeneration duration t r e g e n s200
Publisher’s Note: MDPI stays neutral with regard to jurisdictional claims in published maps and institutional affiliations.

