Article

Bi-Level Multi-Objective Optimization Scheduling for Regional Integrated Energy Systems Based on Quantum Evolutionary Algorithm

State Key Laboratory of Alternate Electrical Power System with Renewable Energy Sources, North China Electric Power University (Baoding), Baoding 071003, China
*
Author to whom correspondence should be addressed.
Energies 2021, 14(16), 4740; https://doi.org/10.3390/en14164740
Submission received: 11 June 2021 / Revised: 7 July 2021 / Accepted: 2 August 2021 / Published: 4 August 2021

Abstract

:
Integrated energy systems have become an important research topic in the pursuit of sustainable energy development. This paper examines regional integrated energy systems, presents the typical architecture of regional integrated energy systems, and builds an integrated energy system model. Two evaluation indexes are proposed: the integrated energy self-sufficiency rate and the expected energy deficiency index. Based on these evaluation indexes and taking into account the uncertainty of wind power generation, a bi-level optimization model based on meta-heuristic algorithms and multi-objective programming is established to solve the problem of regional integrated energy system planning under different load structures and for multi-period and multi-scenario operation modes. A quantum evolutionary algorithm is combined with genetic algorithms to solve the problem.

1. Introduction

With the increasing demand for energy, as well as the increasingly serious problems of environmental pollution and energy crisis, fossil energy alone can no longer meet the current energy demand, and the energy industry system is facing transformation and upgrading [1,2]. In this context, the concept of the integrated energy system (IES) was put forward. The integrated energy system involves the conversion of different forms of energy and the connection of different types of energy networks [3,4]. Compared with the traditional power supply system, the integrated energy system can effectively improve the utilization efficiency of primary energy and alleviate the fluctuation in the power of new energy connected to the main network of the distribution network, meaning it is of great value and significance [5,6].
The modeling and optimal scheduling of regional integrated energy systems (RIESs) have always been a hot topic in academic circles. The problems faced in the development of integrated energy and the Energy Internet were proposed by Kamalinia et al. (2014) [7], aiming at the problems encountered when the power system in the integrated energy system is coupled with other systems. Hajabdollahi et al. (2014) [8] studied the modeling, planning, and economic scheduling of a combined cooling, heating, and power (CCHP) system, which still belongs to the research scope of traditional CCHP energy flow optimization. Different ways of increasing flexibility in the energy system by the use of regional optimization scheduling were established by Lund et al. (2006) [9]. Karimi et al. (2013) [10] listed the optimal power dispatch strategy for different generation units and storage devices. Ni et al. (2015) [11] used the bi-level optimization method to achieve the optimal scheduling of an integrated energy system, but only the optimization of the electrically coupled system was considered. A cogeneration scheduling model which can improve the peak shaving capacity of cogeneration units was established by Chen et al. (2014) [12], and the effect on wind power consumption was analyzed. Li et al. (2015) [13] established the RIES combined thermoelectric dispatching model and discussed the utilization and economy of renewable energy.
Up until now, only a few research studies have investigated the optimization of regional integrated energy systems (RIESs) while considering multi-objective optimization and uncertainty. Existing research had focused on the bi-level modeling and the multi-objective optimization of RIESs. The models investigated in the RIES optimization studies by Ha et al. (2018) [14], Hu et al. (2017) [15], and Chen et al. (2018) [16] were complex and difficult to solve, and they did not properly consider the interactions between the electricity, heating, and cooling systems. The uncertainty and multi-objective programming challenges of renewable energy power generation in RIESs were also not fully considered. Moreover, with the intensification of conflicts between economic development, environmental protection, and sustainable energy development, the construction of low-carbon, clean, and efficient renewable energy systems has become a global concern. The operation and planning of RIESs should also be carried out in a sustainable manner. In view of the above problems, this paper fully considered the interactions between the gas, heating, cooling, and power systems and investigated the optimal design of the RIES. With different load structures and multiple periods considered, a multi-scene RIES optimization model was built with the power system at the core.
Contrary to the previous studies that mainly focused on the cost problem, this paper also examined the primary energy utilization efficiency during the actual operation of the RIES. Taking into consideration the uncertainties existing in wind power generation, the selection and configuration of the energy equipment in the RIES were optimized, and scheduling strategies were obtained for various typical situations. In order to solve the above problems, a bi-level optimal allocation model was established for the RIES. The target of the upper-level model was the annual investment costs, and which energy instruments to use and how many to use were the variables to be optimized. The lower-level model aimed to minimize the operation and maintenance costs and improve the primary energy utilization efficiency by taking into account the constraints of the above evaluation indicators. In order to solve the complex multi-objective optimization problem, a strategy combining quantum evolutionary algorithms and genetic algorithms was chosen. Finally, the rationality and effectiveness of the modeling and optimization strategies were verified through an analysis of the simulation results, and the influences of different evaluation indexes and calculation methods were studied.

2. Regional Integrated Energy System Model

2.1. RIES Structure

By analyzing the operating parameters of the energy equipment, considering the load balance and constraint relaxation method, a general joint scheduling optimization model of the RIES was established, and the simulation calculation was carried out based on the model. This RIES optimization model does not depend on any assumptions about the system operation mode and is applicable to various typical days. It is also applicable to the joint cold, heat, and power dispatching model in general situations. This optimization model can not only ensure the efficiency of the algorithm but also find the global optimal solution of the joint scheduling optimization model.
In order to describe the energy flow coupling relationship of the RIES, a bi-level optimization model was adopted for this study, as shown in Figure 1. The energy equipment included a CCHP system, electric refrigerators (ERs), gas boilers (GBs), electric boilers (EBs), and wind turbine generators (WTGs). The system contains three types of load: cooling, heating, and electricity. The energy sources of the system are electricity from the power grid, chemical energy from natural gas, and renewable energy generated from the wind turbines. The energy efficiency of the system and economic benefits were improved through optimized scheduling. The specific structure of the RIES is shown in Figure 1:

2.2. Energy Equipment Model

2.2.1. CCHP Model

The CCHP system is the most important energy conversion instrument in an RIES. A complete CCHP system mainly consists of a gas turbine, absorption chiller, and waste heat boiler. Gas turbines use natural gas as the energy source to generate electricity and waste heat. The released waste heat can be cooled by an absorption chiller or heated by a waste heat boiler. The CCHP is coupled with the power grid and gas network for integrated energy supply. There is a functional relationship among the parameters of the gas turbine, absorption chiller, and waste heat boiler in the CCHP system, and the model can be described as follows:
1.
The gas turbine consumption Pg,t and power generation Pc,t data satisfy the quadratic function, where Ic is the operating state of the gas turbine:
P g , t = a 1 P c , t 2 + b 1 P c , t + c 1 I c
When Ic is 0, the CCHP is turned off, and when Ic is 1, the CCHP is turned on.
2.
The cooling capacity Fc,t of the absorption chiller satisfies the cubic function for gas turbine power generation Pc,t:
F c , t = a 2 P c , t 3 + b 2 P c , t 2 + c 2 P c , t + d 2 I c
3.
The heat produced Tc,t in the waste heat boiler and the power produced Pc,t in the gas turbine satisfy the quadratic function
T c , t = a 3 P c , t 2 + b 3 P c , t + c 3 I c
In the above formula, ai, bi, ci, and di are the coefficients obtained after a relationship was determined between the CCHP parameters and the power generation data. The specific values are shown in Table A1 in the Appendix A.

2.2.2. Model of Electric Boiler, Gas Boiler, and Electric Refrigerator

Both electric boilers and refrigerators consume electrical energy to heat/cool. Gas-fired boilers are a common source of heat in an RIES, and they consume natural gas. The working principle for electric boilers, refrigerators, and gas-fired boilers is very similar. The input power Ii,t and the output power Oi,t can be written as
O i , t = η i I i , t         i = E B , G B , E C
where EB, GB, and ER represent the electric boiler, gas-fired boiler, and electric refrigerator, respectively, and ηi is the operating efficiency of i.

2.3. Wind Power Uncertainty Model

Renewable energy sources contribute a great deal of uncertainty to energy systems, which will create difficulties for practical planning. When decisions need to be made for actual energy systems, it is often difficult to obtain an accurate probability density function, while it is relatively easy to obtain a range for the uncertain variables. In this model, there is a large degree of uncertainty regarding the wind power output. Historical data from large-scale wind power operations can be preprocessed and used to establish an RIES uncertainty model. The BP neural network processes the data and uses a randomized dataset to calculate the objective function of the random solution. The BP neural network is used to train the randomized dataset and the objective function so that the BP neural network can predict the probability of random events occurring. Finally, the uncertainty model is solved using the dependent-chance programming method. The specific steps for calculating the uncertain factors in the wind power model in this study were as follows:
1.
Data preprocessing:
Defect screening and cluster analysis of the historical wind power data were combined with regional climate information to form a complete dataset.
2.
BP neural network model:
(a)
Random values for the typical daily load were generated according to the existing data, including N groups of random data and N groups of random solutions.
(b)
The objective function of the N groups of solutions was calculated using the generated N groups of random data.
(c)
The random solution and fit were normalized, and the BP neural network was trained to predict uncertain events.
(d)
The trained BP model was used to calculate the wind power correlation function.
3.
Dependent-chance programming method:
Dependent-chance programming is a chance function that maximizes an event in an uncertain environment:
max Pr { h k ( x , ξ ) 0 , k = 1 , 2 , , q } s . t .   g j ( x , ξ ) 0 , j = 1 , 2 , , p ,
In Equation (5), x is an n-dimensional decision vector, ξ is a random vector parameter, Pr{·} is the probability of an event in {·}; hk{x, ξ} = 0, k = 1, 2, …, q for the event, denoted as ε, and the uncertain environment is gj(x, ξ), j = 1, 2, …, p. In this study, the characteristics of dependent-chance programming were used to address the problem of wind power output uncertainty.

3. Bi-Level Optimal Configuration Model

In this paper, the equipment configuration and scheduling strategy of the RIES were established as a bi-level optimization model, and a bi-level integrated energy optimization strategy is proposed, taking the efficiency index and economic index into consideration. The transfer relationship between the upper- and lower-level optimization decision variables is shown in Figure 2.
Firstly, the upper planning model transfers the planned capacity of various units to the lower operating model, and the lower model simulates the scheduling operations of the system and returns the results to the upper-level planning model. Then, the upper-level model revises the total costs of the planned period based on the results and re-optimizes the planned capacity of all the equipment. Finally, through the optimization and iteration of the upper and lower levels, the integrated energy system plan and operation scheme are solved to maximize the total benefits.

3.1. The Upper Model

The objective function of the upper-level planning model is to minimize the equivalent annual investment cost, and the decision variables are the type and number of energy instruments used.
C inv = ω C ω R ω
In the formula, Cω is the unit investment cost of the equipment ω, and Rω is the construction capacity of the equipment ω. The specific equipment includes a CCHP, electric refrigerators, gas-fired boilers, electric boilers, and wind turbine generators.

3.2. The Lower Model

The lower-level planning model is responsible for coordinating the operation of the energy equipment within the RIES. The goal is to minimize the COP of the operation and maintenance costs and maximize the utilization efficiency of primary energy F during the whole operation period.
In addition to the costs of equipment operation and maintenance and the costs of purchasing electricity and natural gas, the total operation and maintenance costs should also be included into the cost of carbon emissions and the load deficiency penalty. It can be concluded that COP encompasses the equipment operation and maintenance costs COM, the electric energy transaction costs Ctrade, the natural gas fuel costs Cgas, the carbon emissions tax Cco2, and the penalty costs Cp for energy shortages, as shown in Equation (7).
C op = C om + C trade + C gas + C co 2 + C p
C om = i k t o i EC P i k , t + l k t o k RE P l k , t
C trade = t C t P tg
C gas = t C g P g
C co 2 = t C c δ e P tg
C p = λ e E e V + λ h E h V + λ c E c V
In Equation (8), Pik,t is the input power of the kth type i energy conversion instrument in period t. Plk,t is the output power of the kth type l renewable energy instrument in period t. In Equation (9), Ct is the electricity price in time period t, and Ptg is the electricity purchased by the regional power grid. In Equation (10), Cg is the price of natural gas and Pg is the volume of regional gas purchased. In Equation (11), δe and δg are the carbon emission factors of electrical energy and natural gas. In Equation (12), λe, λh, and λc are the penalties for interrupting the electrical, heating, and cooling loads, respectively, and E e V , E h V , and E c V are the expected shortfalls in the electrical, heating, and cooling loads, respectively.
The total cost C of the RIES takes into account the equivalent annual investment costs Cinv and the total operation and maintenance costs Cop:
min C = C inv + 365 s = 1 S p s C op
where Cinv is the equivalent annual investment costs for all the equipment, S is the total number of selected typical days, Ps is the probability of a typical day occurring, and Cop is the operation costs of the system on a typical day.
The efficiency index of the lower model takes the utilization efficiency of the whole primary energy operation period as the objective function and considers the electrical load, cooling load, heating load, and transformer input power in period t. The objective function of the efficiency index is as follows:
F = t = 1 T L t t = 1 T S t
In Equation (14), T is the simulation period, Lt is the total load in the time period of t, and St is the total power into the RIES.
L t = L e t + L h t + L c t
In Equation (15), L e t is the electrical load; L h t is the heating load; and L c t is the cooling load.
In Equation (14), St is the total power of the input of the RIES, and the calculation formula is as follows:
S t = P tg / η e η grid + P w + P gas
In Equation (16), Pw is the power from the wind turbine into the RIES, Pgas is the gas power into the system, ηe is the average power generation efficiency of the power plant, and ηgrid is the average transmission efficiency of the power plant.

3.3. Constraints

3.3.1. Load Balancing Constraint

At any time t, the injected power Pj,t of any node j in the distribution system can be expressed as
P j , t = P g , t + c C j P c , t C + w W j P w , t W h E j P e , t ER b G j P g , t G b B j P b , t EB , j J
In Equation (17), Pg,t is the power output from the power grid to the RIES, while P c , t C and P w , t W are the power output of the CCHP for No. c and the WTG for No. w at time t, respectively. P ER   e , t , P G   g , t , and P EB   b , t are the power consumption of the electric chiller No. e, the gas-fired boiler No. g, and the electric boiler No. b at time t, respectively. J is the set of all the nodes in the power system, and Cj, Wj, Ej, Gj, and Bj are, respectively, the set of CCHP, wind turbine generators, electric chillers, gas-fired boilers, and electric boilers connected to power grid node J.
The main sources of heat in the thermal system studied in this paper are the waste heat boiler, gas-fired boiler, and electric boiler in the CCHP. The total heating load L H   t required at time t in the RIES can be expressed as
L t H = c = 1 C T c , t + b = 1 B T b , t + g = 1 H T g , t
In Equation (18), Tc,t is the heat supplied by the CCHP at No. c, Tb,t is the heat supplied by the electric boiler at No. b, and Tg,t is the heat supplied by the gas-fired boiler at No. g.
The total cooling load L C   t at time t within the RIES can be expressed as
L t C = c = 1 C F c , t + e = 1 E F e , t
In Equation (19), Fc,t is the cooling capacity of the CCHP at No. c, and Fe,t is the cooling capacity of the electric chiller at No. e.

3.3.2. Constraints for Equipment Operation

x i eo P i min P i x i eo P i max
In Equation (20), x i e o is the operating state variable of the equipment i, while P i m a x and P i m i n are the upper and lower operating power limits for the equipment i, respectively.

3.3.3. Integrated Energy Self-Sufficiency Rate Constraint

In order for the RIES to be a sustainable system, the integrated energy self-sufficiency rate in the system is required to meet the following constraint:
ω sr ω ¯ sr
In the formula, ωsr is the lower limit of the comprehensive energy self-sufficiency rate.

3.3.4. Energy Deficiency Constraint

To simplify the calculations, the energy deficiency constraint in this paper only considers the N-1 fault of class α energy equipment in the integrated energy system. In this case, the expected energy deficiency constraint is described as follows:
E α V E α VMAX
In Equation (22), E V M A X   α is the expected upper limit of the energy deficiency of class α energy.

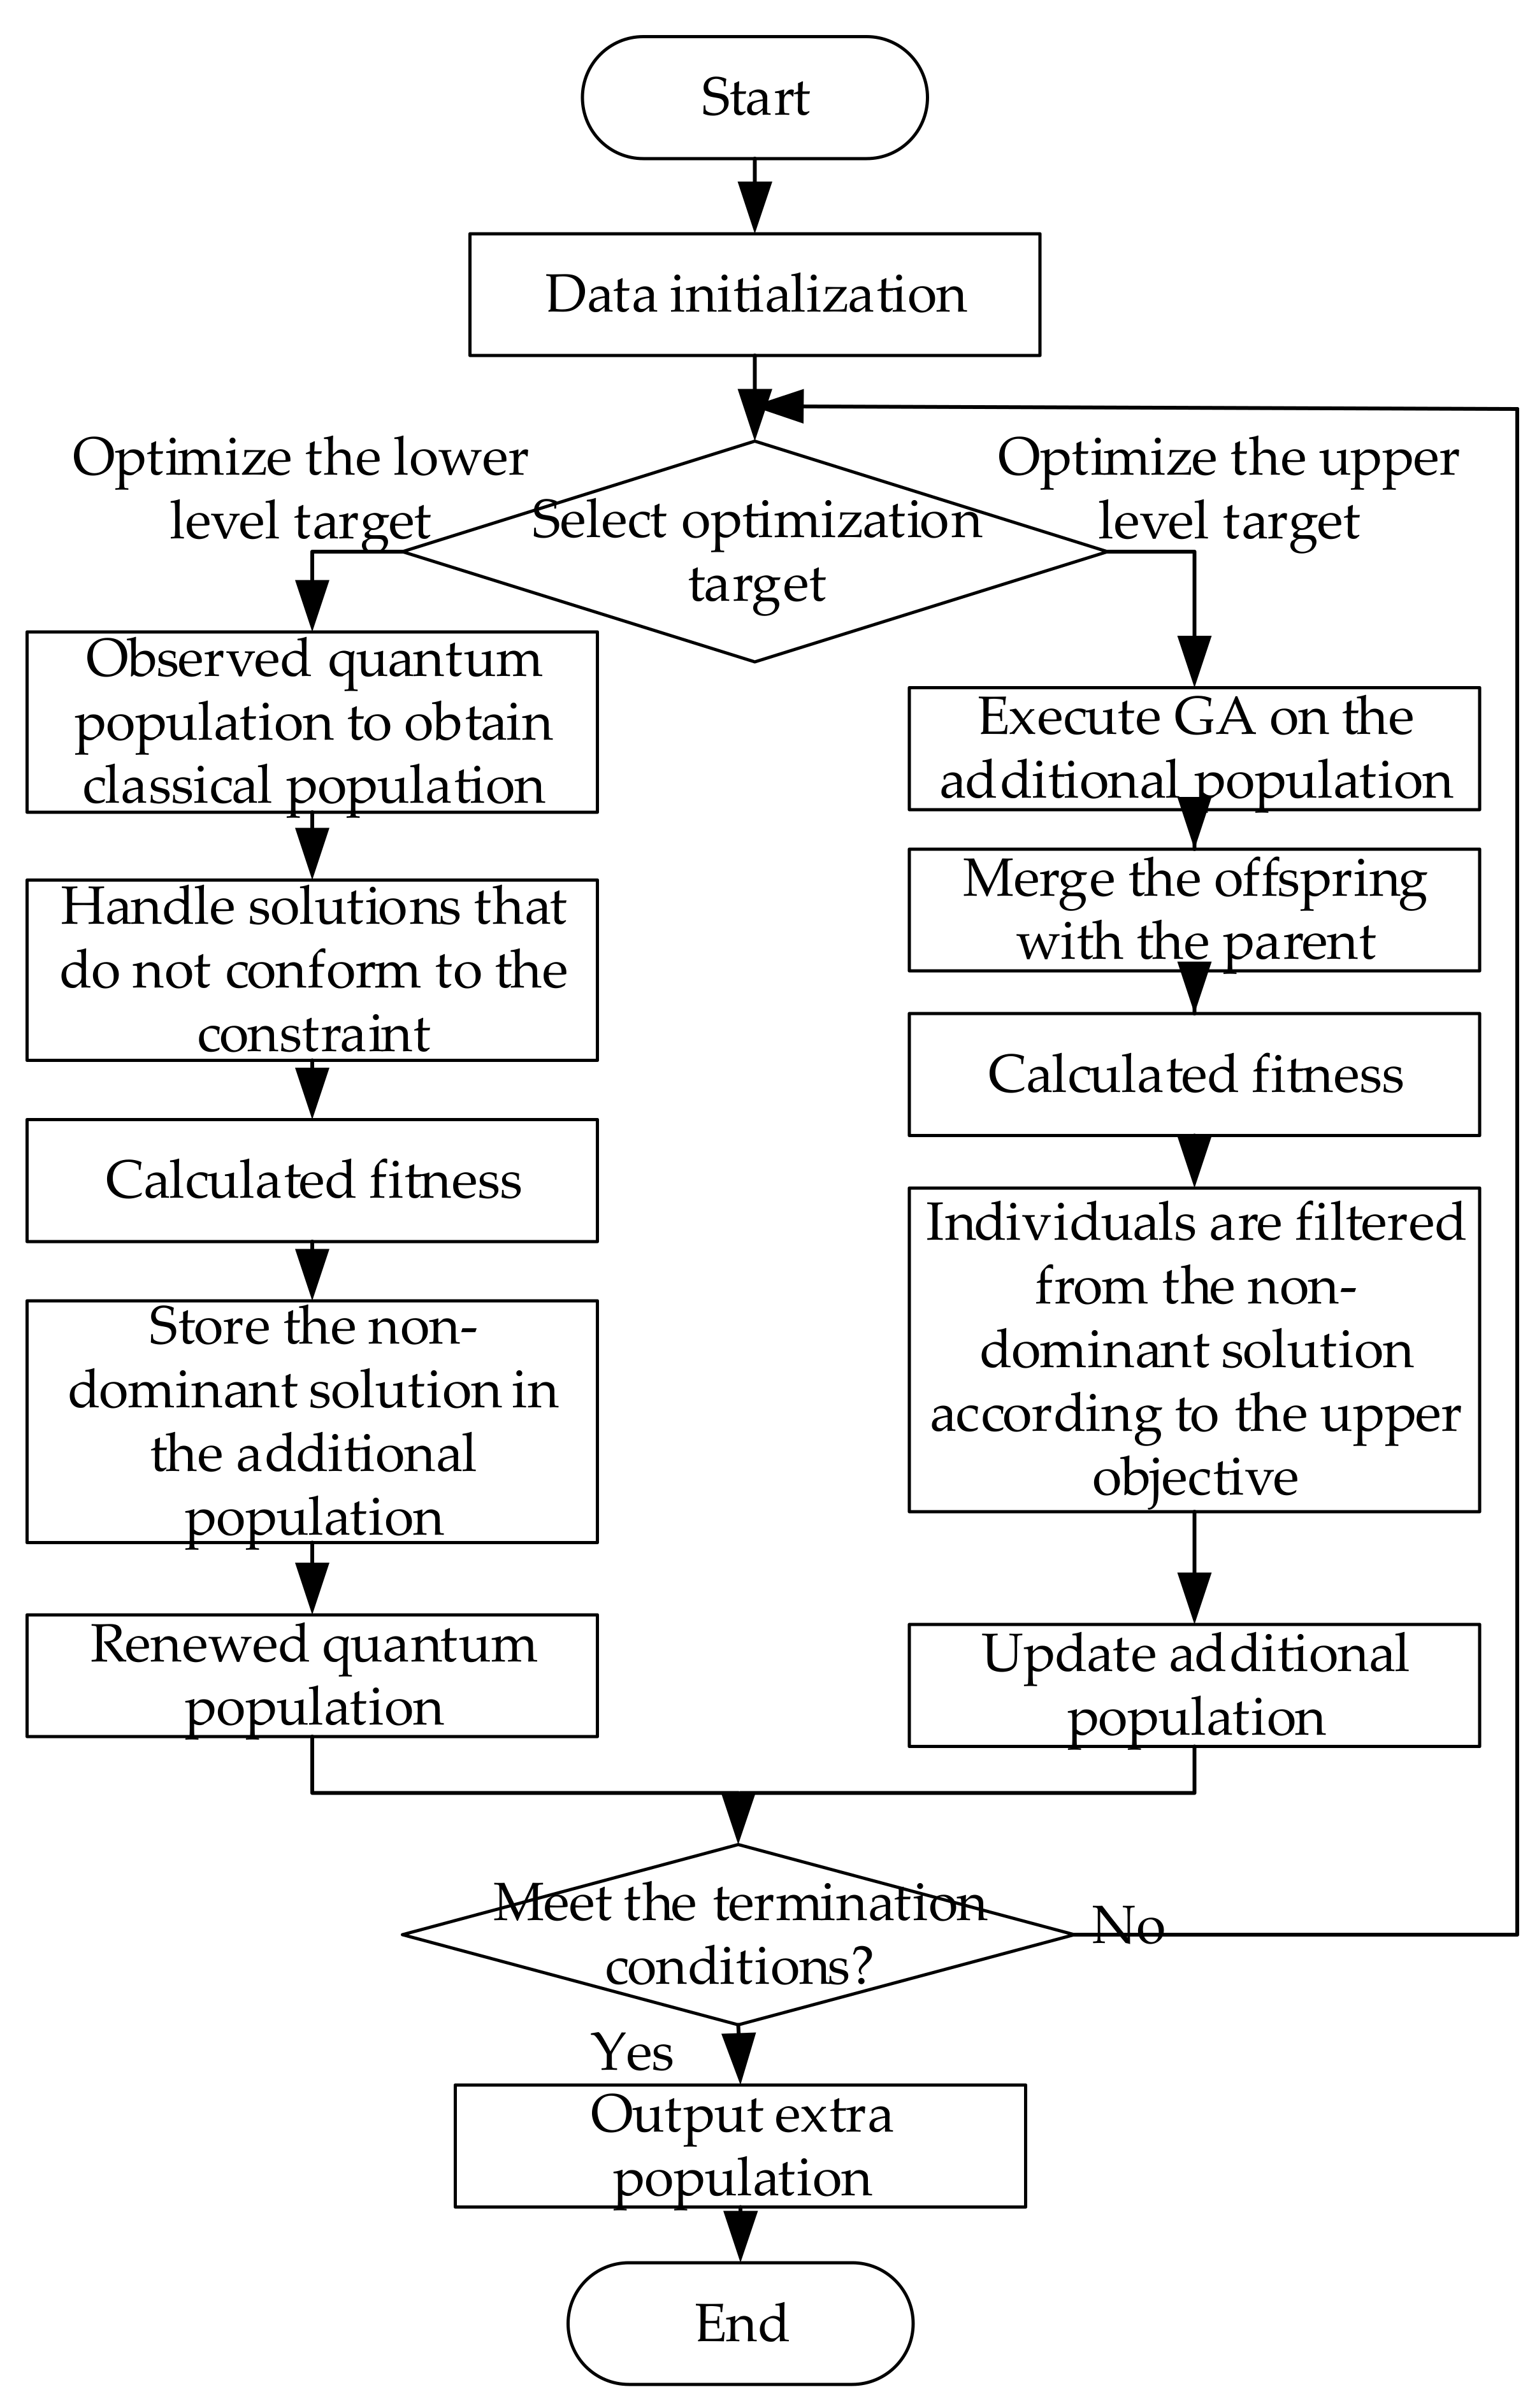
4. RIES Optimized Scheduling Solution Method

In the bi-level optimization model of this study, the upper-level planning model transfers the energy equipment configuration scheme to the lower level. The lower-level planning model optimizes the energy equipment scheduling in the RIES according to the energy equipment configuration scheme and returns the operating costs and energy utilization efficiency to the upper level. The upper level optimizes the capacity and number of energy instruments installed in the RIES based on the operating costs and energy efficiency returned from the lower level and calculates the annual investment cost.

4.1. Algorithm Selection

Calculation of the bi-level optimal configuration model belongs to the mixed integer nonlinear programming problem, and the constraints are complex. It is difficult and time-consuming to solve the problem by using a non-numerical optimization algorithm, and it is difficult to ensure the convergence.
This paper employed a hybrid strategy that combines a quantum evolutionary algorithm with genetic algorithms to optimize the calculation. The quantum evolutionary algorithm was developed from quantum theory and evolutionary algorithms. Some concepts and theories of quantum computing, such as qubits and the quantum superposition state, are used to encode chromosomes by quantum bits so that a quantum chromosome can represent multiple superposed states at the same time, and a quantum gate can be used as an update operator to complete evolutionary searches [17]. In the traditional optimization algorithm, the particle swarm optimization algorithm does not allocate different search resources for individuals with different levels of fit, meaning it cannot converge on the optimal solution or fall into a local optimal solution. The local search ability of genetic algorithms is not strong, and thus it is difficult to reach the optimal solution. The evolutionary process of the quantum evolutionary algorithm is a type of competition between quantum entropy and energy, which improves stability and adaptability through adaptive step sizes and quantum rotation angles while also increasing the calculation speed [18,19]. In this study, the lower target was optimized using the quantum evolutionary algorithm, and all the non-dominant solutions were stored in the additional population. Meanwhile, the non-dominant solutions in the additional population were optimized using genetic algorithms, and the upper-level target was optimized as the fitness function to finally derive the optimal solution. Figure 3 shows the algorithm flow chart:
In the quantum evolutionary algorithm, the quantum rotation angle has a great influence on the convergence speed and accuracy of the algorithm. In order to analyze the influence of the rotation angle on the algorithm, four rotation angles of 0.02 * π, 0.06 * π, 0.1 * π, and 0.2 * π were set. The optimal value, the worst value, the influence of different rotation angles on the convergence speed, the convergence precision of the algorithm, and the stability of the algorithm were analyzed from the variance angle. After the comparison of the experiment, the rotation angle was set to 0.2 * π.

4.2. Multi-Objective Programming Problem

The model established in this paper is a multi-objective optimization problem, and the objective functions are the total cost C and the primary energy utilization efficiency F. To simplify the calculation, the optimal solution can be obtained through the multi-objective programming hierarchical solution method. However, the hierarchical solution method of multi-objective programming needs to set the priority levels of P1 and P2, respectively, for the two objectives. If one of the objectives is satisfied first, the result is optimal, and the result obtained cannot meet the requirements of multi-objective programming.
The multi-objective programming problem in this paper can be dealt with through the combination of Pareto optimality and the multi-objective decision making method. A series of Pareto fronts of the two indexes was obtained by the optimization algorithm as a set of non-inferior solutions. Since the total cost target C and the primary energy utilization efficiency target F of the RIES system are difficult to be unified into the same dimension, the decision-making process can be assisted by the ideal fuzzy decision method [20].
First, the discrete solution was selected as the alternative solution in proportion to the Pareto front. The set composed of experts’ different decisions on the scheme was used as the comment set, the triangular fuzzy number was used to represent experts’ subjective fuzzy weight judgment on the target, and the range of the fuzzy number was set as [0,1]. The fuzzy number is in direct proportion to the importance of the evaluation index. If J indicators are evaluated by n experts, the fuzzy weight of the jth indicator given by the ith expert is rij. For indicator j, the evaluation matrix is denoted as Rj = [r1j,r2j,…,rnj], and the fuzzy comprehensive evaluation matrix is denoted as R.
Each expert is given the same weight e = 1/J × [1,1,…,1]T, and the weight of the two indicators is w = e·R. The fuzzy ideal decision making method first determines the ideal solution and negative ideal solution and compares the solution with the ideal solution. The better scheme is closer to the ideal solution and far away from the negative ideal solution. The specific decision steps are as follows:
  • There are n candidate schemes, and m target values corresponding to each scheme form a multi-objective decision matrix R = (Rij)n×m. The R matrix is processed with a relative superior degree of generality, and the standard 0–1 transformation is applied to normalize the two index data of N Pareto front non-inferior solutions. For example, the operation and maintenance cost is written as a, and the ith non-inferior solution can be processed by the following formula:
b i = ( a max a i ) / ( a max a i min )
2.
Form a weighted gauge matrix C = (cij)n×m, cij = wj×bij.
3.
Determine the fuzzy ideal solution d+ and the fuzzy negative ideal solution d.
d j + = min { c i j i = 1 , 2 , , n } , d j = max { c i j i = 1 , 2 , , n }
4.
The Euclidean distance and relative closeness degree of each scheme to the positive and negative ideal solutions are calculated, and the best scheme is selected according to this order. The calculation formula of the Euclidean distance is
L i + = j = 1 m O ( d j + d i j ) , L i = j = 1 m O ( d j d i j )
where O(.) represents a binorm operator. The relative closeness can be expressed as
H i = L i / ( L i + + L i )

5. Simulation Analysis

5.1. Simulation Setup

In this section, a typical industrial area is discussed, and the power grid and CCHP units are used as the power stations that can distribute all types of loads to the users. The cooling season, heating season, and transition season are designated as three typical seasons. The loads in each typical season are shown in Figure A1 in the Appendix A. The purchase price is the TOU price, as shown in Table A2 of the Appendix A. The wind power output is calculated as an order of magnitude in this example. The parameters of the wind and other energy equipment in the system are shown in Table A3 of the Appendix A. The simulation improves the efficiency and economy of the RIES for each typical day by optimizing parameters and scheduling within a 24 h cycle.

5.2. Optimization Results in Different Scenarios

In order to verify the effectiveness and correctness of the method proposed in this paper, five configuration scenarios are set for multi-objective optimization of the lower-level model. Scenario 1 and Scenario 2 apply a multi-objective programming method to set up the integrated benefit index of the objective function. First, the optimal solution for a single target is determined. For example, in Scenario 1 and Scenario 2, the lower operation and maintenance cost target and the primary energy use efficiency, respectively, determine the priority of P1 and P2. When Scenario 1 is optimized and solved, the lower level will give priority to the operation and maintenance costs P1. When Scenario 2 is optimized and solved, the lower level prioritizes the primary energy utilization efficiency target P2. Several iterative calculations were carried out for the two RIES scenarios, and the optimized results of various indicators in Scenario 1 and Scenario 2 under different priorities are shown in Figure 4. There is a contradiction between the two objectives in the lower-level model. For example, Scenario 1 seeks to minimize the operation and maintenance costs. However, in order to reduce the operation costs as much as possible, the gas turbine may reduce its output or even shut down when the electricity price is low. Conversely, the gas turbine may want to generate as much electricity as possible when the electricity price is high, which will lead to a decrease in the primary energy utilization efficiency.
Scenario 3 comprehensively considers the two evaluation indexes of the operation and maintenance costs and the primary energy utilization efficiency, but it does not consider the constraints from any evaluation index. In Scenario 4, an evaluation index considering the integrated energy self-sufficiency rate is added based on Scenario 3. Scenario 5 adds an index considering the expected energy deficiency based on Scenario 4. In these scenarios, considering the multi-objective optimization of the operation and maintenance costs and the energy utilization efficiency, the quality of the solution is evaluated in a Pareto-dominant way, where the priority of the two objectives is the same. At this point, a Pareto front non-inferior solution satisfying both the annual total costs and the optimal energy utilization efficiency is obtained. Using Scenario 3 as an example, a group of Pareto non-inferior solutions is drawn as Figure 5:
By comparing Scenario 3 with Scenario 4, and Scenario 4 with Scenario 5, the influence of the evaluation indexes on the optimal allocation results of the regional integrated energy system can be analyzed based on the integrated energy self-sufficiency rate and the expected energy deficiency. The lower limit of the integrated energy self-sufficiency rate is 15.0%, the lower limit of the expected energy deficiency is 10% of the energy load. The penalty cost for interrupted electrical loads is set at 20 CNY/(kW·h), and the penalty cost for interrupted heating and cooling loads is set at 35 CNY/MJ. The results of the equipment configuration and optimization of the three scenarios are shown in Table 1 and Table 2.
Scenario 3 is compared with Scenario 4 in order to meet the requirements of the integrated energy self-sufficiency rate. Based on the comparison, wind turbines are added to the system in Scenario 4, which reduces the capacity of the gas boiler and increases the capacity of the electric boiler in order to balance the heating load. Due to the constraints of the integrated energy self-sufficiency evaluation index, the equivalent annual investment costs in Scenario 4 are increased. However, since the installed capacity and output from the wind turbines increase in Scenario 4, the RIES reduces the energy input from the superior energy network, meaning the annual operating cost is less than that of Scenario 3, and the increase in wind power output also improves the primary energy utilization efficiency. In general, the annual total costs in Scenario 4 are higher than those in Scenario 3, and the primary energy utilization efficiency is also higher than that of Scenario 3.
Comparing Scenario 4 with Scenario 5, the expected electrical, heating, and cooling load gaps in Scenario 4 are 34,238 kW·h, 36,424 MJ, and 30,263 MJ, respectively. After considering the expected energy deficiency evaluation index, the three expected energy deficiencies decreased to 0. In Scenario 5, electric boilers, gas-fired boilers, and electric chillers are added to the system to reduce the penalties that may be incurred in the event that the load is decreased during an N-1 failure of the energy equipment, and to improve the reliability of the integrated energy system overall. After considering the expected energy deficiency evaluation index, the equivalent annual investment costs in the system increase, but the annual operating cost and annual penalties are reduced, and, finally, the total cost is reduced. It can be seen that the regional integrated energy system achieved higher reliability and revenue after the reliability index was taken into consideration. Using a typical summer day as an example, the output scheduling for each device in the system under this scenario is shown in Figure 6. When the electricity prices are low, the operating costs of the CCHP system are greater than the price of power from the grid, which increases the amount of power purchased from the grid. When electricity prices are at their peak, it is preferable for the CCHP system to operate at full capacity.
In conclusion, it can be considered that the comprehensive energy self-sufficiency rate can improve the energy utilization efficiency of the system, but it reduces the economy of the system accordingly. After considering the evaluation index of the energy gap expectation, the improvement in the system margin meets the requirement of reliability and improves its economy. It can be seen that the bi-level optimization model proposed in this paper can pursue the economy of the system configuration and high efficiency of energy utilization on the premise of satisfying the reliability requirements of the RIES.

6. Conclusions

In this paper, a multi-evaluation index system of the RIES was constructed, and considering multi-objective programming and uncertainty, a bi-level optimal allocation model of the RIES was established. Through the analysis of an example, the conclusion is as follows:
  • Using the uncertainty calculation method in this paper, exotic meta-heuristics algorithms, and multi-objective decision making methods, we can reliably optimize the uncertainty and bi-level model of wind power in the RIES system.
  • A bi-level optimal configuration model of the RIES was established which can fully consider the influence of the system operating cost and energy efficiency on the choice of energy equipment type and the number of devices in the configuration.
  • The equipment configuration and scheduling plan obtained in the scenario meet the constraints of the comprehensive energy self-sufficiency rate and reliability index and take into account the demands of economy, high efficiency, energy sustainability, and reliability.
The study in this paper did not involve guidance on how to set the parameter value of the evaluation index constraint according to the actual situation and specific needs of the RIES, nor did it consider the interconnection between multiple RIESs with energy storage modules and different characteristics. Further research on these issues will be carried out in the future.

Author Contributions

Conceptualization, W.F. and Q.L.; methodology, W.F.; software, W.F.; validation, W.F., Q.L. and M.W.; formal analysis, W.F.; investigation, W.F.; resources, W.F.; data curation, M.W.; writing—original draft preparation, W.F.; writing—review and editing, W.F.; visualization, W.F.; supervision, Q.L.; project administration, Q.L.; funding acquisition, Q.L. All authors have read and agreed to the published version of the manuscript.

Funding

This research was funded by “National Key Research & Development Program of China, grant number 2016YFB0900203”.

Institutional Review Board Statement

Not applicable.

Informed Consent Statement

Not applicable.

Data Availability Statement

Not applicable.

Conflicts of Interest

The authors declare no conflict of interest.

Appendix A

Table A1. Polynomial coefficient.
Equipmentiaibicidi
Gas turbine12.1512.1980.1076-
Absorption chiller226.87−3.2850.73980.0181
Waste heat boiler32.6641.1430.0734-
Figure A1. Typical season load.
Energies 14 04740 g0a1
Table A2. Time-of-use electricity price.
Period of Time0–77–1212–1717–2222–24
Price (yuan/KW h)0.41.20.81.20.8
Table A3. The equipment parameters.
Energy EquipmentCapacity (kW)Investment Cost (yuan/kW)Operation and Maintenance Cost (yuan/kW)Conversion EfficiencyLife (years)Failure Probability
Wind turbine generator150070000.02-200.01
Gas-fired boiler 1100025000.040.70200.04
Gas-fired boiler 2200018000.040.75200.02
Electric boiler 1100023000.0250.70200.04
Electric boiler 2200016000.0250.75200.02
Electric refrigerator100022000.030.75200.04

References

  1. Wang, S.; Wang, S.; Chen, H.; Gu, Q. Multi-energy load forecasting for regional integrated energy systems considering temporal dynamic and coupling characteristics. Energy 2020, 195, 116964. [Google Scholar] [CrossRef]
  2. Jin, H.; Hong, H.; Wang, B.; Han, W.; Lin, R. A new principle of synthetic cascade utilization of chemical energy and physical energy. Sci. China Ser. E: Technol. Sci. 2005, 48, 163–179. [Google Scholar] [CrossRef]
  3. Liu, L.; Wang, D.; Hou, K.; Jia, H.J.; Li, S.Y. Region model and application of regional integrated energy system security analysis. Appl. Energy 2020, 260, 114268. [Google Scholar] [CrossRef]
  4. Arcos-Aviles, D.; Pascual, J.; Guinjoan, F.; Marroyo, L.; Sanchis, P.; Marietta, M.P. Low complexity energy management strategy for grid profile smoothing of a residential grid-connected microgrid using generation and demand forecasting. Appl. Energy 2017, 205, 69–84. [Google Scholar] [CrossRef]
  5. Li, J.; Wang, S.; Ye, L.; Fang, J. A coordinated dispatch method with pumped-storage and battery-storage for compensating the variation of wind power. Prot. Control Mod. Power Syst. 2018, 3, 1–14. [Google Scholar] [CrossRef] [Green Version]
  6. Cao, Y.; Li, Q.; Tan, Y.; Li, Y.; Chen, Y.; Shao, X.; Zou, Y. A comprehensive review of Energy Internet: Basic concept, operation and planning methods, and research prospects. J. Mod. Power Syst. Clean Energy 2018, 6, 399–411. [Google Scholar] [CrossRef] [Green Version]
  7. Kamalinia, S.; Wu, L.; Shahidehpour, M. Stochastic midterm coordination of hydro and natural gas flexibilities for wind energy integration. IEEE Trans. Sustain. Energy 2014, 5, 1070–1079. [Google Scholar] [CrossRef]
  8. Hajabdollahi, H.; Ganjehkaviri, A.; Jaafar, M.N.M. Assessment of new operational strategy in optimization of CCHP plant for different climates using evolutionary algorithms. Appl. Therm. Eng. 2014, 75, 468–480. [Google Scholar] [CrossRef]
  9. Lund, H.; Münster, E. Integrated energy systems and local energy markets. Energy Policy 2006, 34, 1152–1160. [Google Scholar] [CrossRef]
  10. Karami, H.; Sanjari, M.J.; Tavakoli, A.; Gharehpetian, G.B. Optimal scheduling of residential energy system including combined heat and power system and storage device. Electr. Power Compon. Syst. 2013, 41, 765–781. [Google Scholar] [CrossRef]
  11. Ni, L.; Liu, W.; Wen, F.; Xue, Y.; Dong, Z.; Zheng, Y.; Zhang, R. Optimal operation of electricity, natural gas and heat systems considering integrated demand responses and diversified storage devices. J. Mod. Power Syst. Clean Energy 2018, 6, 423–437. [Google Scholar] [CrossRef] [Green Version]
  12. Chen, X.; Kang, C.; O’Malley, M.; Xia, Q.; Bai, J.; Liu, C.; Wang, W.; Li, H. Increasing the flexibility of combined heat and power for wind power integration in China: Modeling and implications. IEEE Trans. Power Syst. 2014, 30, 1848–1857. [Google Scholar] [CrossRef]
  13. Li, Z.; Wu, W.; Shahidehpour, M.; Wang, J.; Zhang, B. Combined heat and power dispatch considering pipeline energy storage of district heating network. IEEE Trans. Sustain. Energy 2015, 7, 12–22. [Google Scholar] [CrossRef]
  14. Ha, T.T.; Zhang, Y.; Hao, J.; Thang, V.V.; Li, C.; Cai, Z. Energy hub’s structural and operational optimization for minimal energy usage costs in energy systems. Energies 2018, 11, 707. [Google Scholar] [CrossRef] [Green Version]
  15. Hu, B.; Wang, H.; Yao, S. Optimal economic operation of isolated community microgrid incorporating temperature controlling devices. Prot. Control Mod. Power Syst. 2017, 2, 1–11. [Google Scholar] [CrossRef]
  16. Chen, Z.; Zhang, Y.; Ji, T.; Cai, Z.; Li, L.; Xu, Z. Coordinated optimal dispatch and market equilibrium of integrated electric power and natural gas networks with P2G embedded. J. Mod. Power Syst. Clean Energy 2018, 6, 495–508. [Google Scholar] [CrossRef] [Green Version]
  17. Han, K.H.; Kim, J.H. Quantum-inspired evolutionary algorithm for a class of combinatorial optimization. IEEE Trans. Evol. Comput. 2002, 6, 580–593. [Google Scholar] [CrossRef] [Green Version]
  18. Zhang, G. Quantum-inspired evolutionary algorithms: A survey and empirical study. J. Heuristics 2011, 17, 303–351. [Google Scholar] [CrossRef]
  19. Li, P.; Li, S. Quantum-inspired evolutionary algorithm for continuous space optimization based on Bloch coordinates of qubits. Neurocomputing 2008, 72, 581–591. [Google Scholar] [CrossRef]
  20. Ye, J. Fuzzy decision-making method based on the weighted correlation coefficient under intuitionistic fuzzy environment. Eur. J. Oper. Res. 2010, 205, 202–204. [Google Scholar] [CrossRef]
Figure 1. RIES structure.
Energies 14 04740 g001
Figure 2. Bi-level optimization model.
Energies 14 04740 g002
Figure 3. The algorithm flow chart.
Energies 14 04740 g003
Figure 4. Optimizations for Scenario 1 and Scenario 2.
Energies 14 04740 g004
Figure 5. Pareto non-inferior solutions of Scenario 3.
Energies 14 04740 g005
Figure 6. Energy equipment scheduling on typical days in summer.
Energies 14 04740 g006
Table 1. Equipment configuration.
ScenariosEB1EB2GB1GB2ERWTG
3023163
4120265
5221275
Table 2. The optimization results.
ScenarioEquivalent Annual Investment/CNYAnnual Operating Cost/CNYAnnual Penalty Cost/CNYAnnual Consolidated Cost/CNYPrimary Energy Efficiency/%Power Shortage Expectation/(kW·h)Heat Shortage Expectation/MJCold Shortage Expectation/MJ
32189.2 × 1045387.4 × 104339.792 × 1047916.392 × 10477.331,34740,73538,436
42542.8 × 1045176.7 × 104301.880 × 1048021.381 × 10478.134,23836,42430,263
52703.3 × 1045121.6 × 10407824.9 × 10478.1000
Publisher’s Note: MDPI stays neutral with regard to jurisdictional claims in published maps and institutional affiliations.

