
Power Conversion System Operation to Reduce the Electricity Purchasing Cost of Energy Storage Systems


Abstract
:1. Introduction
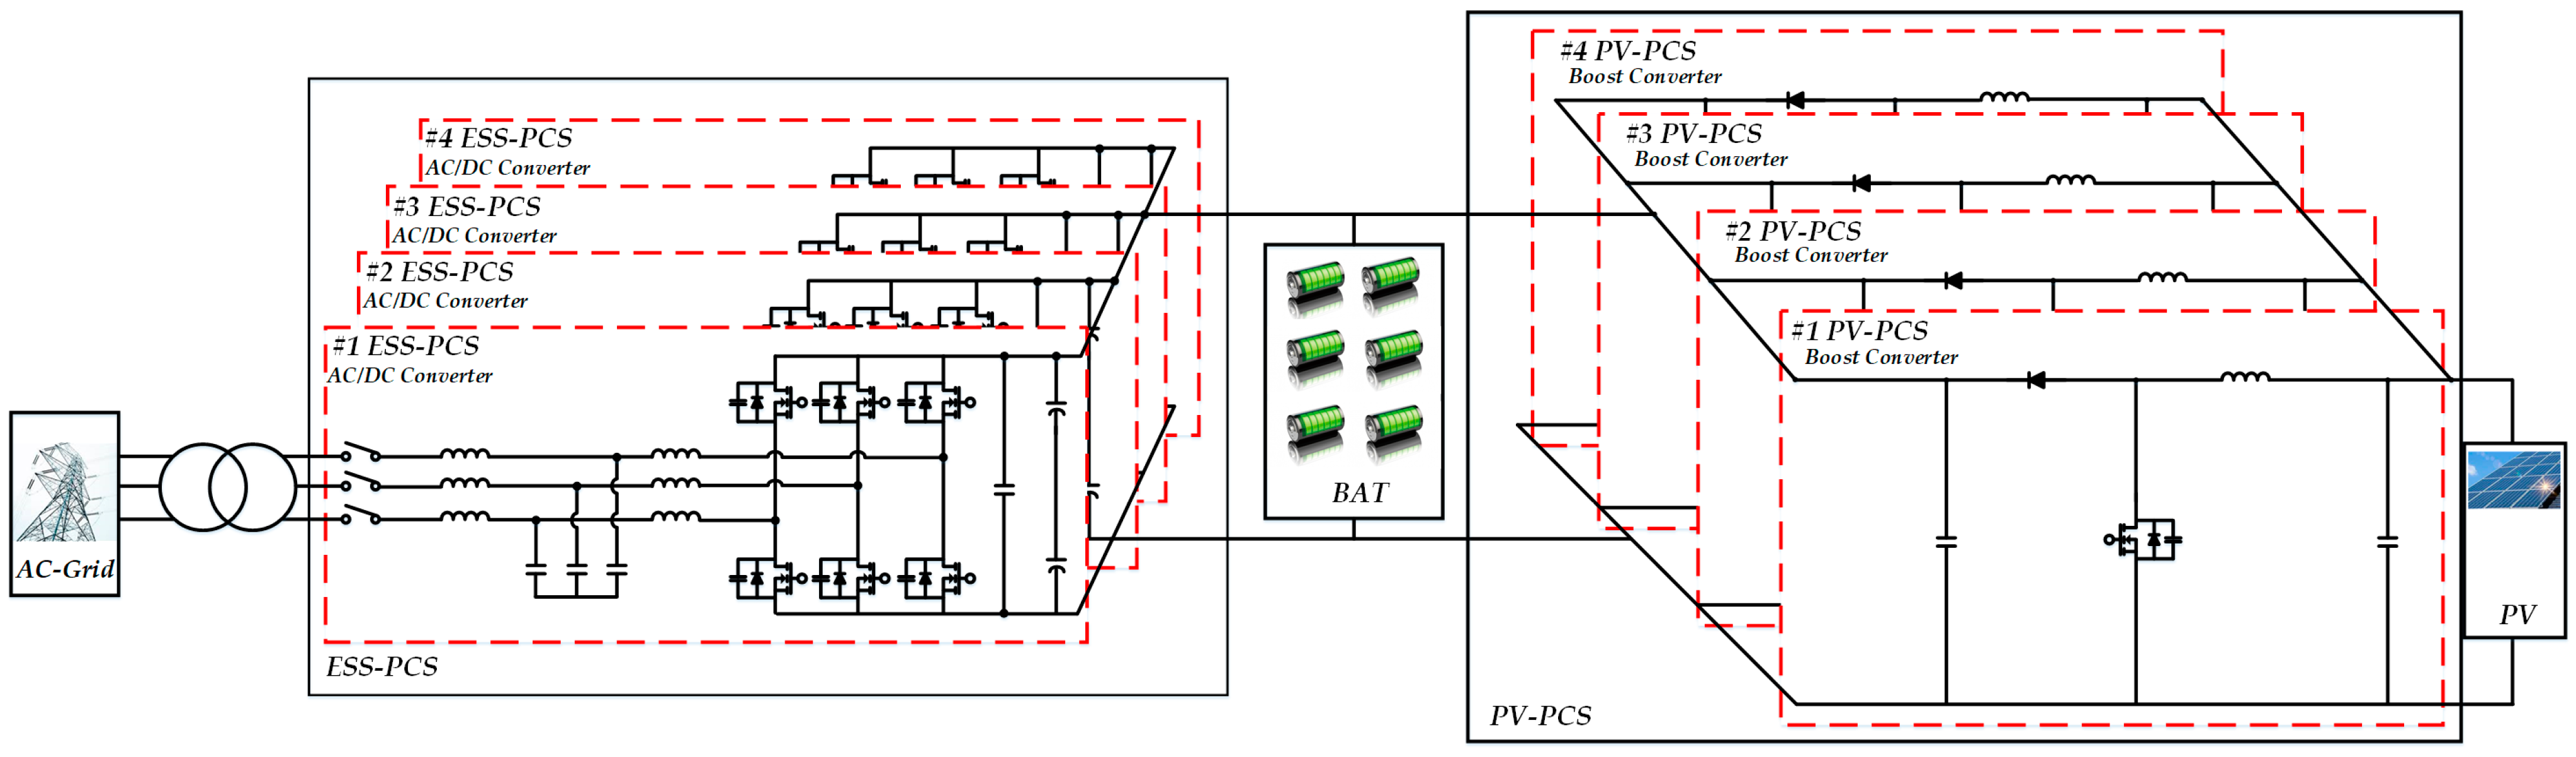
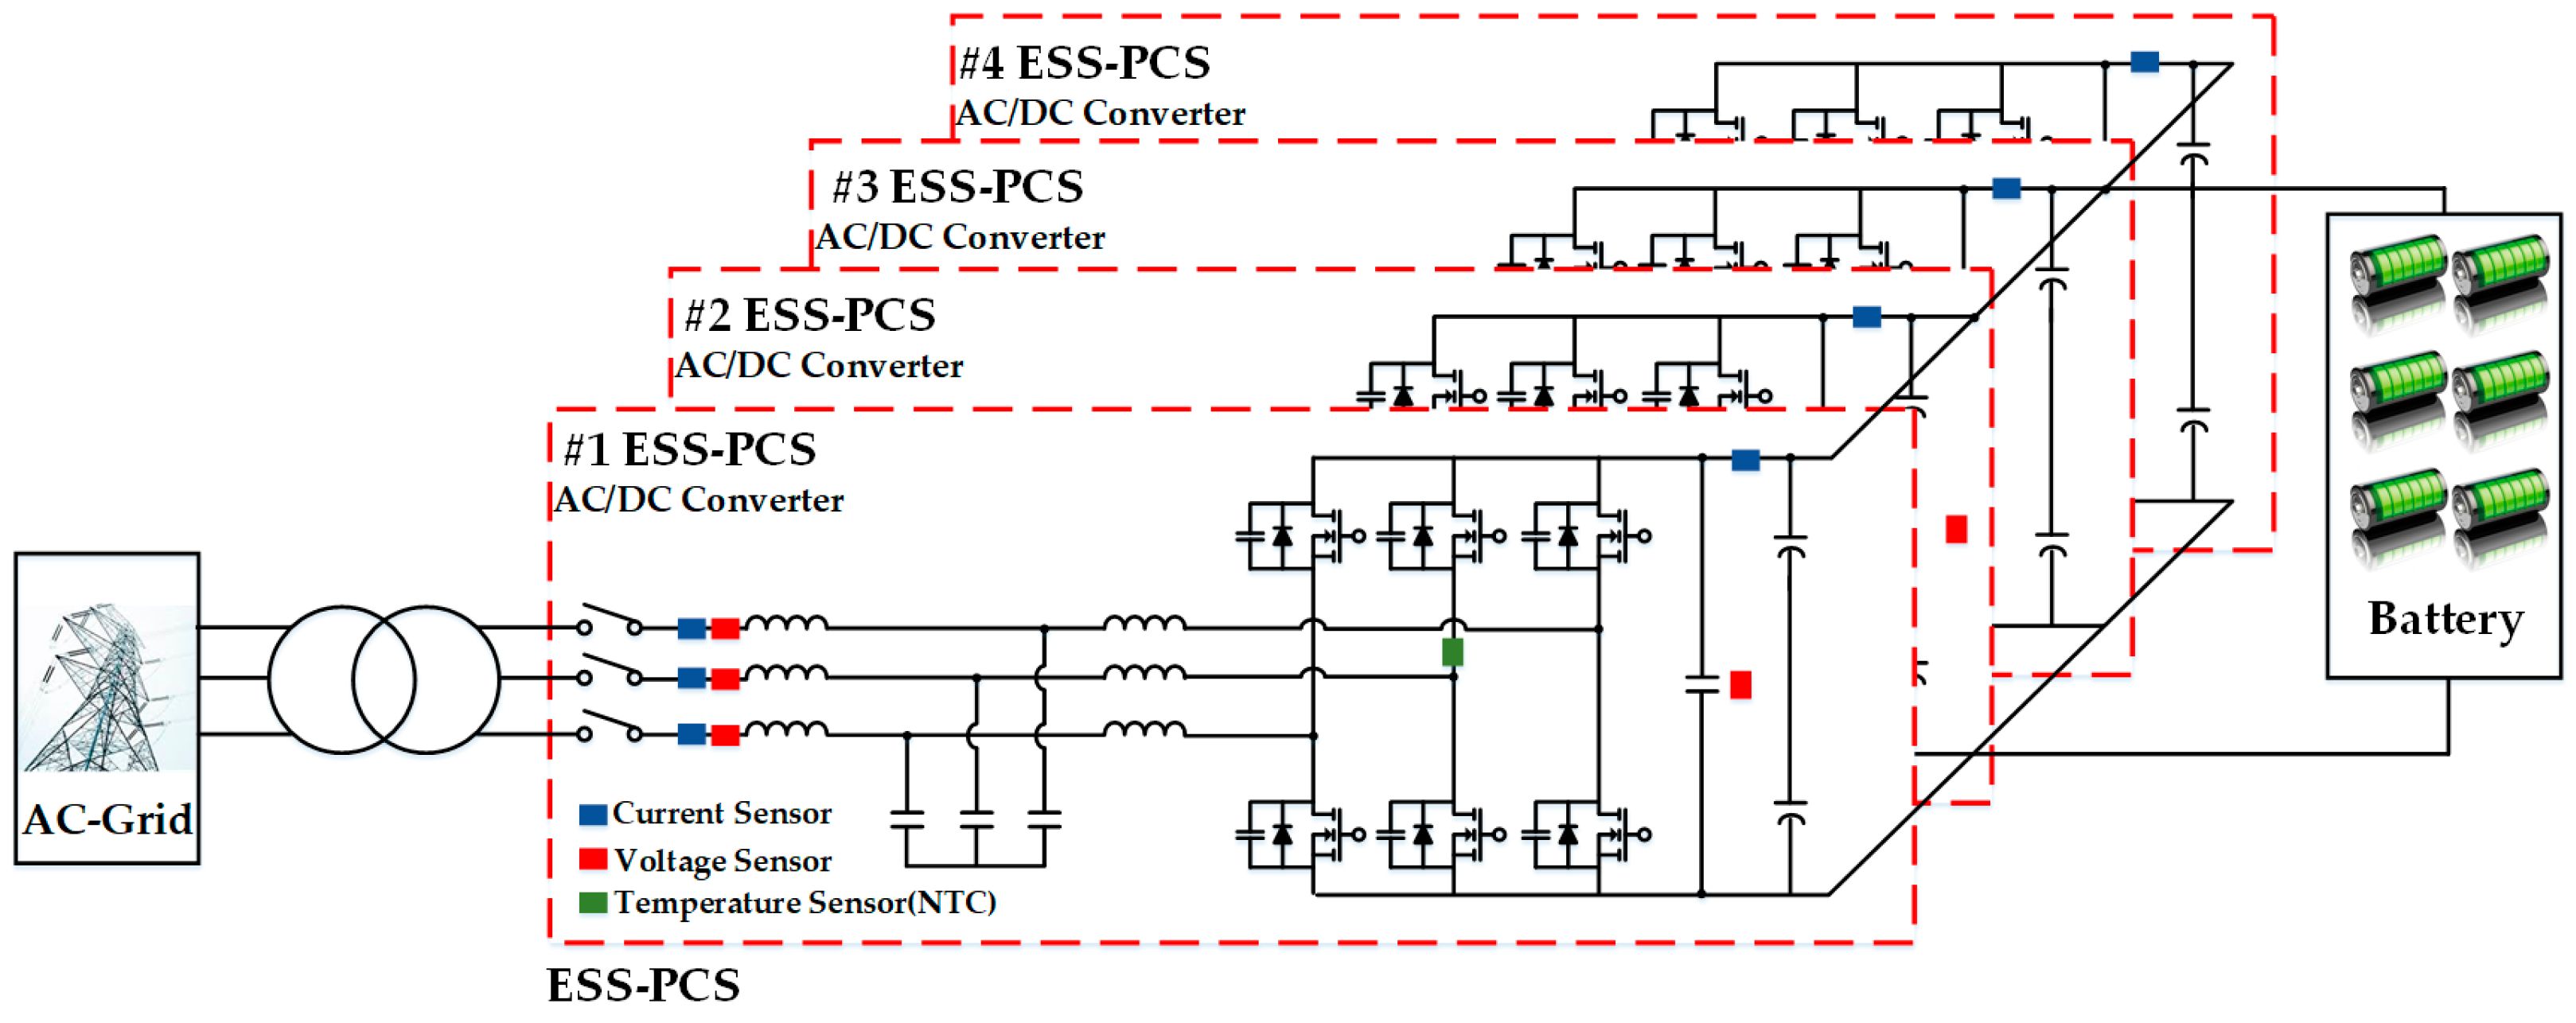
2. PCS Operation Strategy
2.1. Electricity Rate System and ESS Discount System
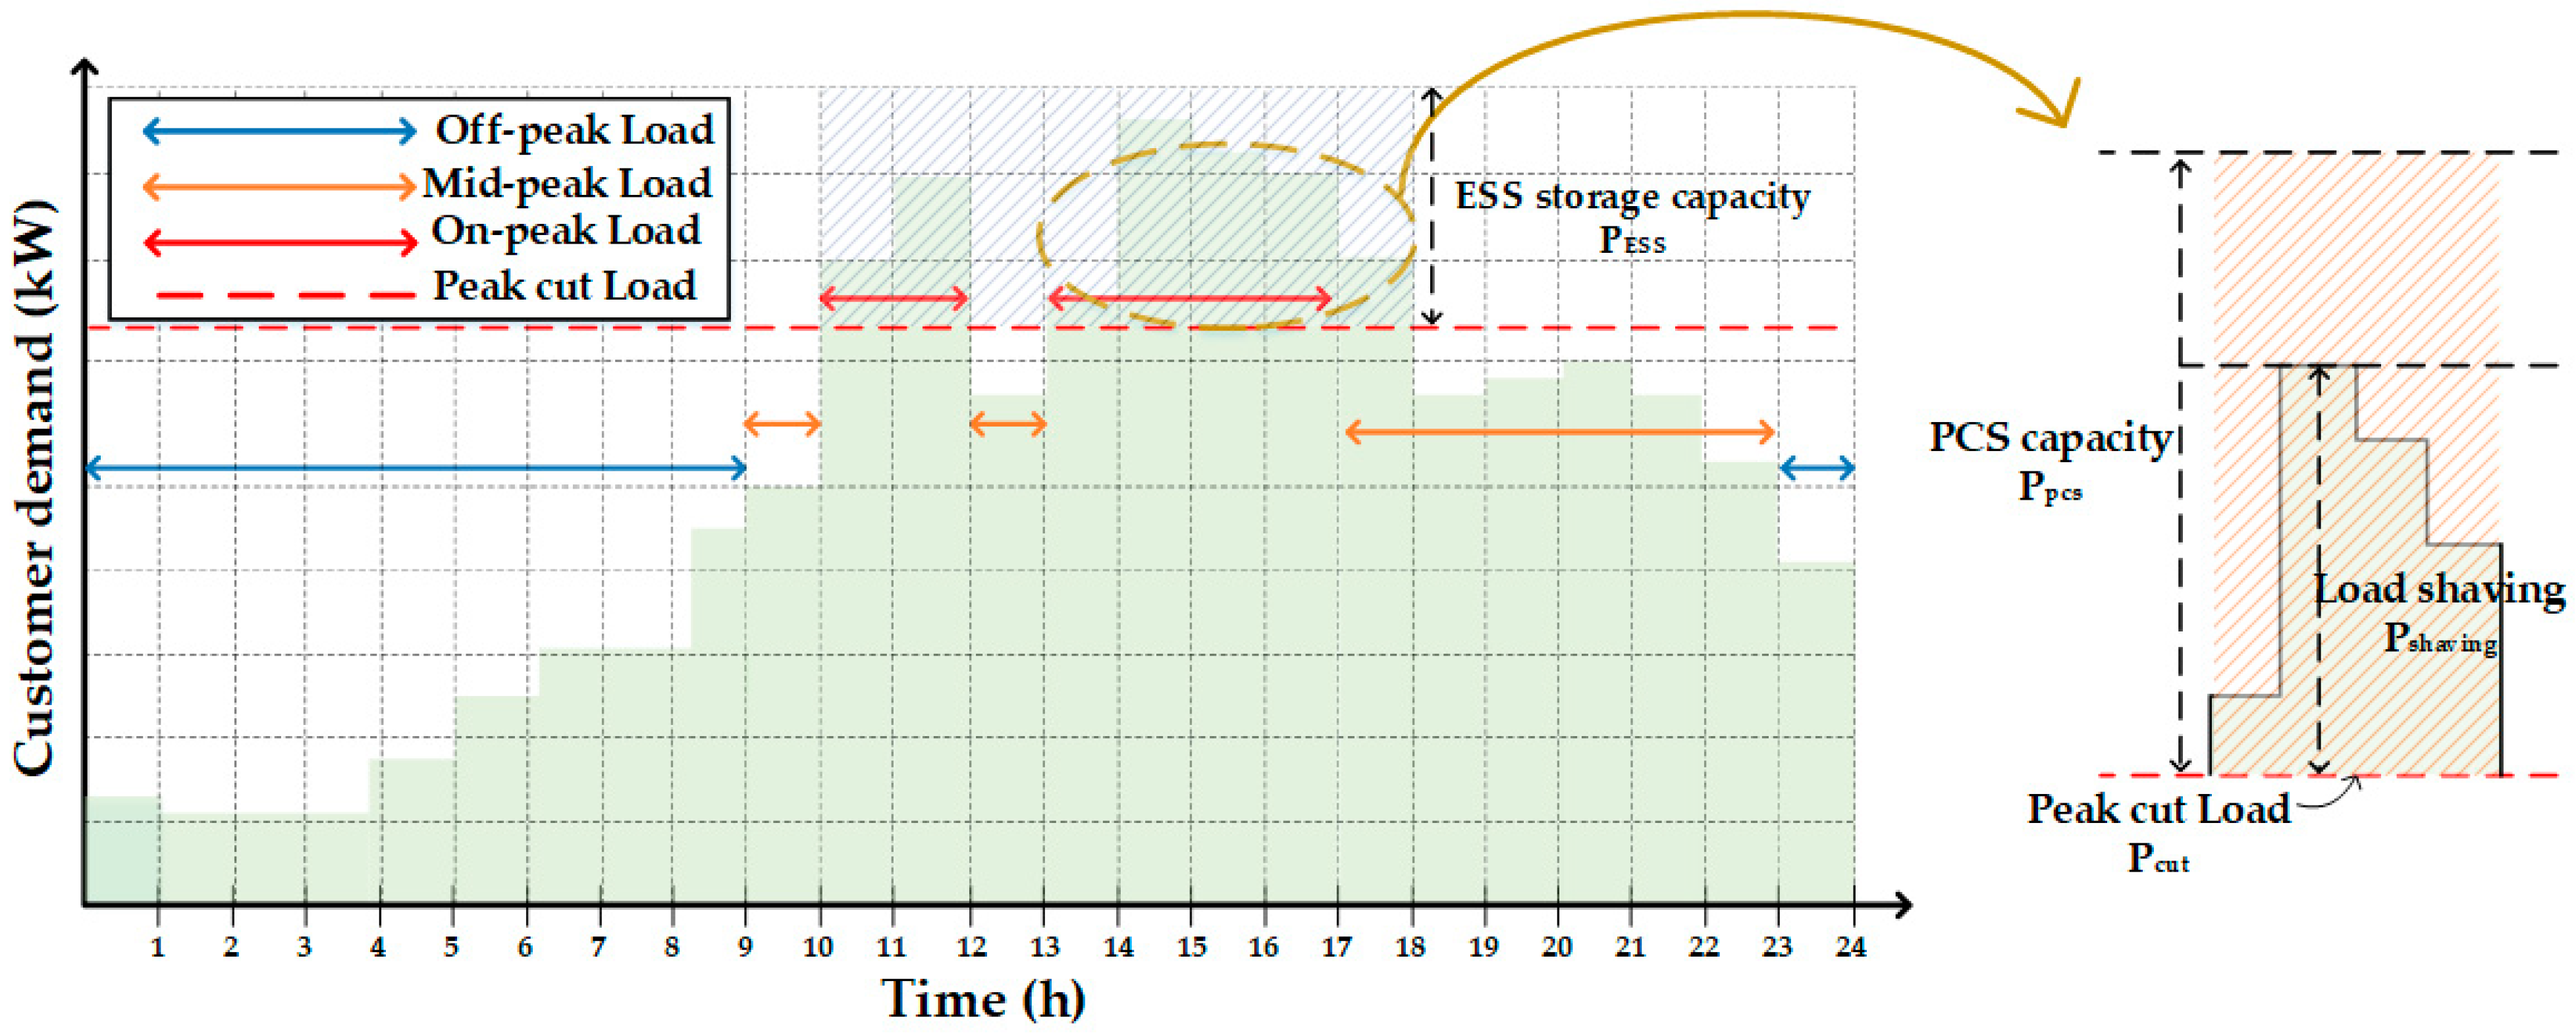
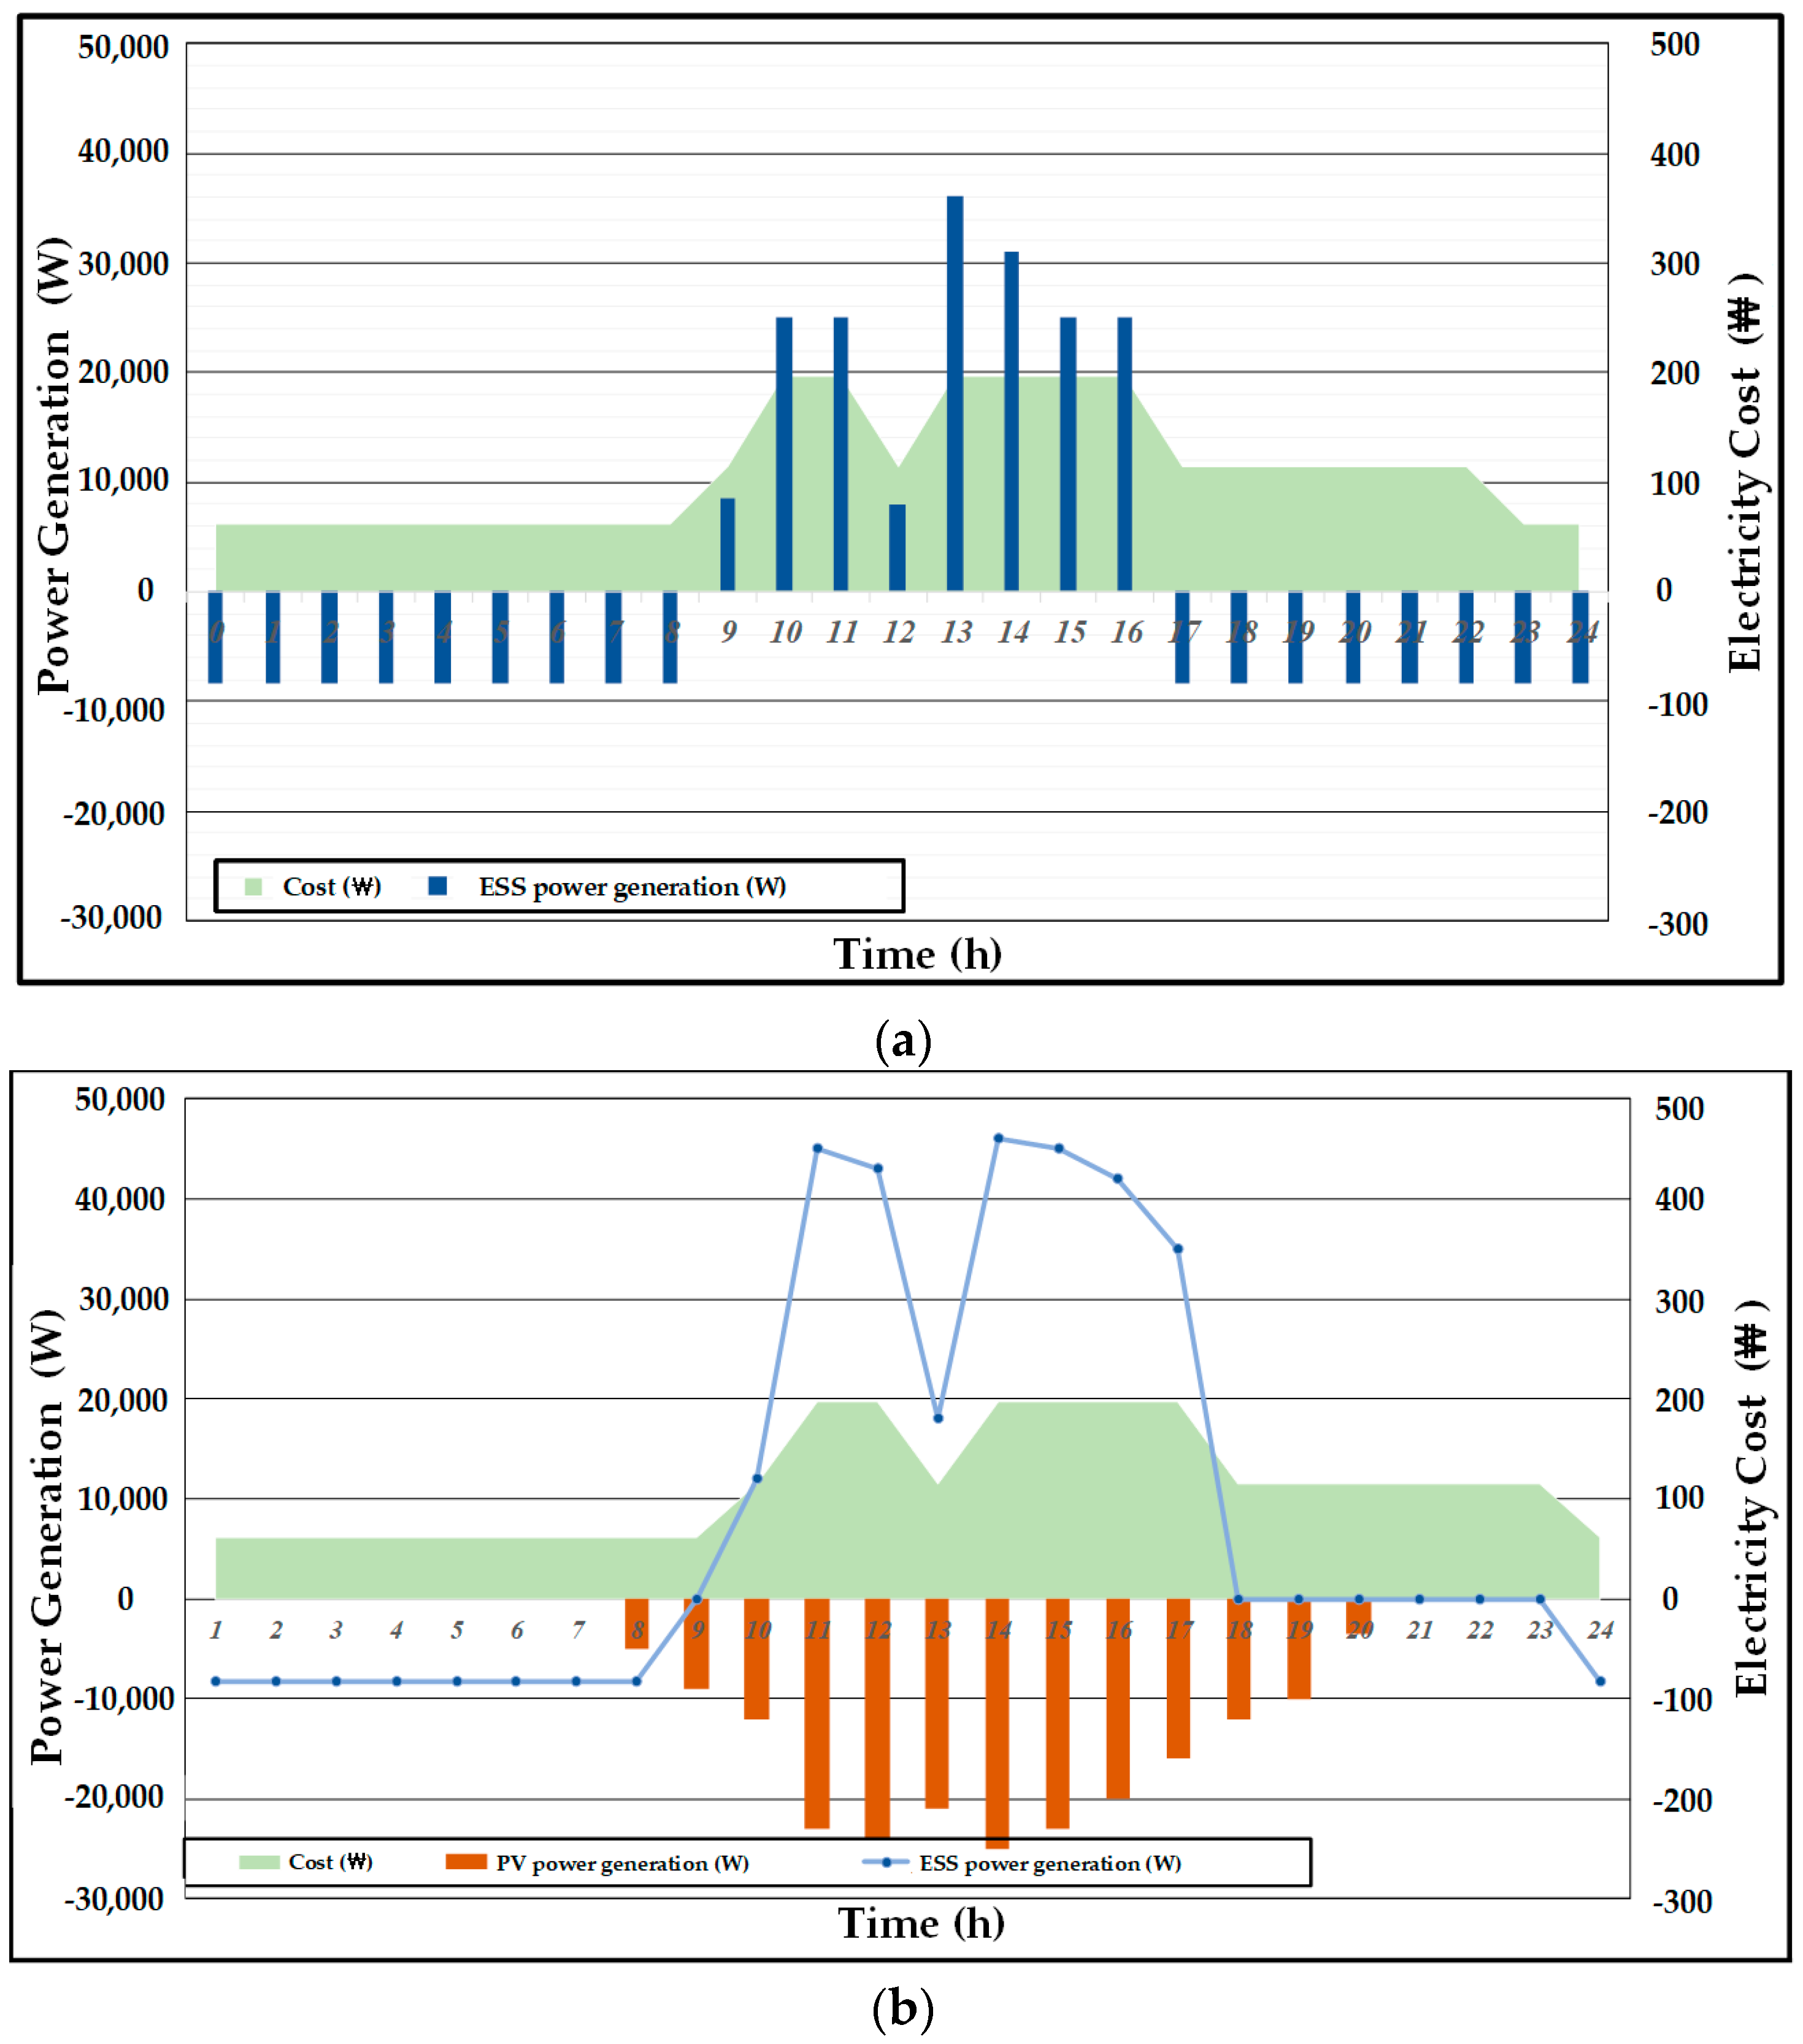
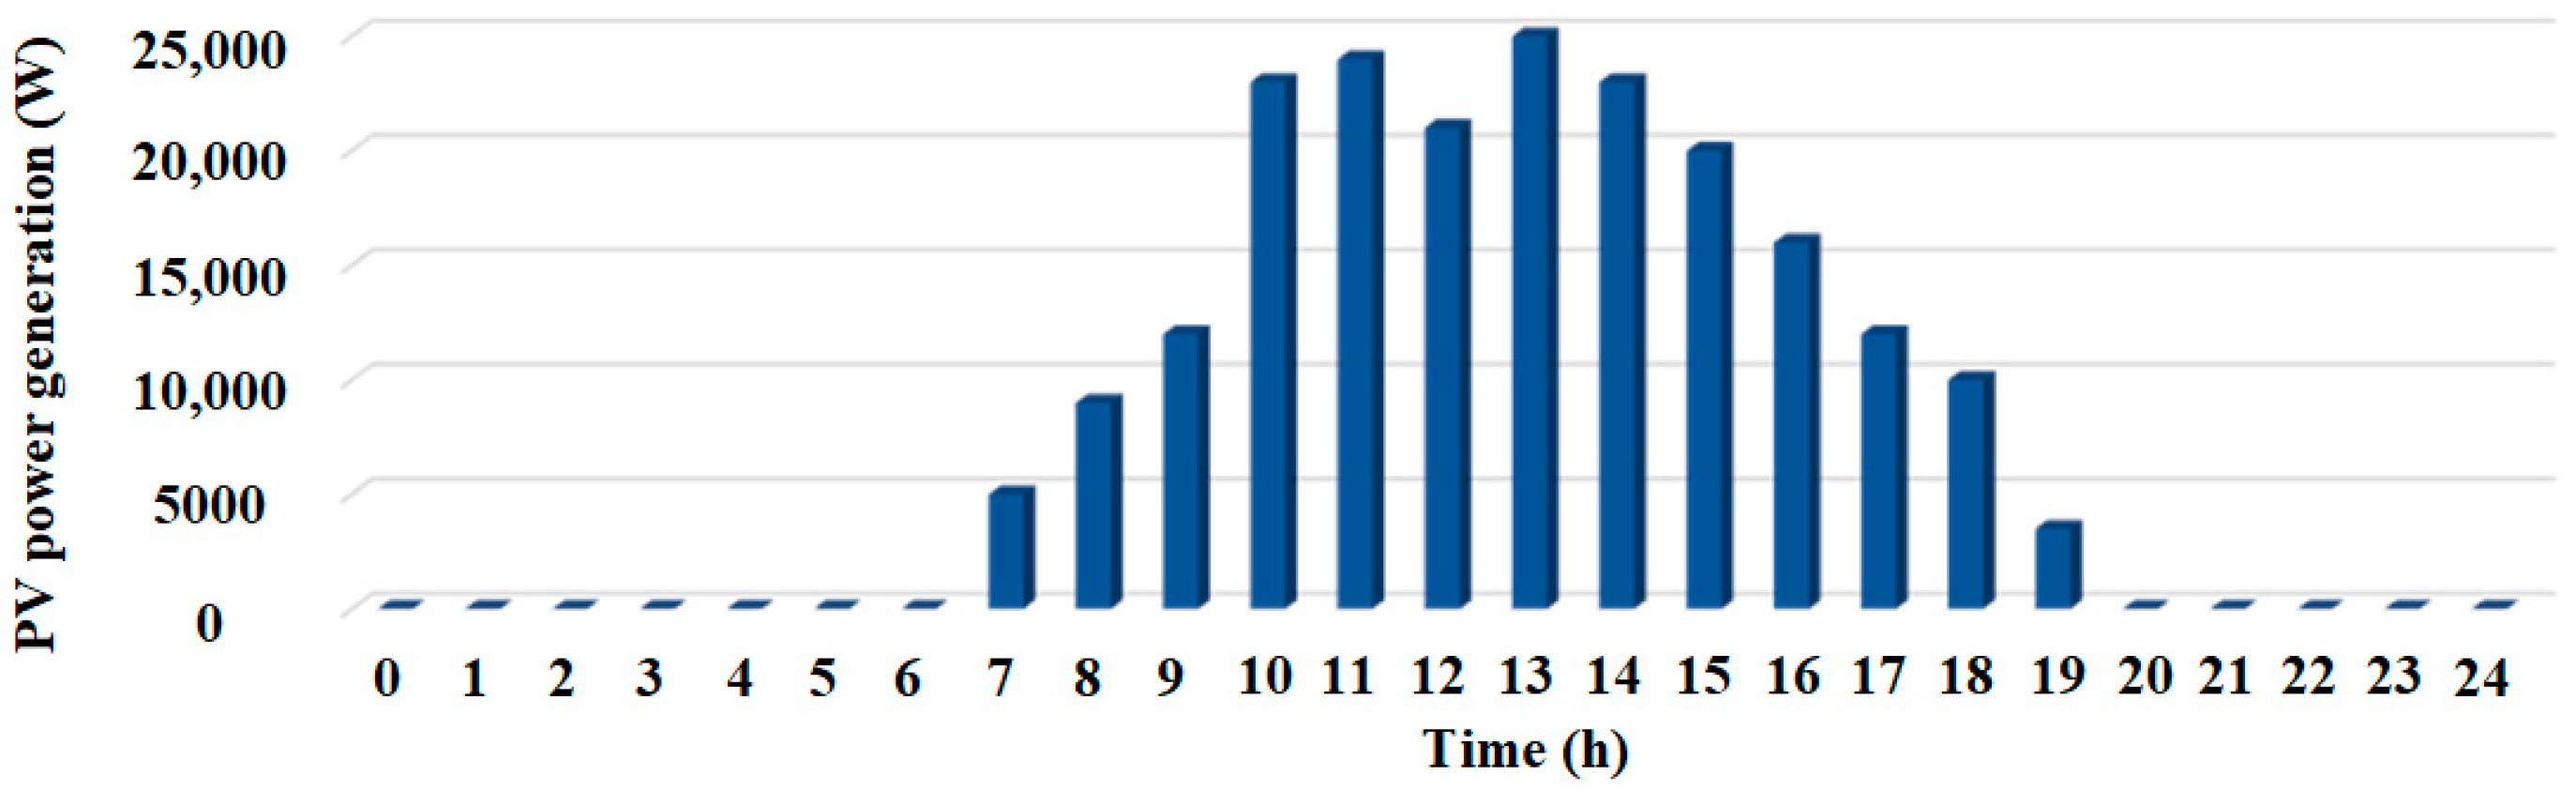
2.2. Minimized Electricity Bills for ESS
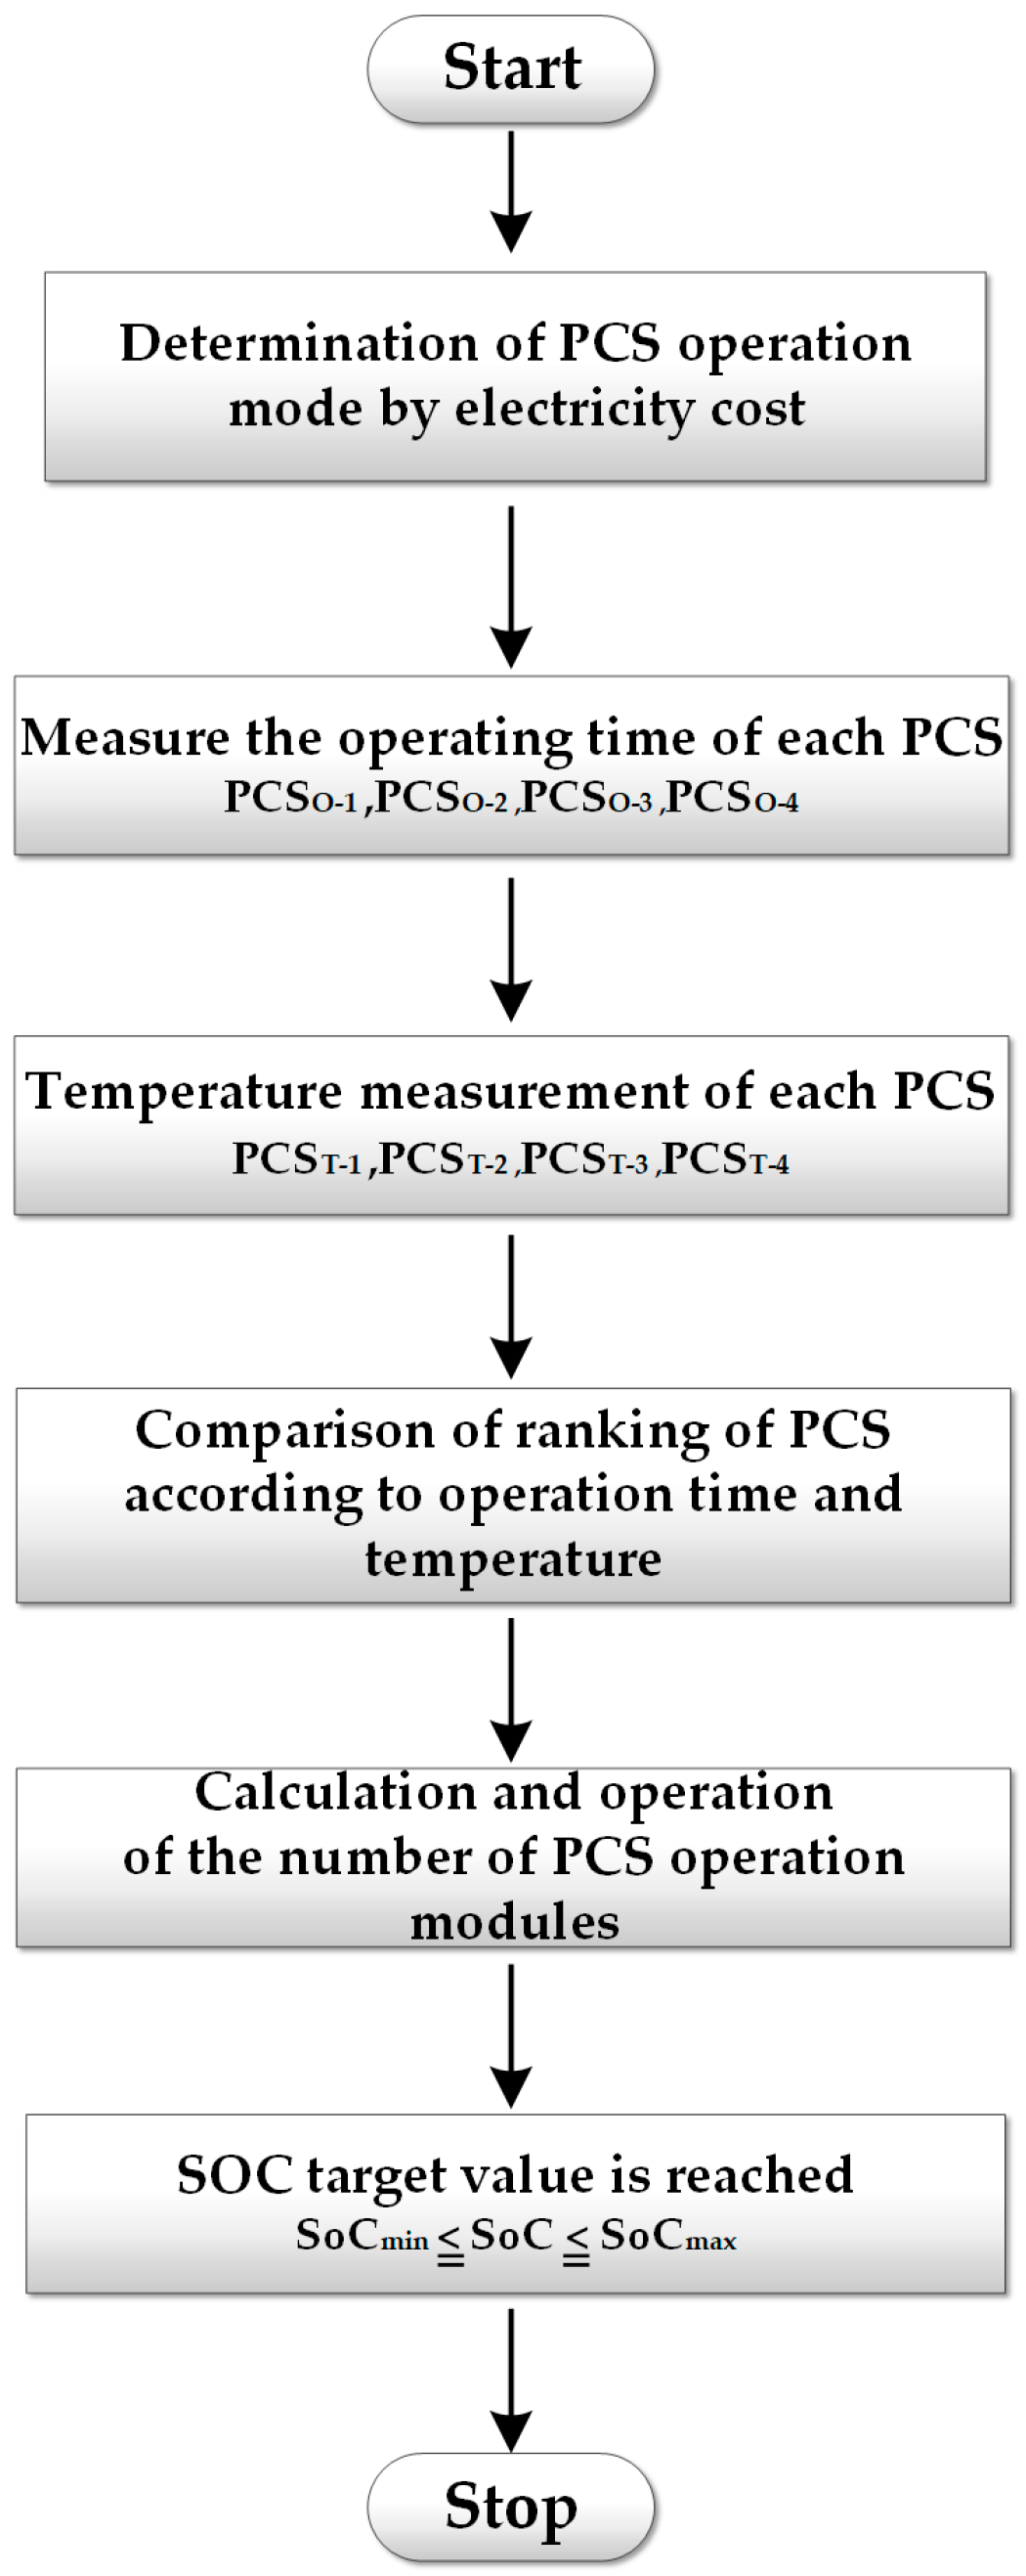
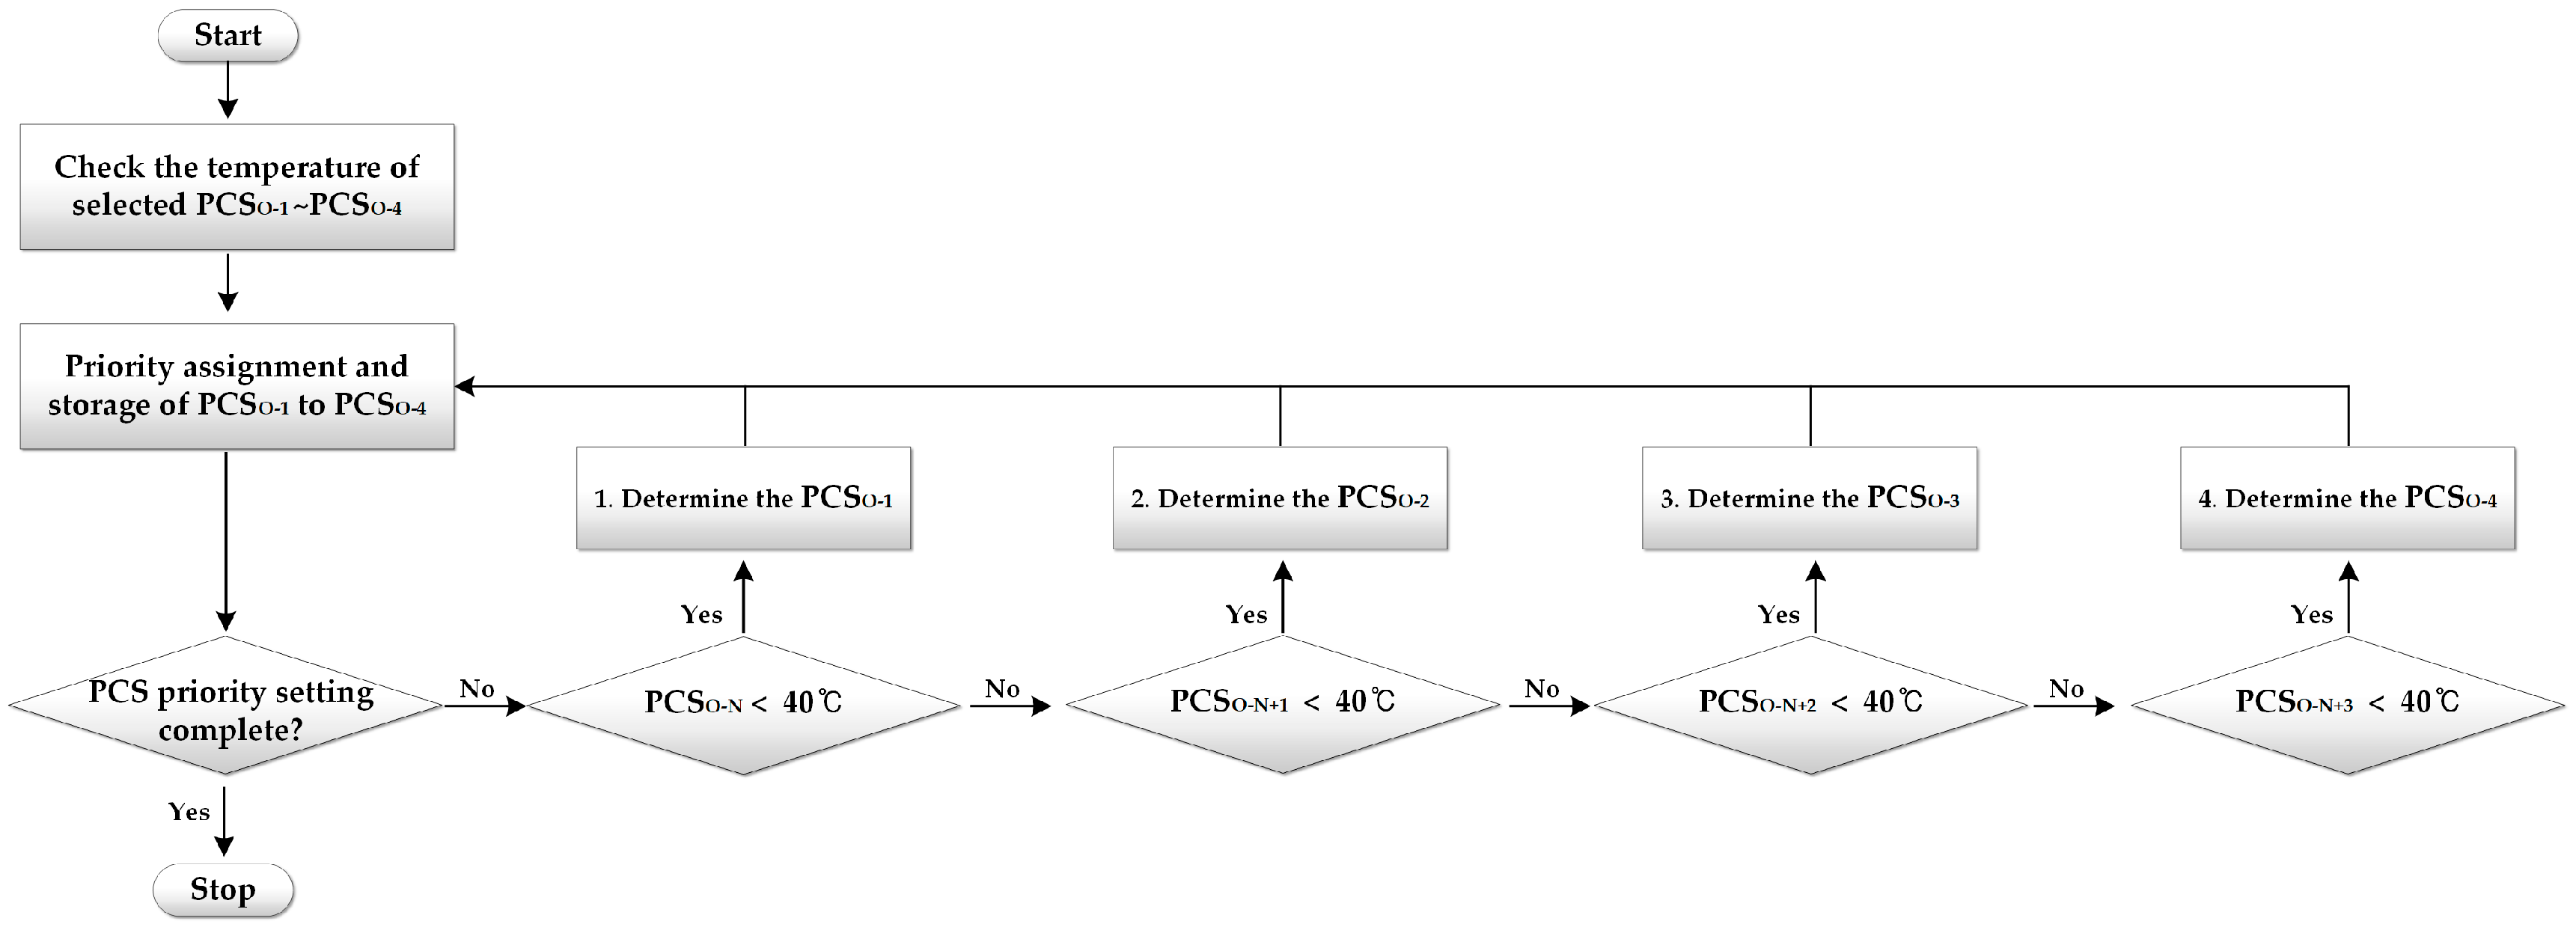
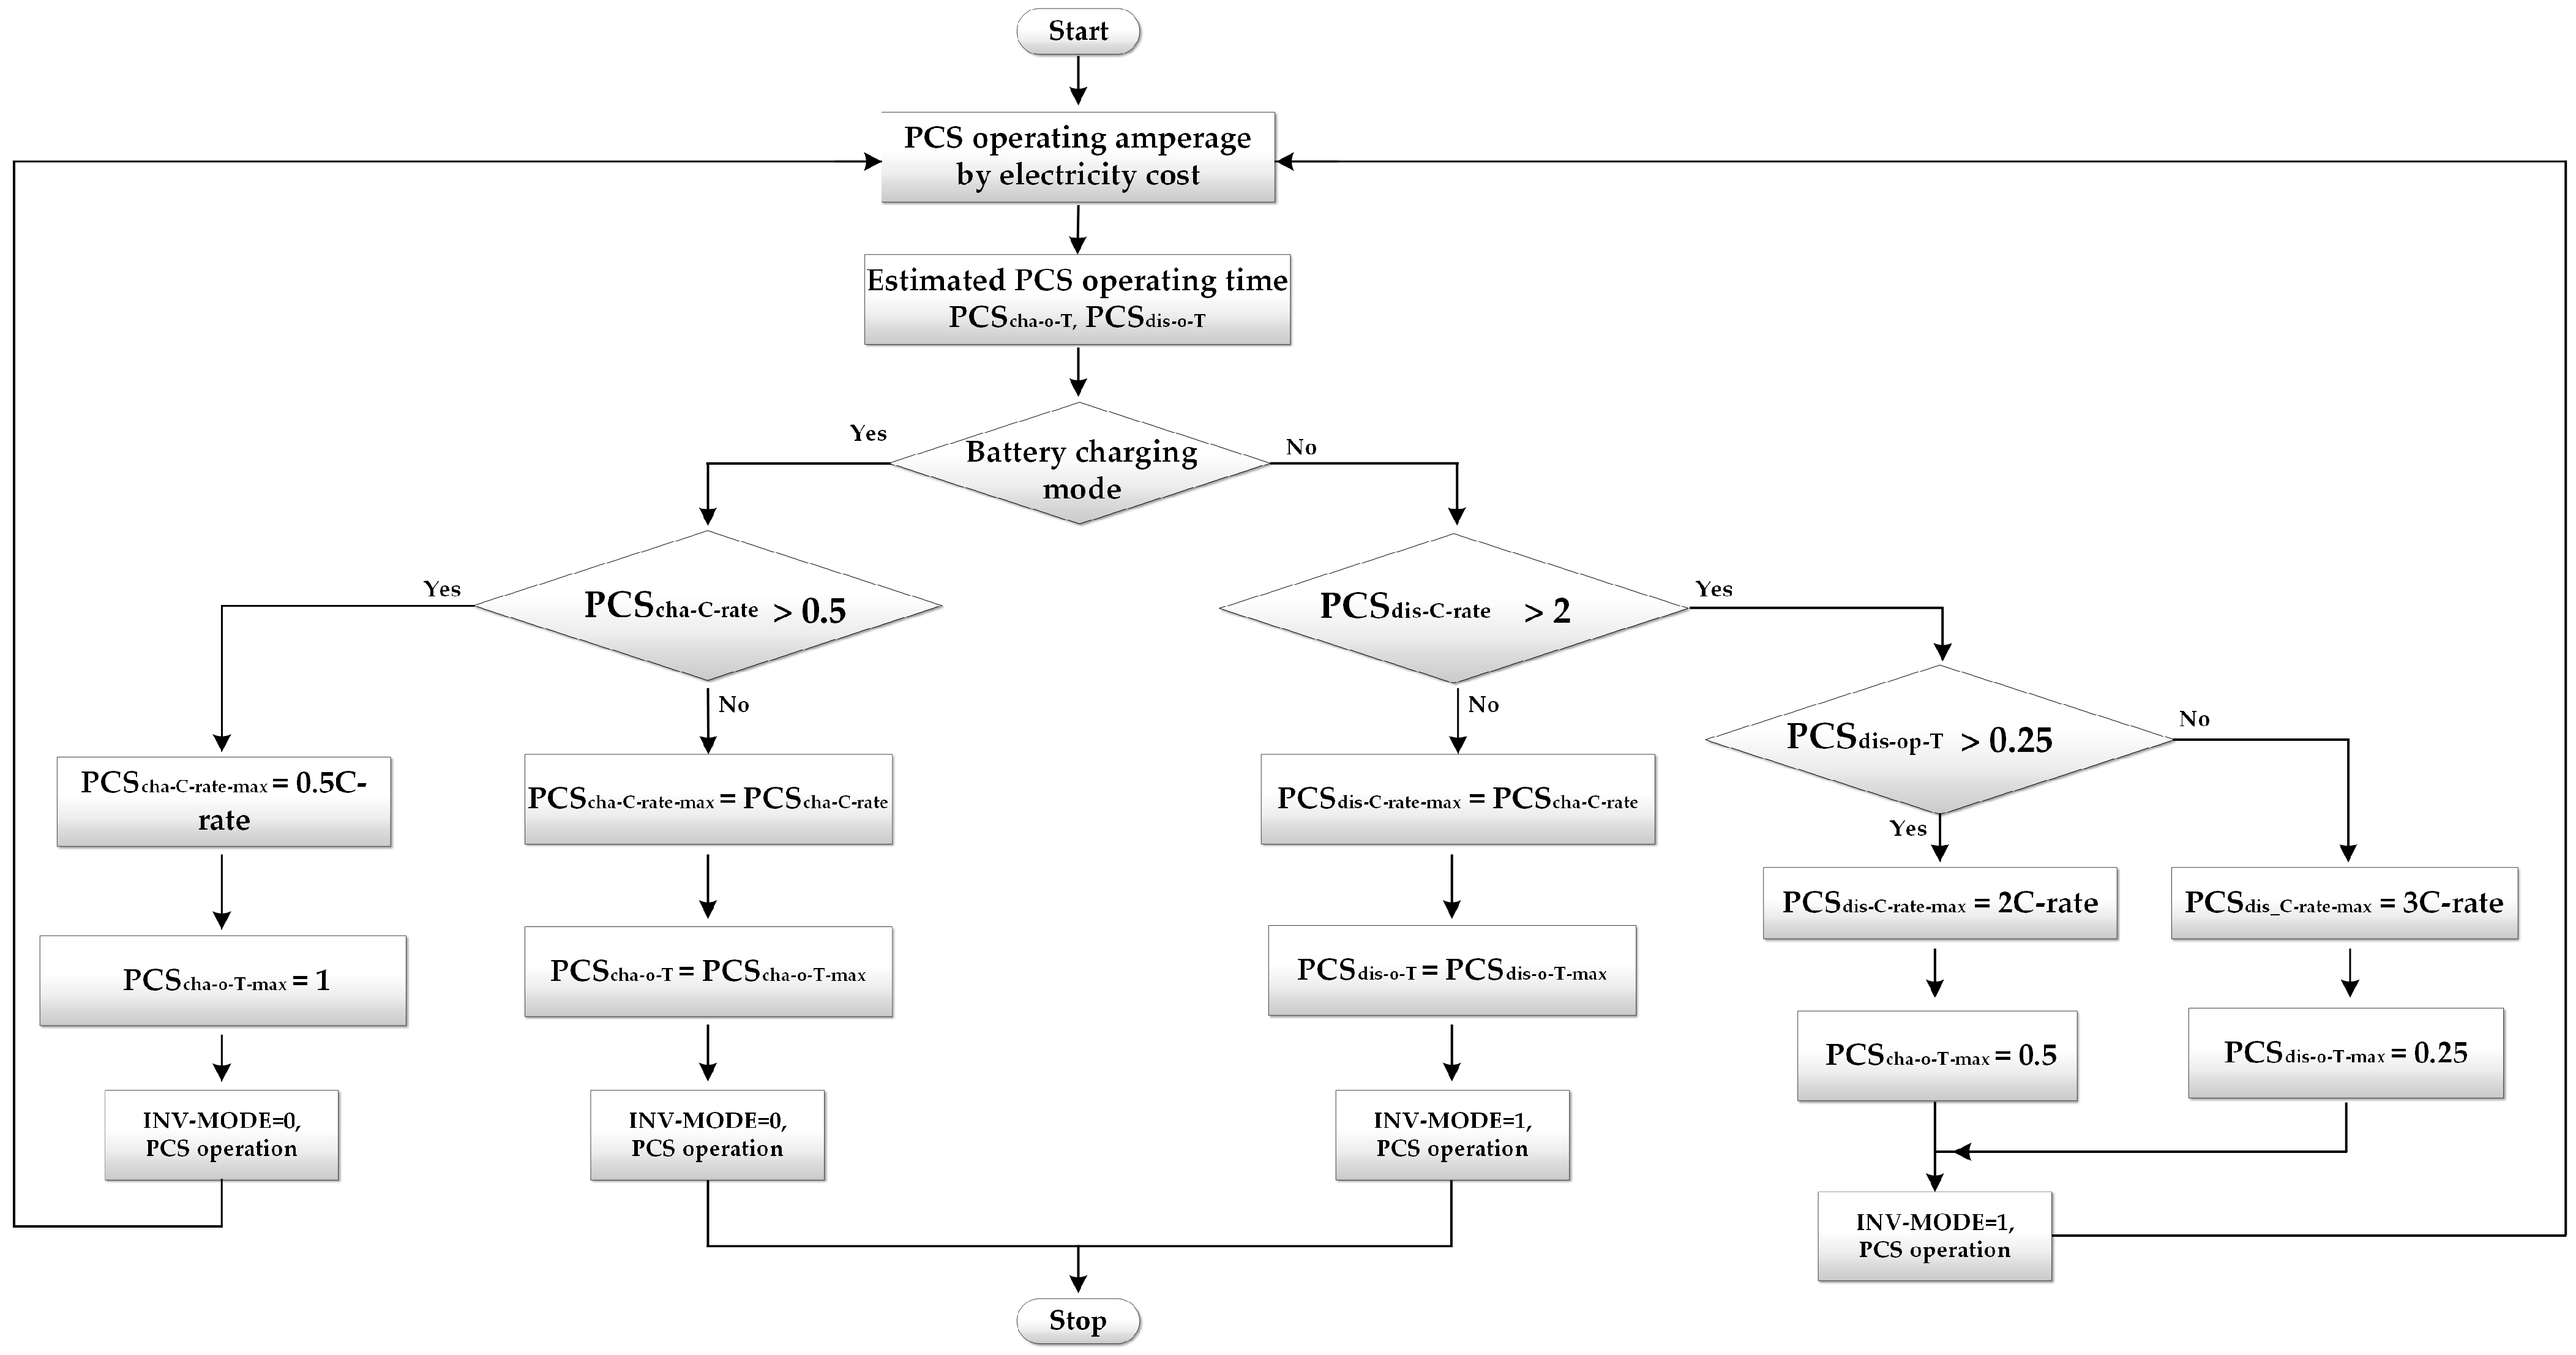
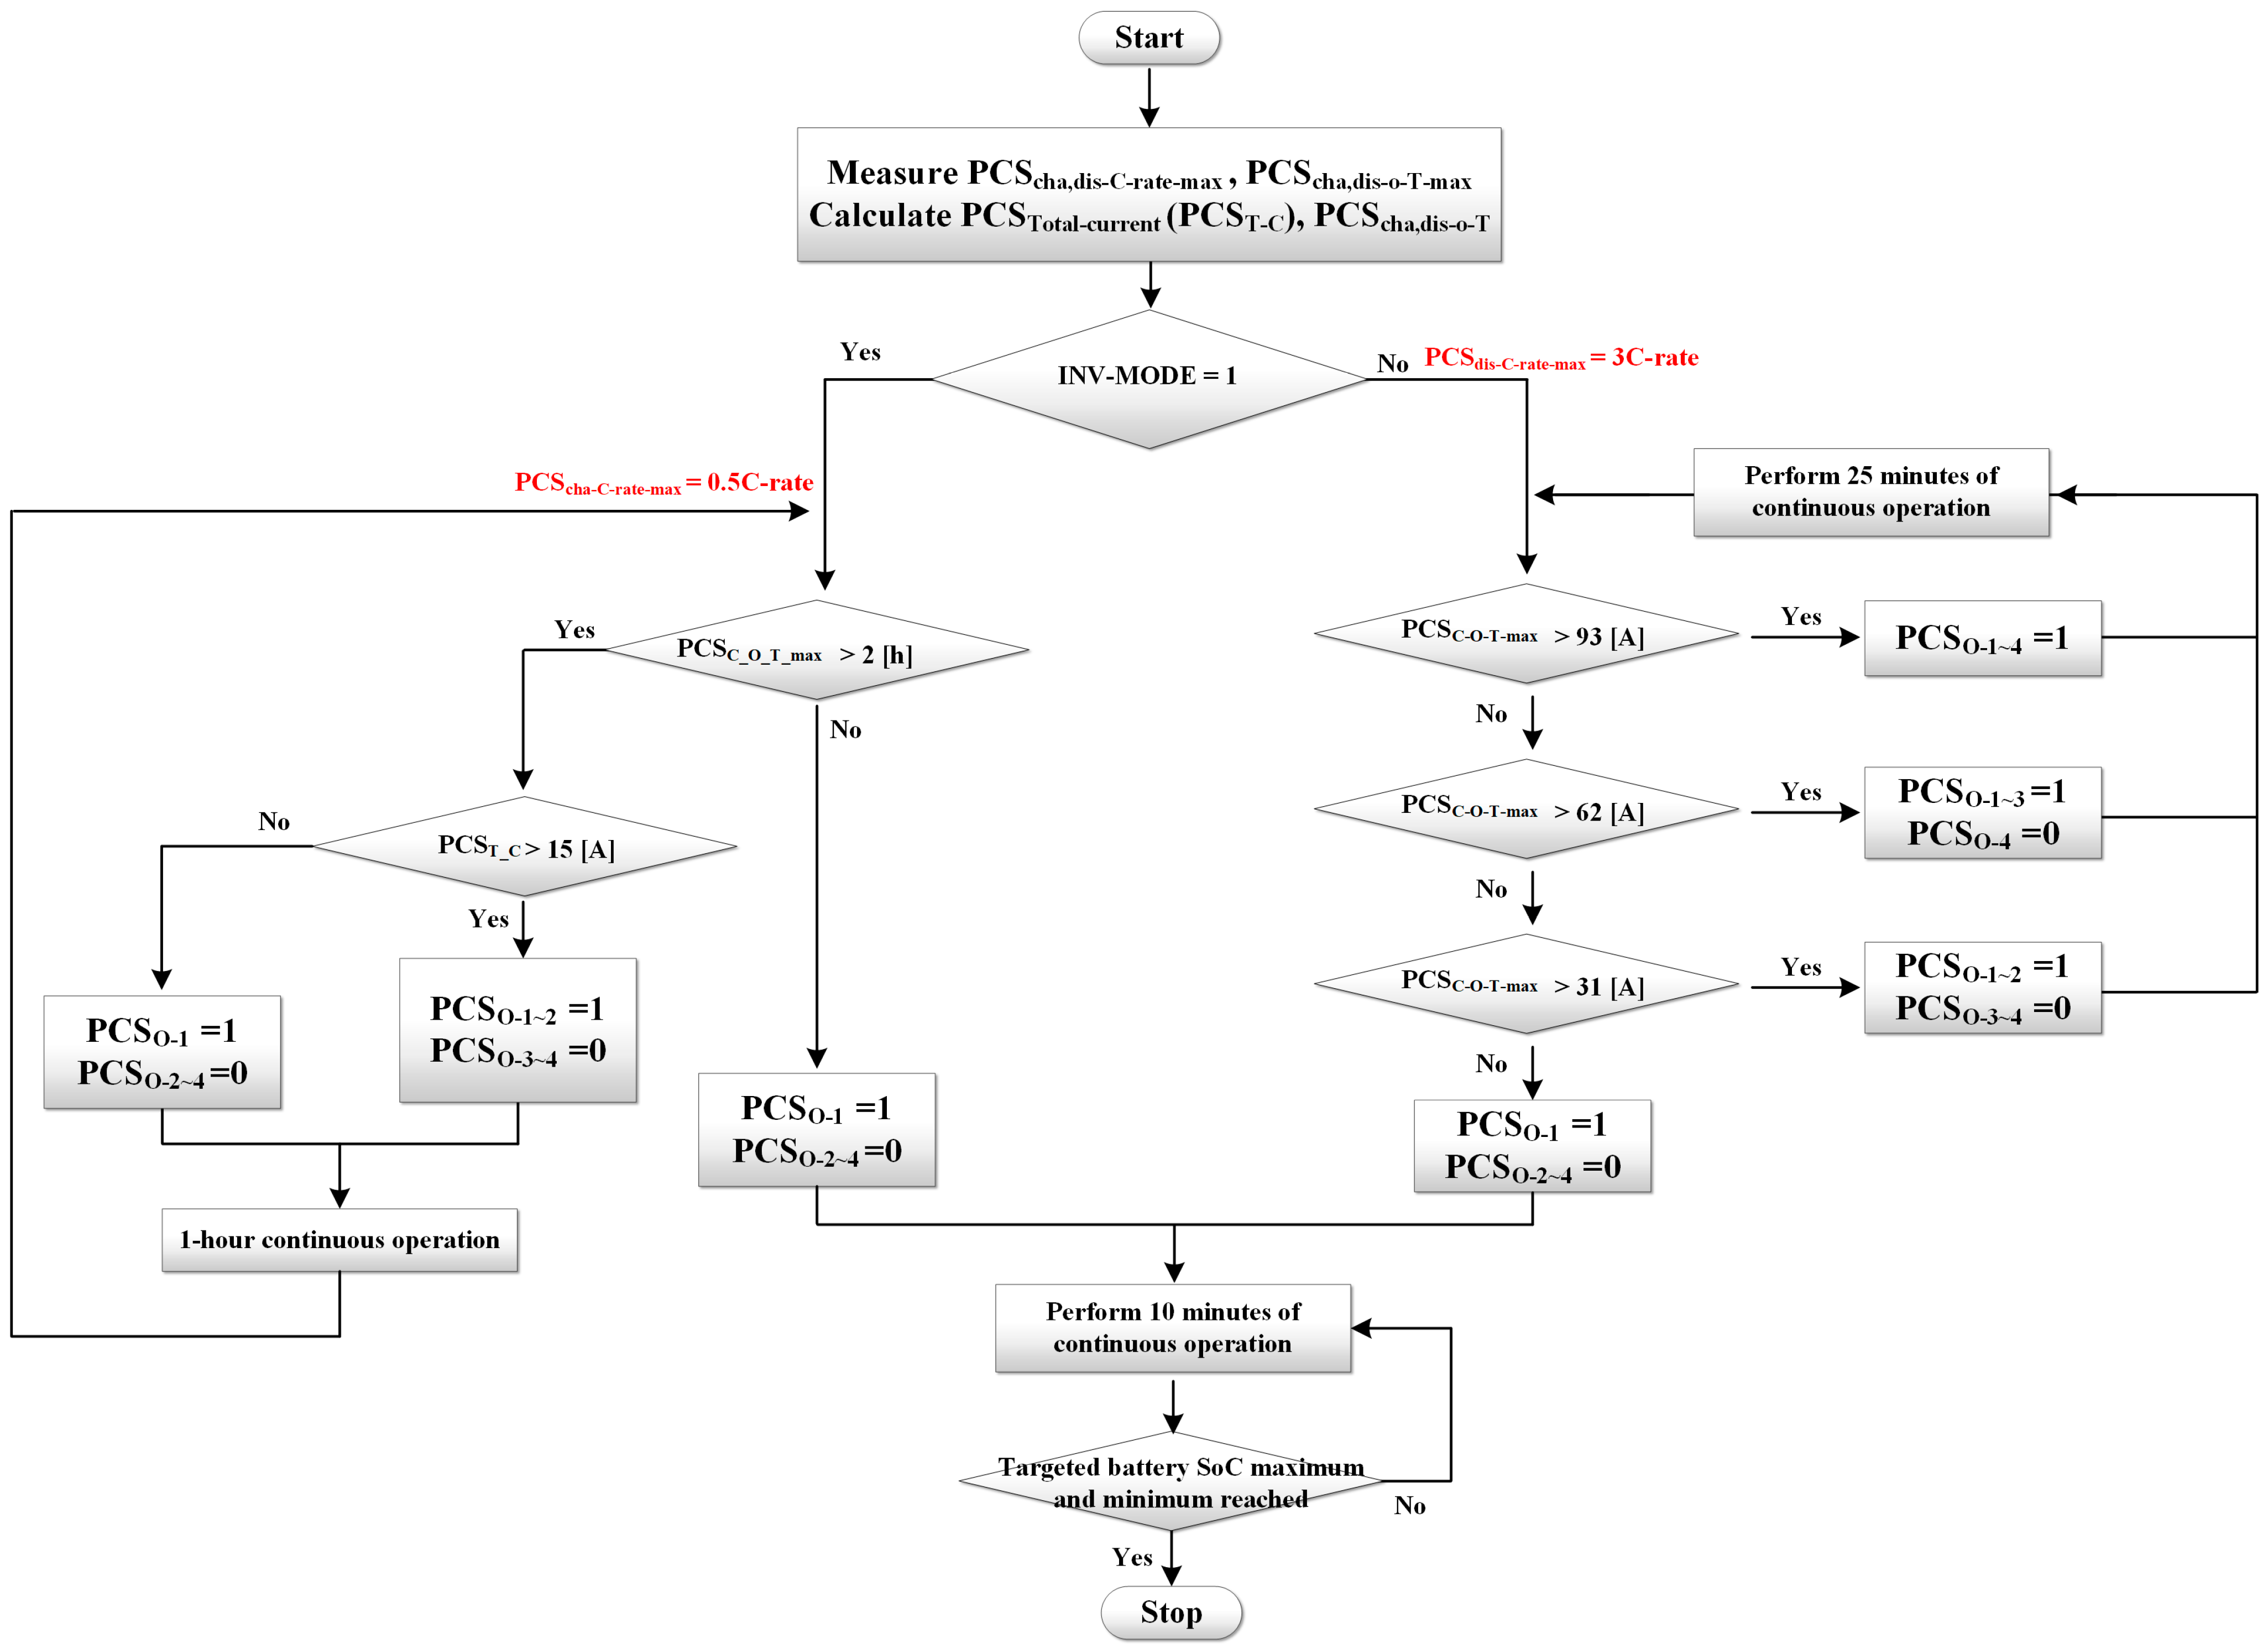
2.3. Algorithm for PCS Operation
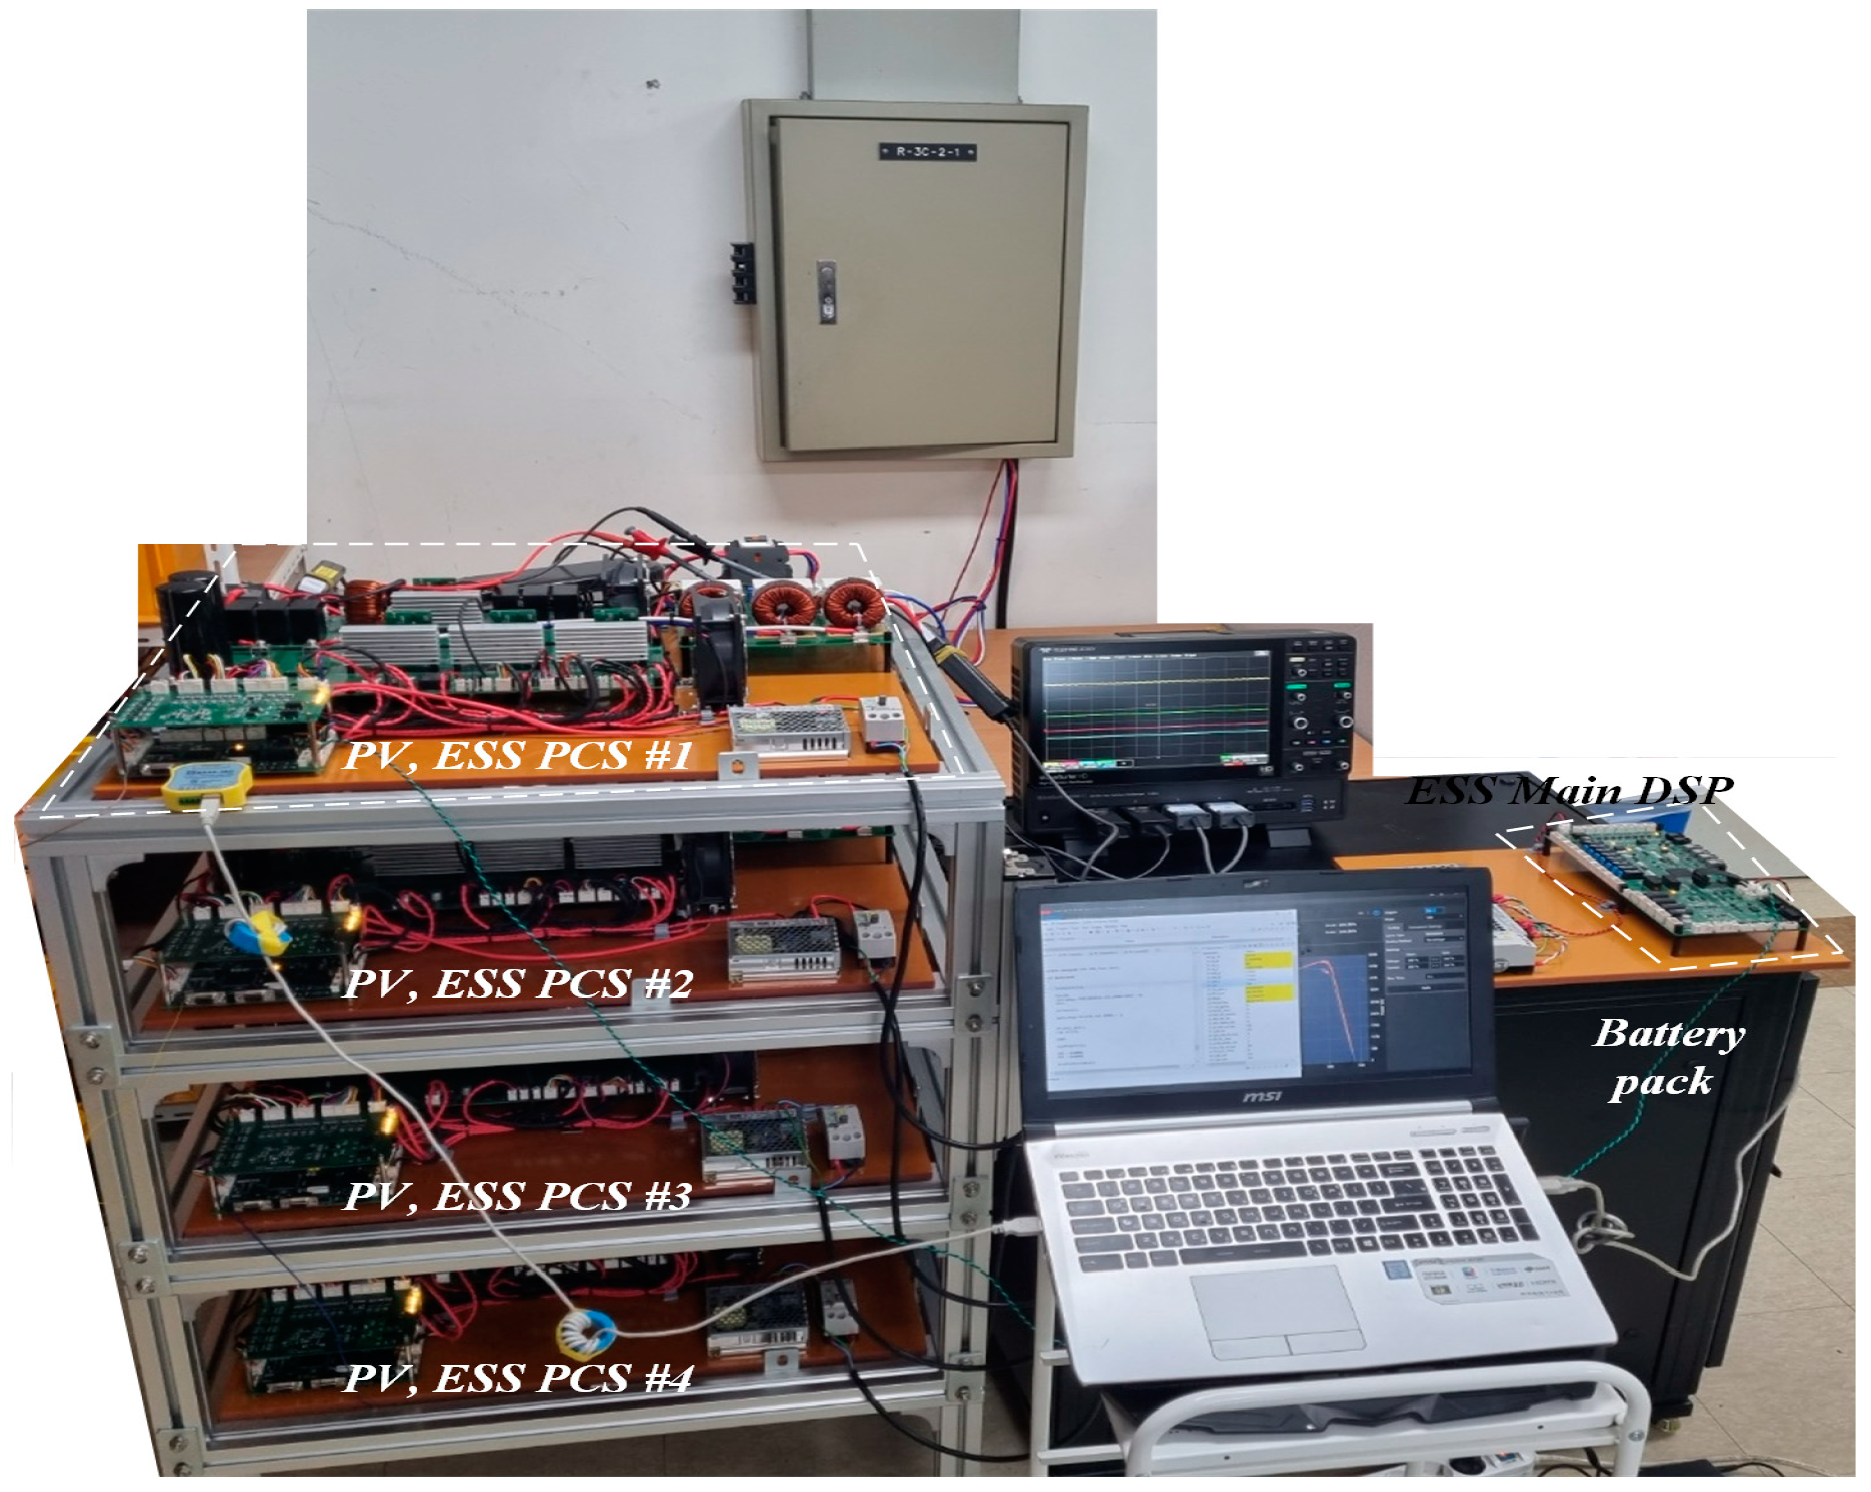
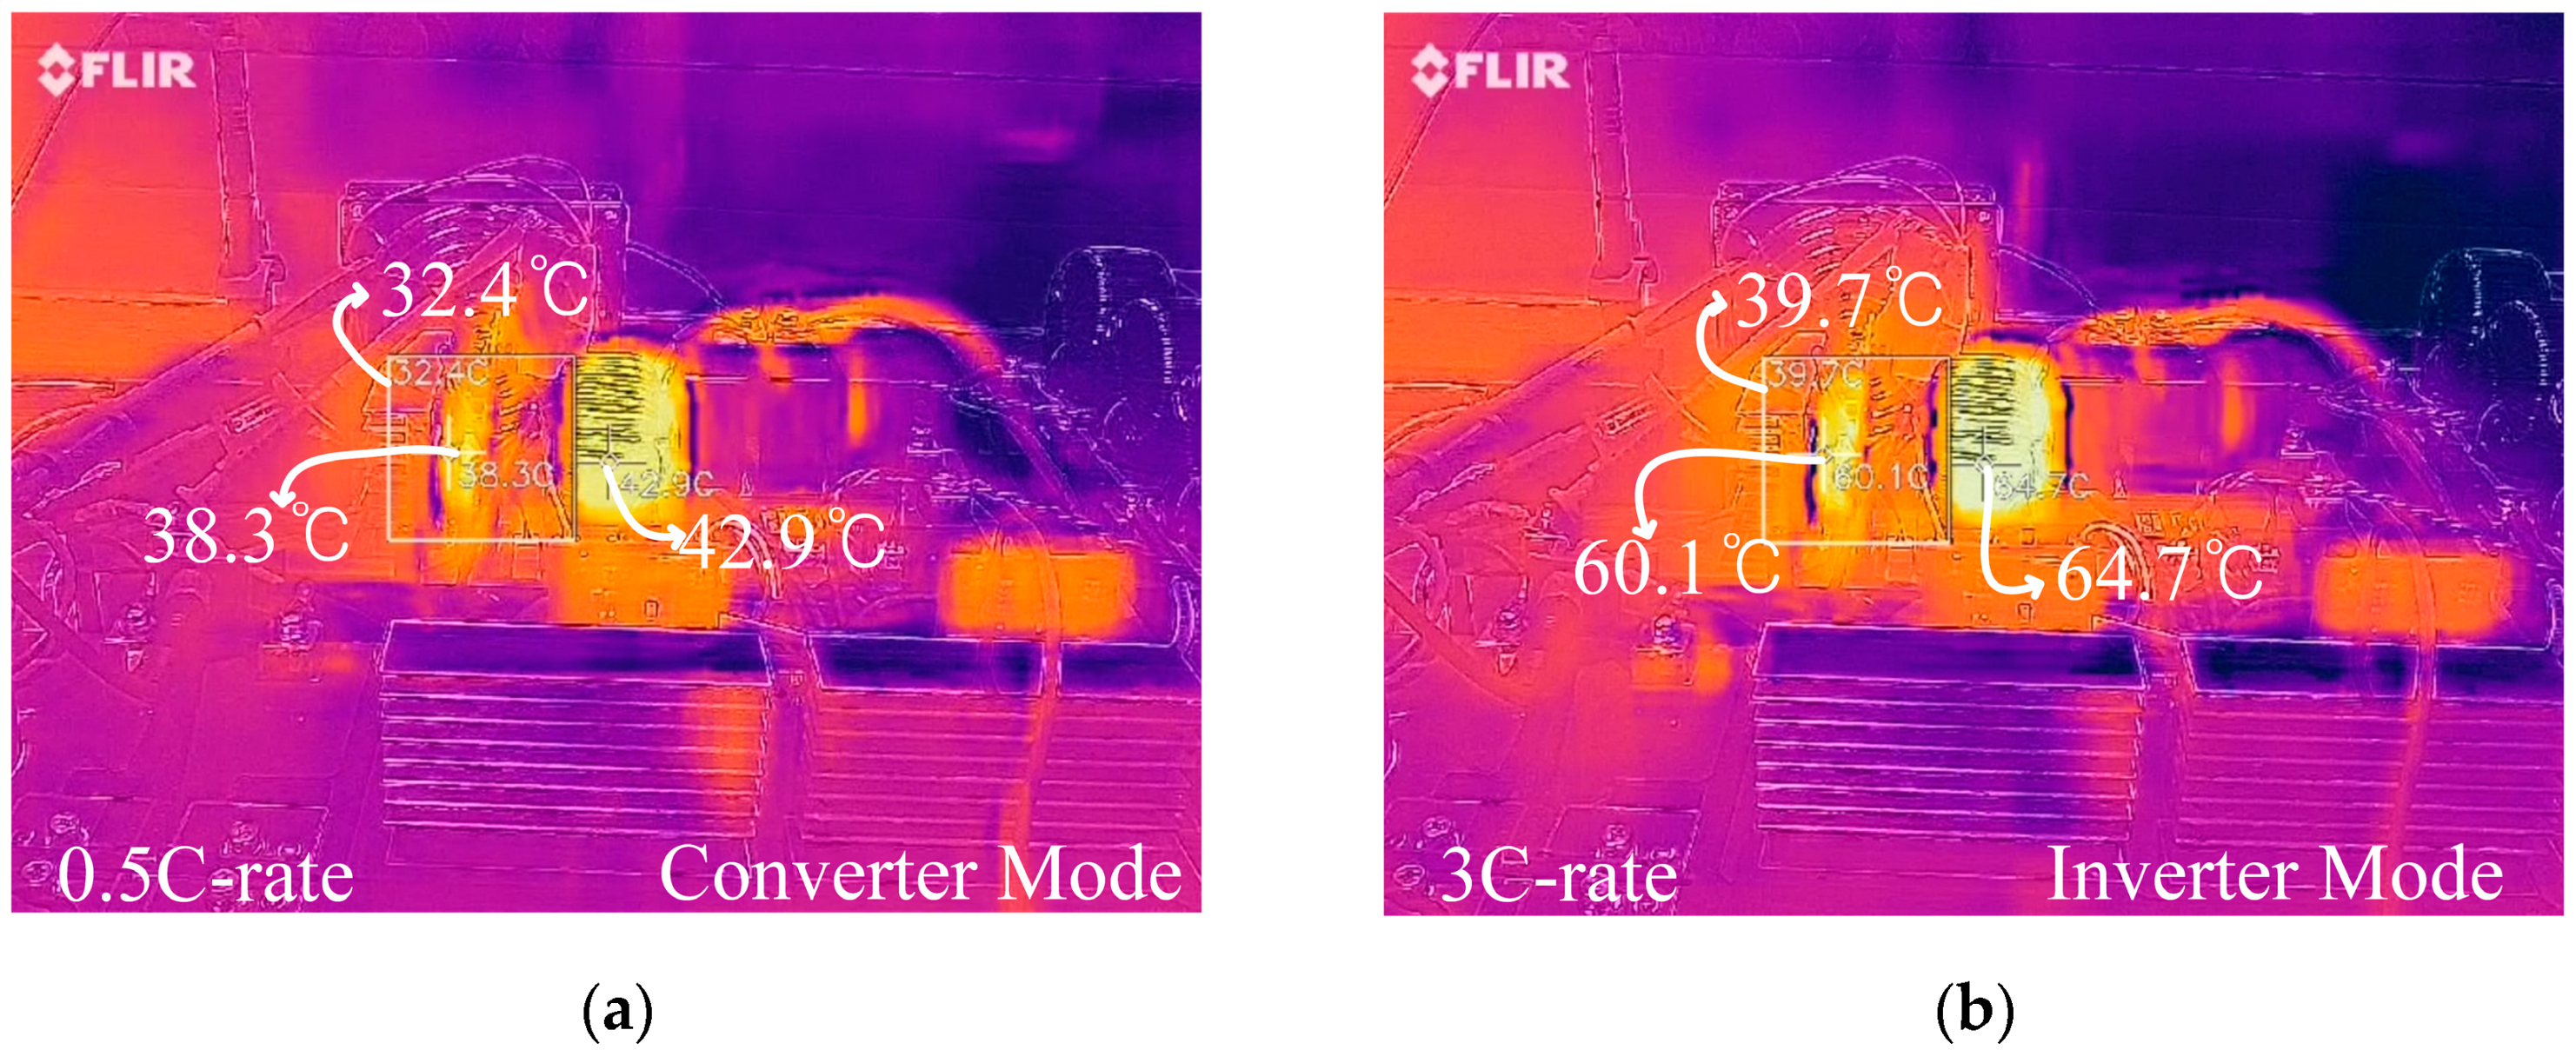
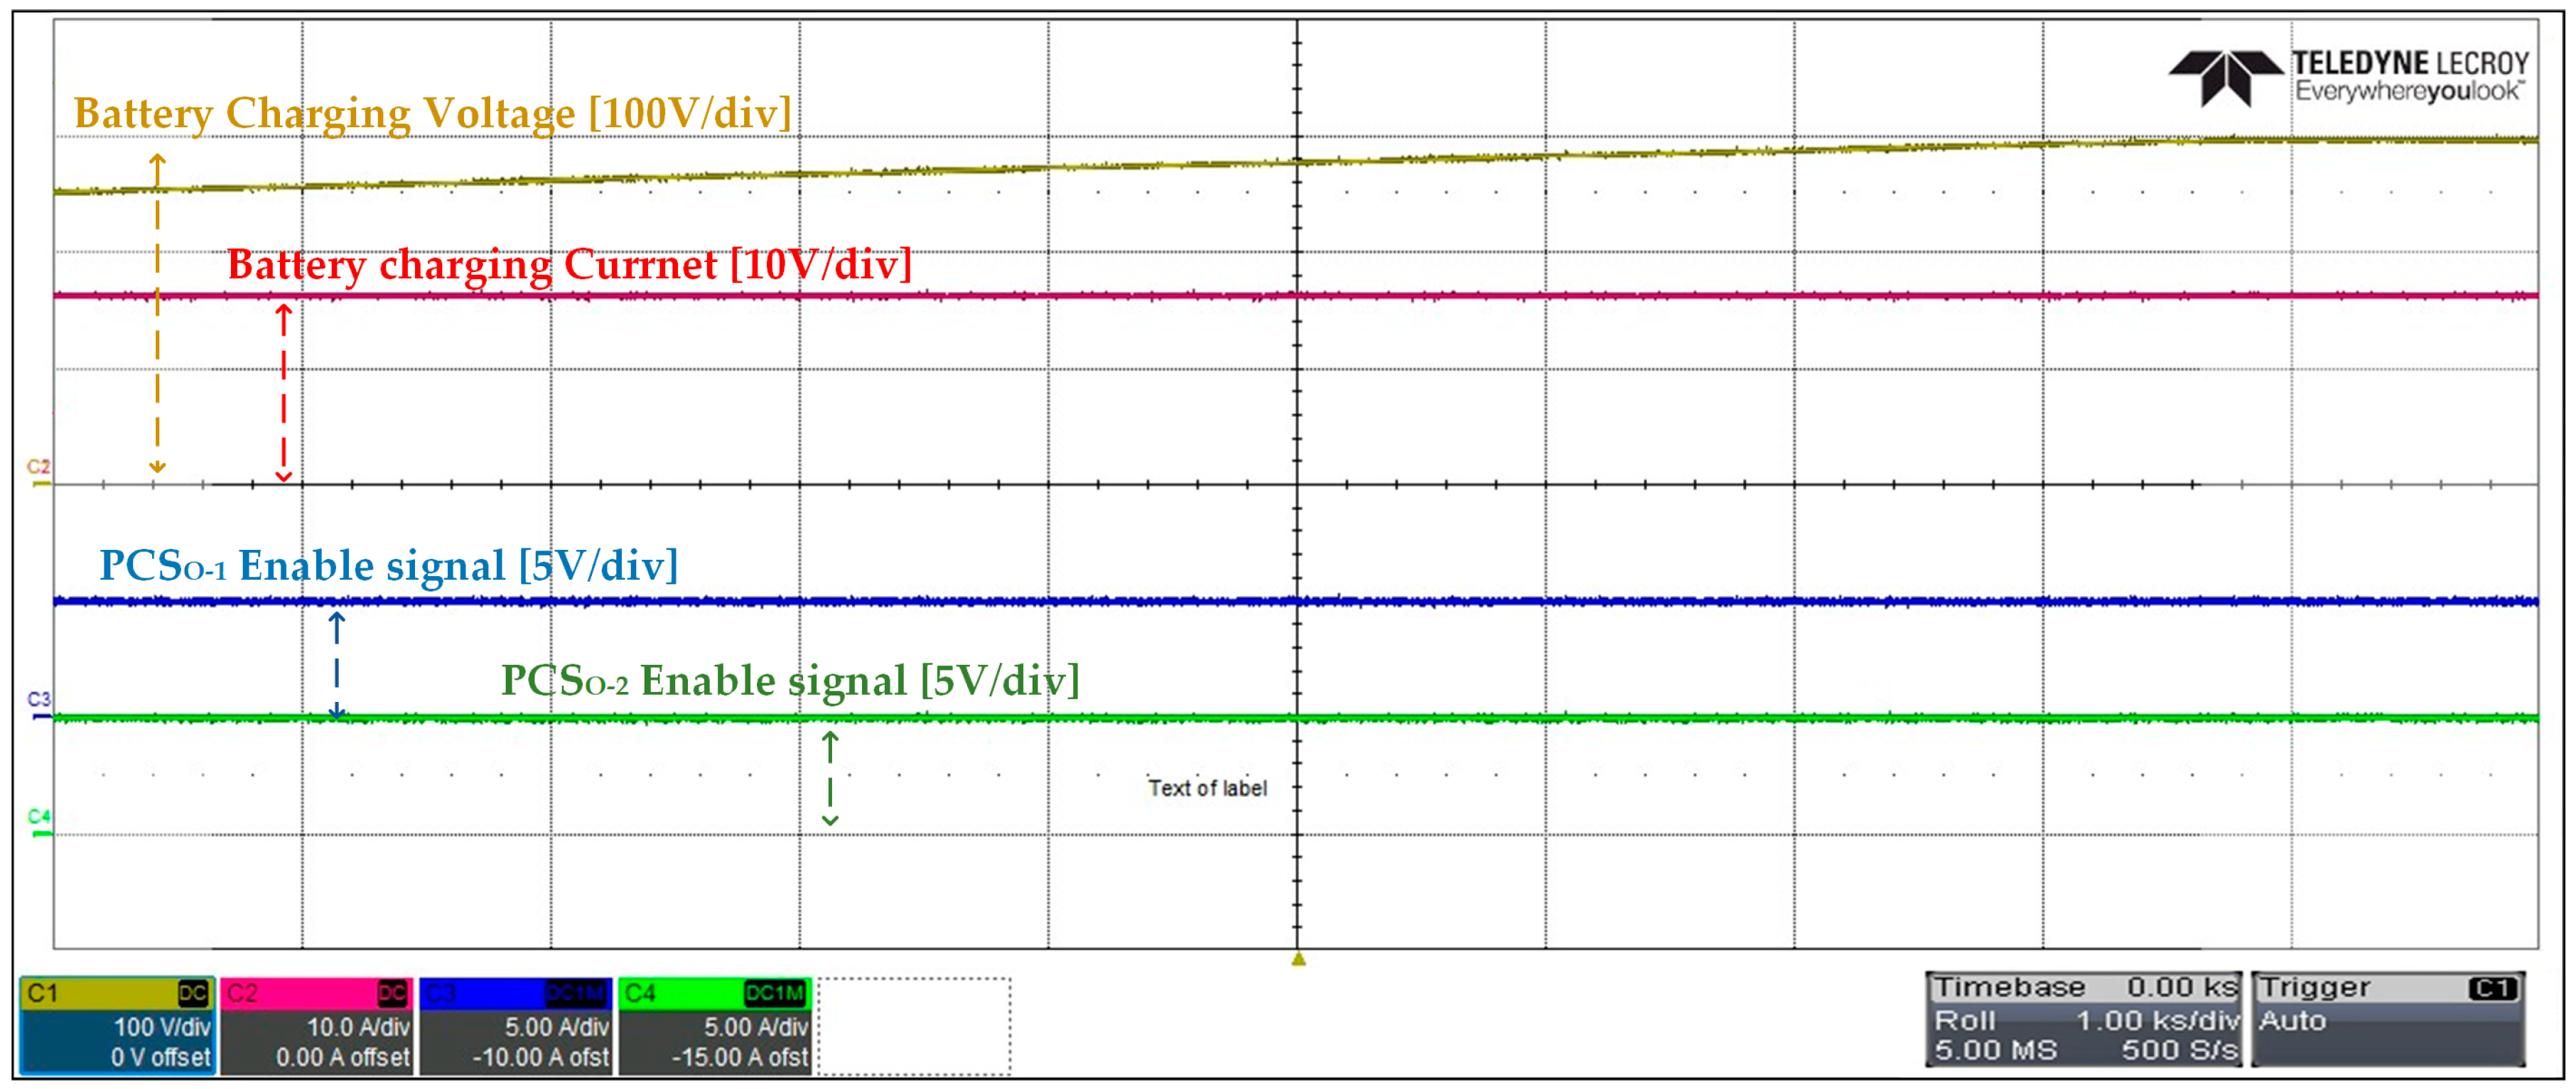
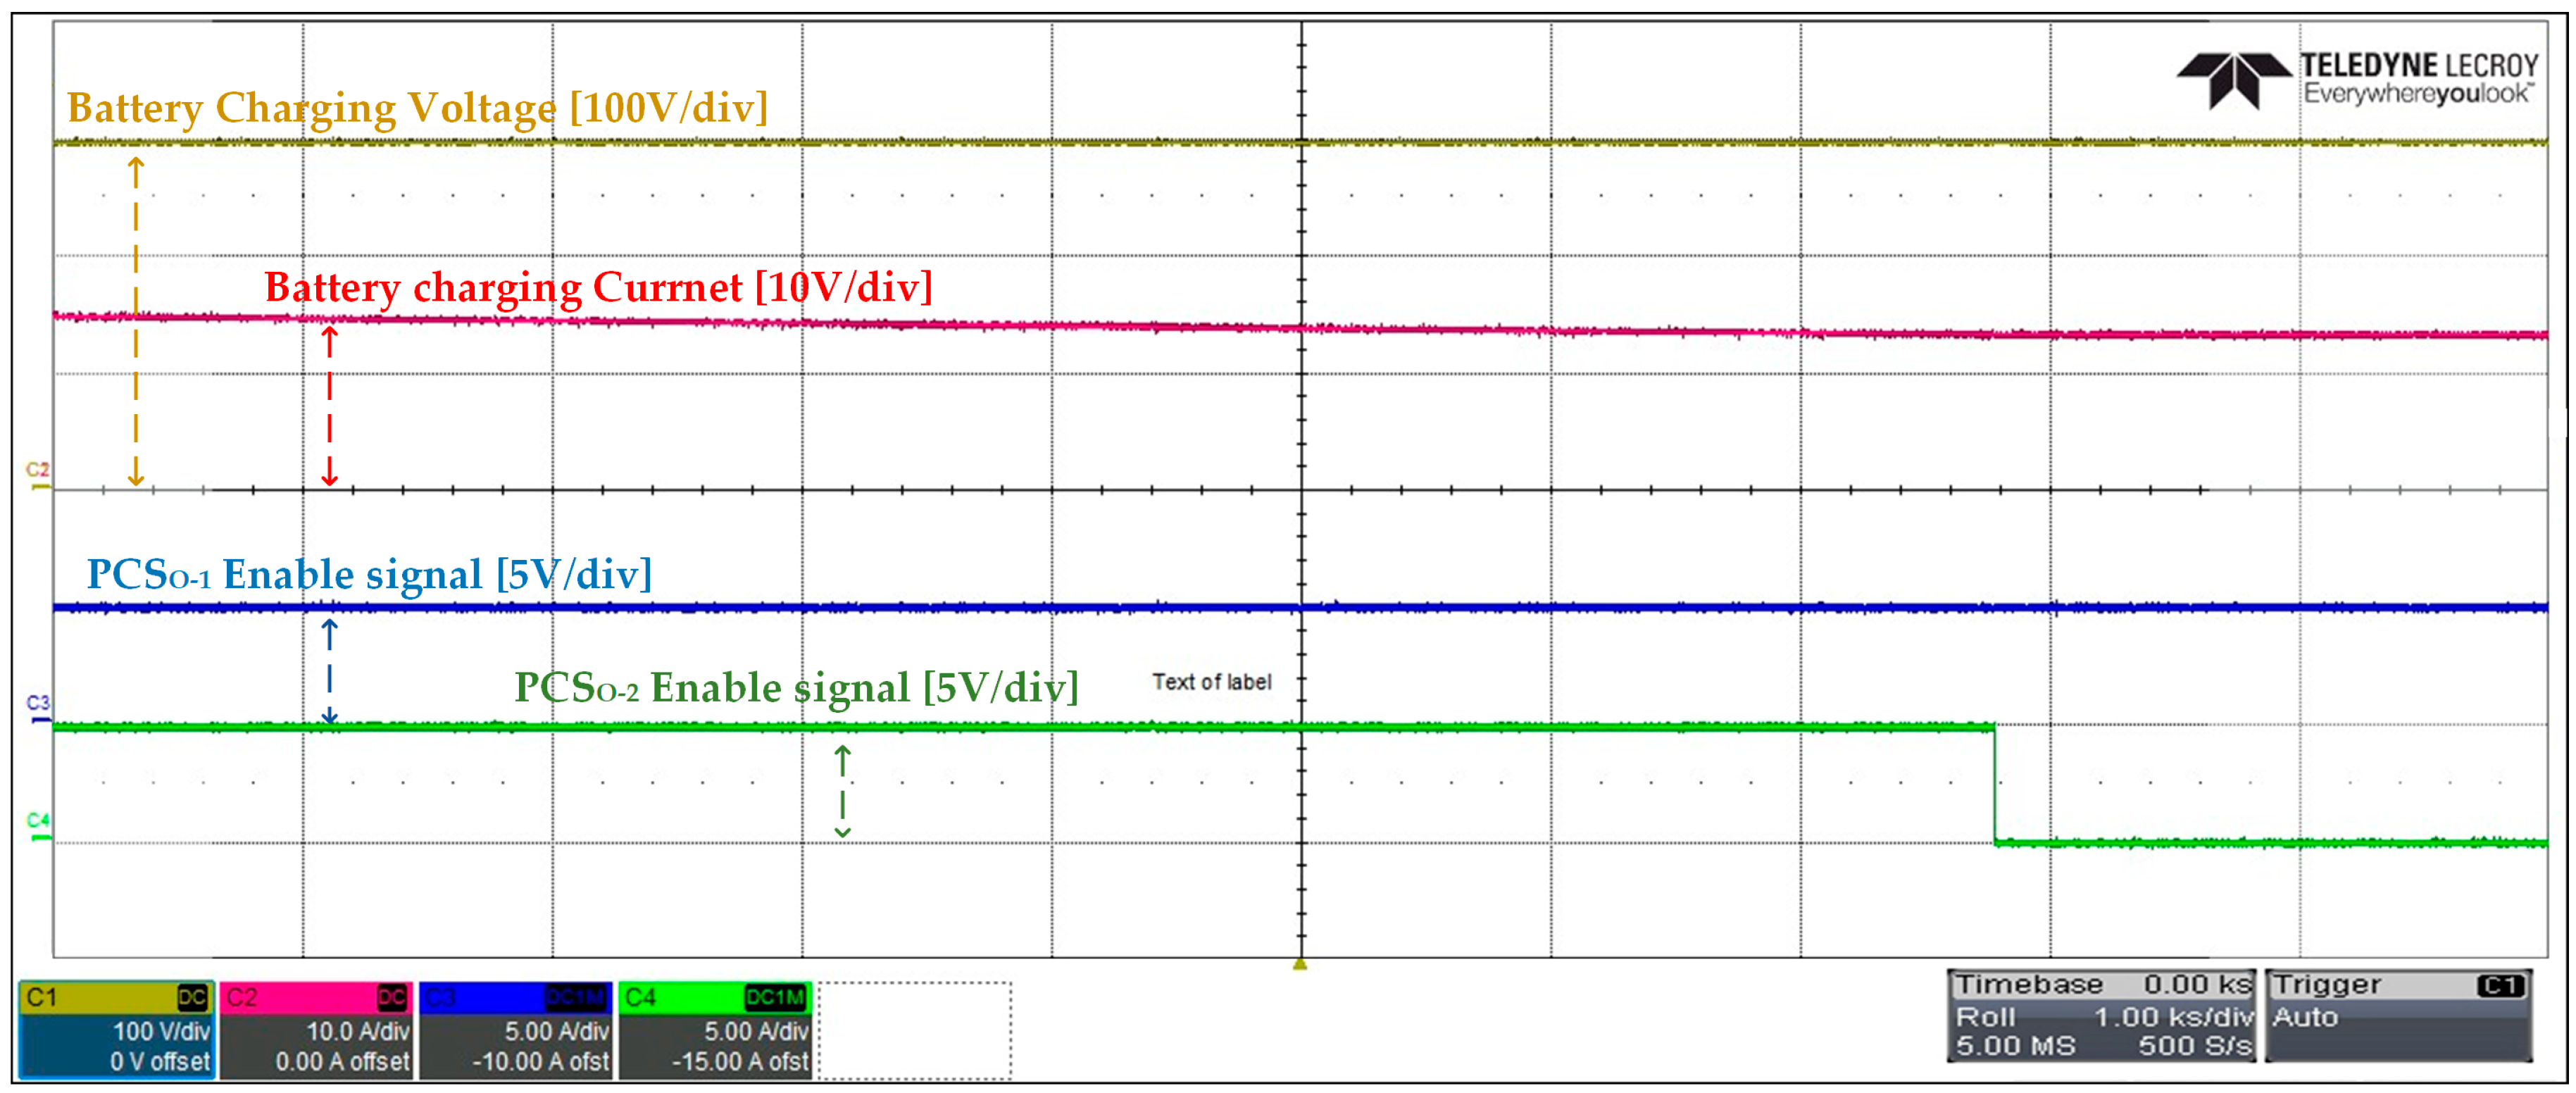
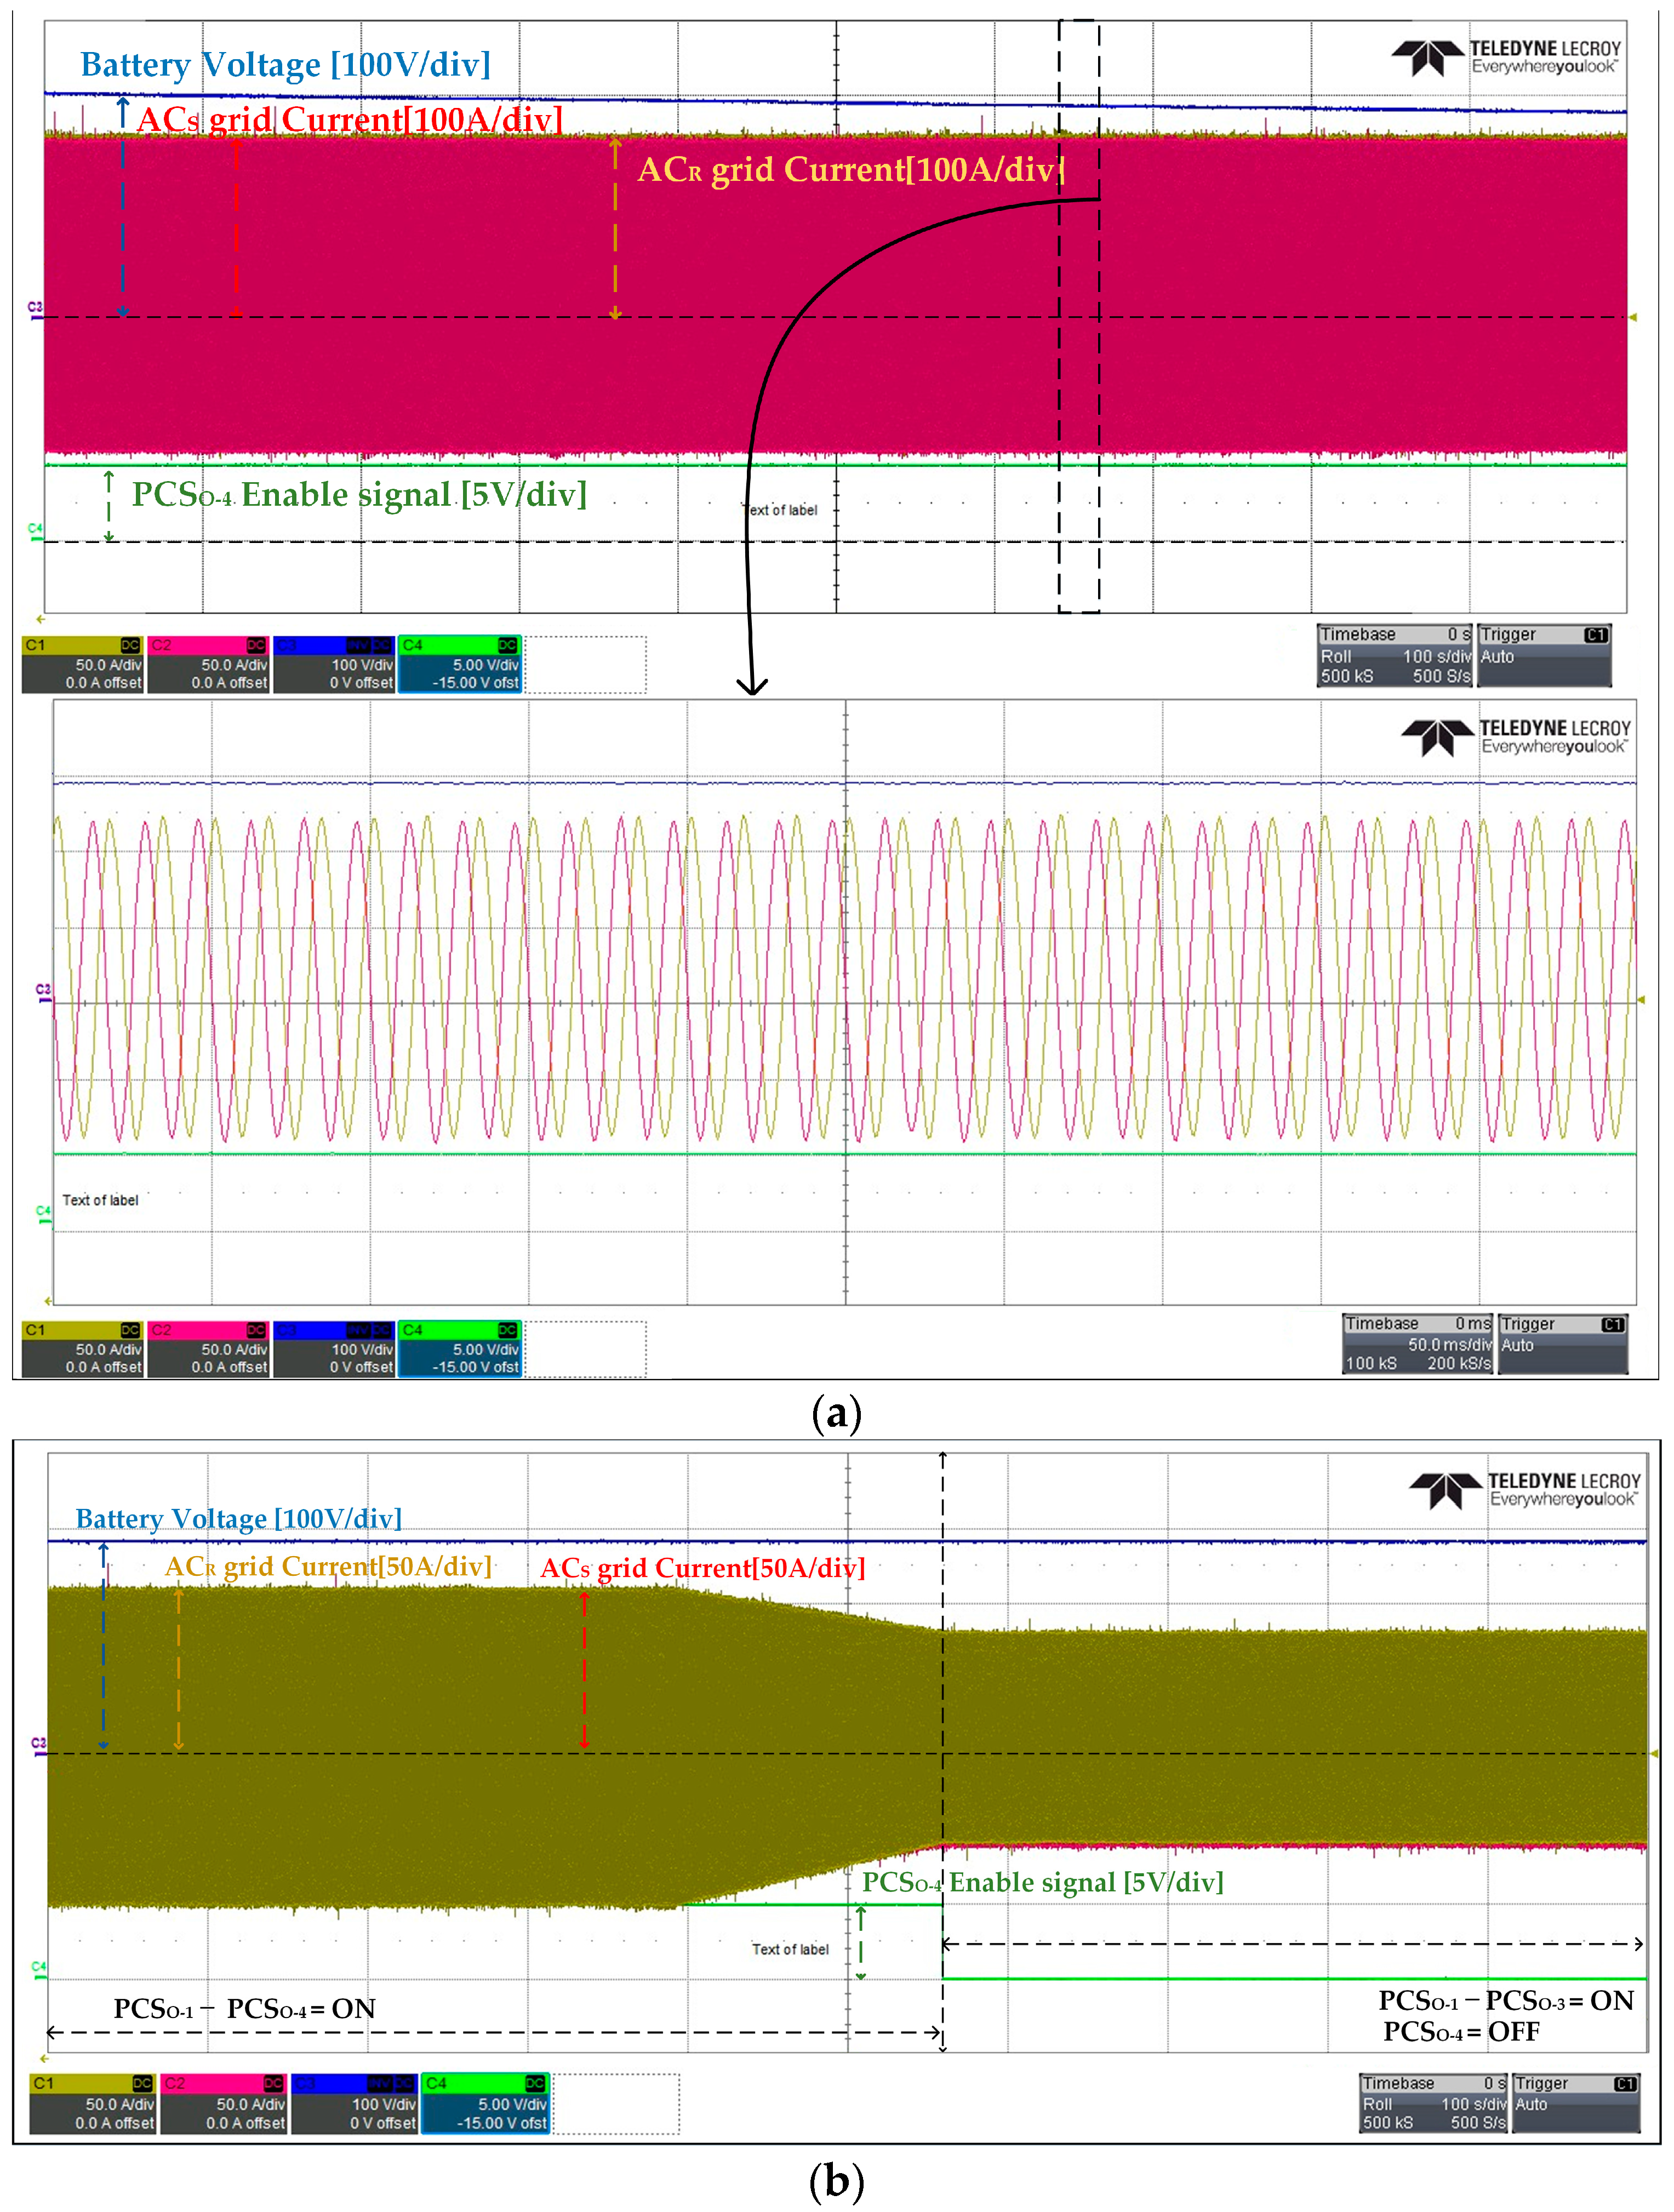
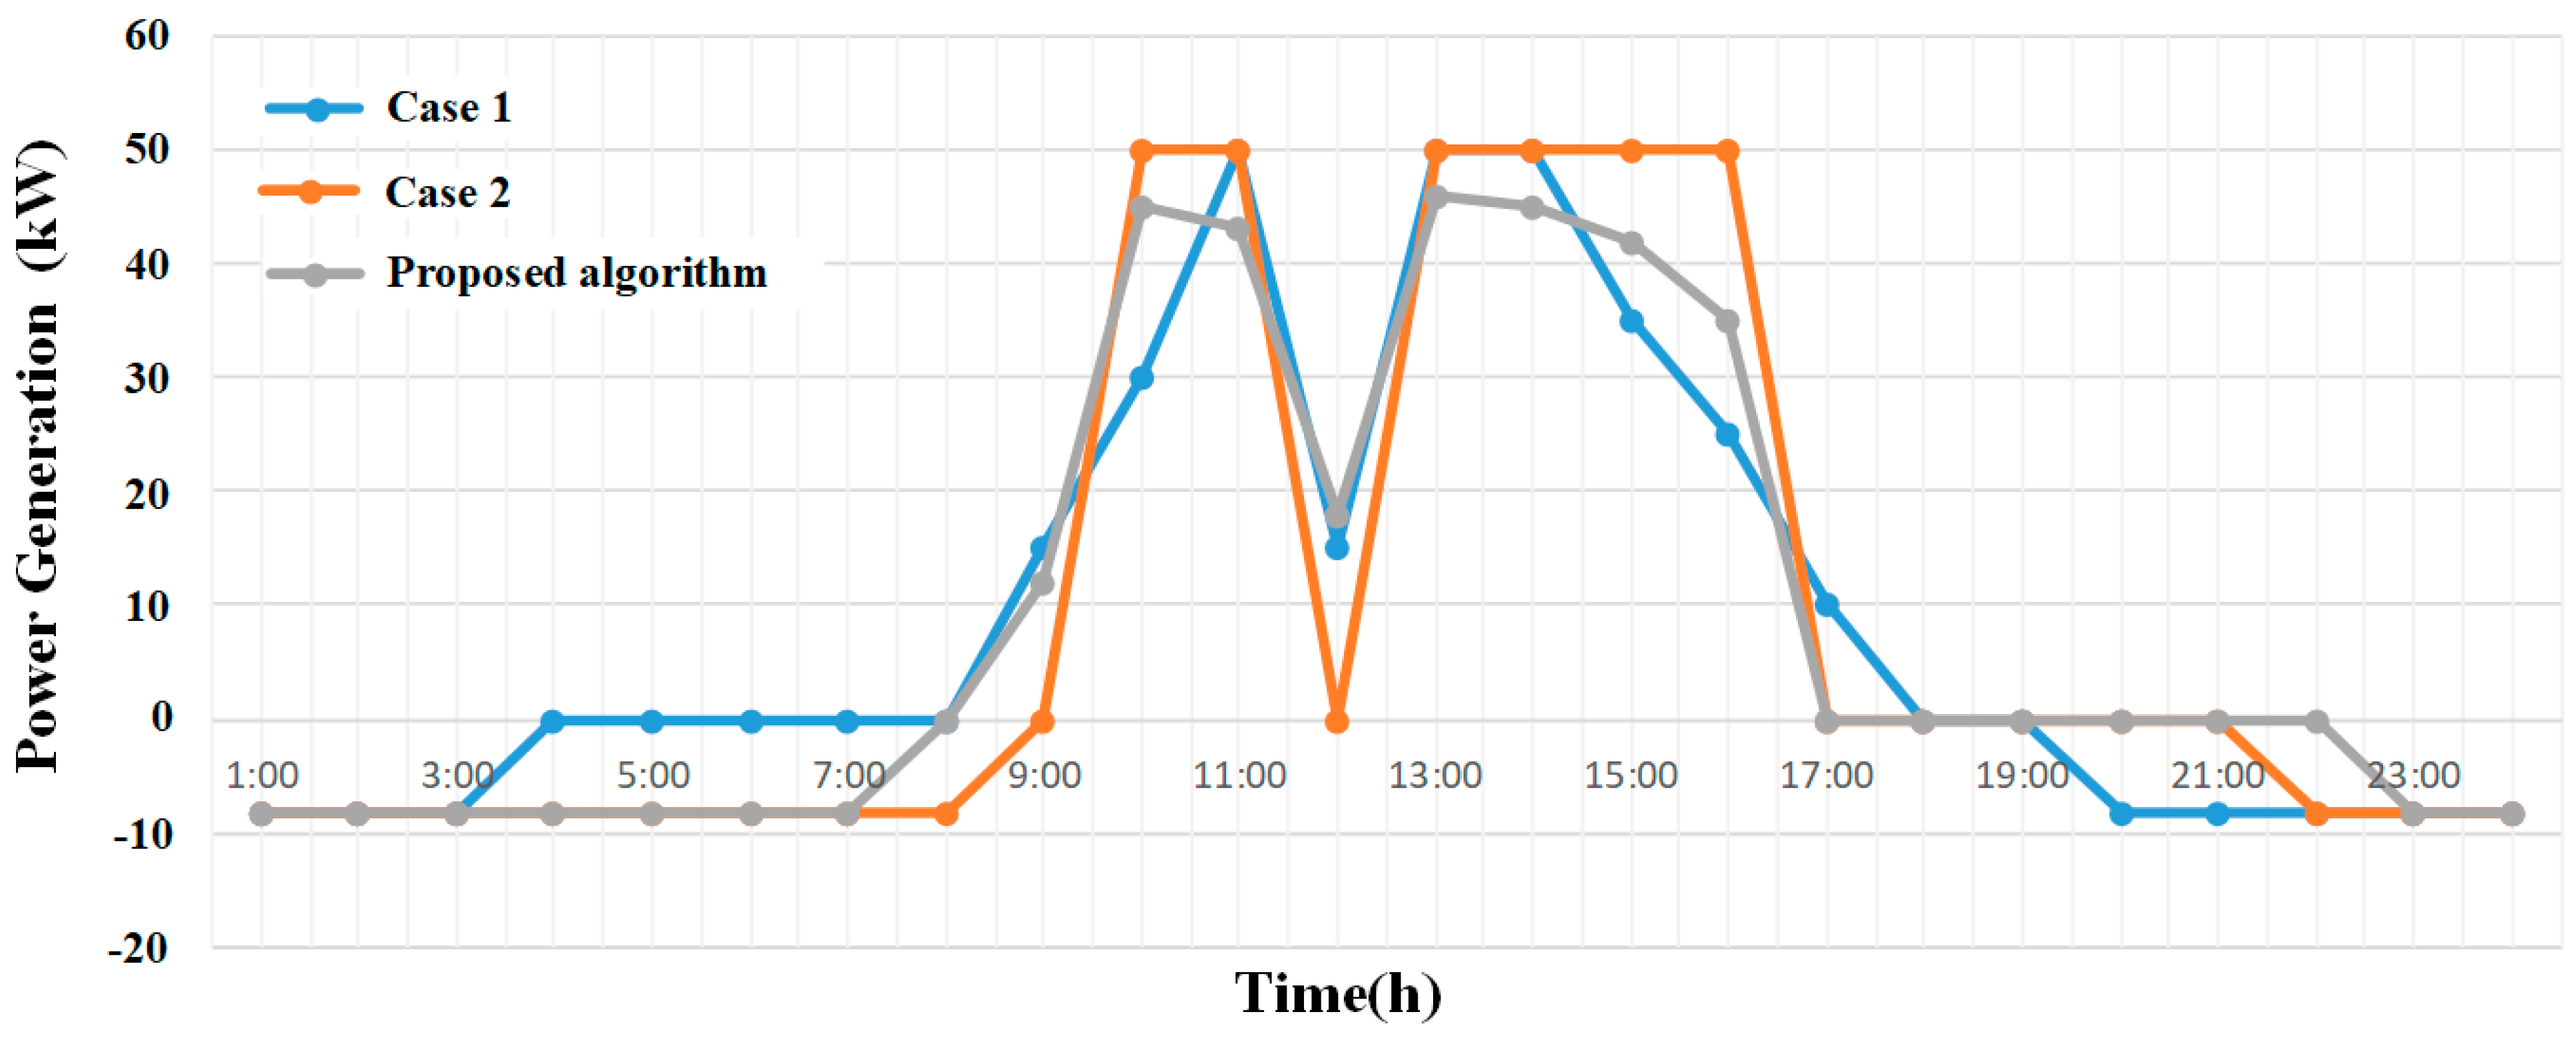
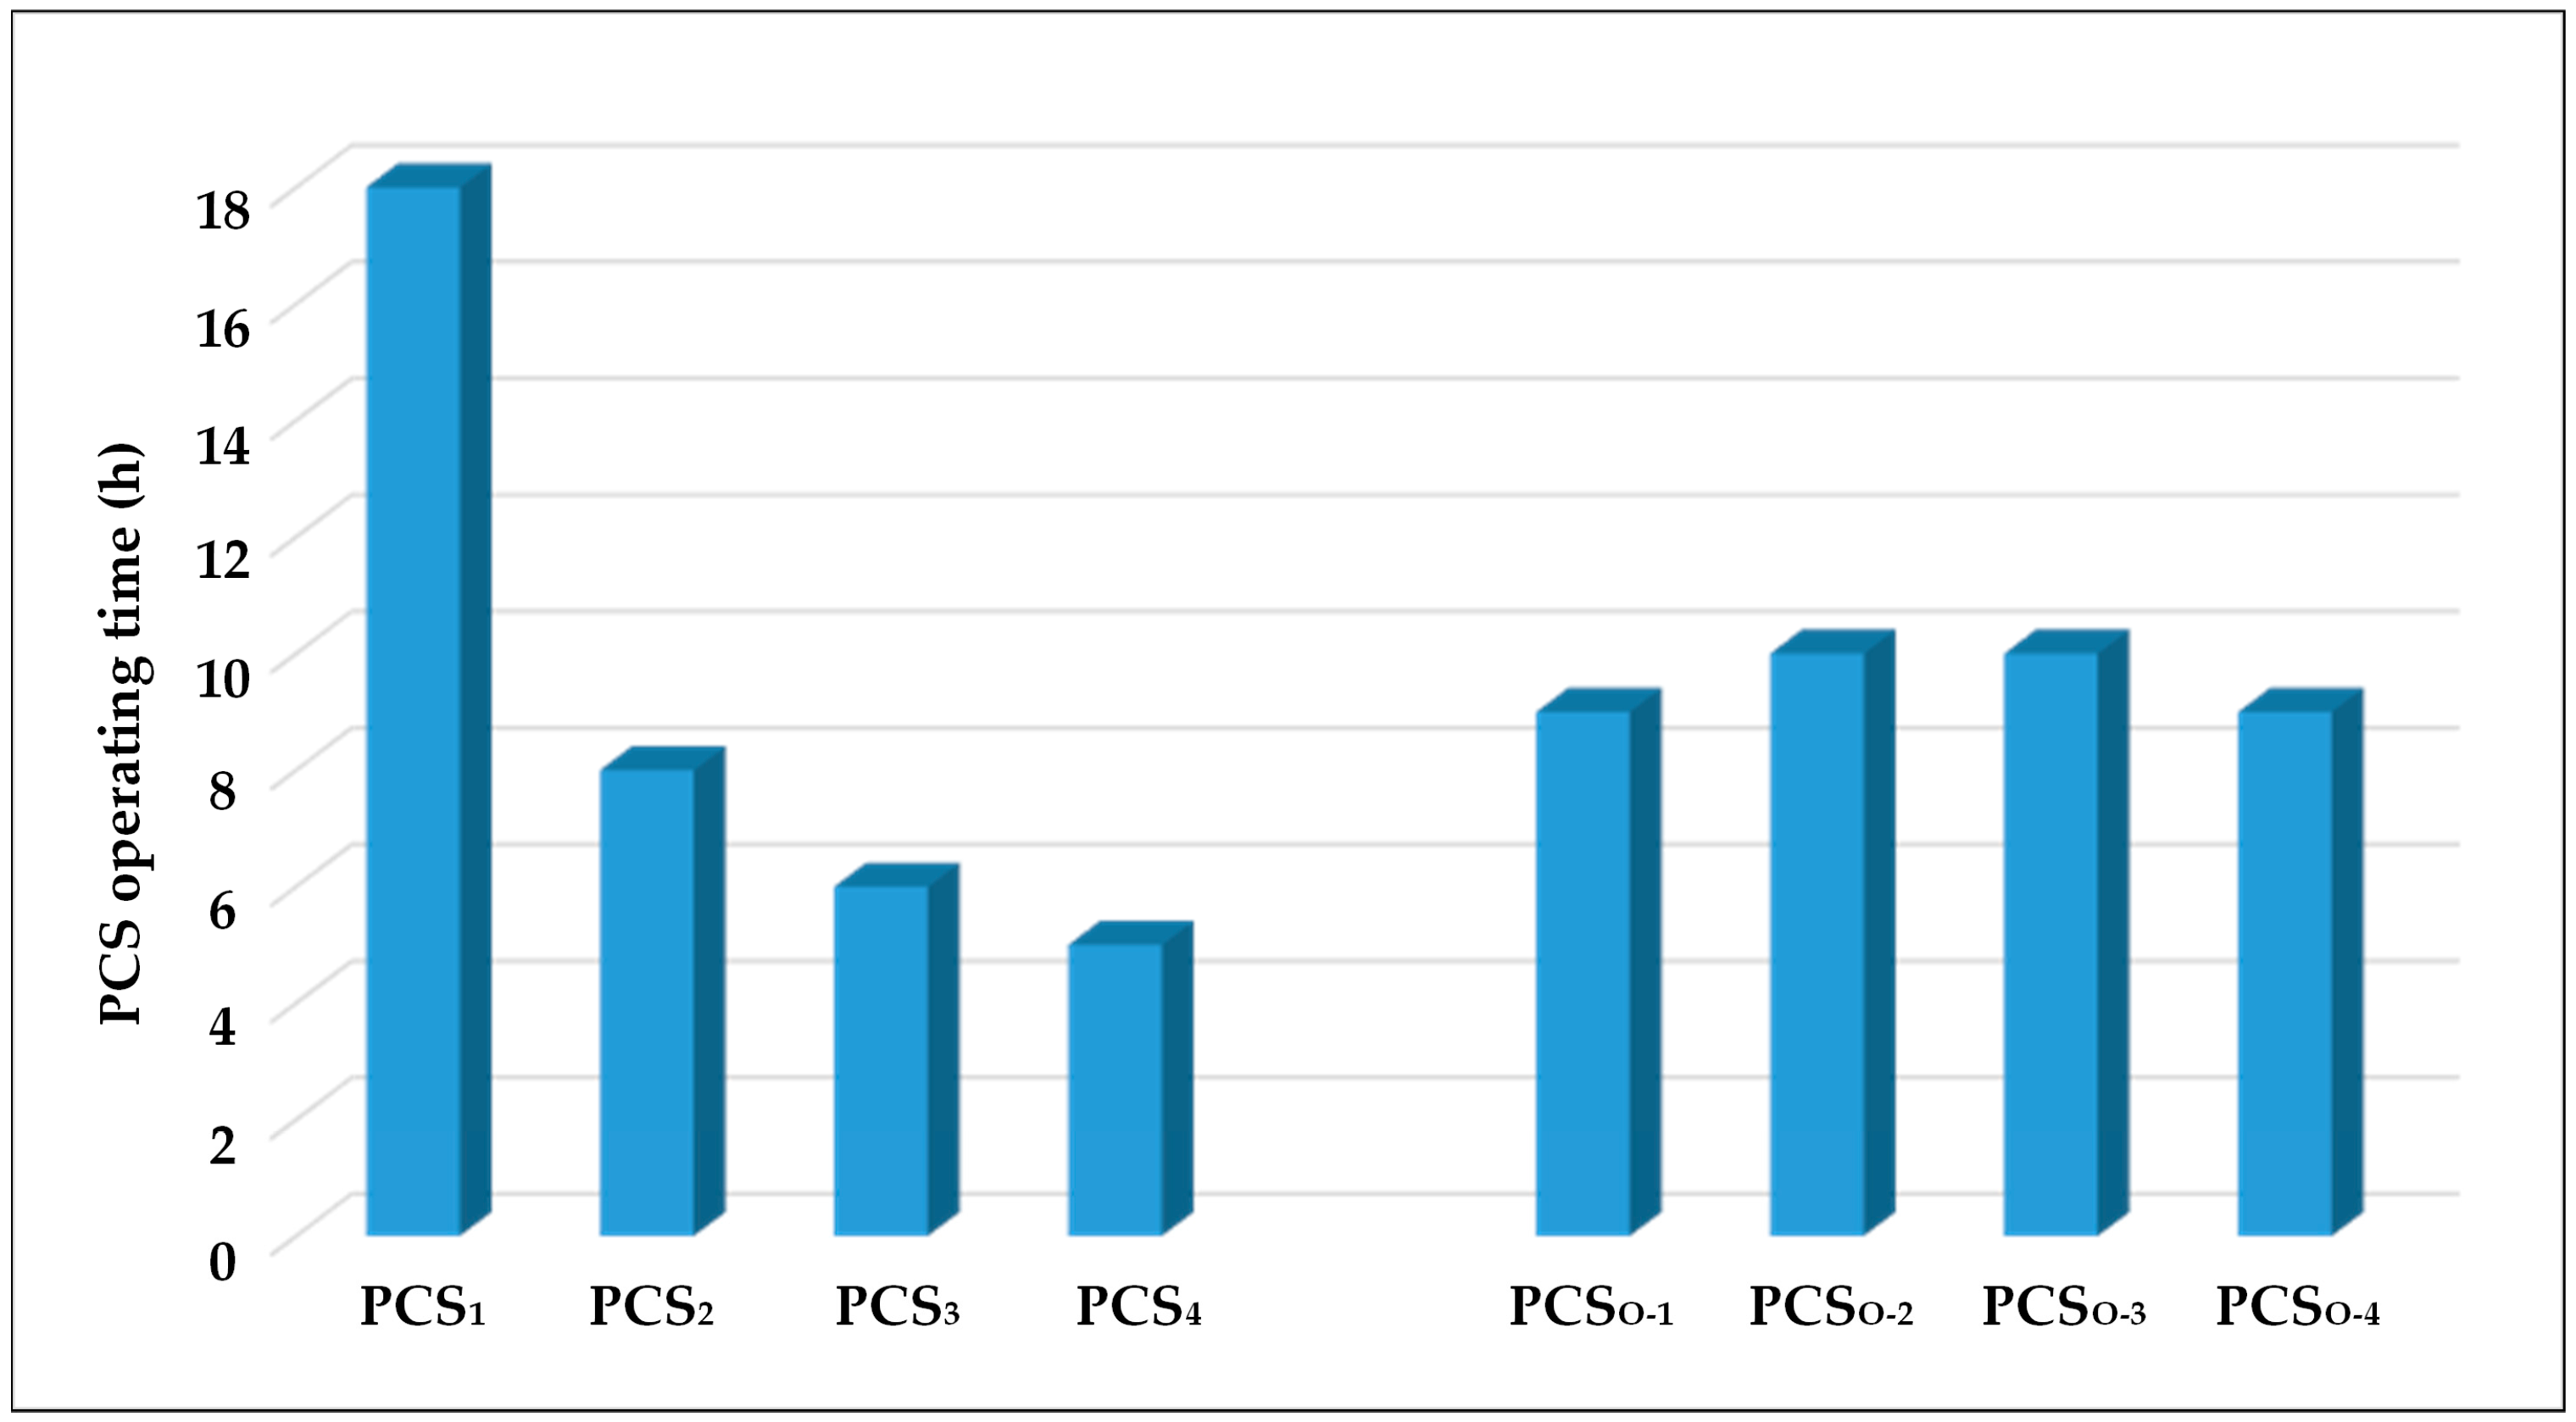
3. Experiment Results
4. Conclusions
Author Contributions
Funding
Institutional Review Board Statement
Informed Consent Statement
Data Availability Statement
Acknowledgments
Conflicts of Interest
References
- Andre, T.; Guerra, F. Renewables Global Status Report; REN21: Paris, France, 2020; ISBN 978-3-948393-00-7. [Google Scholar]
- Denholm, P.; O’Connell, M.; Brinkman, G.; Jorgenson, J. Overgeneration from Solar Energy in California: A Field Guide to the Duck Chart; National Renewable Energy Lab (NREL): Golden, CO, USA, 2015; NREL/TP-6A20-65023.
- Castillo, A.; Gayme, D.F. Grid-scale energy storage applications in renewable energy integration: A survey. Energy Convers. Manag. 2014, 87, 885–894. [Google Scholar] [CrossRef]
- Mongird, K.; Viswanathan, V.; Alam, J.; Vartanian, C.; Sprenkle, V.; Baxter, R. 2020 Grid Energy Storage Technology Cost and Performance Assessment; U.S. Department of Energy: Washington, DC, USA, 2020.
- Mongird, K.; Viswanathan, V.V.; Balducci, P.J.; Alam, M.J.E.; Fotedar, V.; Koritarov, V.S.; Hadjerioua, B. Energy Storage Technology and Cost Characterization Report; No. PNNL-28866, Pacific Northwest National Lab. (PNNL): Richland, WA, USA, 2019. [Google Scholar]
- Jo, B.-K.; Jang, G. An Evaluation of the Effect on the Expansion of Photovoltaic Power Generation According to Renewable Energy Certificates on Energy Storage Systems: A Case Study of the Korean Renewable Energy Market. Sustainability 2019, 11, 4337. [Google Scholar] [CrossRef] [Green Version]
- Nazaripouya, H.; Chu, C.C.; Pota, H.R.; Gadh, R. Battery energy storage system control for intermittency smoothing using an optimized two-stage filter. IEEE Trans. Sustain. Energy 2018, 9, 664–675. [Google Scholar] [CrossRef]
- Nishimwe H, L.F.; Yoon, S.G. Combined Optimal Planning and Operation of a Fast EV-Charging Station Integrated with Solar PV and ESS. Energies 2021, 14, 3152. [Google Scholar] [CrossRef]
- Bridier, L.; Hernández-Torres, D.; David, M.; Lauret, P. A heuristic approach for optimal sizing of ESS coupled with intermittent renewable sources systems. Renew. Energy 2016, 91, 155–165. [Google Scholar] [CrossRef]
- Nimma, K.; Al-Falahi, M.; Nguyen, H.D.; Jayasinghe, S.D.G.; Mahmoud, T.; Negnevitsky, M. Grey Wolf Optimization-Based Optimum Energy-Management and Battery-Sizing Method for Grid-Connected Microgrids. Energies 2018, 11, 847. [Google Scholar] [CrossRef] [Green Version]
- Lee, S.; Choi, D.-H. Reinforcement learning-based energy management of smart home with rooftop solar photovoltaic system, energy storage system, and home appliances. Sensors 2019, 19, 3937. [Google Scholar] [CrossRef] [PubMed] [Green Version]
- Weniger, J.; Tjaden, T.; Quaschning, V. Sizing of residential PV battery systems. Energy Procedia 2014, 46, 78–87. [Google Scholar] [CrossRef] [Green Version]
- Giráldez, J.; Roche, R.; Suryanarayanan, S.; Zimmerle, D. A linear programming methodology to quantify the impact of PHEVs with V2G capabilities on distribution systems. In Proceedings of the 2013 IEEE Green Technologies Conference (GreenTech), Denver, CO, USA, 4–5 April 2013; pp. 8–15. [Google Scholar]
- Luna, A.C.; Diaz, N.L.; Graells, M.; Vasquez, J.C.; Guerrero, J.M. Mixed-integer-linear-programming-based energy man-agement system for hybrid PV-wind-battery microgrids: Modeling, design, and experimental verification. IEEE Trans. Power Electron. 2016, 32, 2769–2783. [Google Scholar] [CrossRef] [Green Version]
- Fu, B.; Ouyang, C.; Li, C.; Wang, J.; Gul, E. An improved mixed integer linear programming approach based on symmetry diminishing for unit commitment of hybrid power system. Energies 2019, 12, 833. [Google Scholar] [CrossRef] [Green Version]
- Delgado, D.; Carvalho, M.; Junior, L.M.C.; Abrahão, R.; Chacartegui, R. Photovoltaic solar energy in the economic optimisation of energy supply and conversion. IET Renew. Power Gener. 2018, 12, 1263–1268. [Google Scholar] [CrossRef]
- Gomes, I.L.R.; Melicio, R.; Mendes, V.M.F. A novel microgrid support management system based on stochastic mixed-integer linear programming. Energy 2021, 223, 120030. [Google Scholar] [CrossRef]
- Mao, T.; Zhou, B.; Zhang, X. Accommodating discharging power with consideration of both EVs and ESs as commodity based on a two-level genetic algorithm. IEEE Access 2019, 7, 134804–134814. [Google Scholar] [CrossRef]
- Gu, F.; Cheung, Y.M. Self-organizing map-based weight design for decomposition-based many-objective evolutionary al-gorithm. IEEE Trans. Evol. Comput. 2017, 22, 211–225. [Google Scholar] [CrossRef]
- Lee, S.-J.; Yoon, Y. Electricity cost optimization in energy storage systems by combining a genetic algorithm with dynamic programming. Mathematics 2020, 8, 1526. [Google Scholar] [CrossRef]
- Sedghi, M.; Ahmadian, A.; Aliakbar-Golkar, M. Optimal storage planning in active distribution network considering uncertainty of wind power distributed generation. IEEE Trans. Power Syst. 2015, 31, 304–316. [Google Scholar] [CrossRef]
- Shreelakshmi, M.P.; Das, M.; Agarwal, V. Design and development of a novel high voltage gain, high-efficiency bidirectional DC–DC converter for storage interface. IEEE Trans. Ind. Electron. 2018, 66, 4490–4501. [Google Scholar]
- Xu, B.; Oudalov, A.; Ulbig, A.; Andersson, G.; Kirschen, D.S. Modeling of lithium-ion battery degradation for cell life as-sessment. IEEE Trans. Smart Grid. 2016, 9, 1131–1140. [Google Scholar] [CrossRef]
- Carvalho, E.L.; Felipe, C.A.; Bellinaso, L.V.; Stein, C.M.D.O.; Cardoso, R.; Michels, L. Asymmetrical-PWM DAB Converter with extended ZVS/ZCS Range and Reduced Circulating Current for ESS Applications. IEEE Trans. Power Electron. 2021, 36, 12990–13001. [Google Scholar] [CrossRef]
- KEPCO. Electrics Tables. Available online: https://home.kepco.co.kr/kepco/EN/F/htmlView/ENFBHP00101.do?menuCd=EN060201 (accessed on 1 December 2016).
- KEPCO. ESS Discount System. Available online: https://cyber.kepco.co.kr/ckepco/front/jsp/CY/D/C/CYDCHP00212.jsp (accessed on 25 June 2021).
- Korea Energy Agency. Renewable Portfolio Standards. Available online: https://dco.energy.or.kr/renew_eng/new/standards.aspx (accessed on 1 January 2012).
- Kim, K.H.; Hyun, D.S. A high performance DSP voltage controller with PWM synchronization for parallel operation of UPS systems. In Proceedings of the 2006 37th IEEE Power Electronics Specialists Conference, Jeju, Korea, 18–22 June 2006; pp. 1–7. [Google Scholar]
- Mohd, A.; Ortjohann, E.; Morton, D.; Omari, O. Review of control techniques for inverters parallel operation. Electr. Power. Syst. Res. 2010, 80, 1477–1487. [Google Scholar] [CrossRef]
- Alam, M.M.; Ahmed, M.F.; Jahan, I.; Jang, Y.M. Optimal Energy Management Strategy for ESS with Day Ahead Energy Prediction. In Proceedings of the 2021 International Conference on Artificial Intelligence in Information and Communication (ICAIIC), Jeju Island, Korea, 13–16 April 2021; pp. 492–496. [Google Scholar]
- Danish, S.M.S.; Ahmadi, M.; Danish, M.S.S.; Mandal, P.; Yona, A.; Senjyu, T. A coherent strategy for peak load shaving using energy storage systems. J. Energy Storage 2020, 32, 101823. [Google Scholar] [CrossRef]
- Capella, G.J.; Pou, J.; Ceballos, S.; Konstantinou, G.; Zaragoza, J.; Agelidis, V.G. Enhanced phase-shifted PWM carrier disposition for interleaved voltage-source inverters. IEEE Trans. Power Electron. 2014, 30, 1121–1125. [Google Scholar] [CrossRef] [Green Version]


| Technology Types | Description | REC Multipliers | ||
|---|---|---|---|---|
| 2012 | 2015 | 2020 | ||
| General land excluding forest land | Less than 100 kW | 0.7–1.2 | 1.2 | 1.2 |
| From 100 kW | 1.0 | 1.0 | ||
| Above 3000 kW | 0.7 | 0.7 | ||
| Solar in forest land | - | 0.7 | 0.7–1.2 | 0.7 |
| Building-integrated solar | 3000 kW or less | 1.5 | 1.5 | 1.5 |
| Above 3000 kW | 1.0 | 1.0 | ||
| Floating solar | - | 1.5 | 1.5 | |
| Solar for self-use | - | 1.0 | 1.0 | |
| ESS facility (solar-connected) | 2016–2020.6 | - | 5.0 | 5.0 |
| 2020.7–2020.12 | - | 4.0 | ||
| Classification | Demand Charge (KRW(₩)/kW) | Energy Charge (KRW(₩)/kWh) | ||||
|---|---|---|---|---|---|---|
| Time Period | Summer | Spring/Fall | Winter | |||
| High-Voltage (A) | Option I | 7220 | low-peak | 61.6 | 61.6 | 68.6 |
| mid-peak | 114.5 | 84.1 | 114.7 | |||
| high-peak | 196.6 | 114.8 | 172.2 | |||
| Option II | 8320 | low-peak | 56.1 | 56.1 | 63.1 | |
| mid-peak | 109.0 | 78.6 | 109.2 | |||
| high-peak | 191.1 | 109.3 | 166.7 | |||
| Option III | 9810 | low-peak | 55.2 | 55.2 | 62.5 | |
| mid-peak | 108.4 | 77.3 | 108.6 | |||
| high-peak | 178.7 | 101.0 | 155.5 | |||
| High-Voltage (B) | Option I | 6630 | low-peak | 60.0 | 60.0 | 67.0 |
| mid-peak | 112.3 | 82.3 | 112.3 | |||
| high-peak | 193.5 | 112.6 | 168.5 | |||
| Option II | 7380 | low-peak | 56.2 | 56.2 | 63.2 | |
| mid-peak | 108.5 | 78.5 | 108.5 | |||
| high-peak | 189.7 | 108.8 | 164.7 | |||
| Option III | 8190 | low-peak | 54.5 | 54.5 | 61.6 | |
| mid-peak | 106.8 | 76.9 | 106.8 | |||
| high-peak | 188.1 | 107.2 | 163.0 | |||
| High-Voltage (C) | Option I | 6590 | low-peak | 59.5 | 59.5 | 66.4 |
| mid-peak | 112.4 | 82.4 | 112.0 | |||
| high-peak | 193.3 | 112.8 | 168.6 | |||
| Option II | 7520 | low-peak | 54.8 | 54.8 | 61.7 | |
| mid-peak | 107.7 | 77.7 | 107.3 | |||
| high-peak | 188.6 | 108.1 | 163.9 | |||
| Option III | 8090 | low-peak | 53.7 | 53.7 | 60.6 | |
| mid-peak | 106.6 | 76.6 | 106.2 | |||
| high-peak | 187.5 | 107.0 | 162.8 | |||
| Classification | Summer/Spring/Fall (Jun.–Aug.)/(Mar.–May.)/(Sep.–Oct.) | Winter (Nov.–Feb.) |
|---|---|---|
| low-peak | 23:00–09:00 | 23:00–09:00 |
| mid-peak | 09:00–10:00 12:00–13:00 17:00–23:00 | 09:00–10:00 12:00–17:00 20:00–22:00 |
| high-peak | 10:00–12:00 13:00–17:00 | 10:00–12:00 17:00–20:00 22:00–23:00 |
| Classification | Detail |
|---|---|
| Additional savings on base rate | {(Discharge during peak load time weekday) ÷ (number of weekdays × 3 h)} × 3 times × differential application of discount amount |
| Light load charge discount | 50% discount on ESS charging fee × differential application of discount amount |
| ※ Differential application of discount amount - Ratio of ESS battery capacity to contract power of electricity consumers • 10% or more: 1.2 times the discount amount • 5% or more to less than 10%: 1.0 times the discount amount • Less than 5%: 0.8 times the discount amount | |
| Classification | Detail |
|---|---|
| Additional savings on base rate | {(Discharge during peak load time weekday) ÷ (number of weekdays × 3 h)} |
| Light load charge discount | - |
| Parameter | Value (Unit) | Parameter | Value (Unit) |
|---|---|---|---|
| Input Voltage (AC_Grid) | 220 (V) | Output Capacitor | 250 (uF) |
| DC_Link Voltage | 400 (V) | Switching Frequency | 50 (kHz) |
| Output Current (max) | 31.1 (A) | Two-Level ac/dc Converter Power Device | C3M0045065D (45 mΩ) |
| Load (% of 12.5 kW) (%) | Efficiency (%) | |
|---|---|---|
| Inverter Mode | Converter Mode | |
| 5 | 93 | 80 |
| 10 | 96 | 92 |
| 20 | 97.1 | 96 |
| 30 | 97.6 | 97.3 |
| 40 | 97.4 | 97.35 |
| 50 | 97.5 | 96.9 |
| 60 | 97.45 | 96.85 |
| 70 | 97.35 | 96.5 |
| 80 | 97.3 | 96.3 |
| 90 | 97.25 | 96.3 |
| 100 | 97.15 | 95.5 |
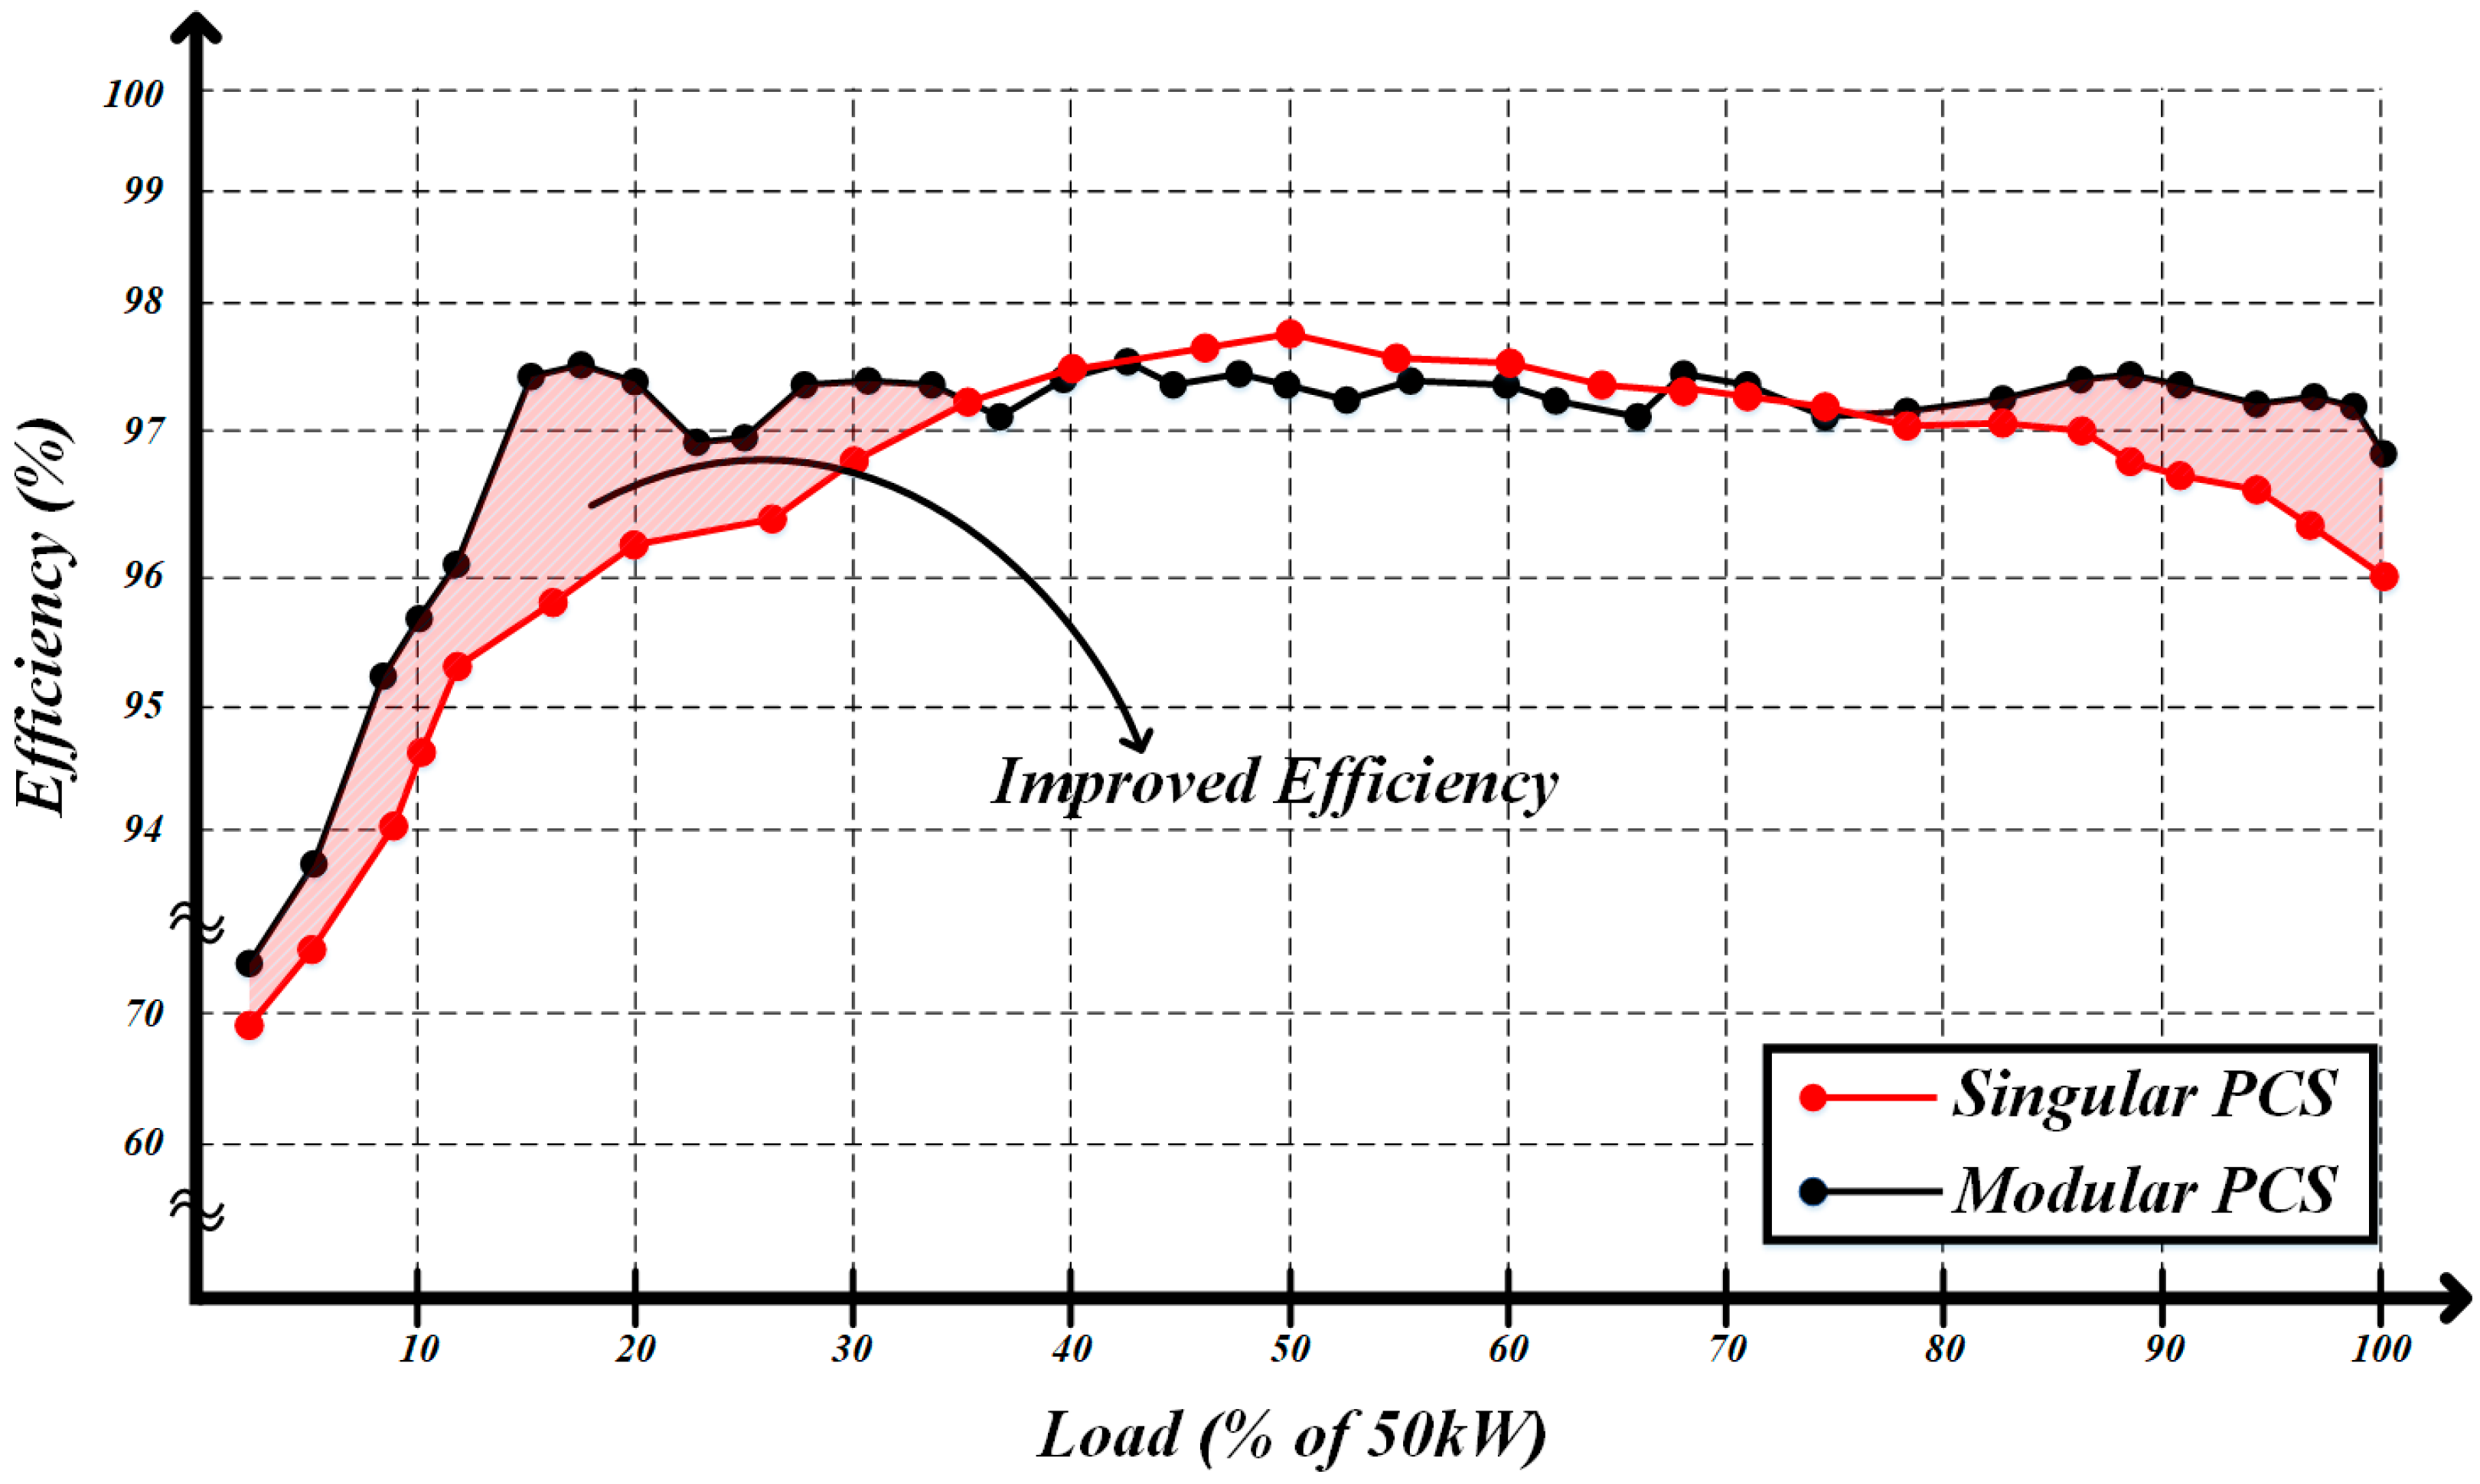
| Load (% of 50 kW) (%) | Efficiency (%) | ||
|---|---|---|---|
| Single PCS | Multi-Interleaved PCS | Proposed PCS Operation Algorithm | |
| 5 | 81.50 | 91.30 | 93.50 |
| 10 | 93.63 | 93.40 | 95.70 |
| 20 | 96.15 | 95.98 | 97.45 |
| 30 | 97.87 | 97.20 | 97.40 |
| 40 | 97.45 | 97.44 | 97.42 |
| 50 | 97.70 | 97.40 | 97.38 |
| 60 | 97.40 | 97.39 | 97.4 |
| 70 | 97.31 | 97.30 | 97.41 |
| 80 | 97.10 | 97.10 | 97.25 |
| 90 | 96.85 | 97.00 | 97.35 |
| 100 | 96.00 | 96.8 | 96.8 |
Publisher’s Note: MDPI stays neutral with regard to jurisdictional claims in published maps and institutional affiliations. |
© 2021 by the authors. Licensee MDPI, Basel, Switzerland. This article is an open access article distributed under the terms and conditions of the Creative Commons Attribution (CC BY) license (https://creativecommons.org/licenses/by/4.0/).
Share and Cite
Kim, J.-M.; Lee, J.; Kim, J.-W.; Yi, J.; Won, C.-Y. Power Conversion System Operation to Reduce the Electricity Purchasing Cost of Energy Storage Systems. Energies 2021, 14, 4728. https://doi.org/10.3390/en14164728
Kim J-M, Lee J, Kim J-W, Yi J, Won C-Y. Power Conversion System Operation to Reduce the Electricity Purchasing Cost of Energy Storage Systems. Energies. 2021; 14(16):4728. https://doi.org/10.3390/en14164728
Chicago/Turabian StyleKim, Jun-Mo, Jeong Lee, Jin-Wook Kim, Junsin Yi, and Chung-Yuen Won. 2021. "Power Conversion System Operation to Reduce the Electricity Purchasing Cost of Energy Storage Systems" Energies 14, no. 16: 4728. https://doi.org/10.3390/en14164728