
Development and Validation of Air-to-Water Heat Pump Model for Greenhouse Heating


Abstract
:1. Introduction
2. Materials and Methods
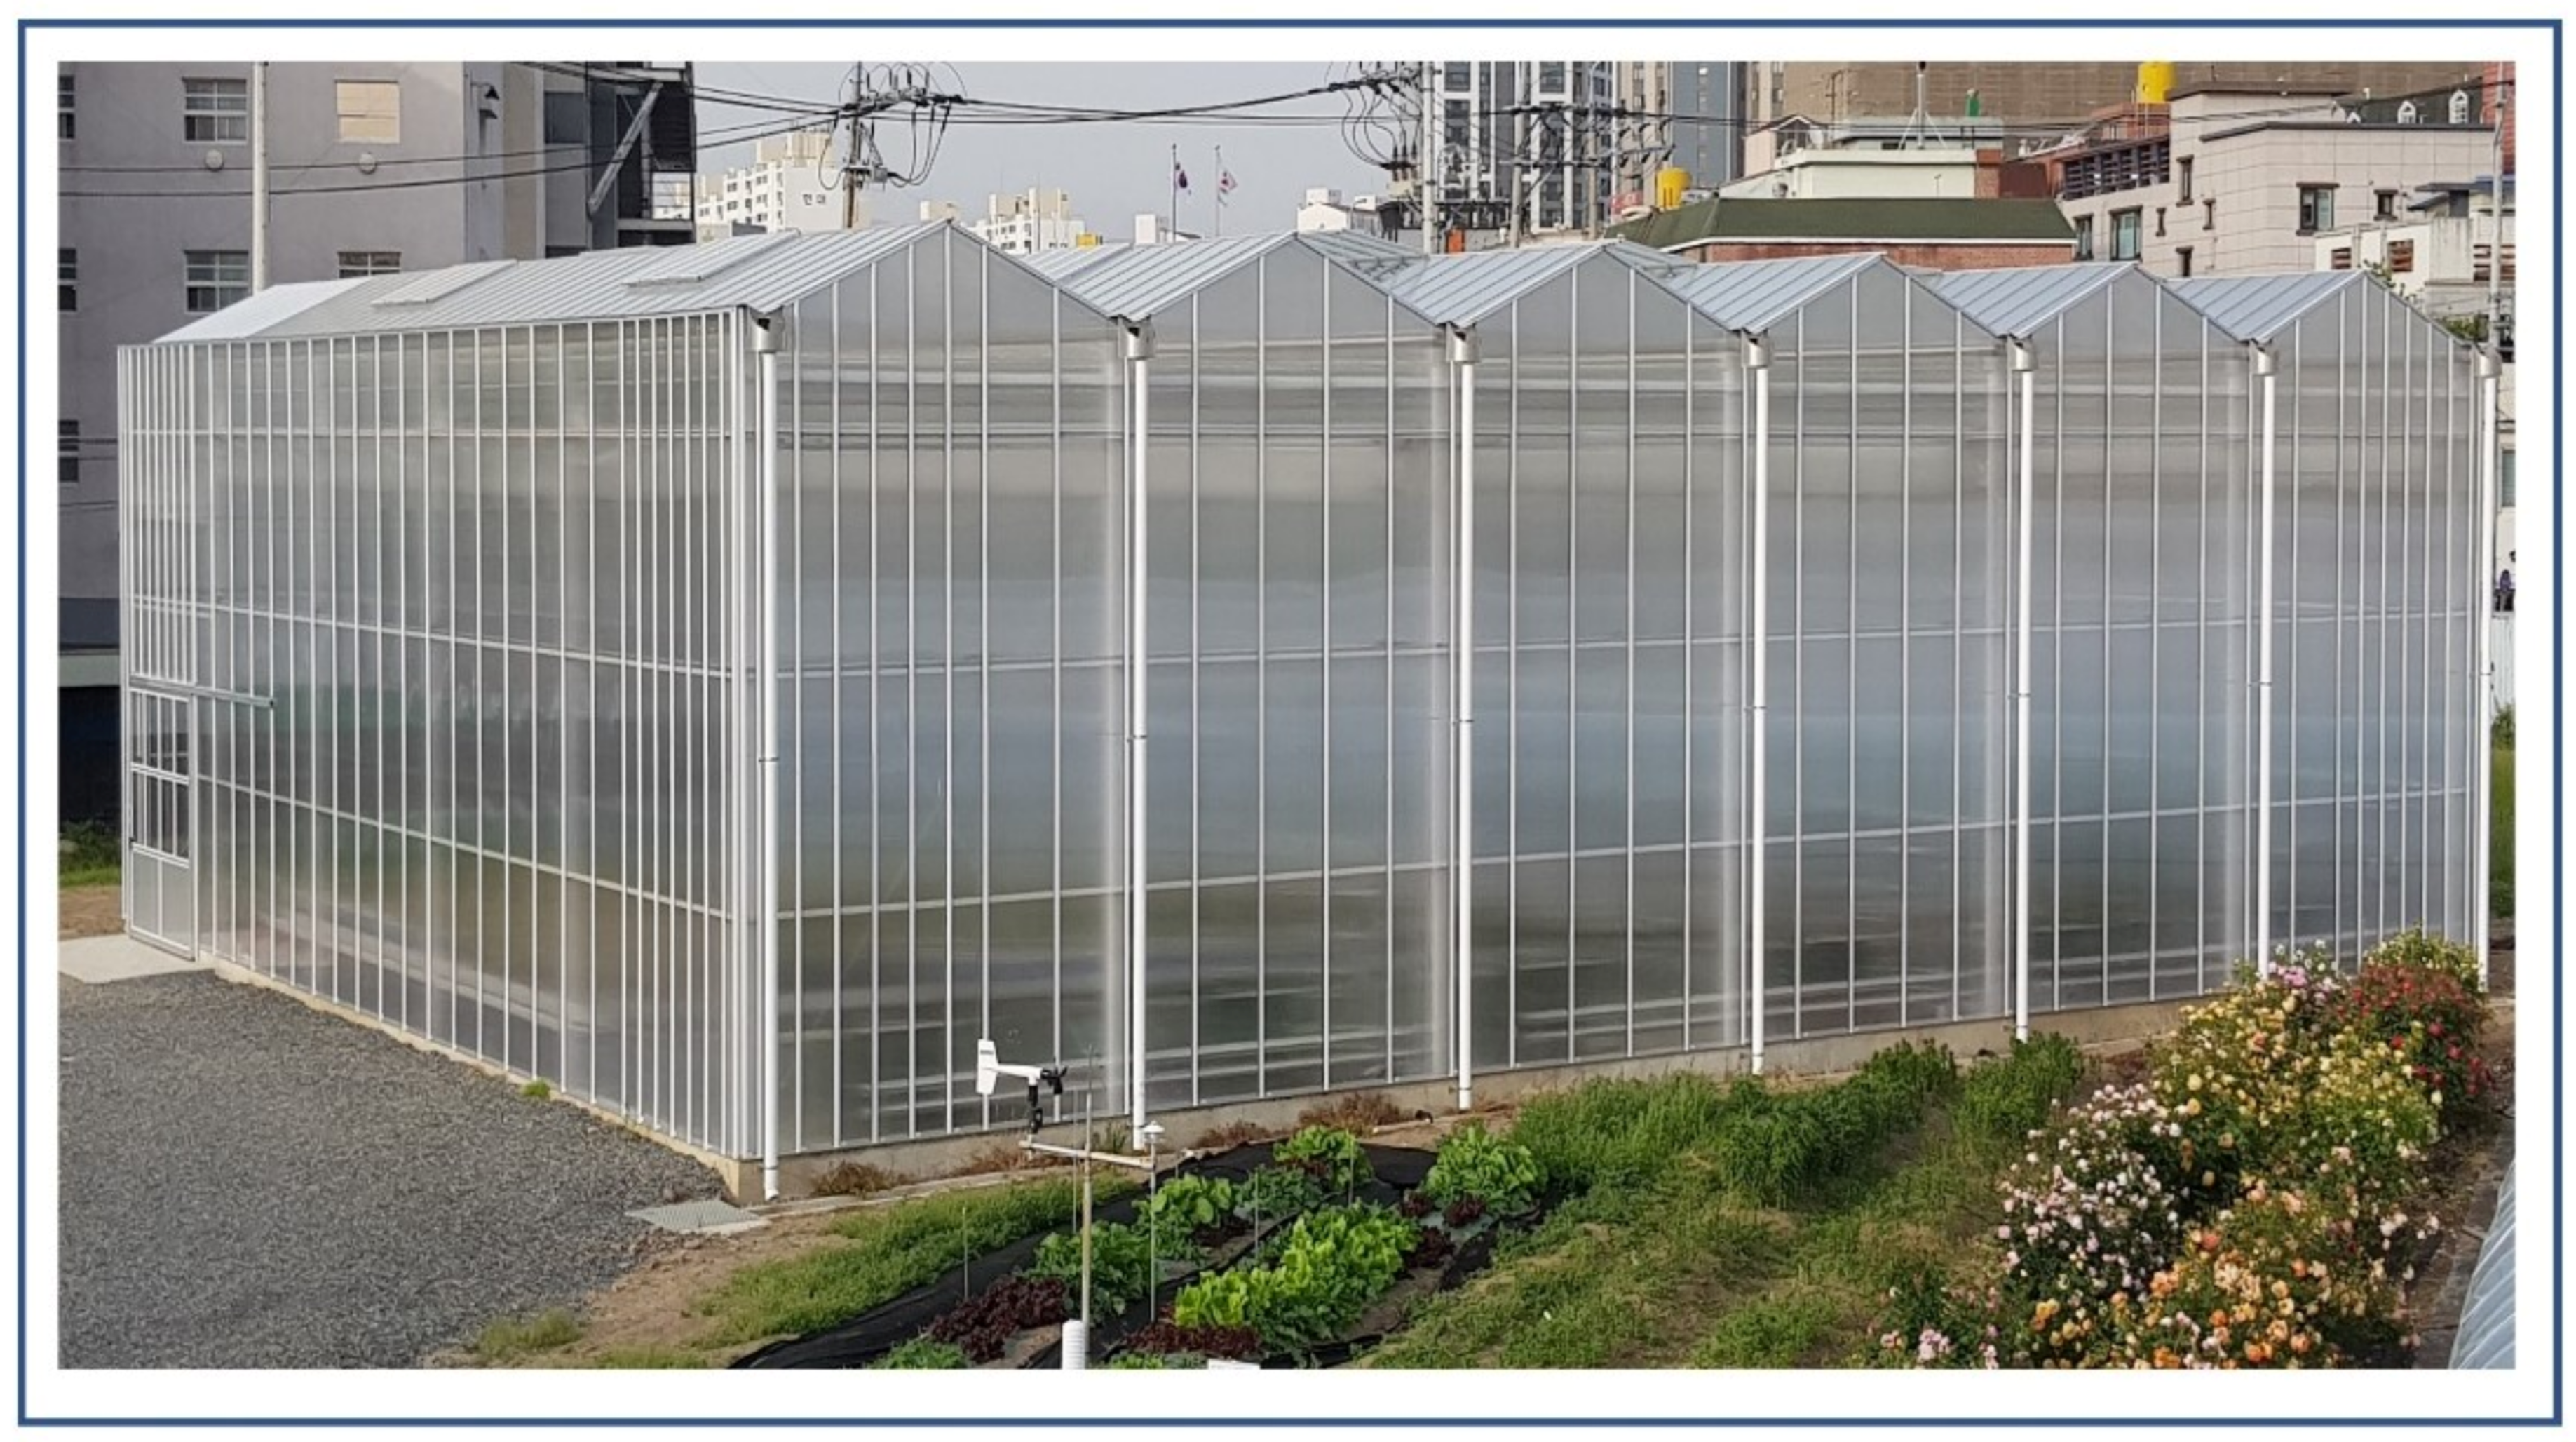
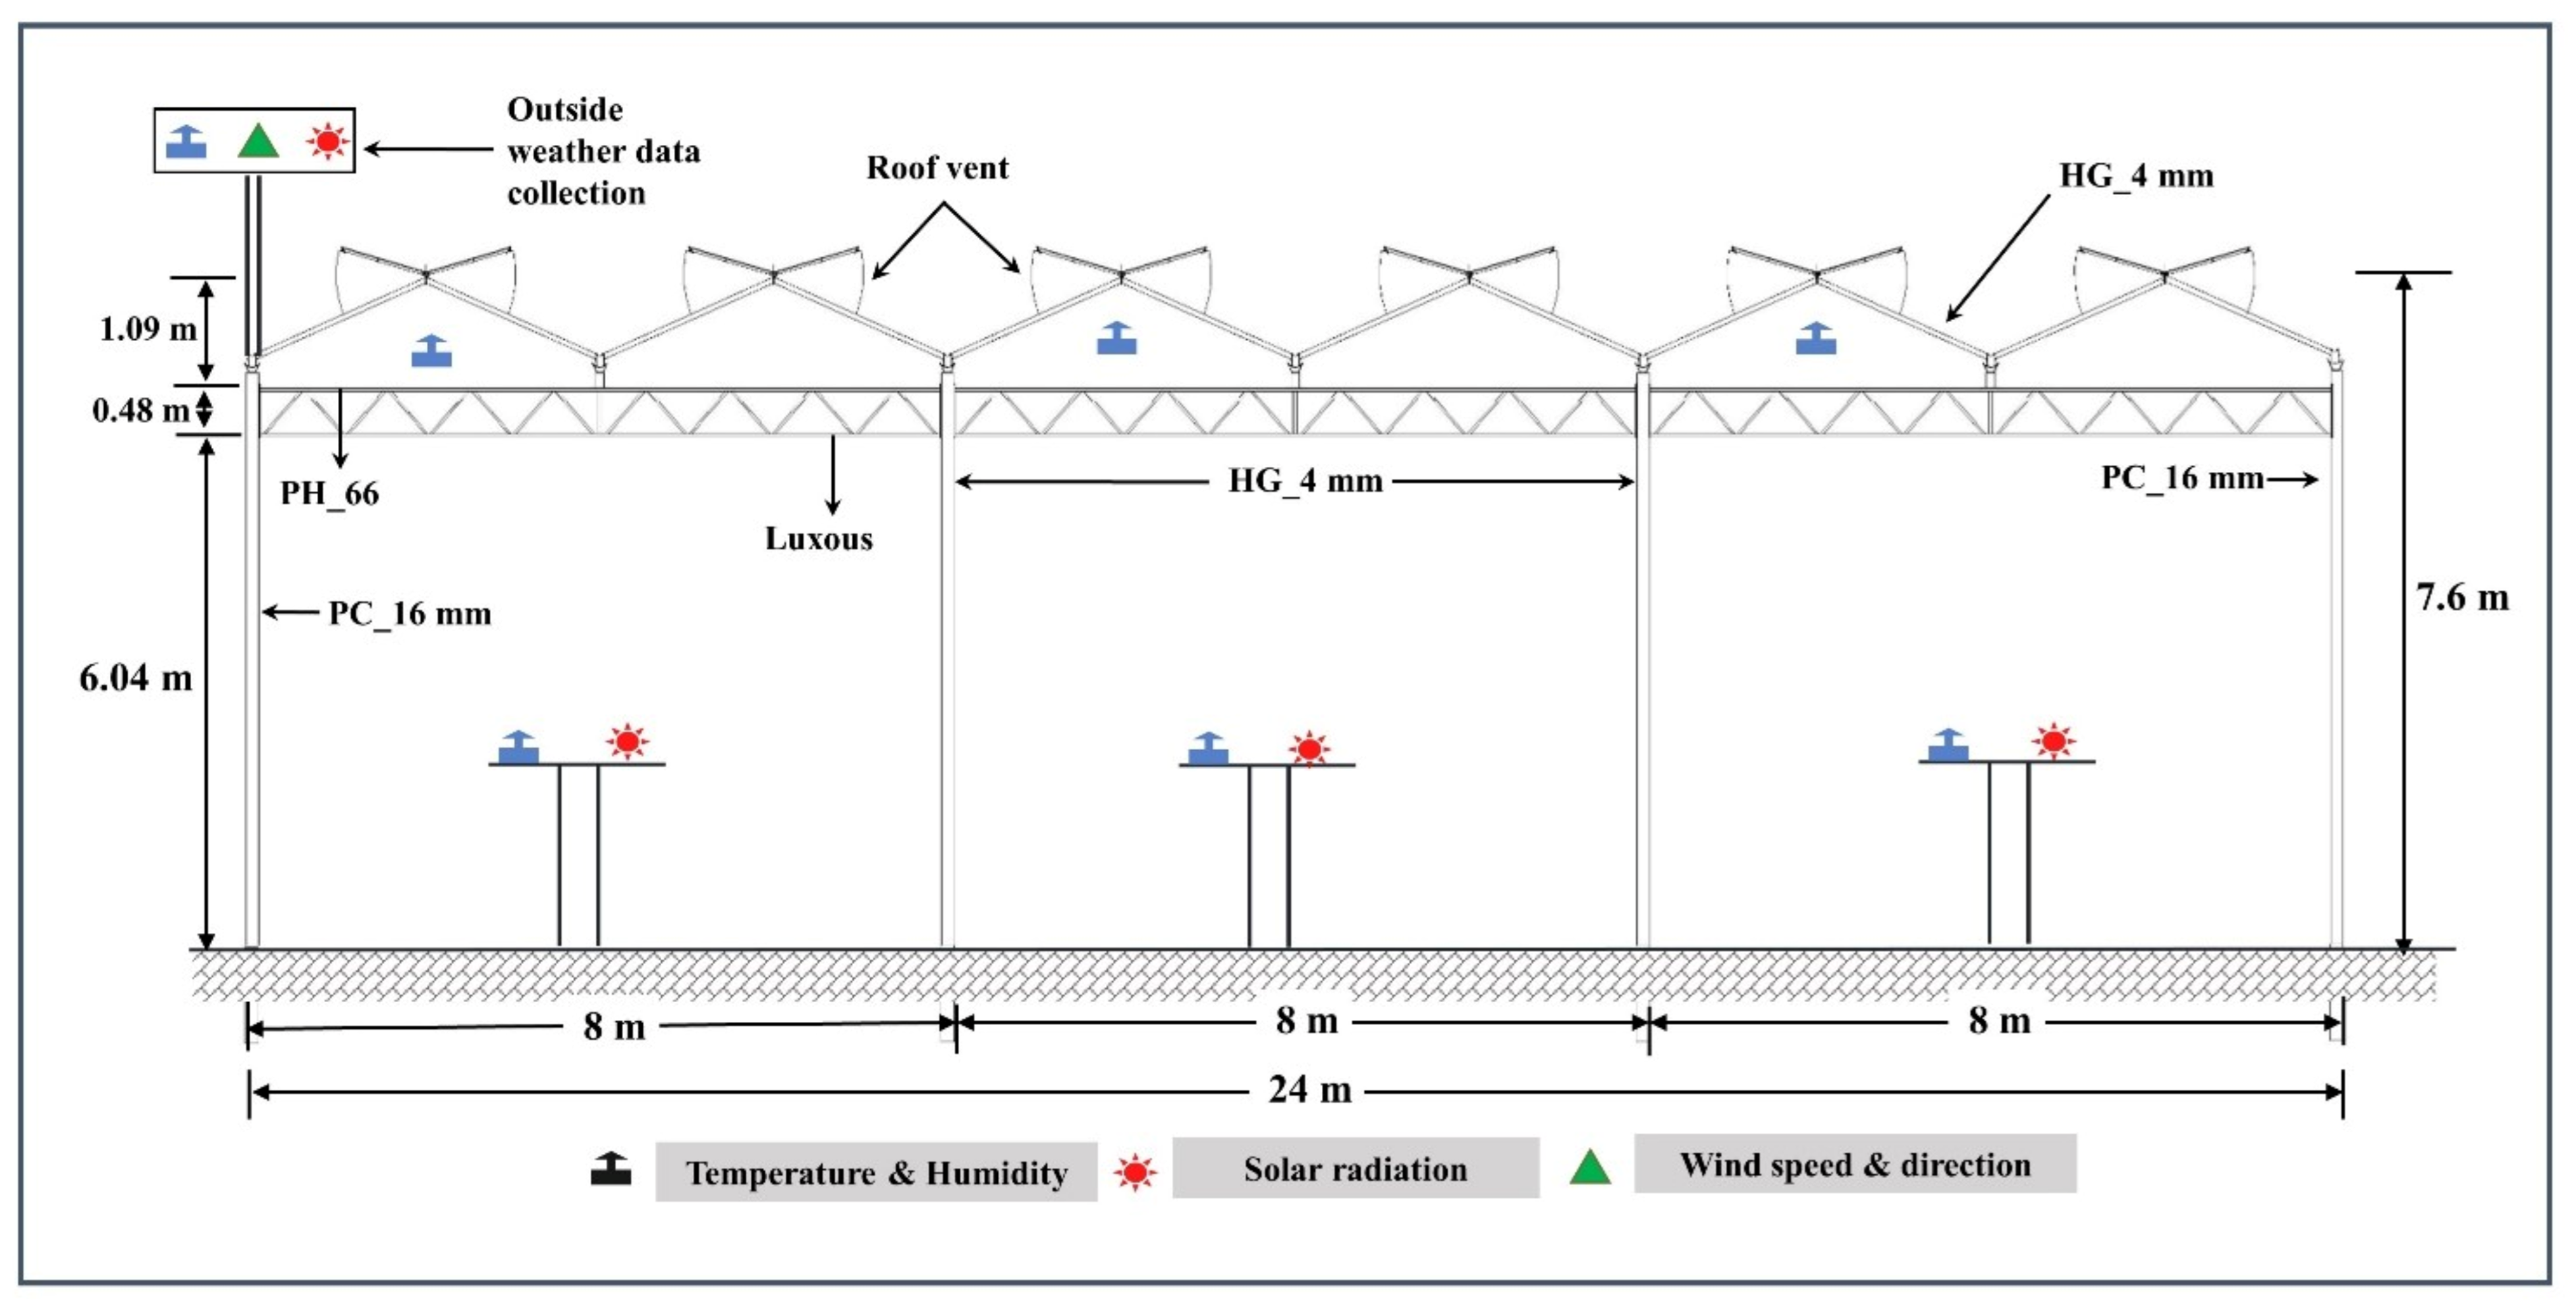
2.1. Experimental Greenhouse
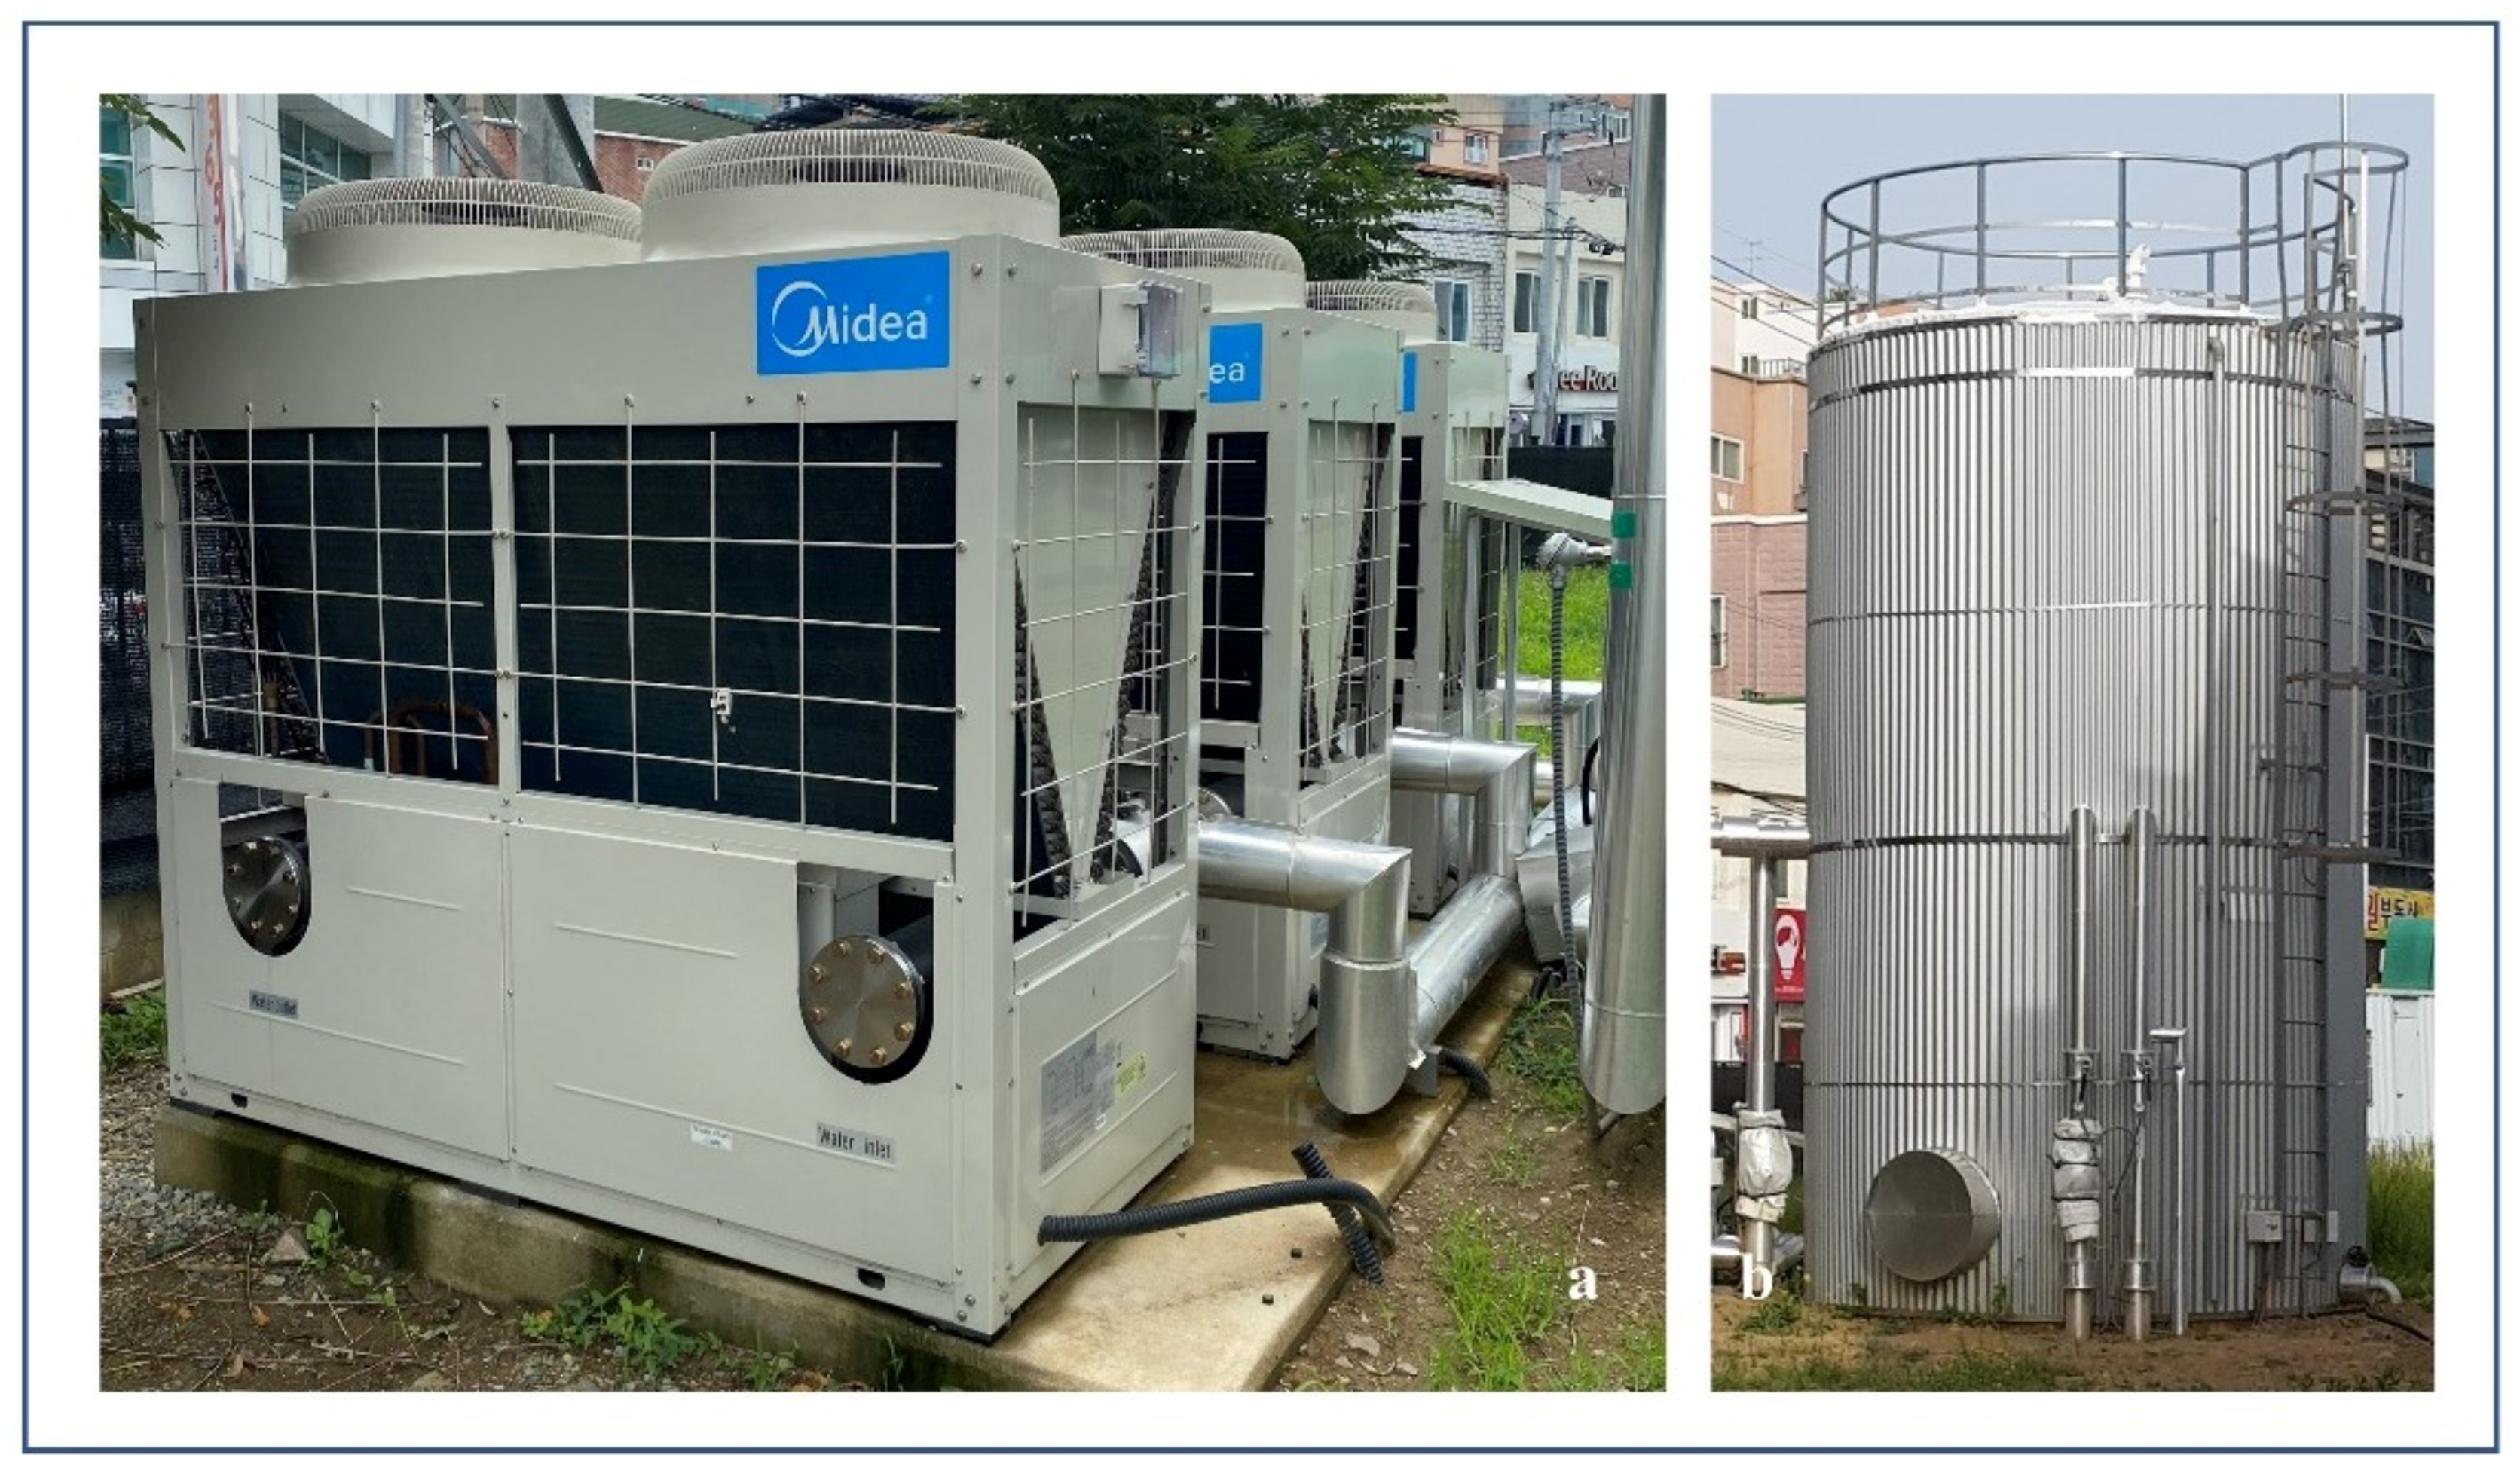
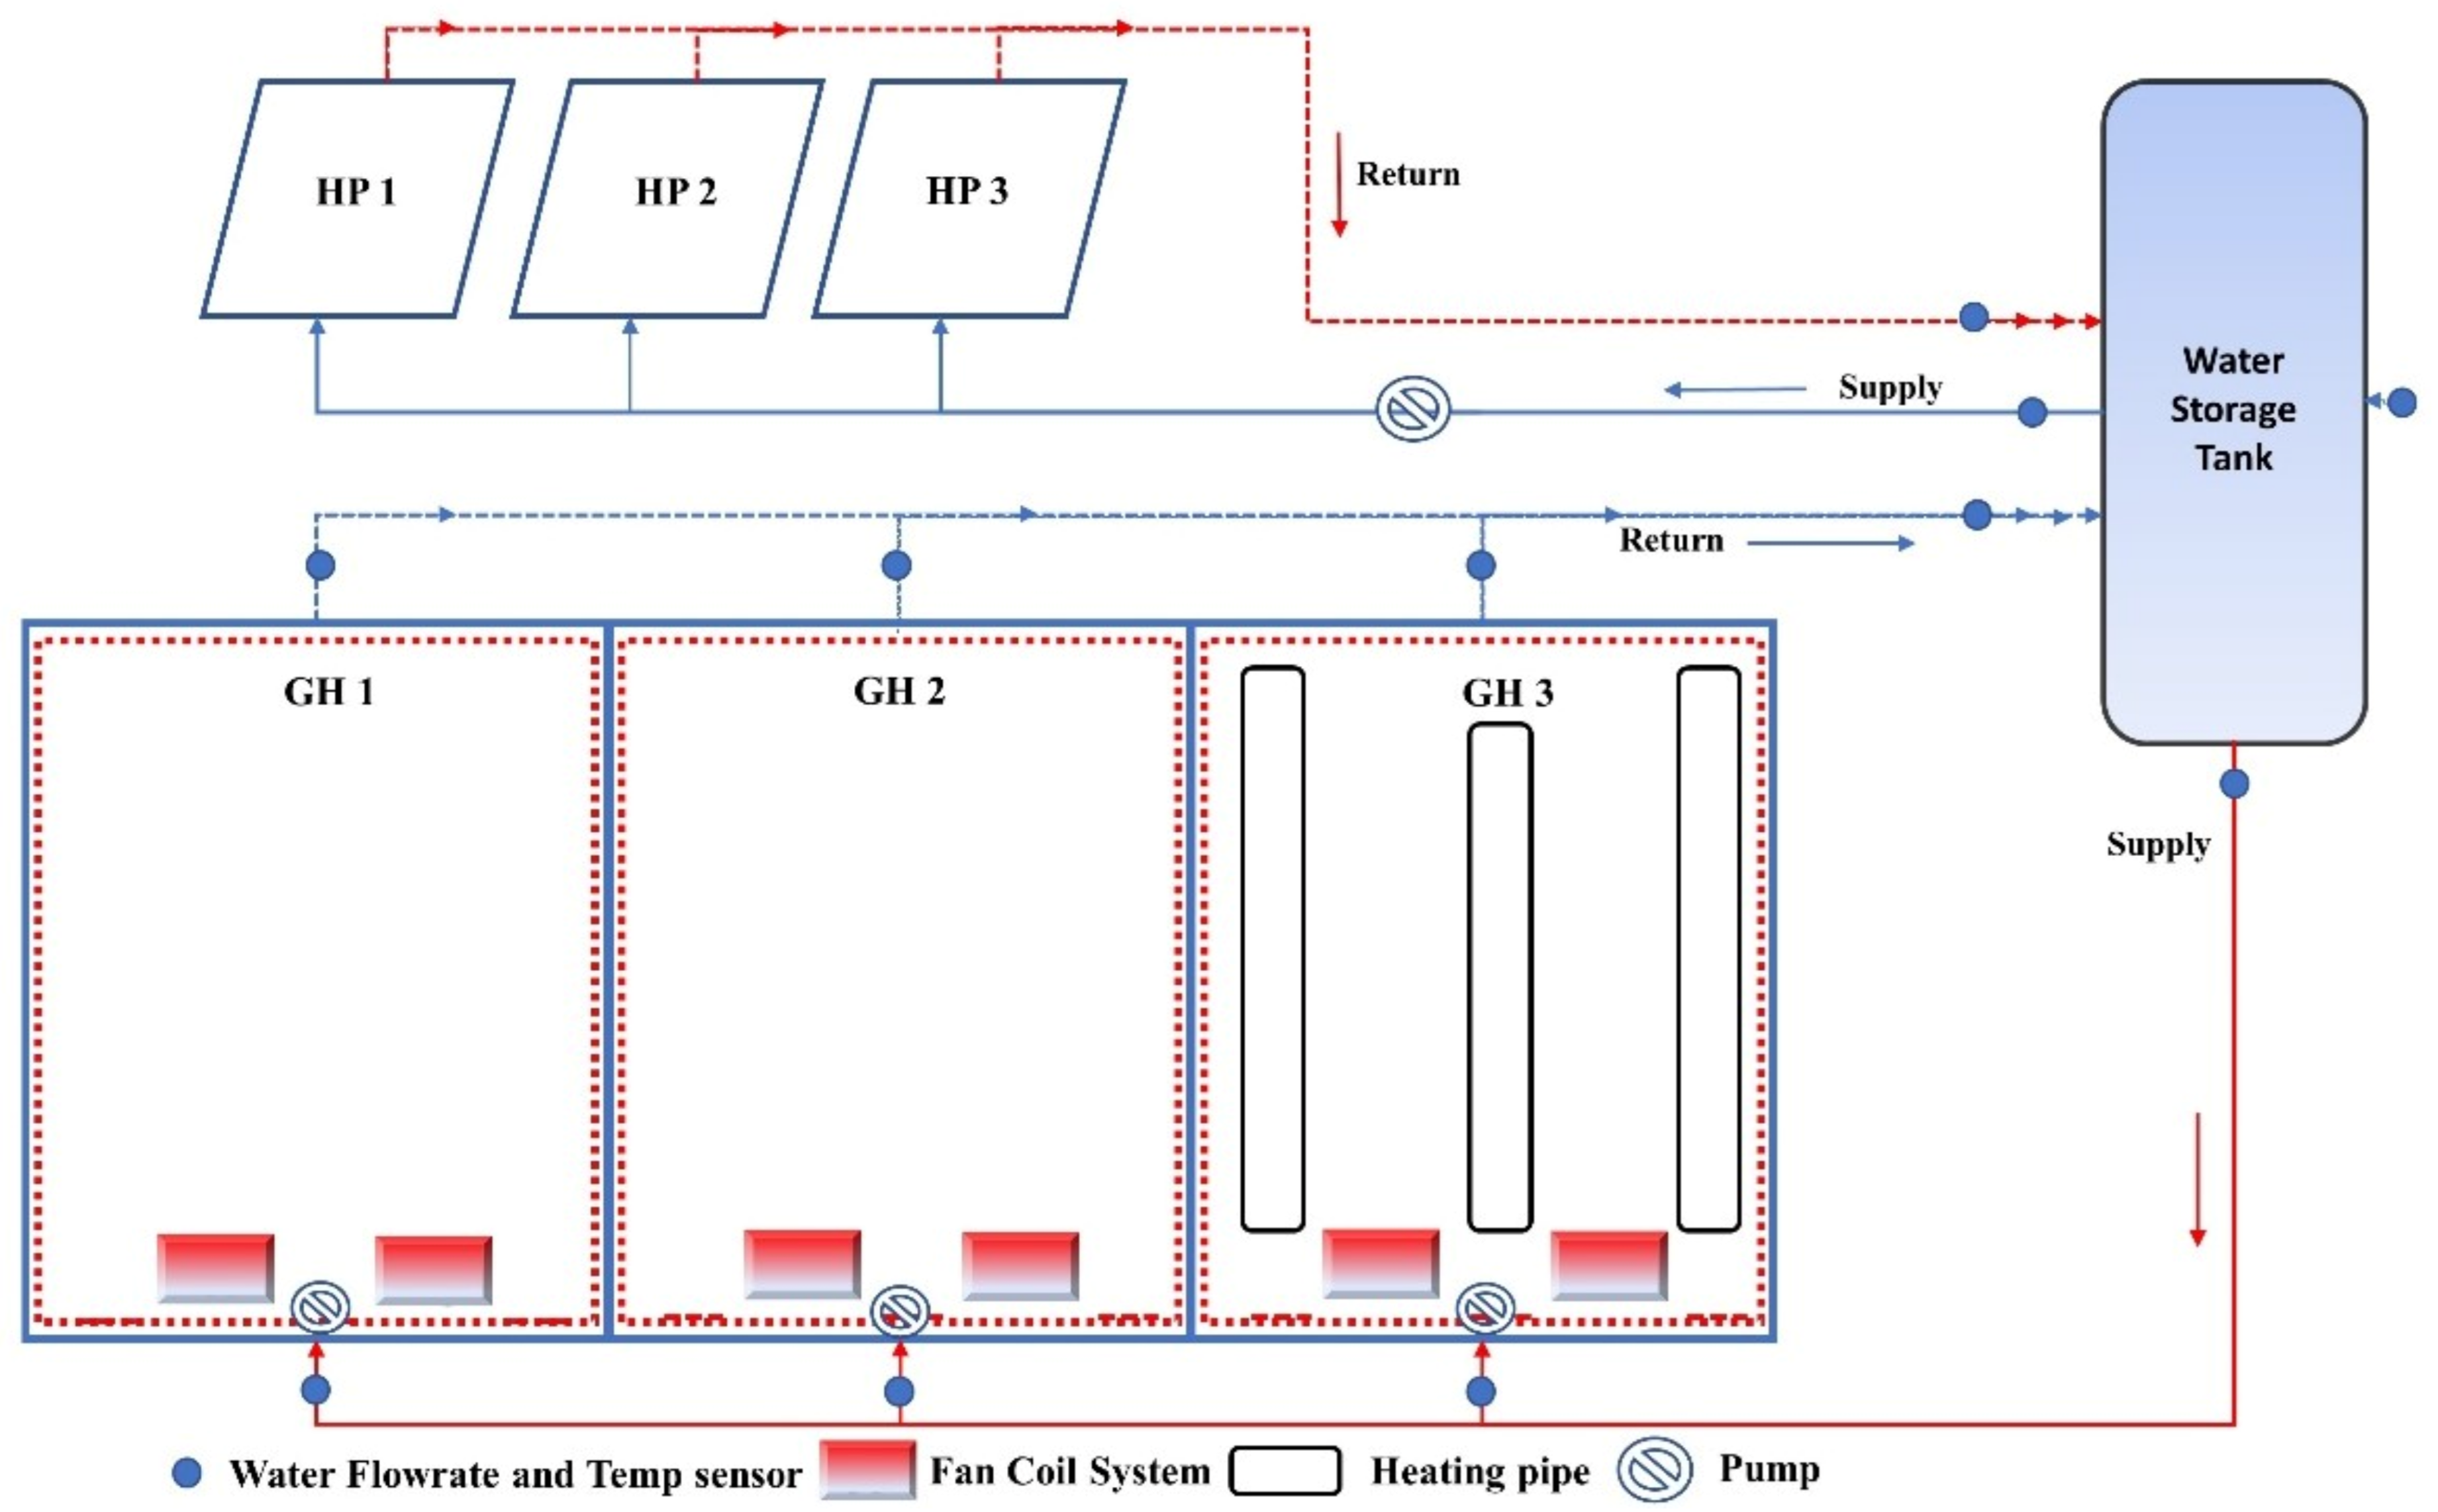
2.2. AWHP
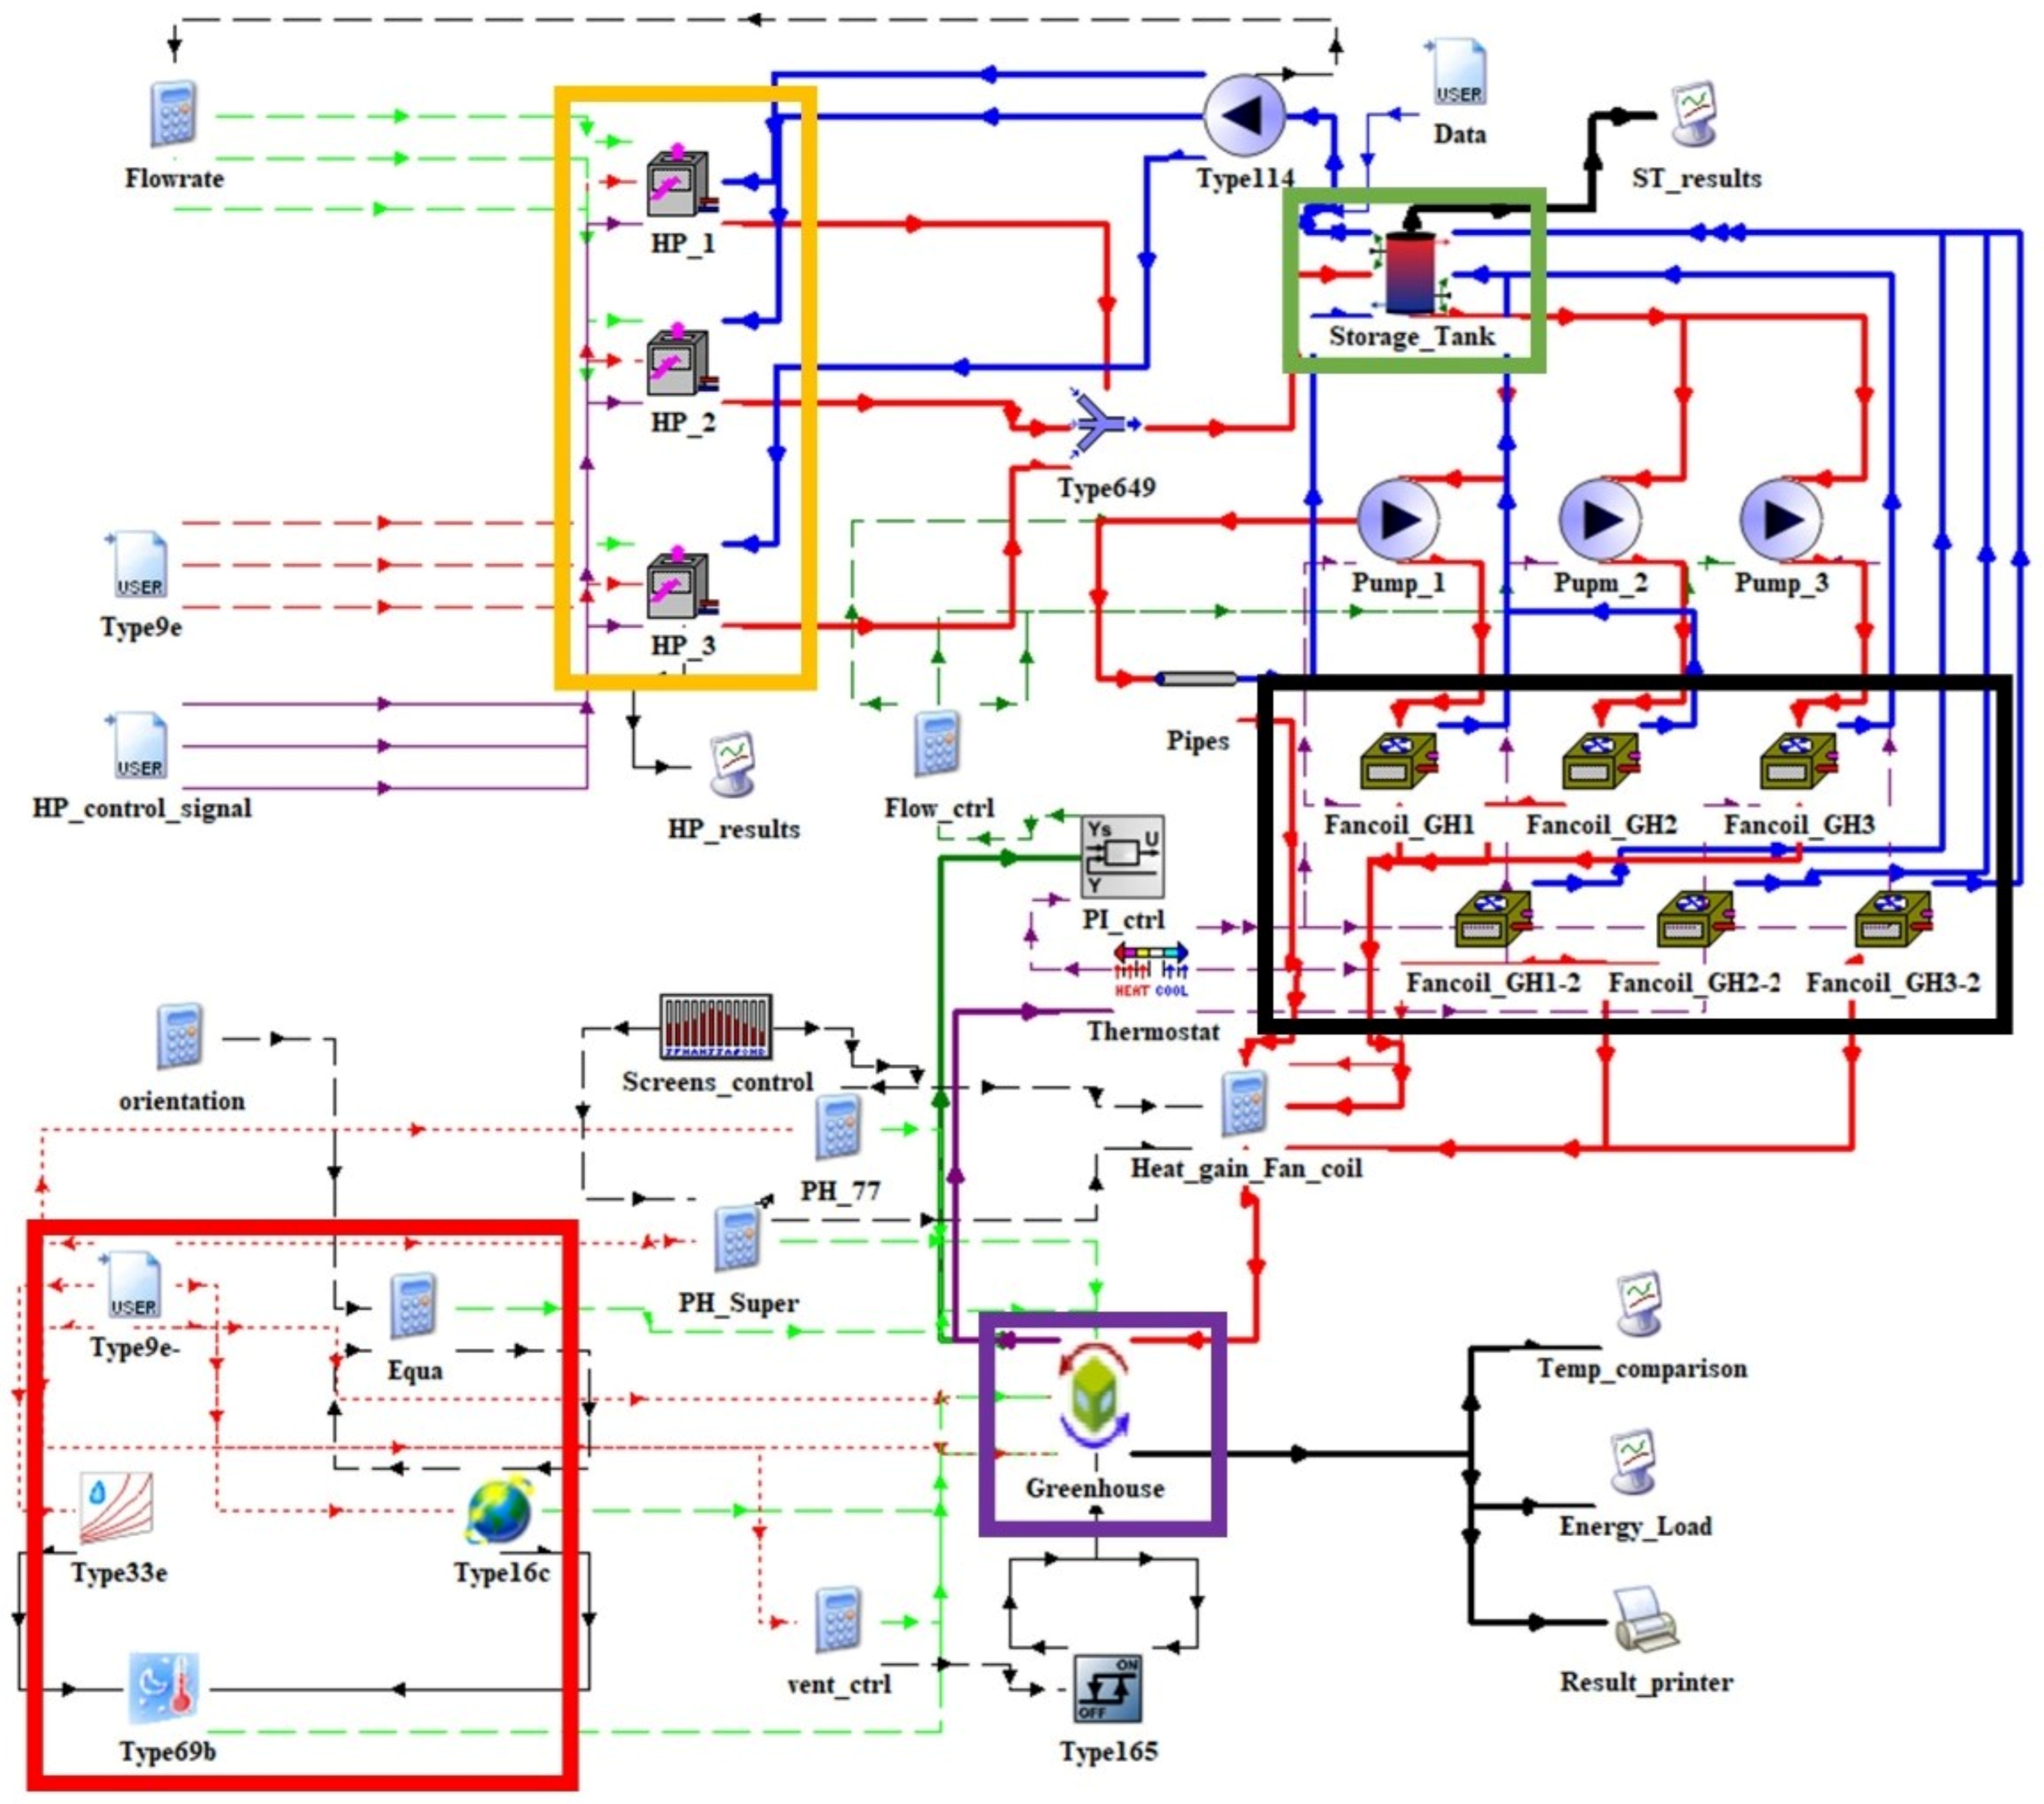
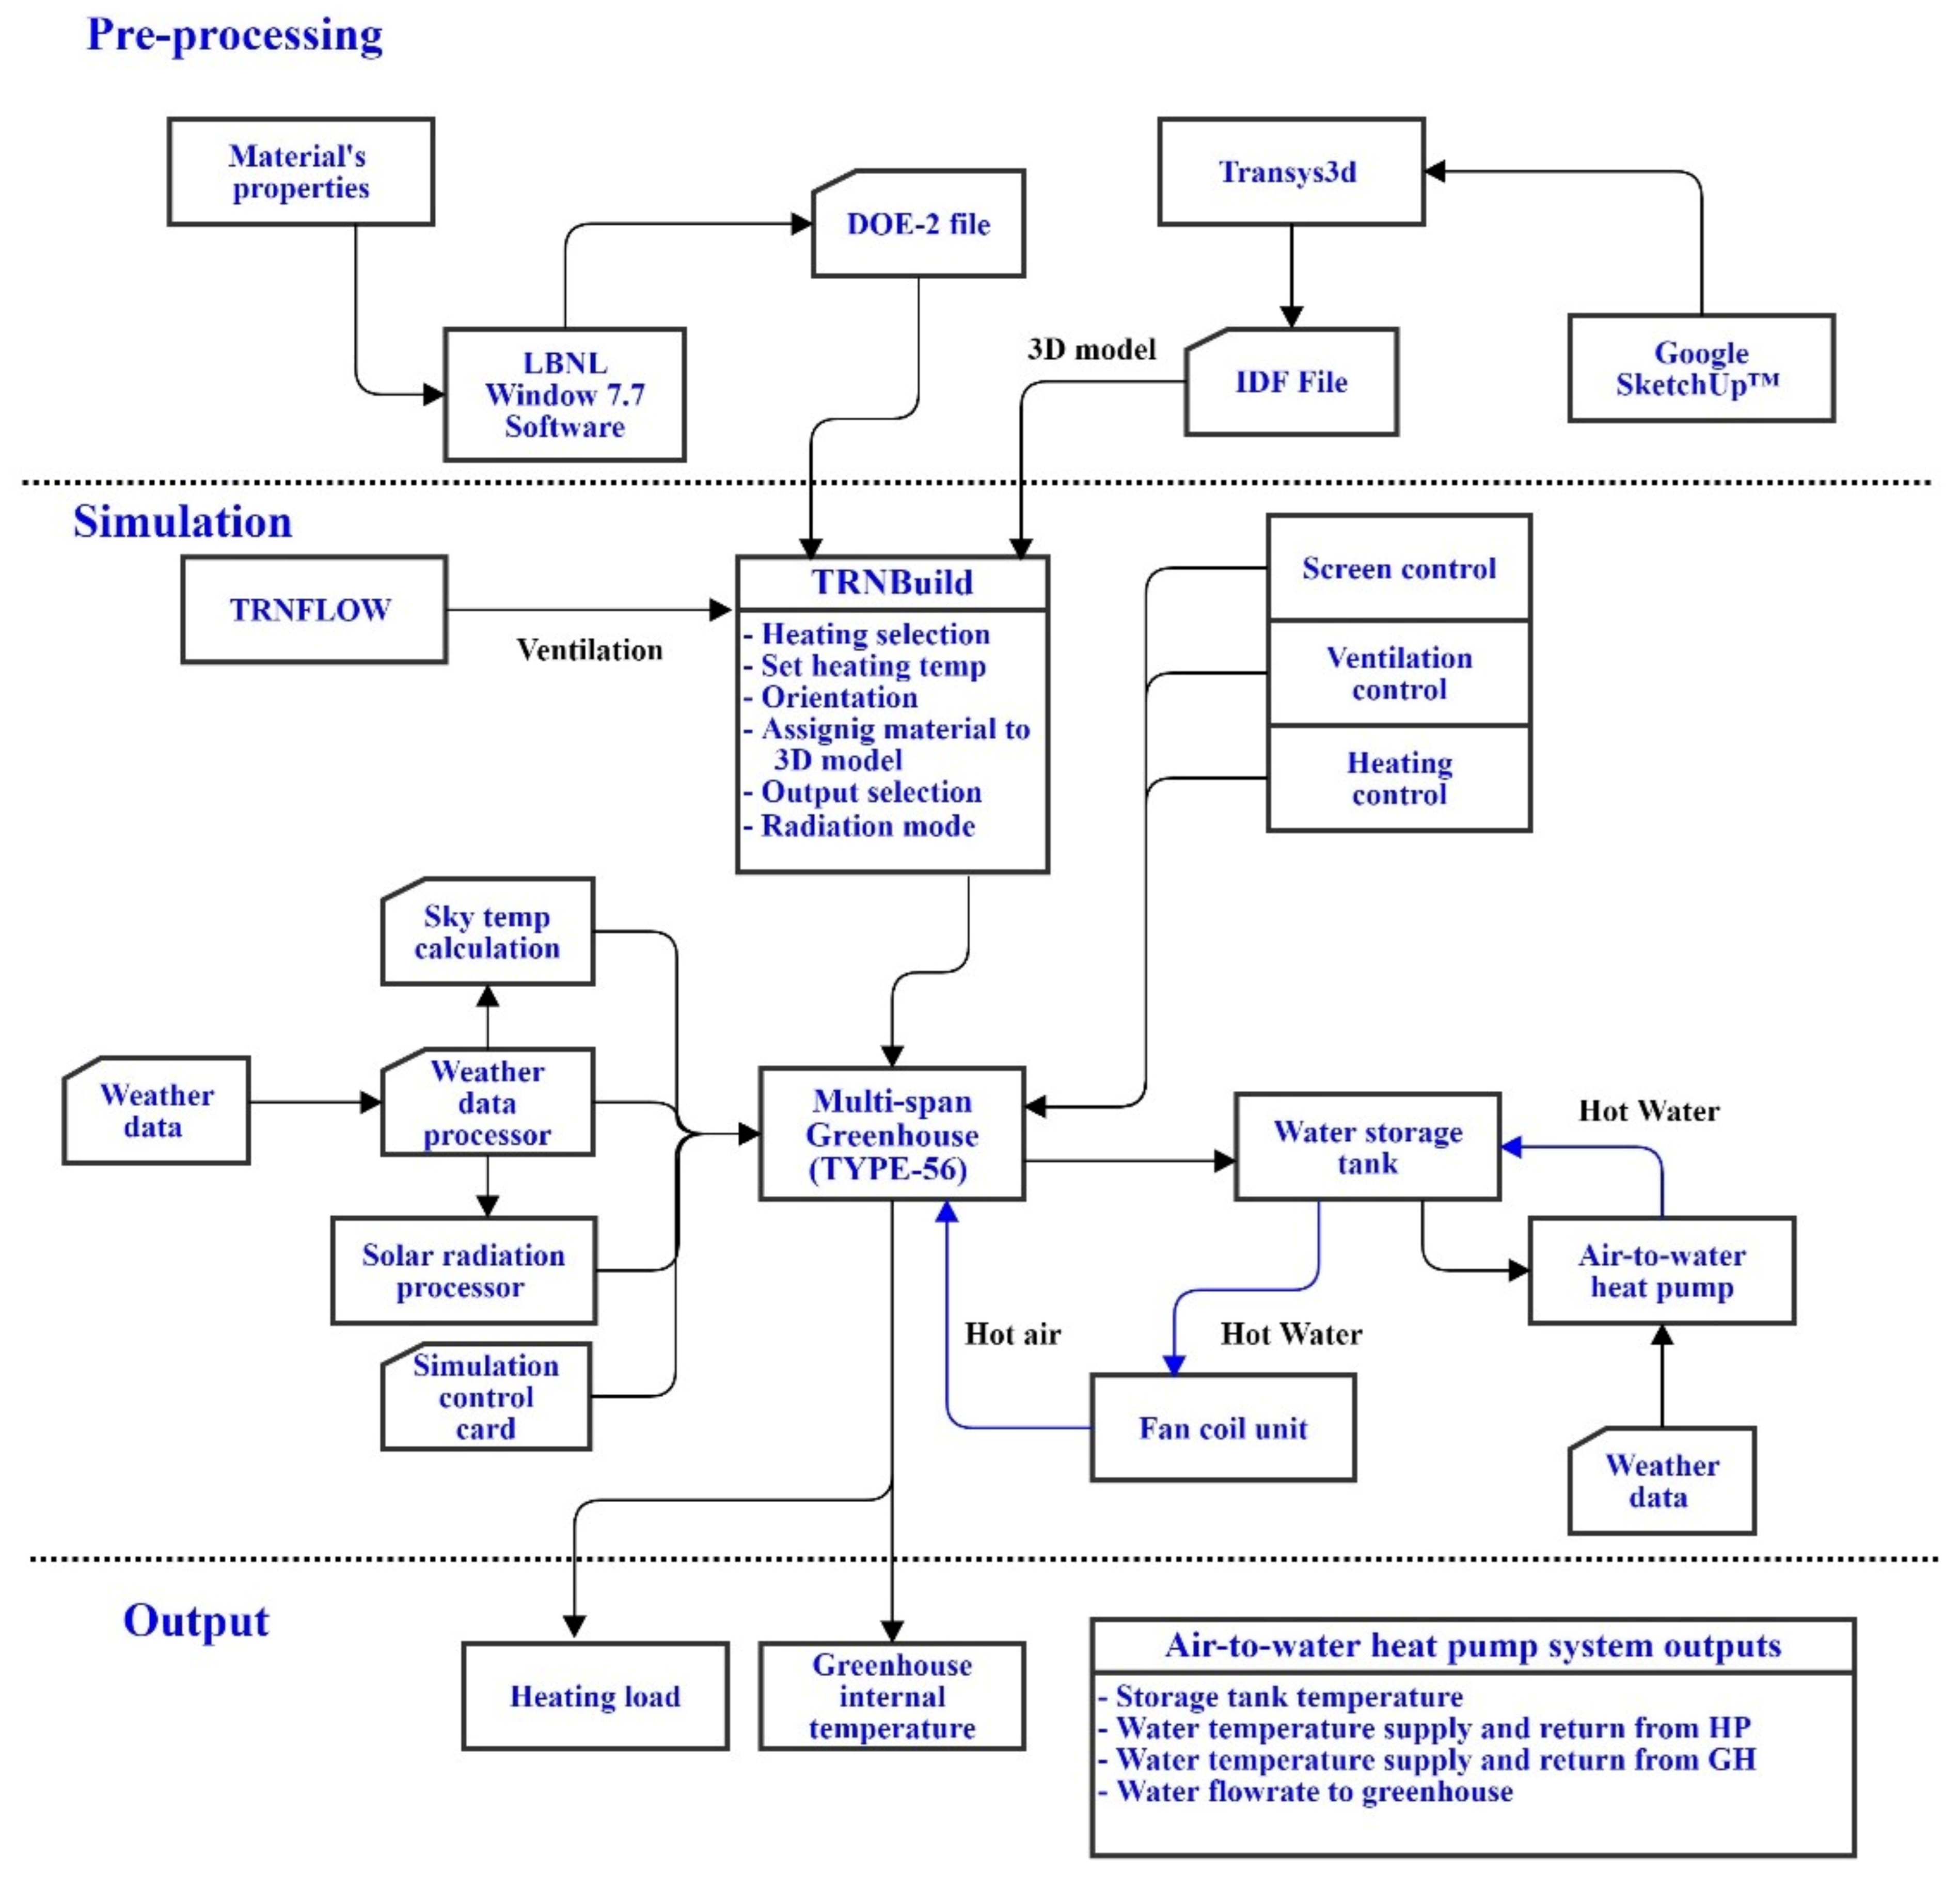
2.3. BES Modeling and Simulation
2.4. Statistical Analysis of BES Model
3. Results and Discussion
4. Conclusions
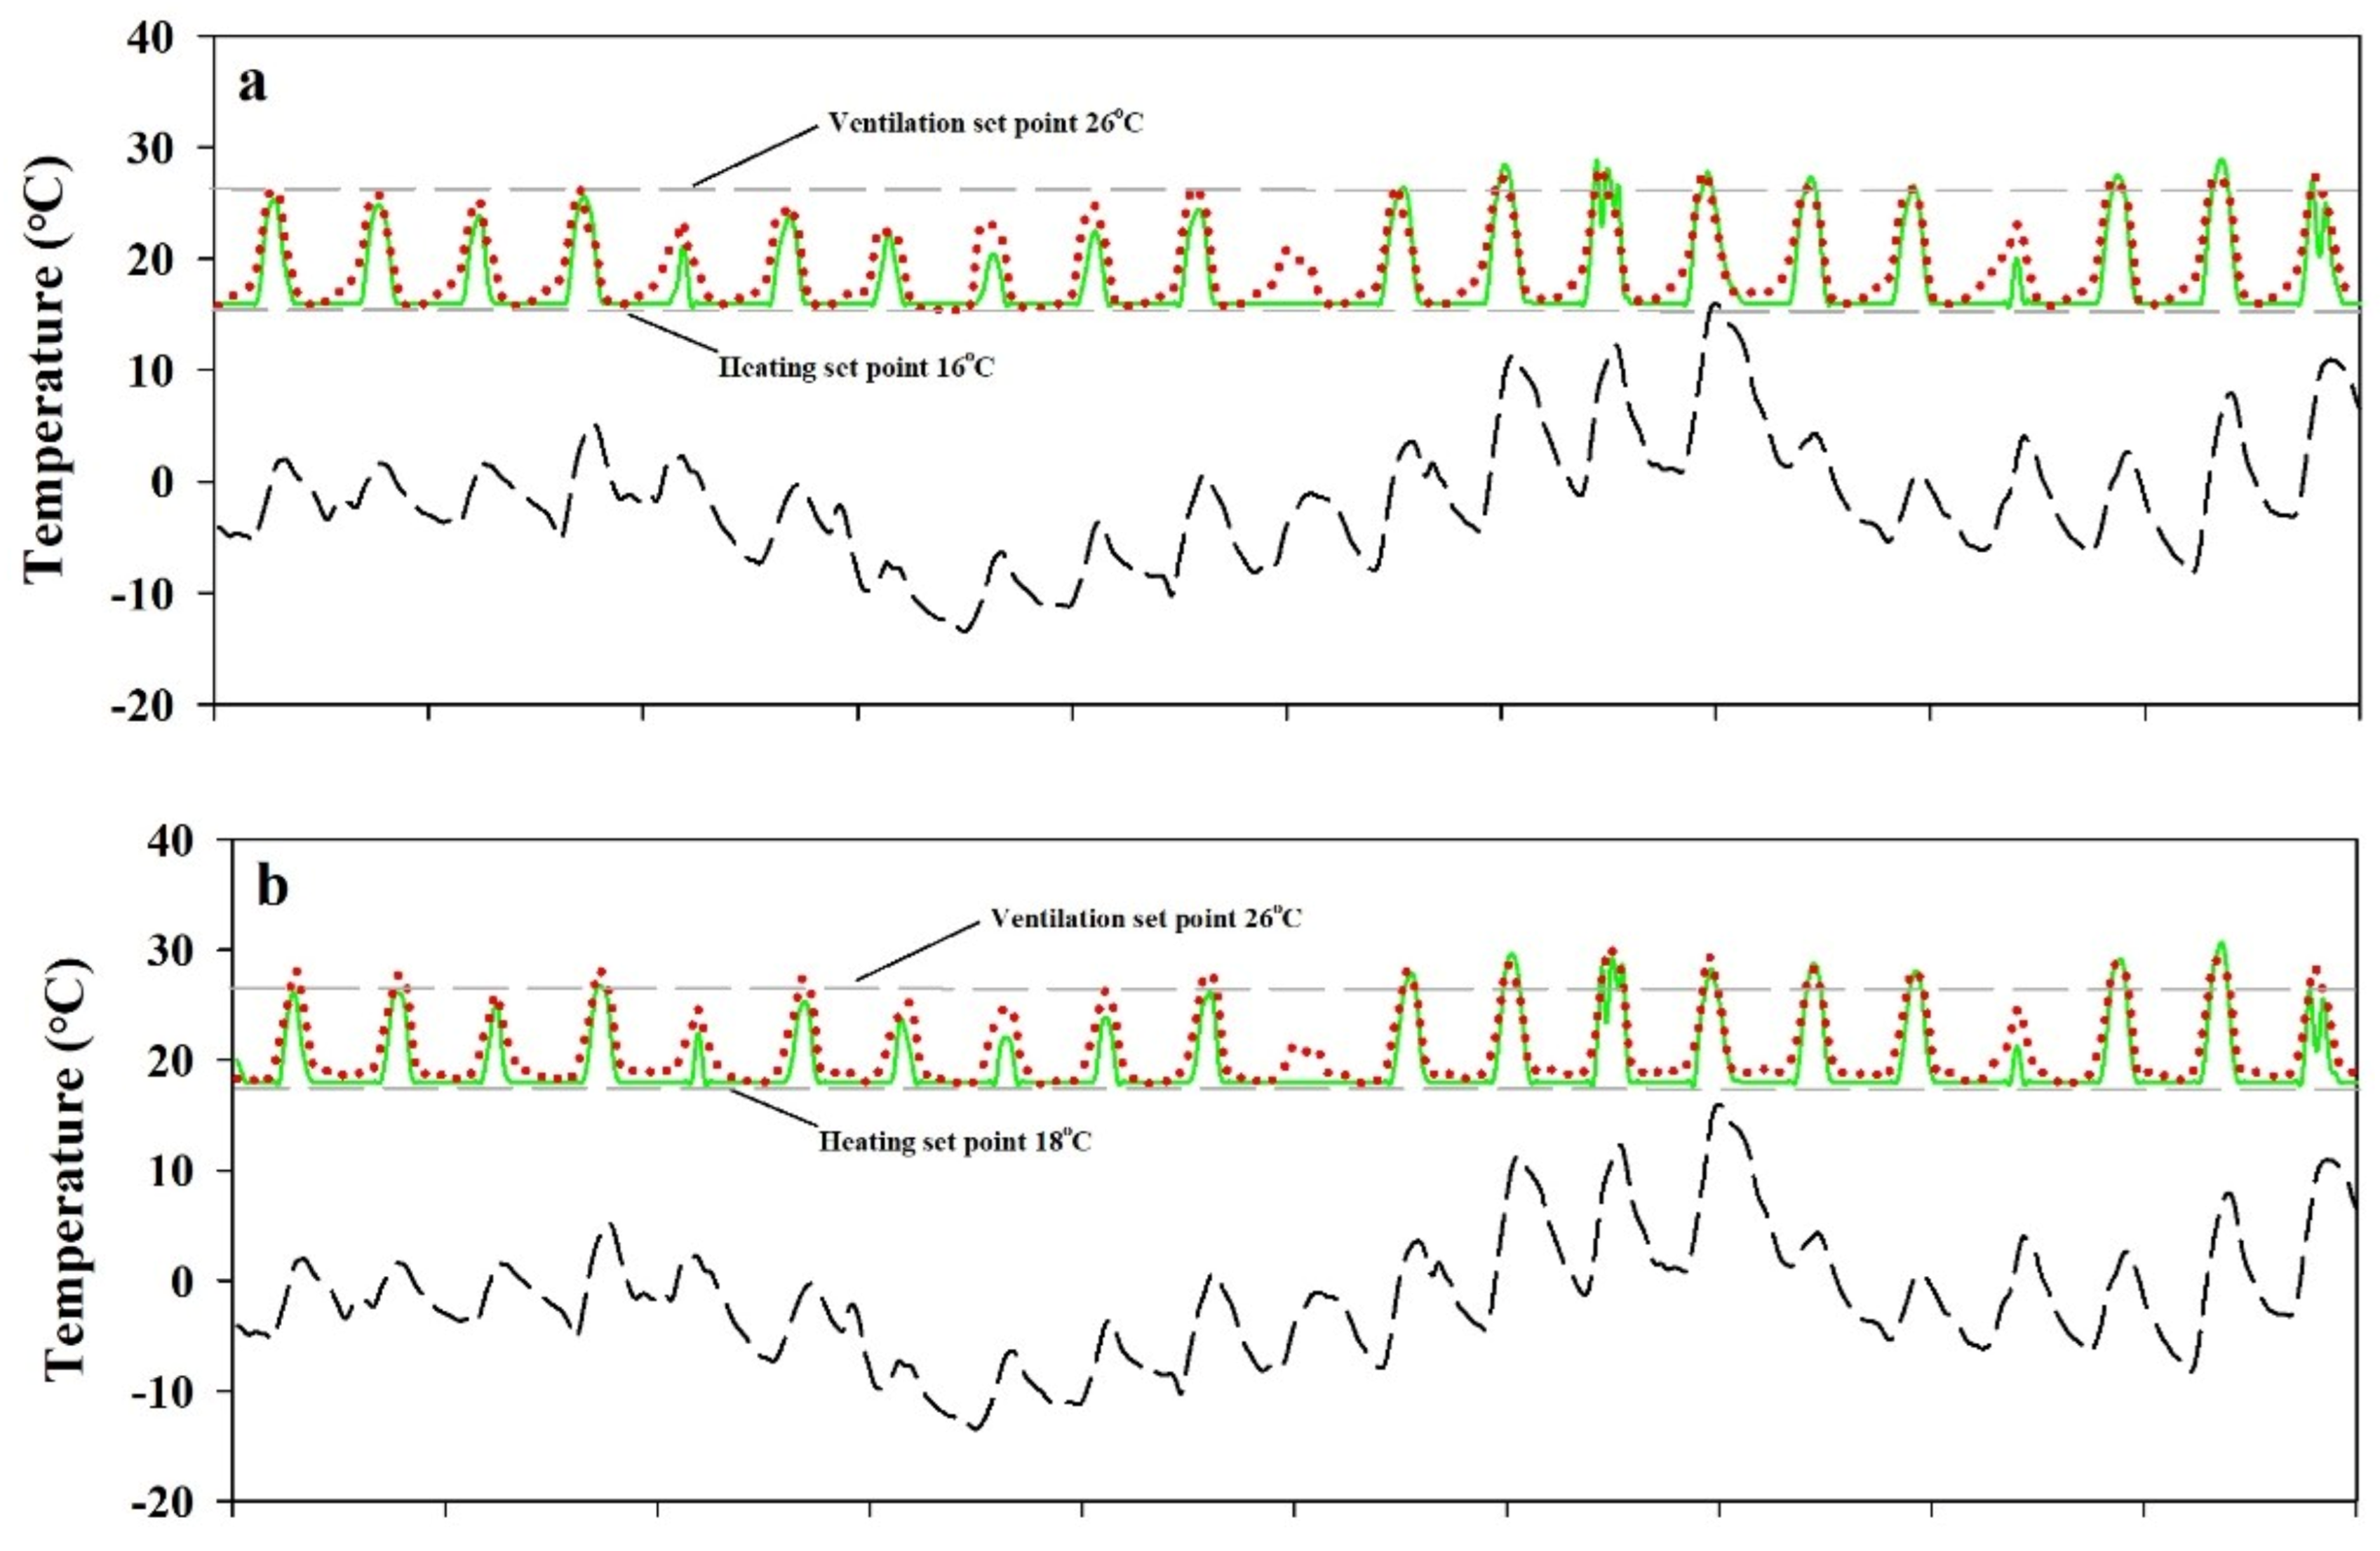
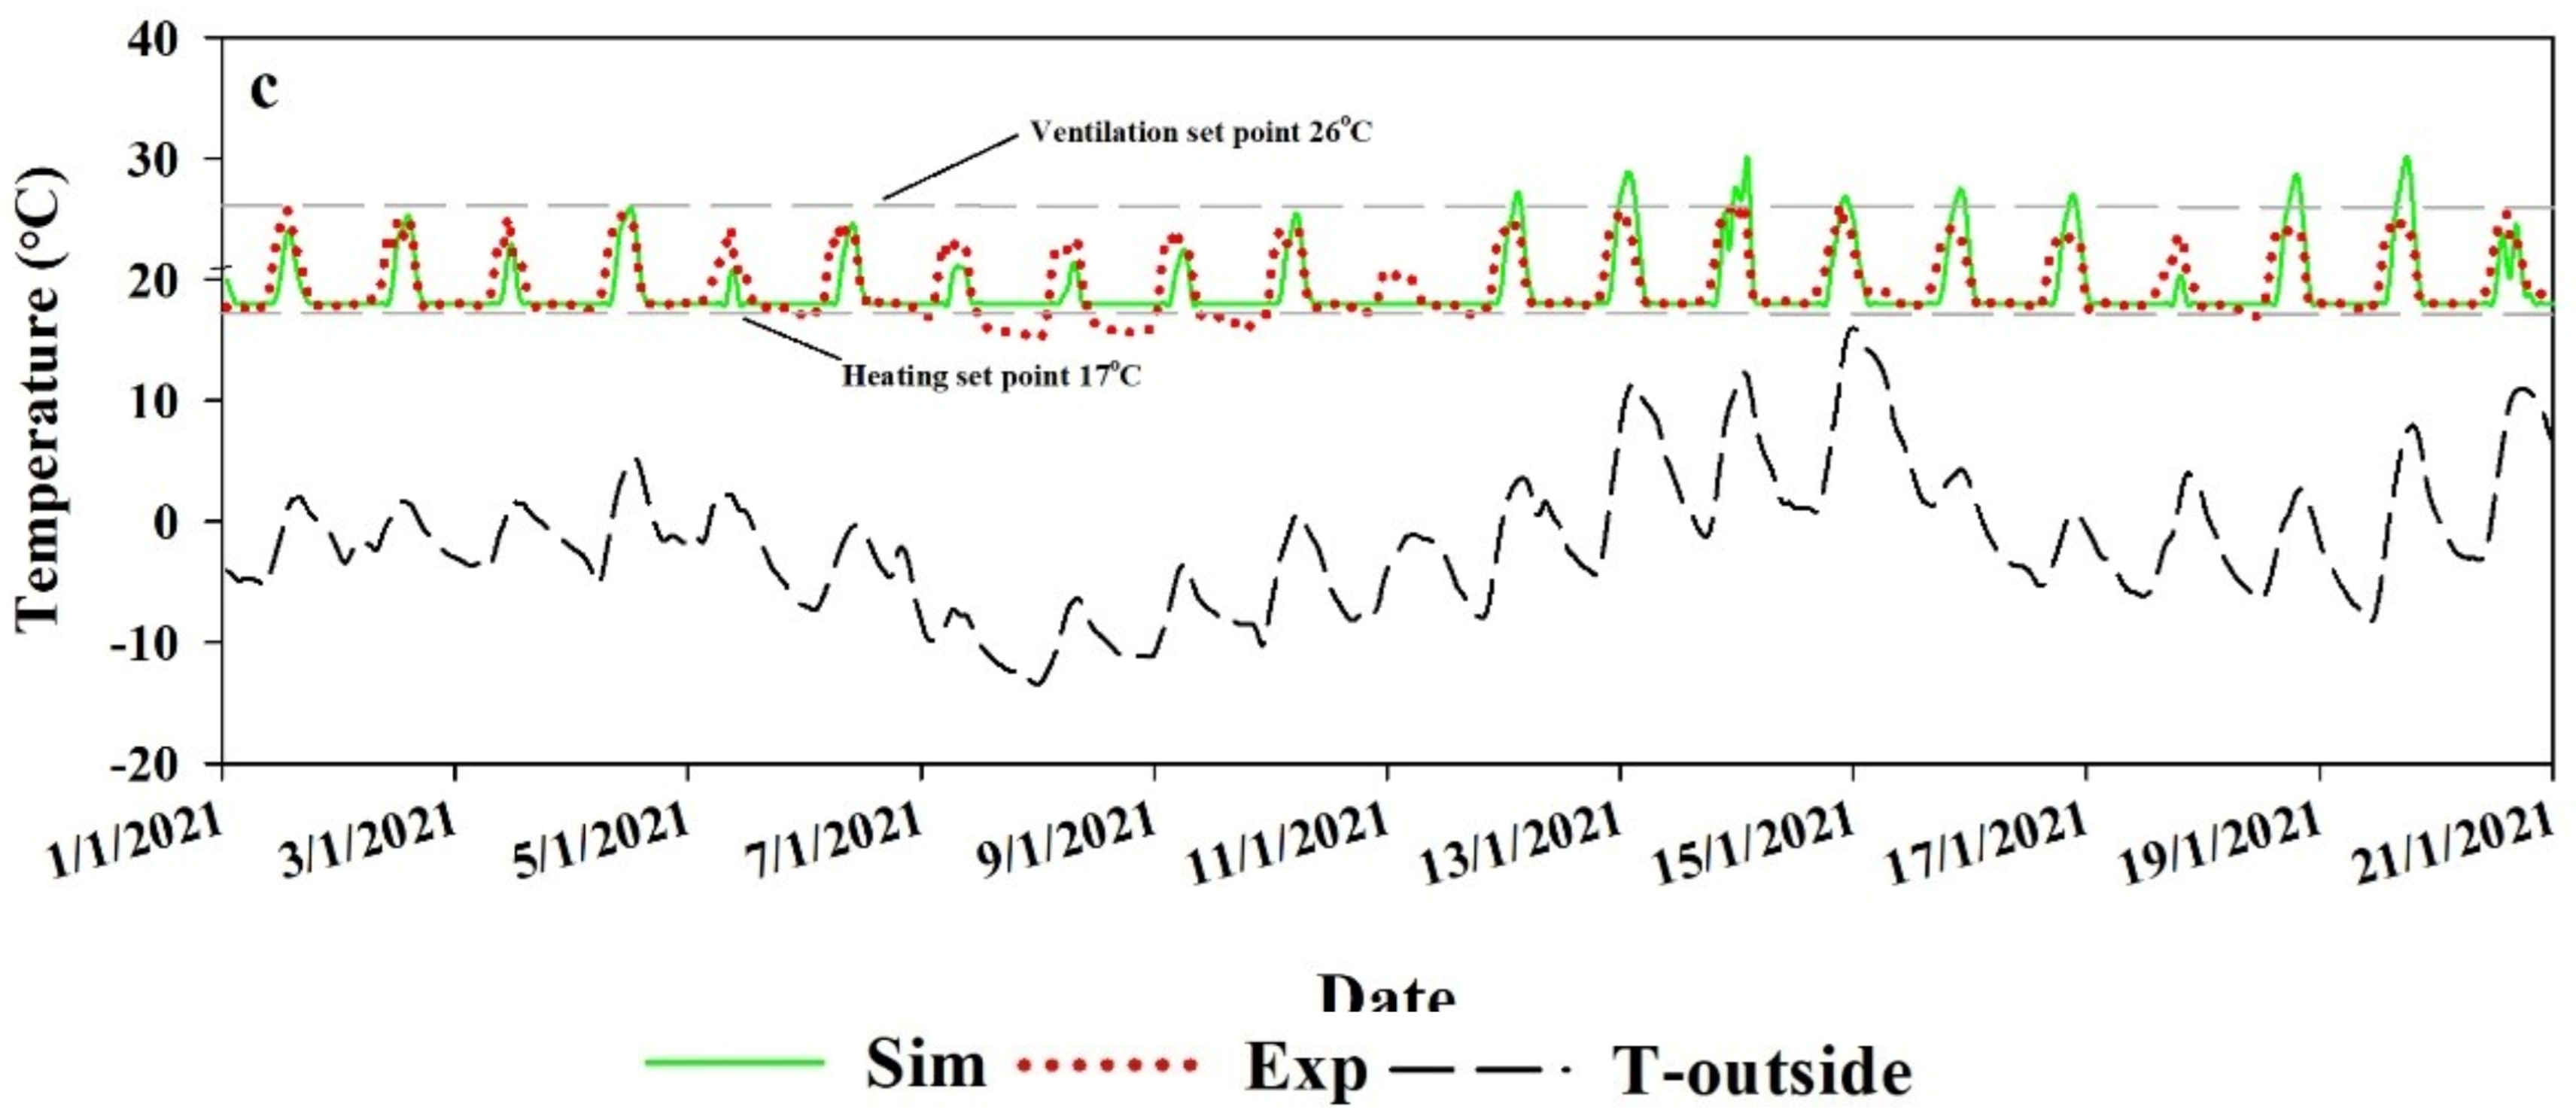
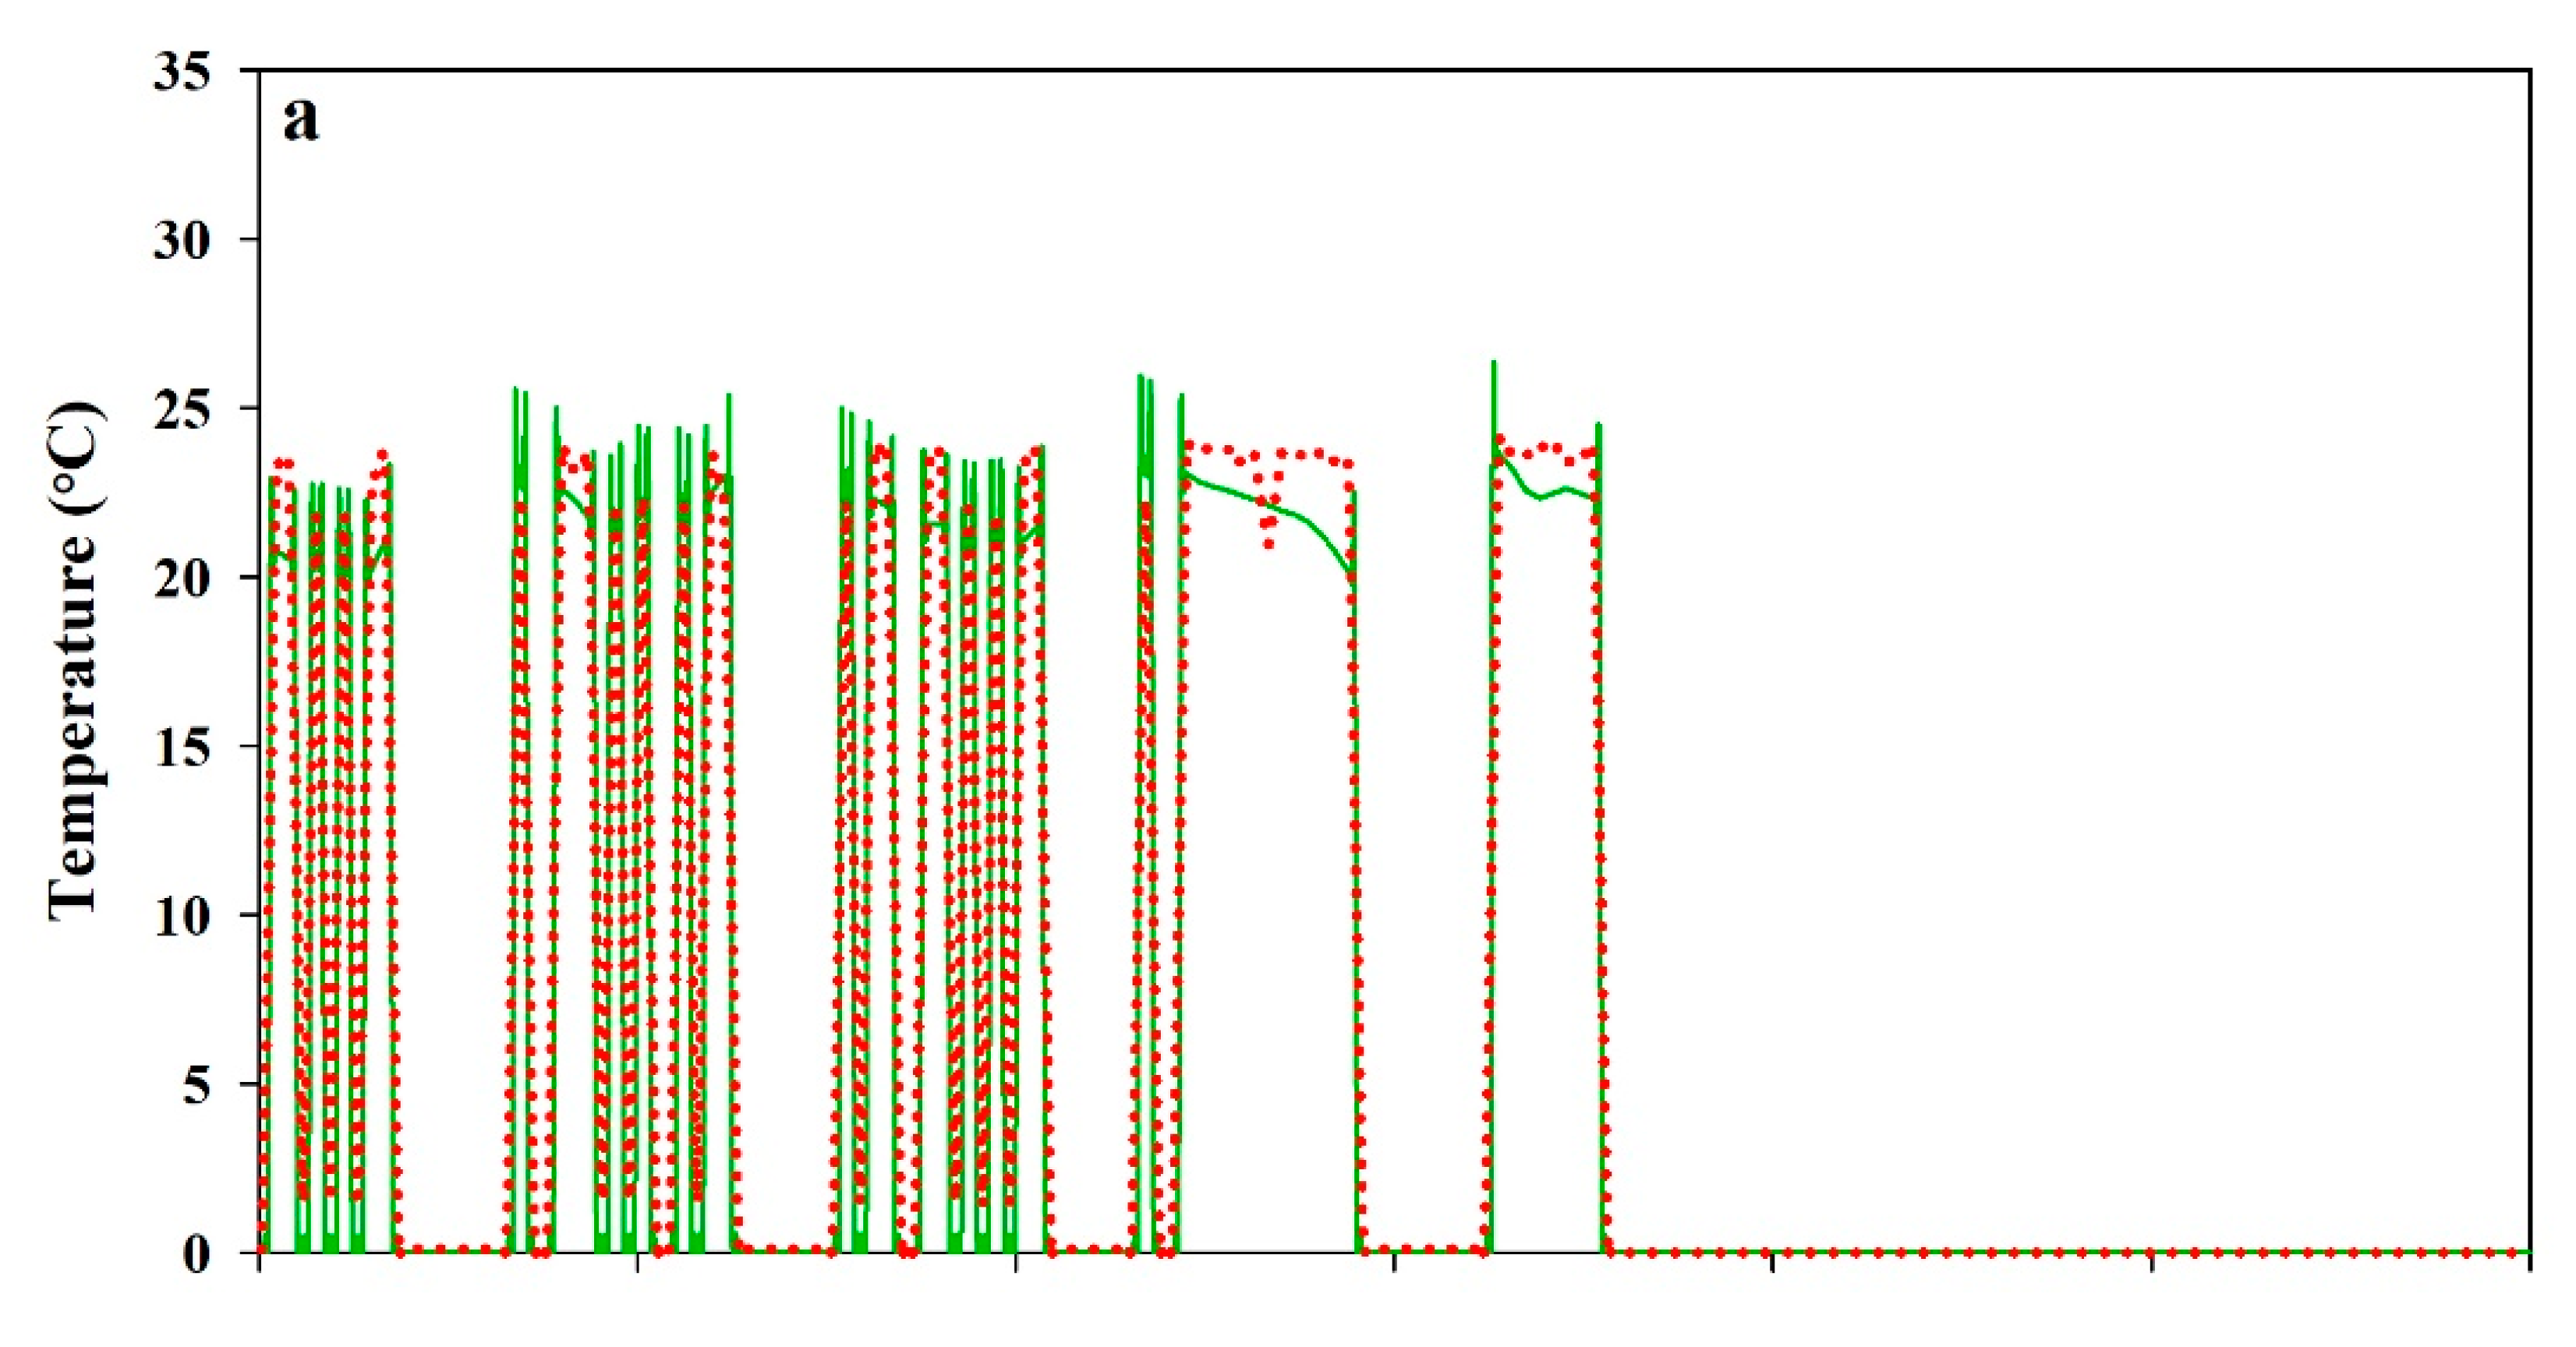
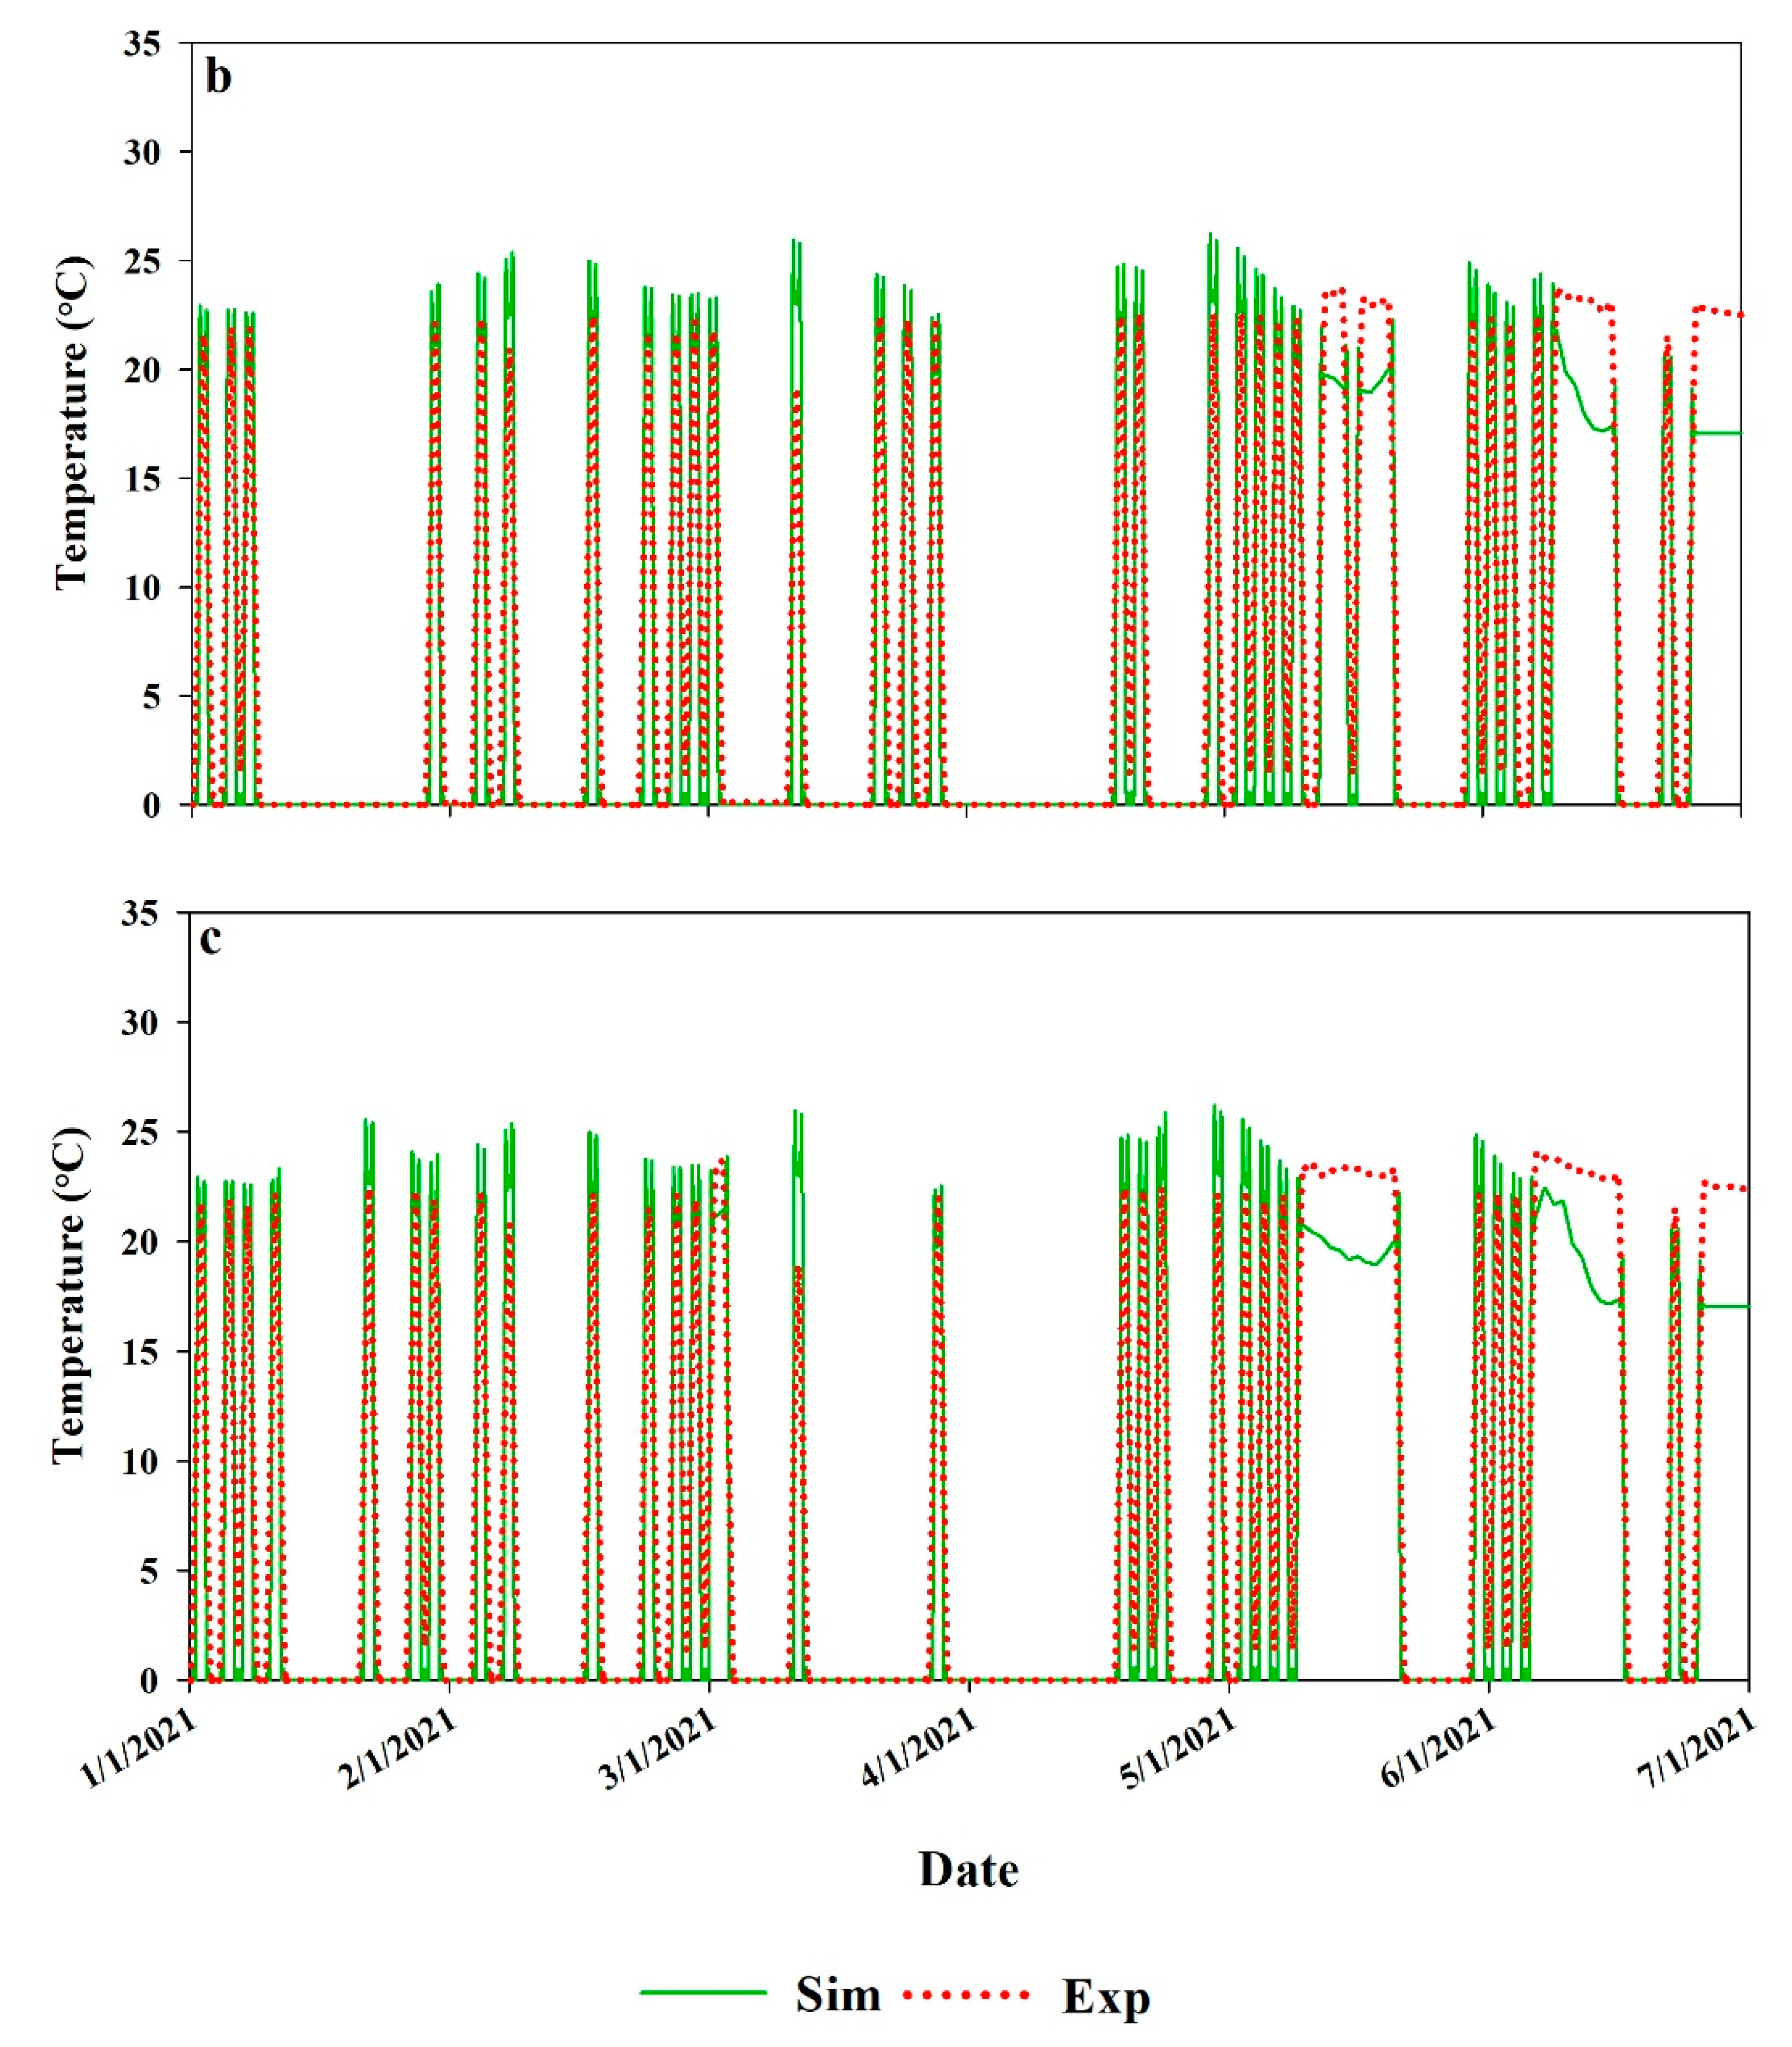
- The RMSE values for the internal greenhouse air temperatures were 1.9, 1.8, and 2.0 °C, indicating the maximum temperature difference between the predicted and experimental results. The NSE values were 0.71, 0.70, and 0.65, respectively.
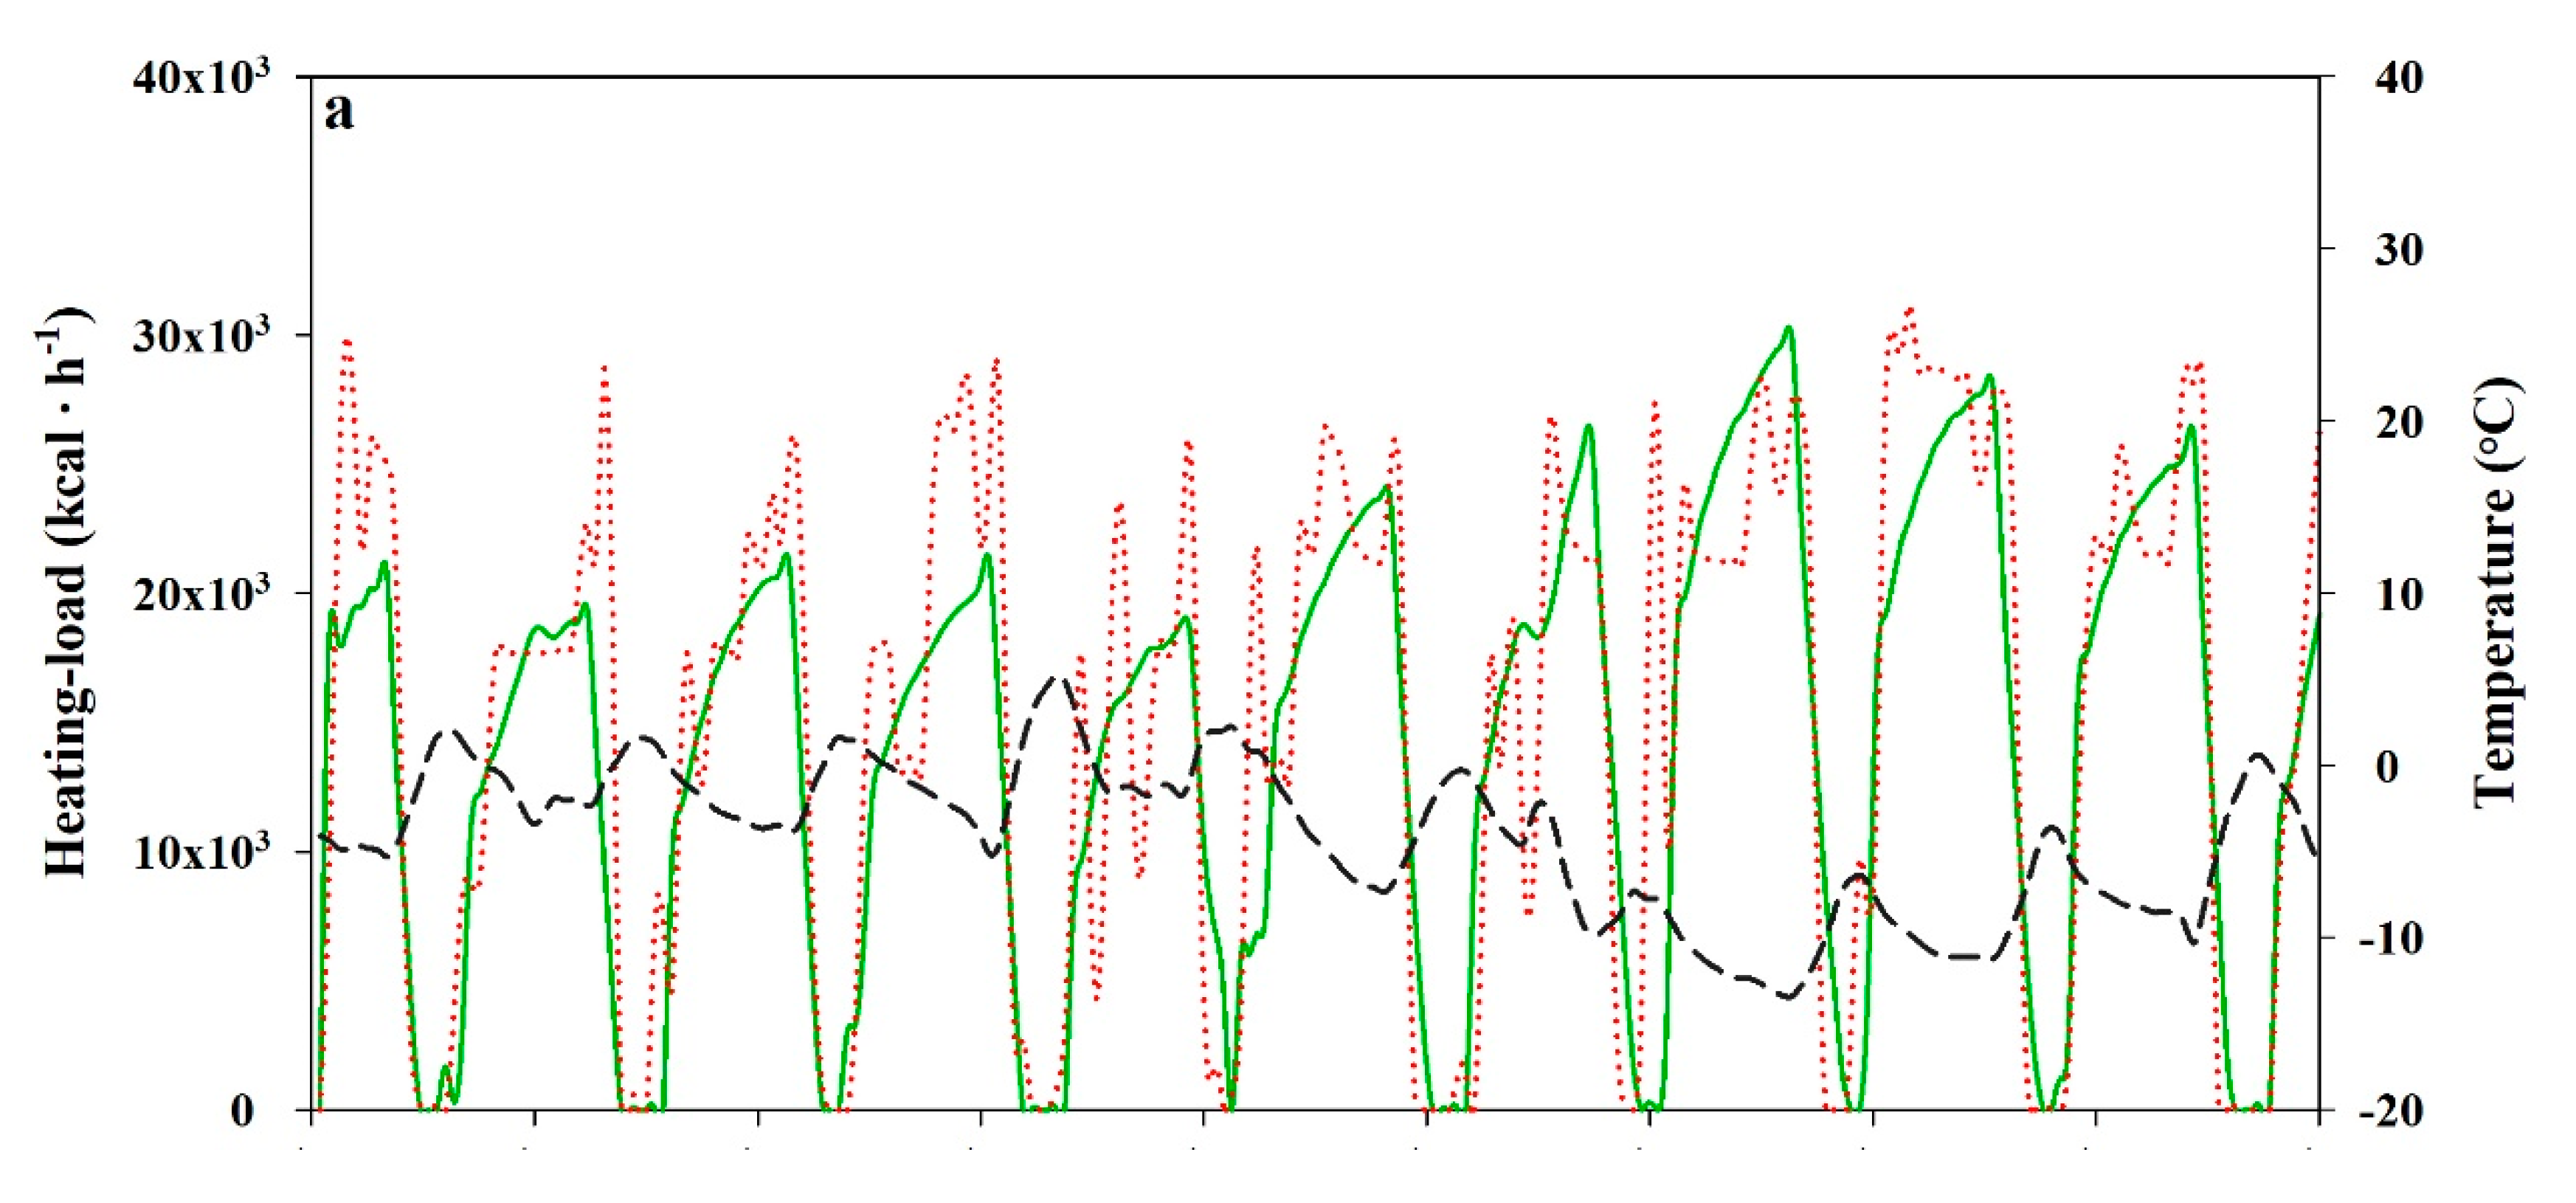
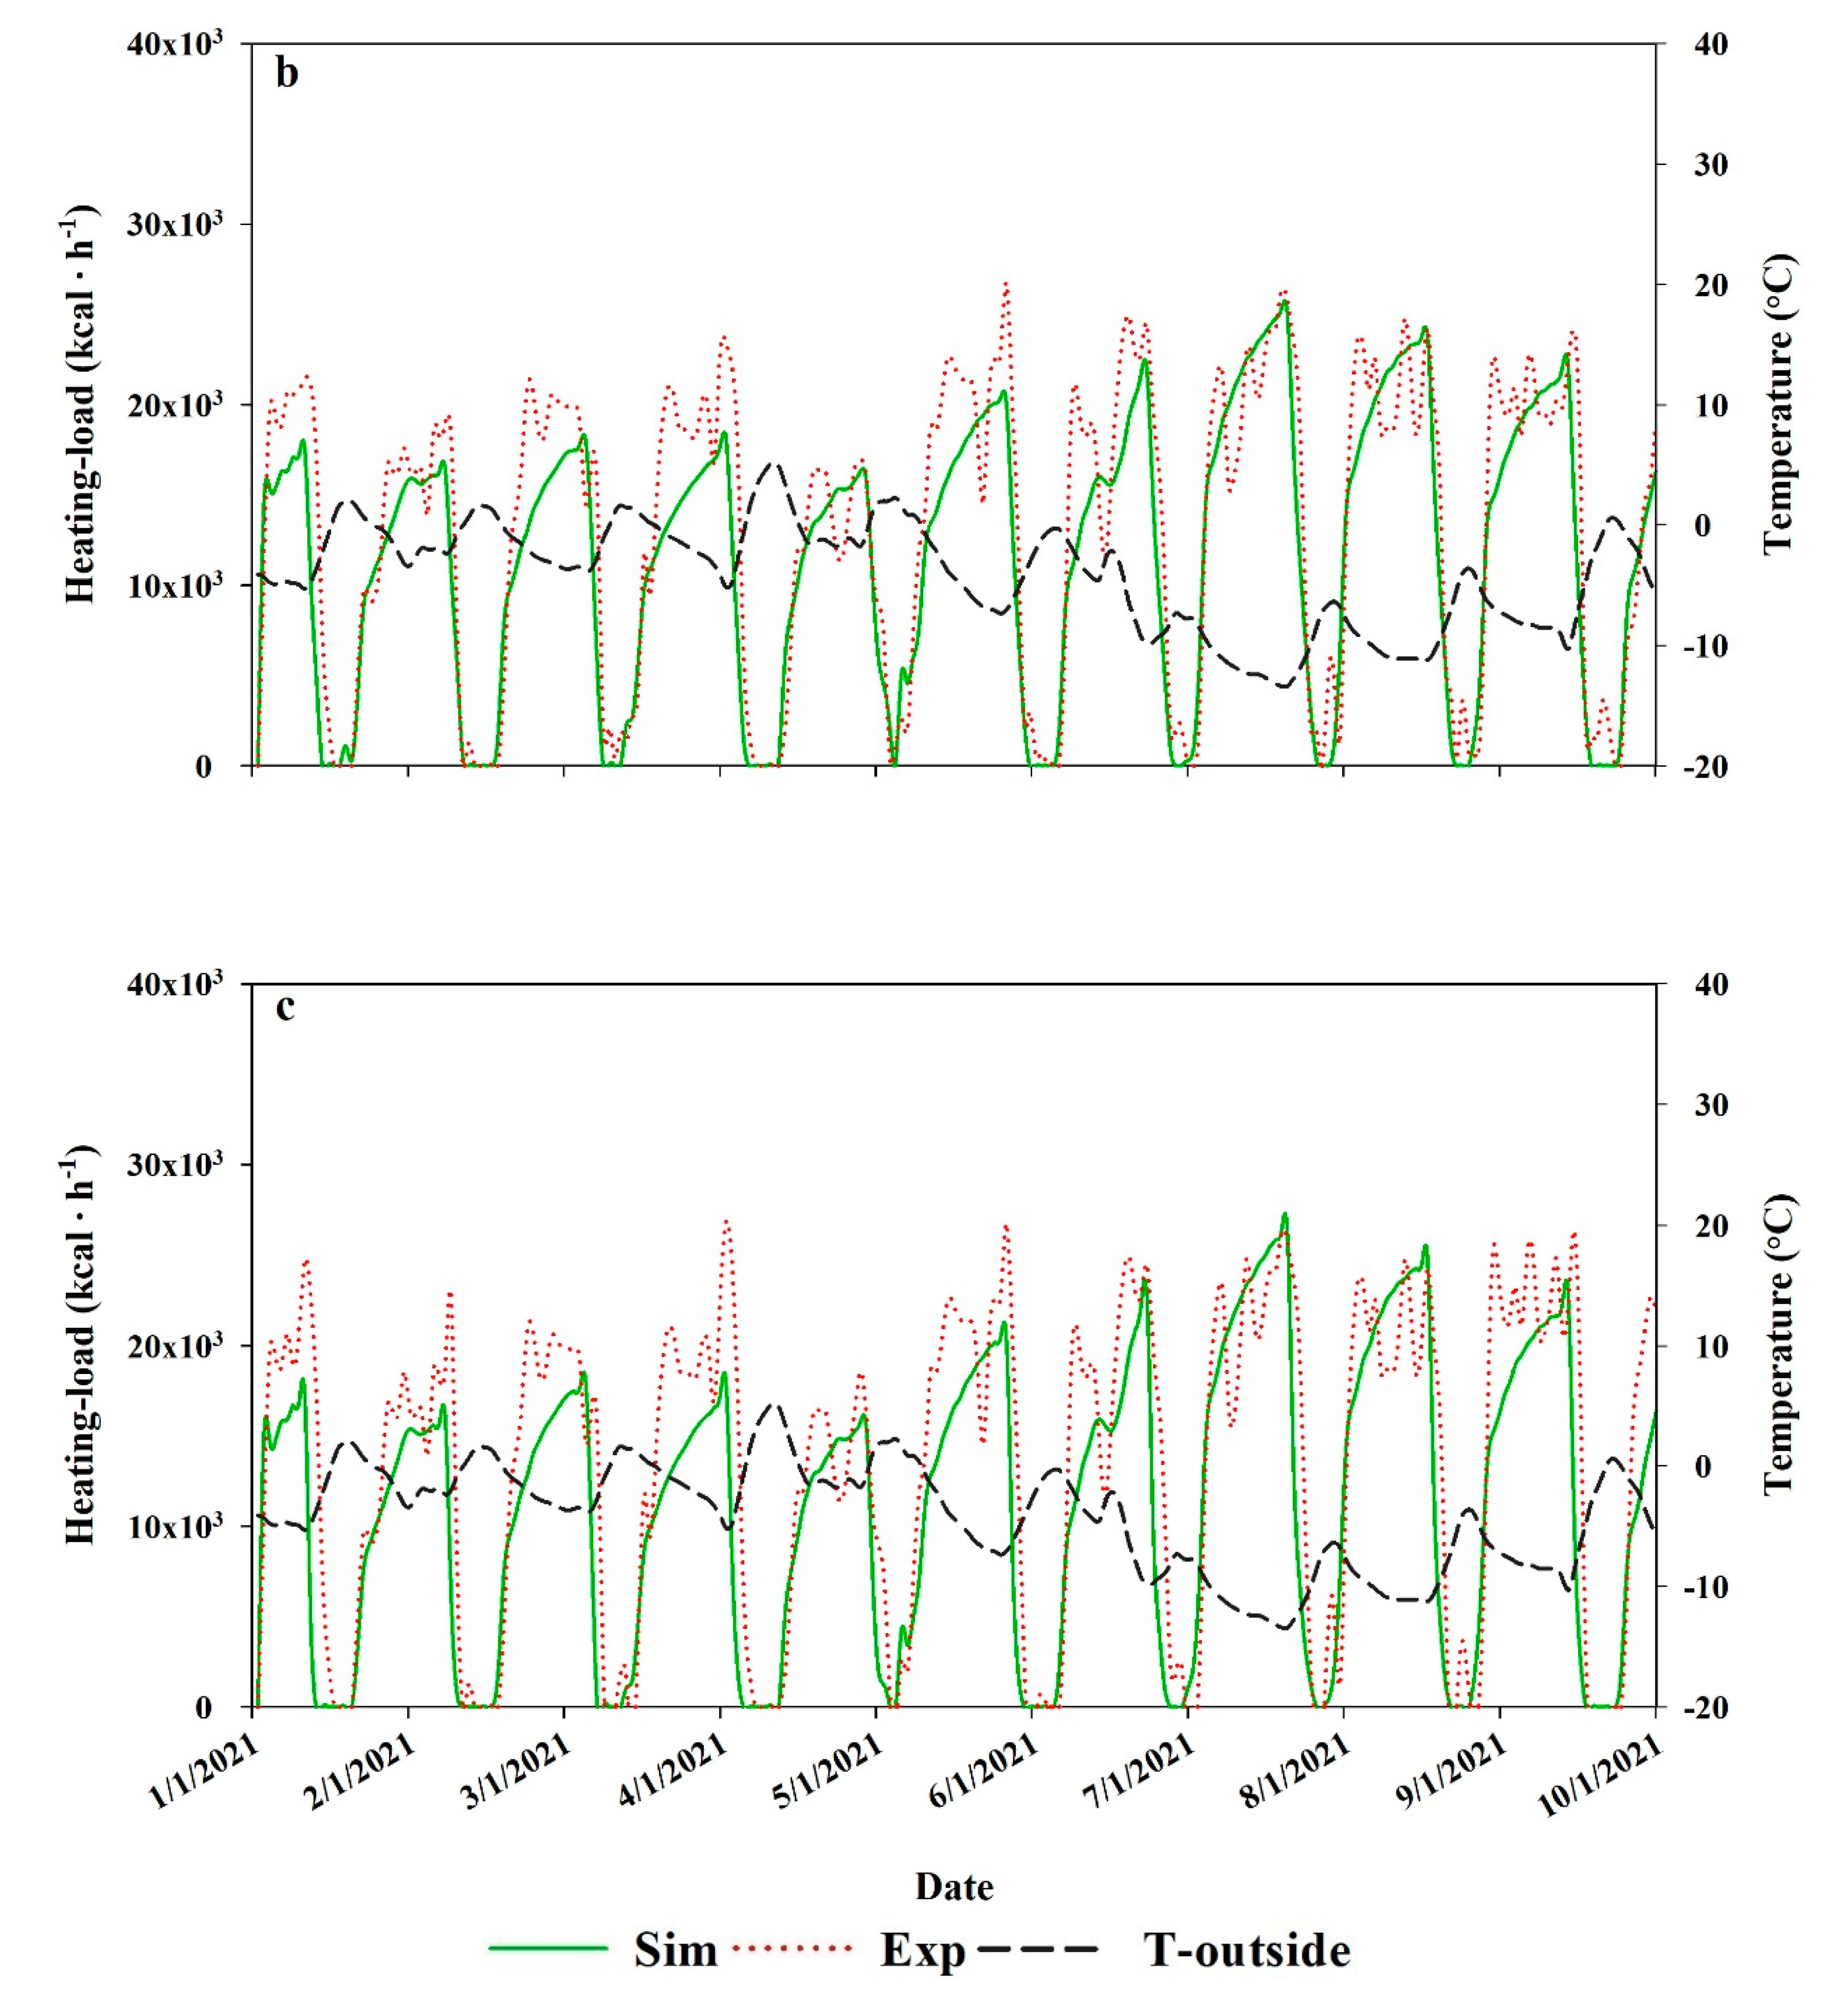
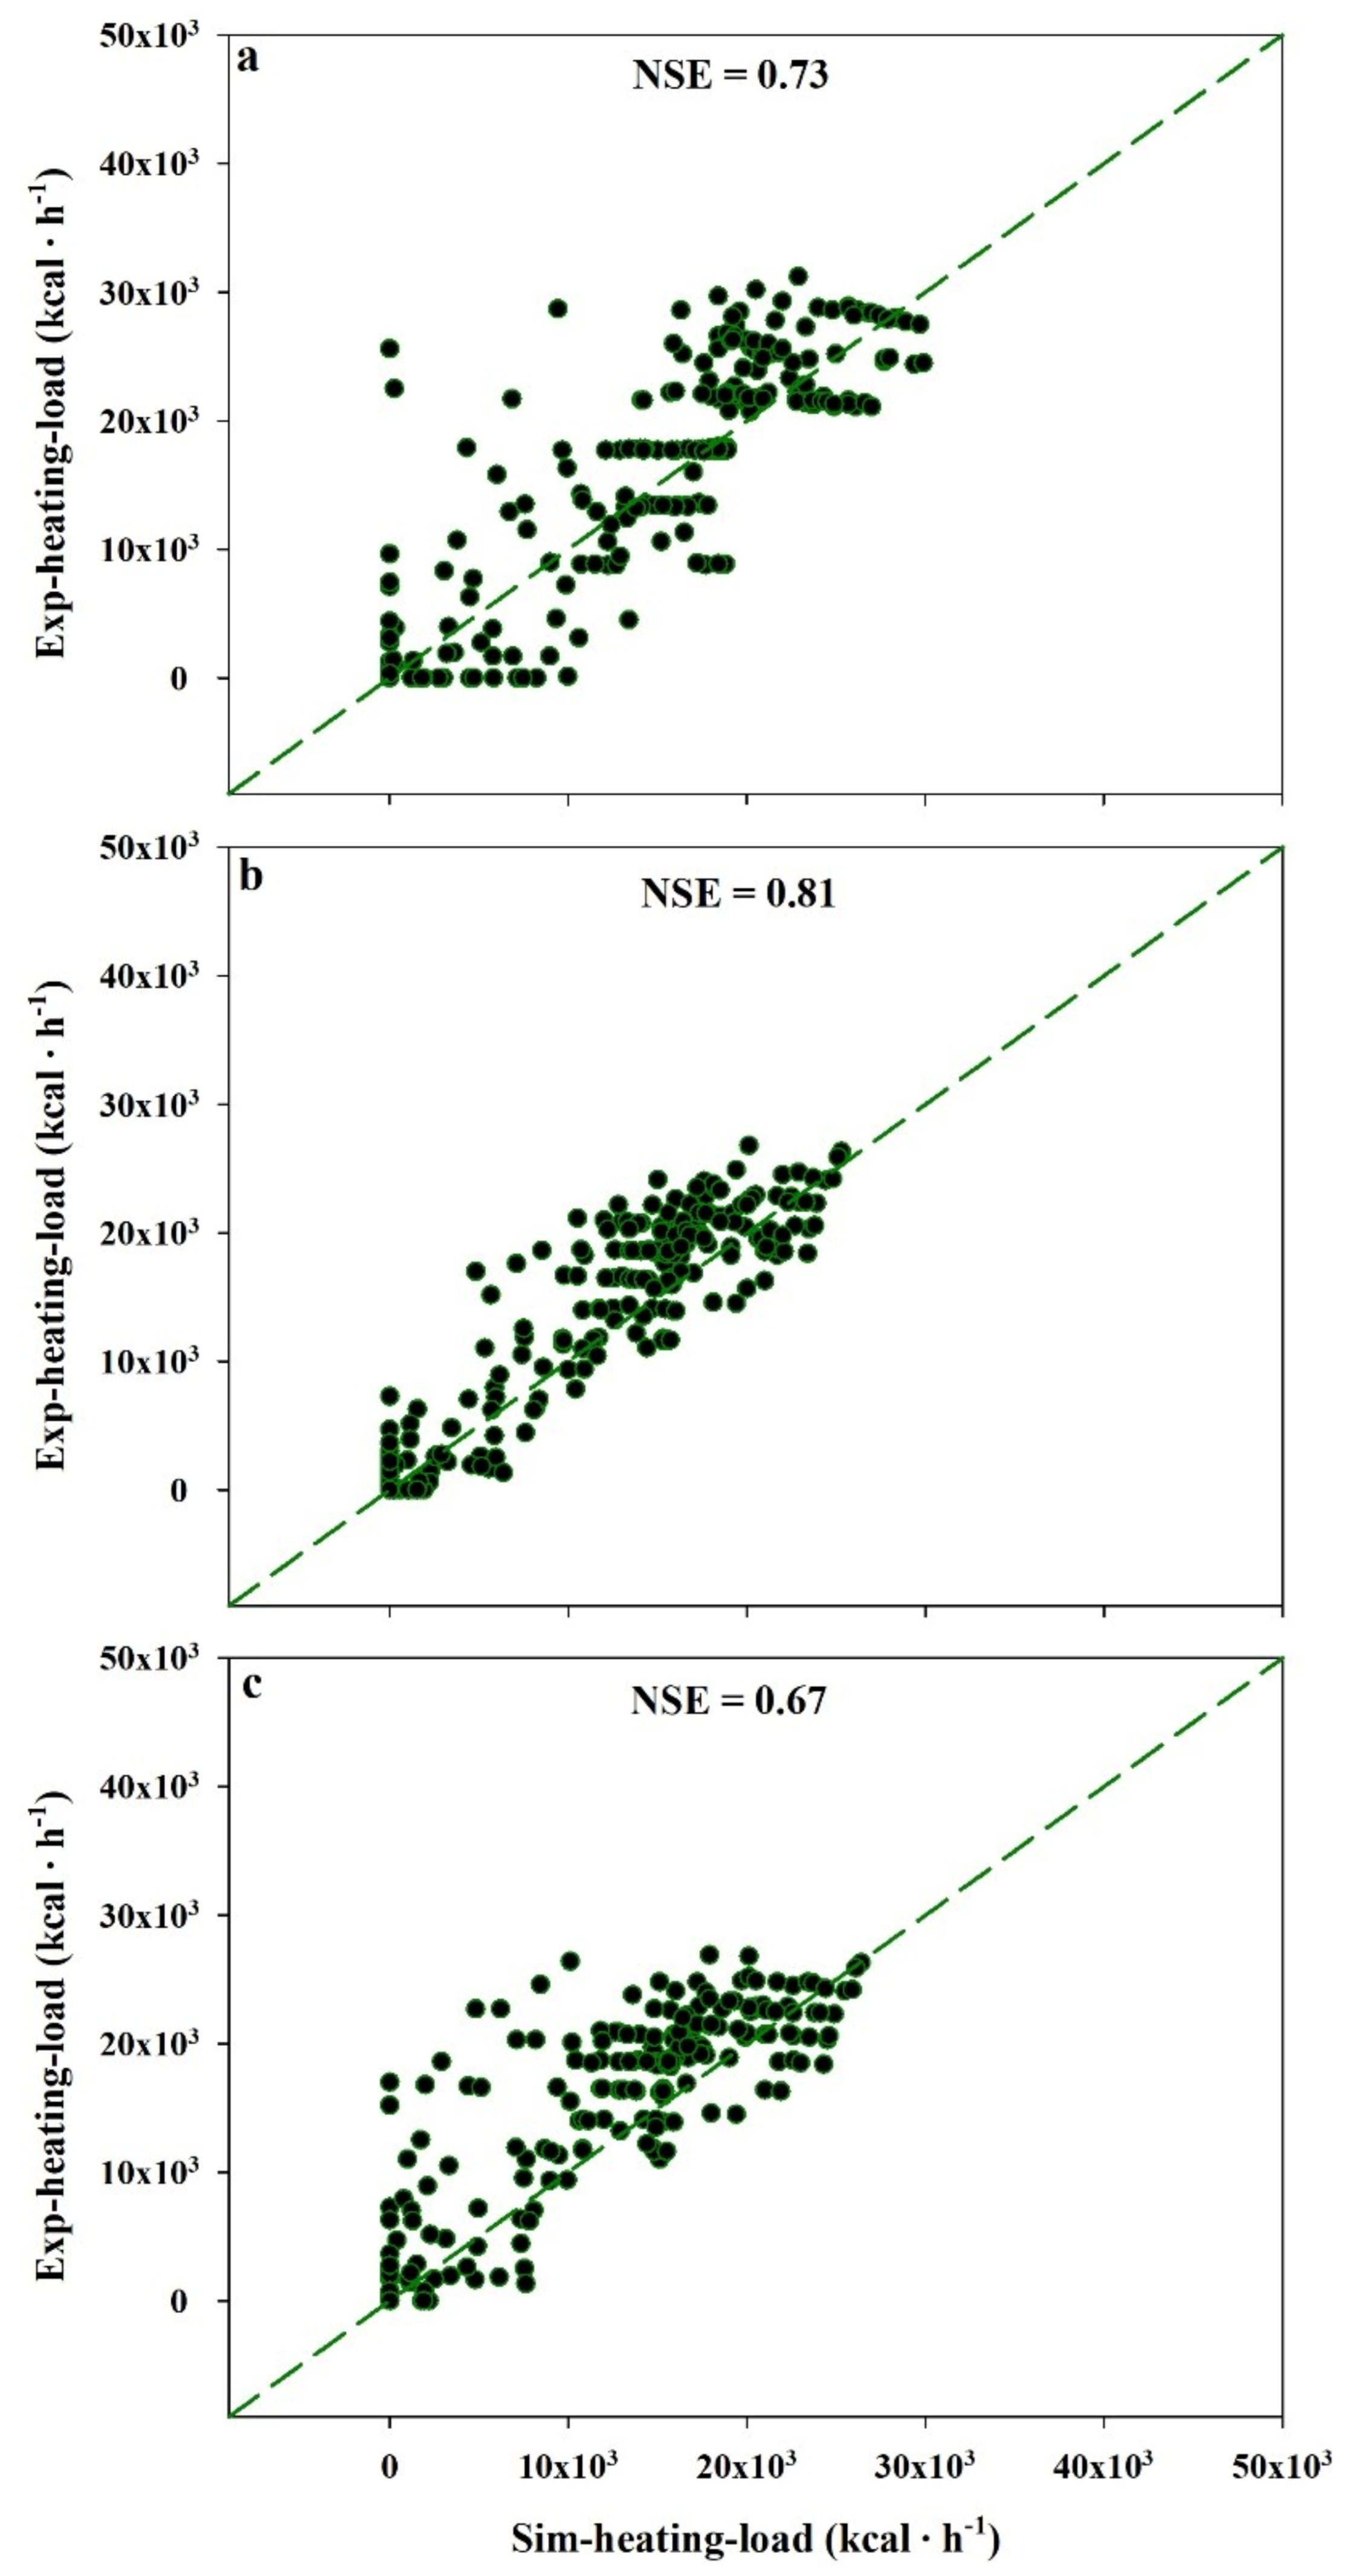
- The RMSE values of the energy load results for greenhouse compartments 1, 2, and 3 were 5140, 3674, and 5141 Kcal·h−1, respectively, and the NSE values of greenhouse compartments 1, 2, and 3 were, 0.73, 0.81, and 0.67, respectively.
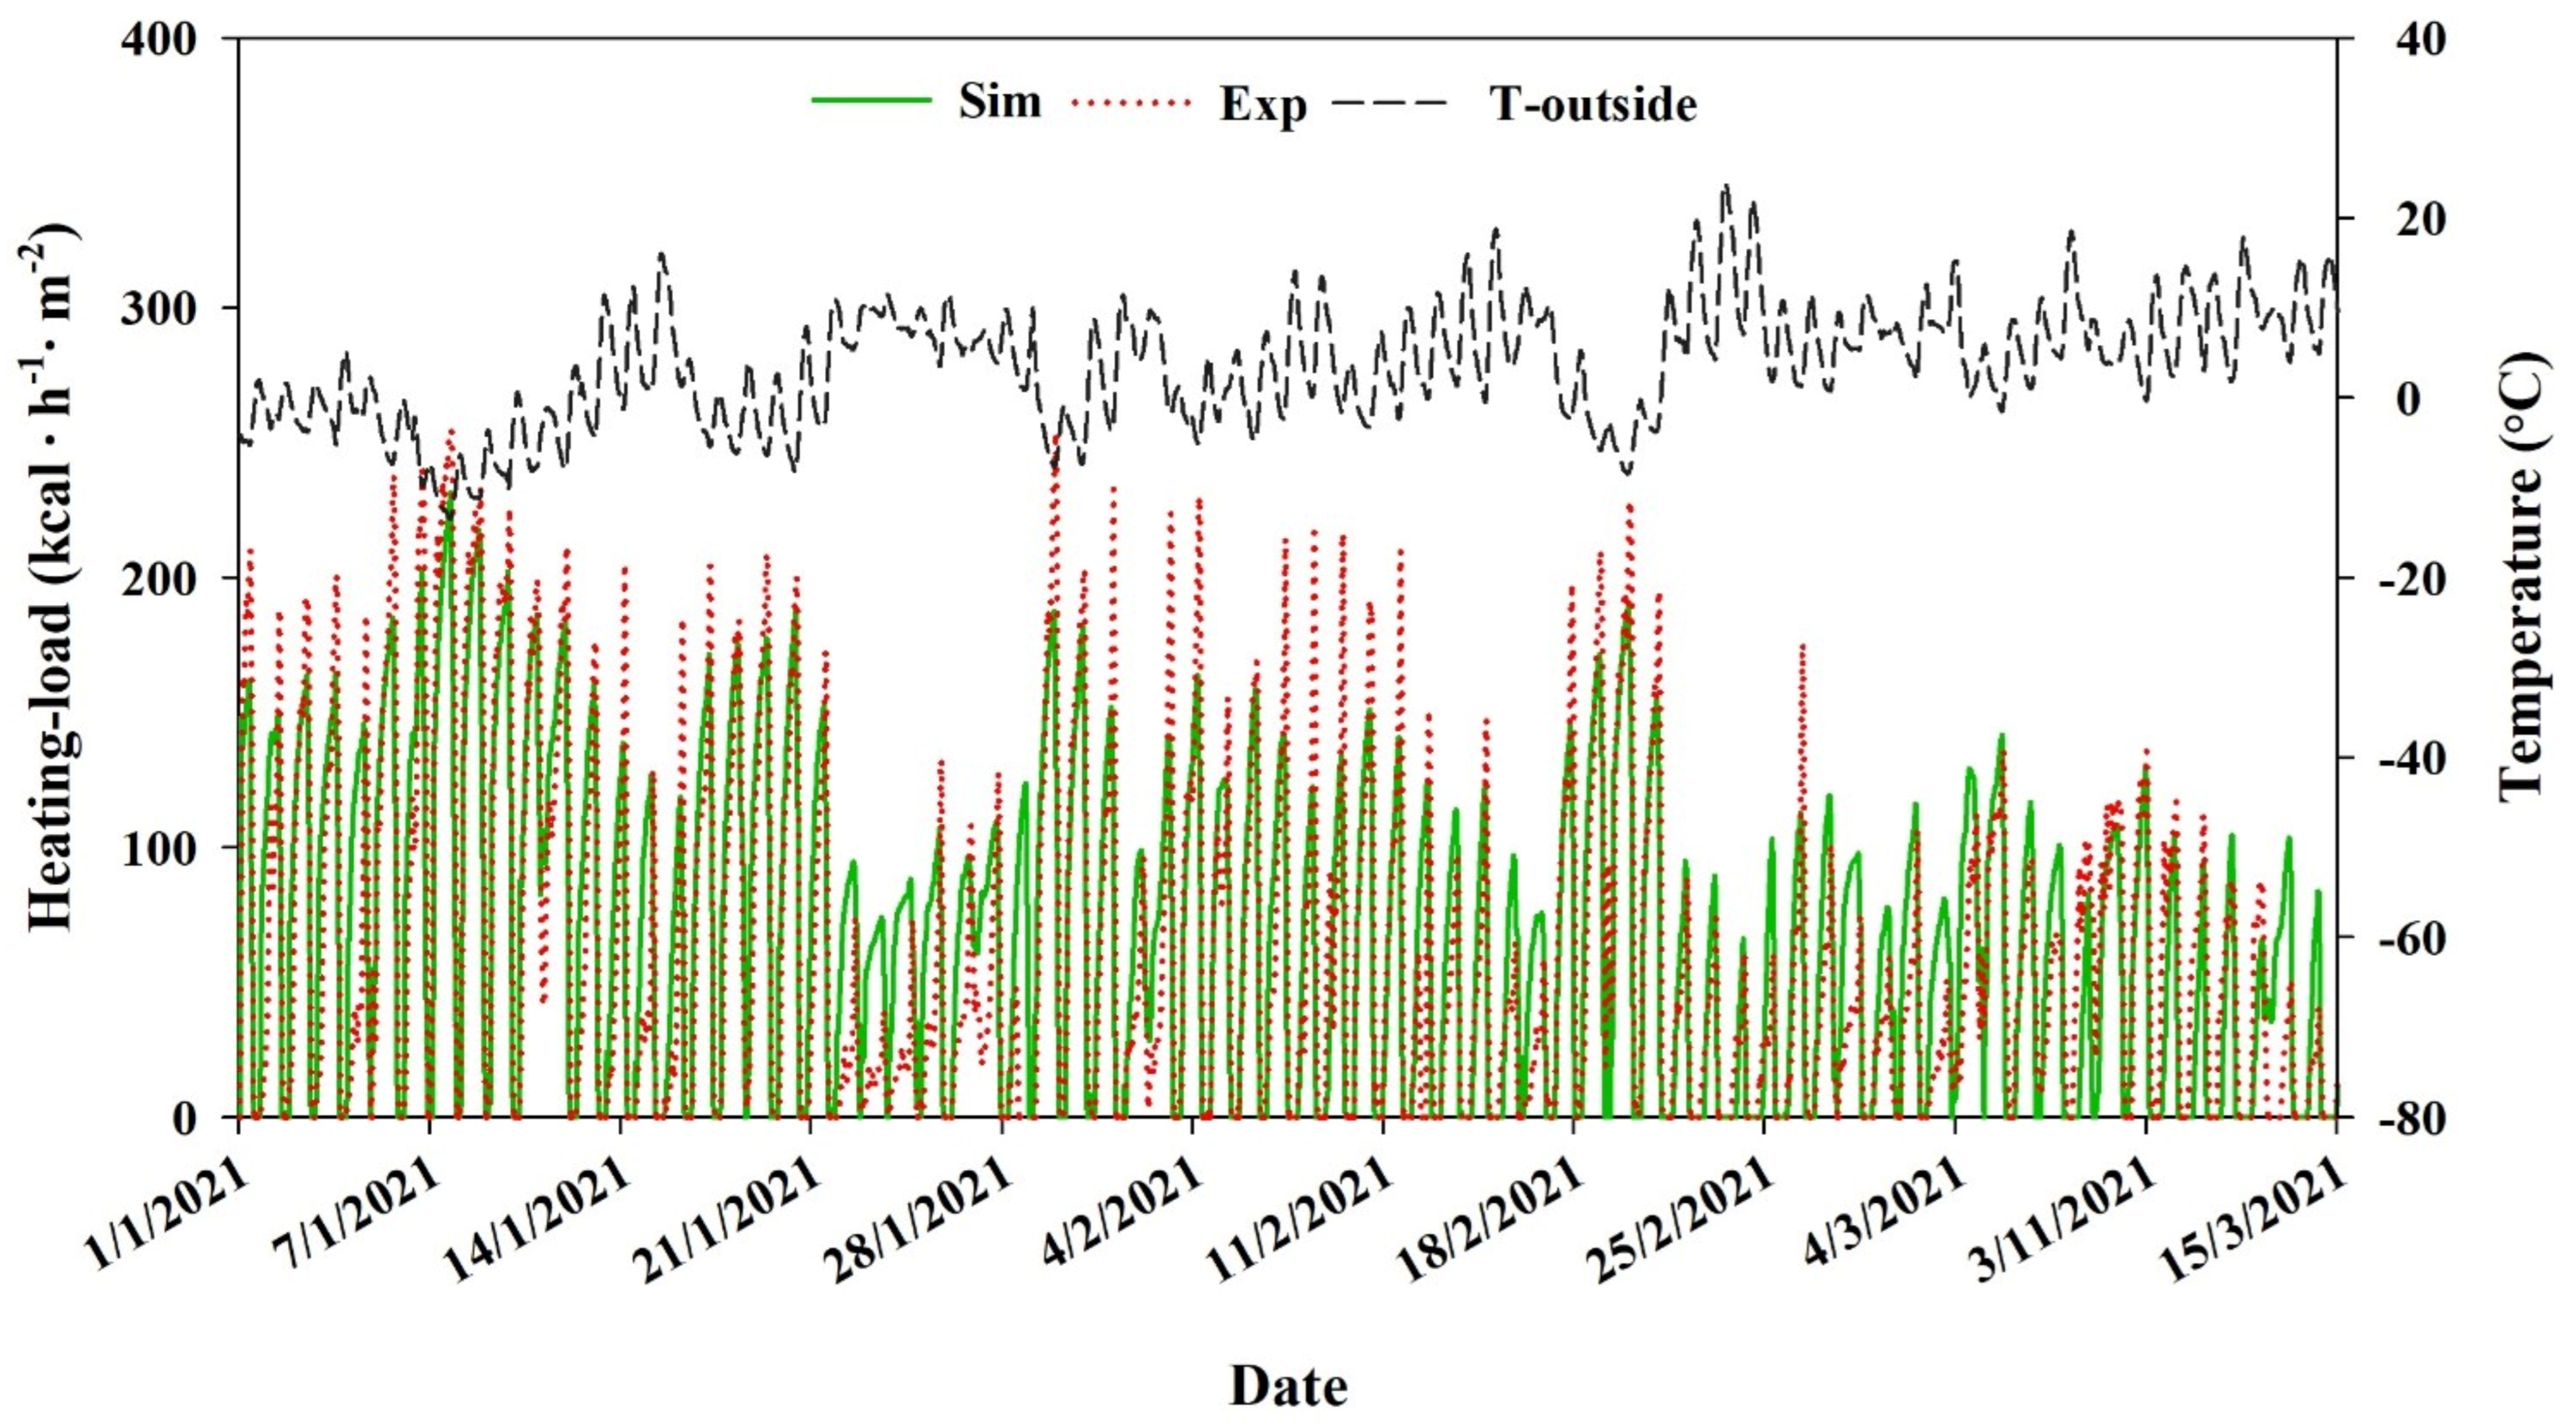
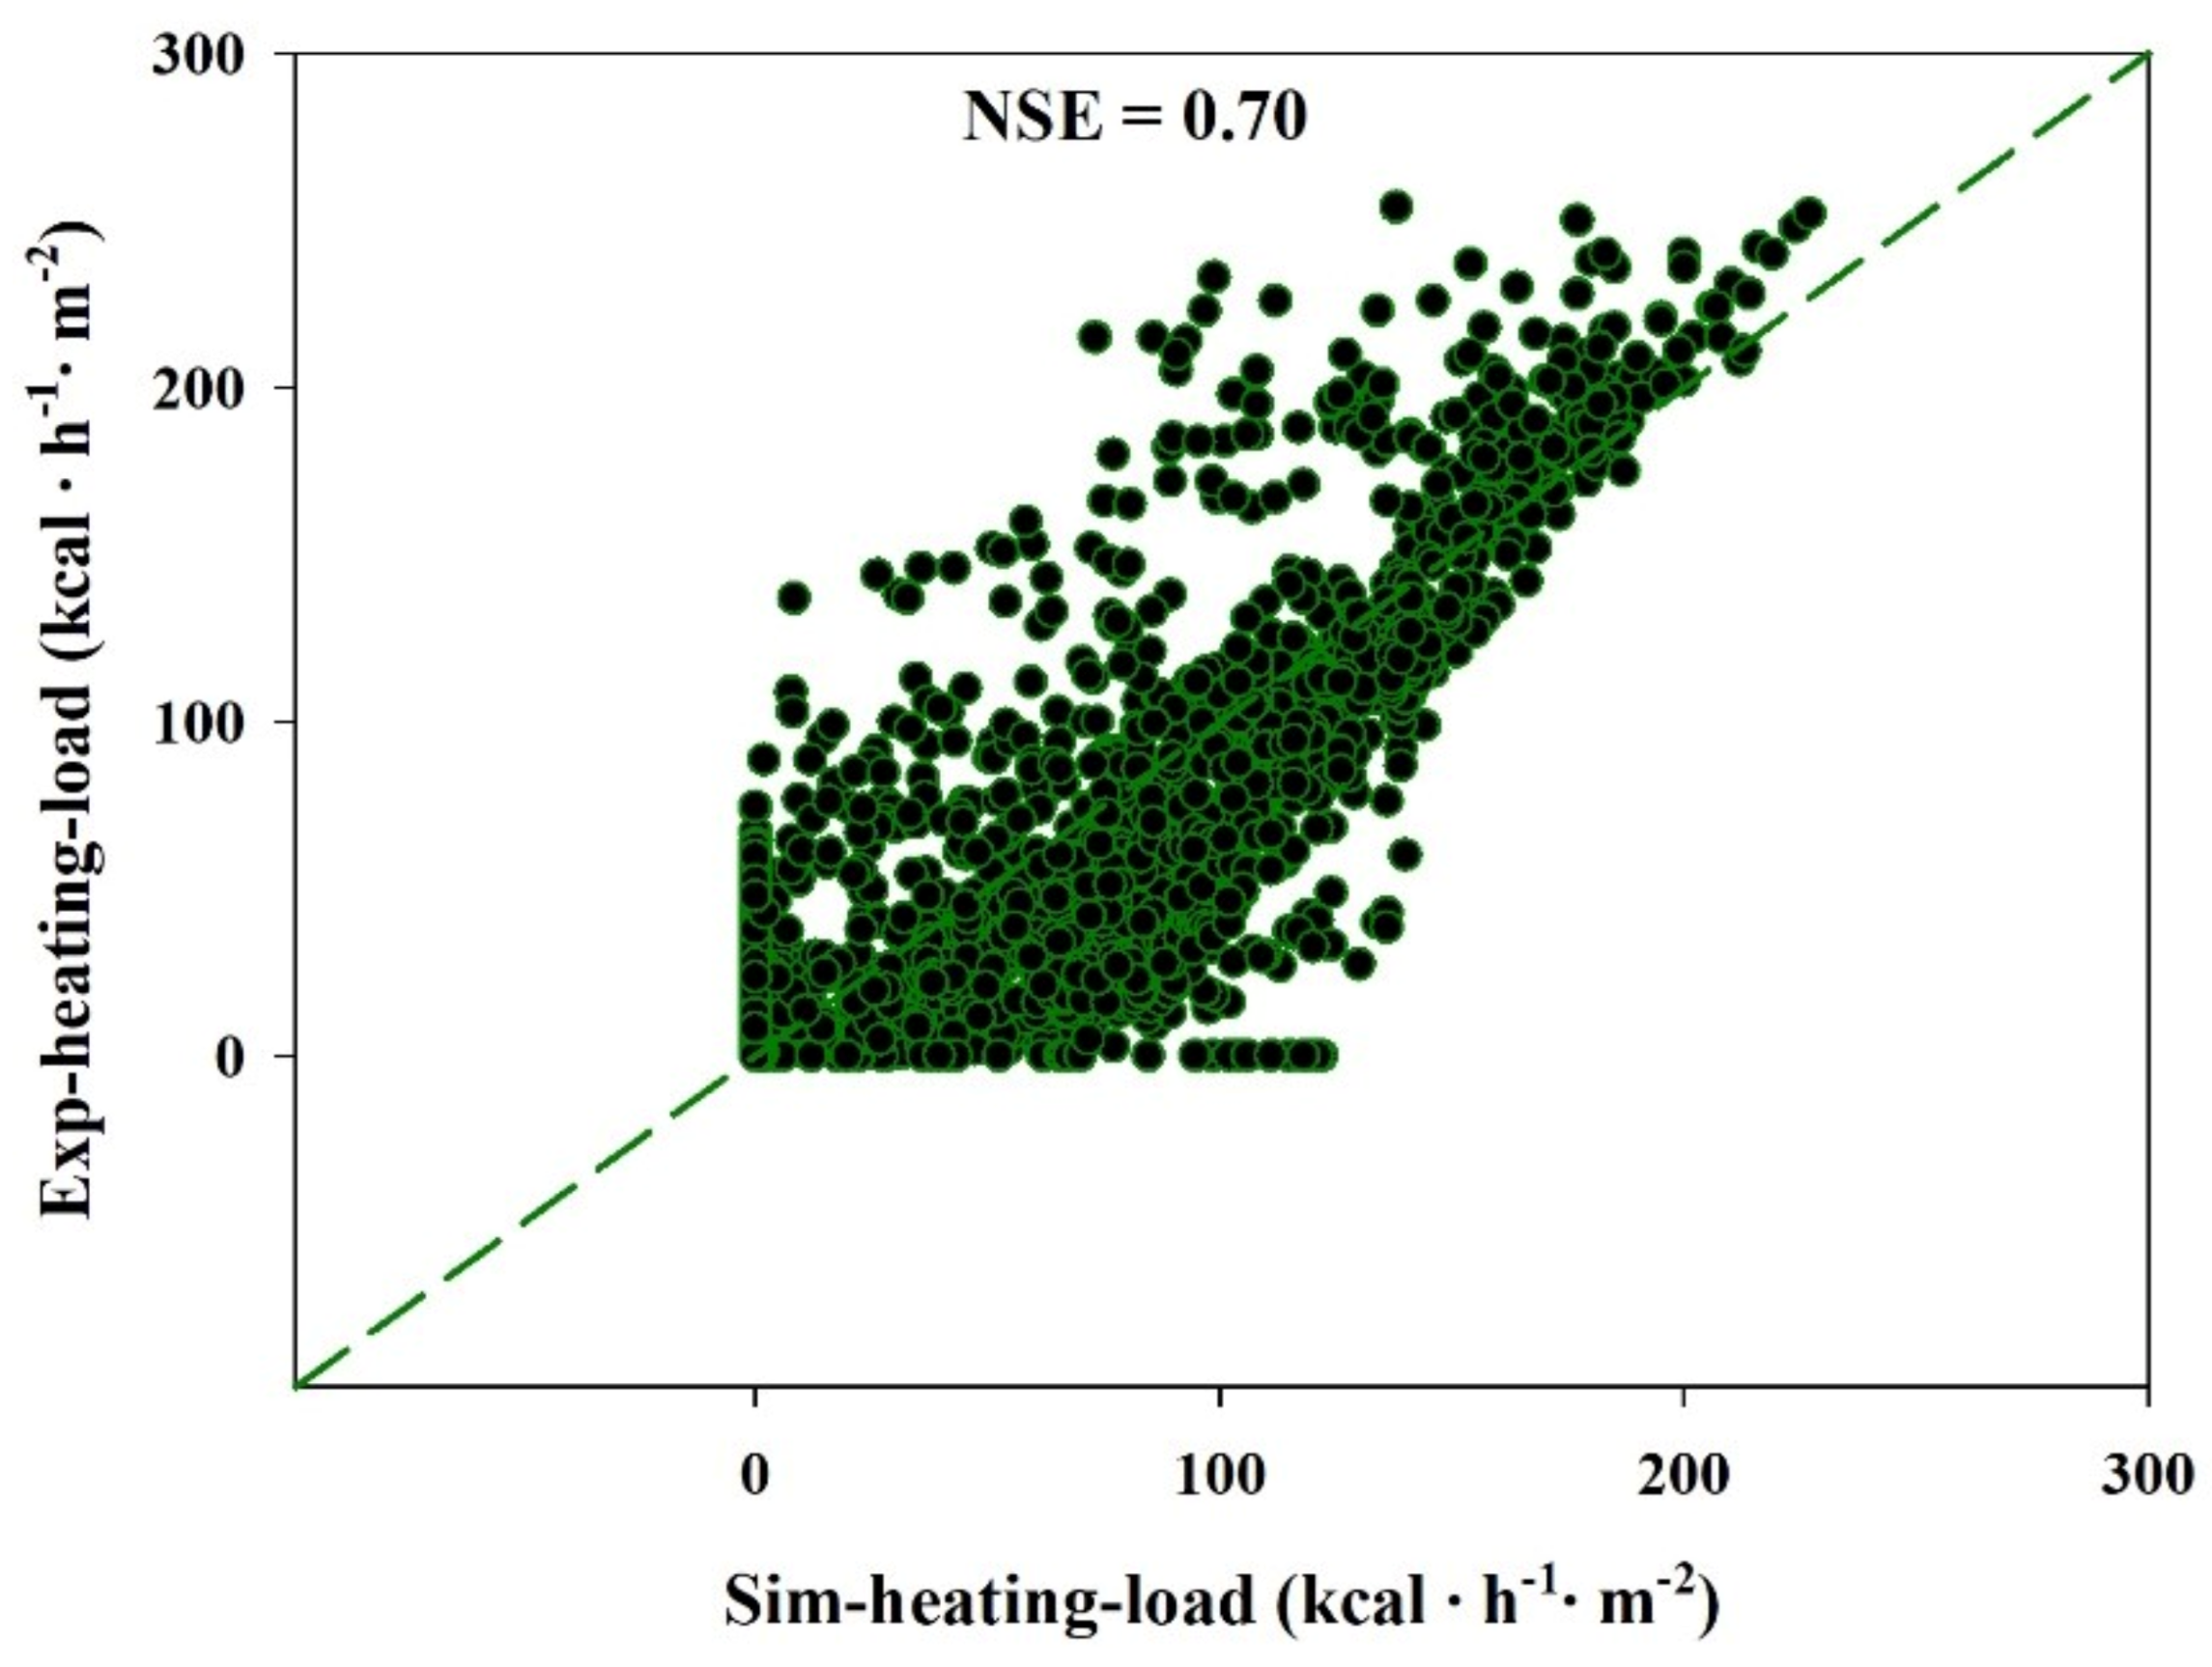
- The validation results of the energy supplied from the water storage tank to the greenhouse showed an RMSE value of 20 Kcal·h−1·m−2 and an NSE value of 0.70.
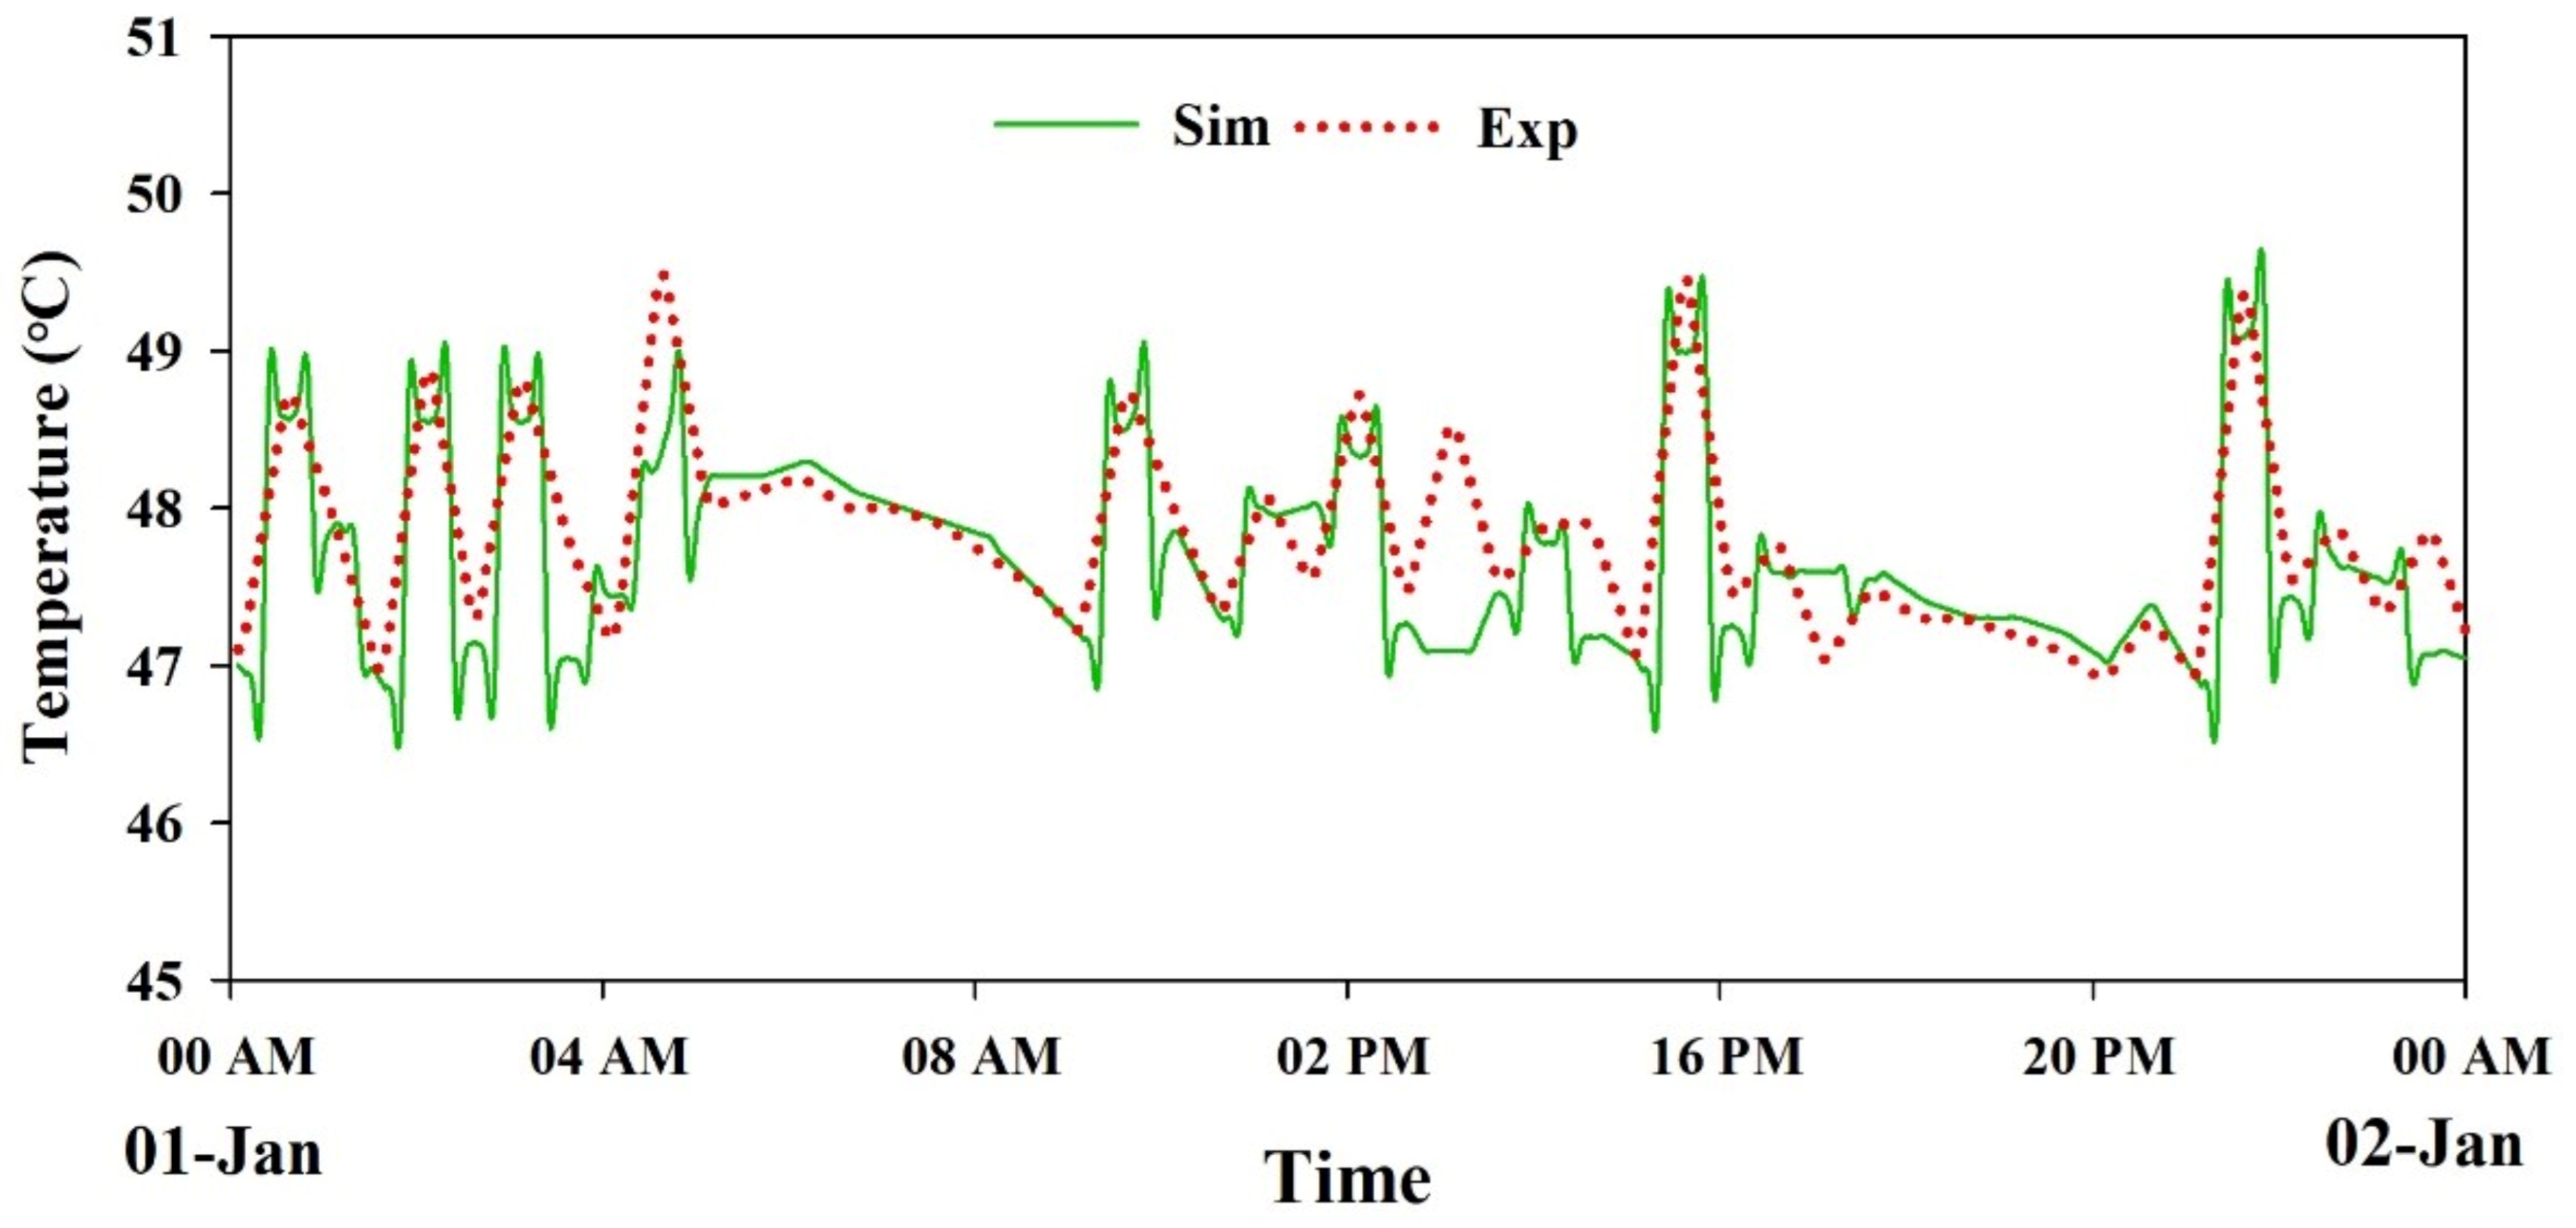
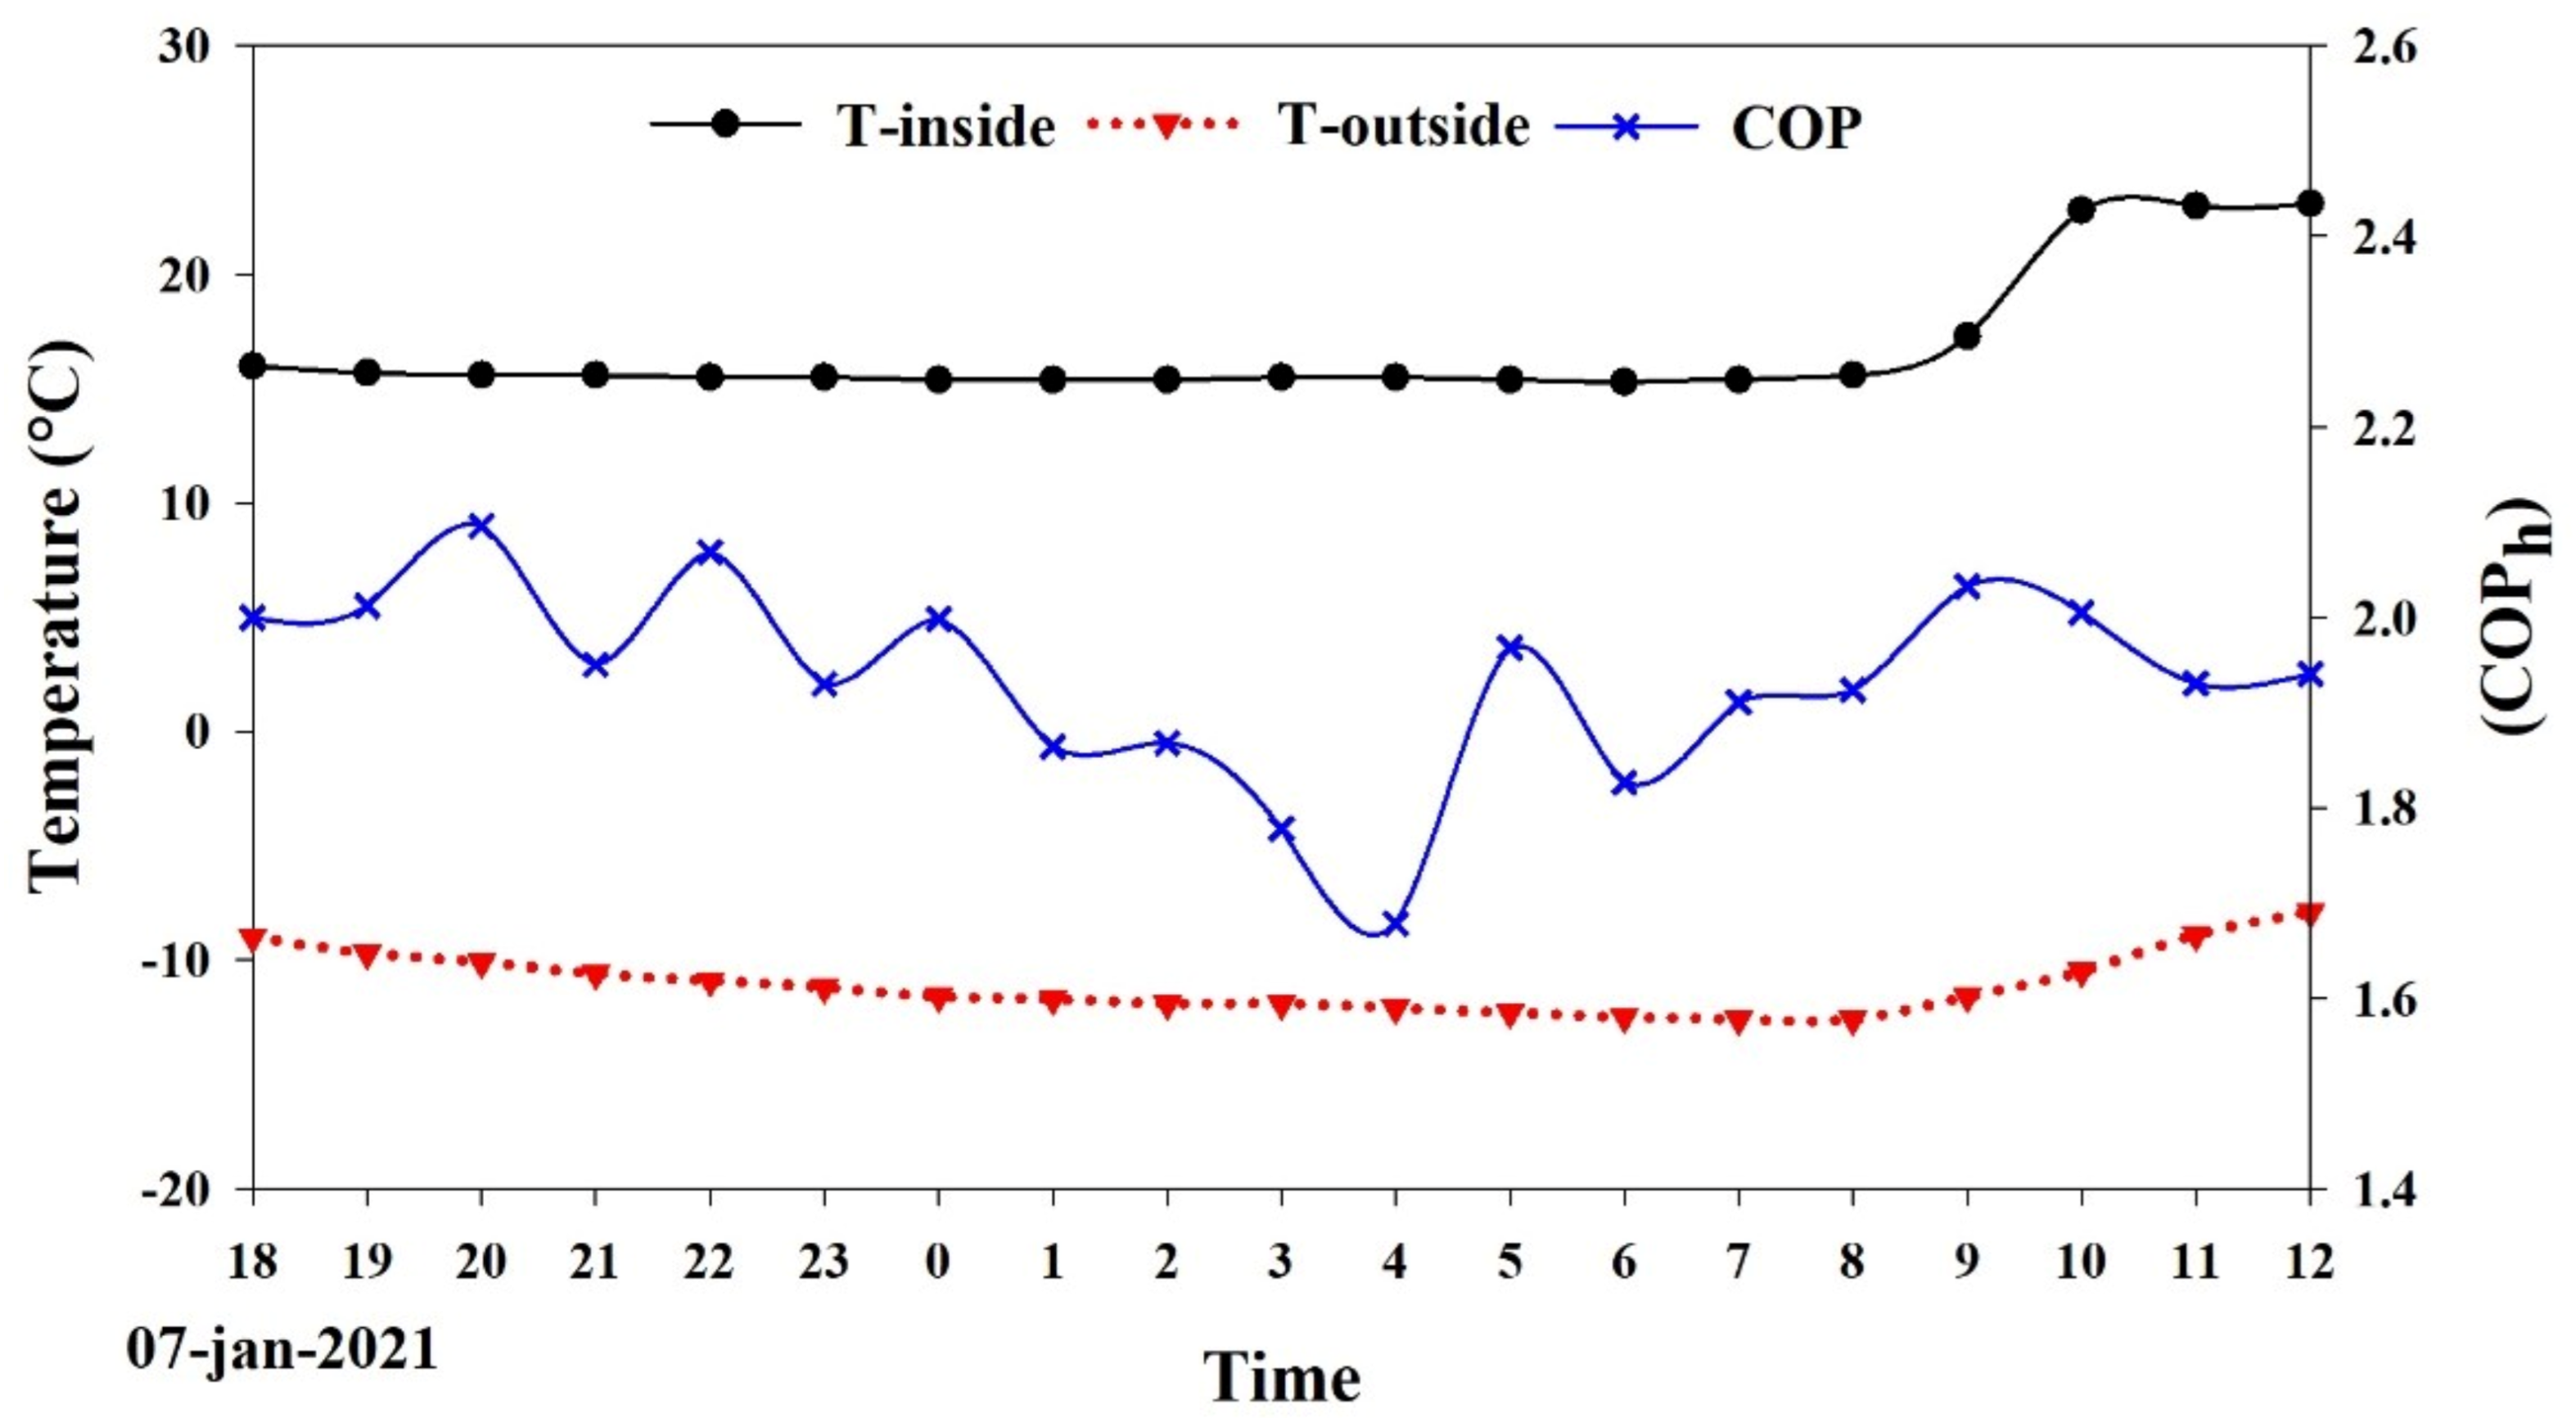
- The heat pump output water temperature validation results showed an RMSE of 0.4 °C, and the COP of the heat pump was 2.2.
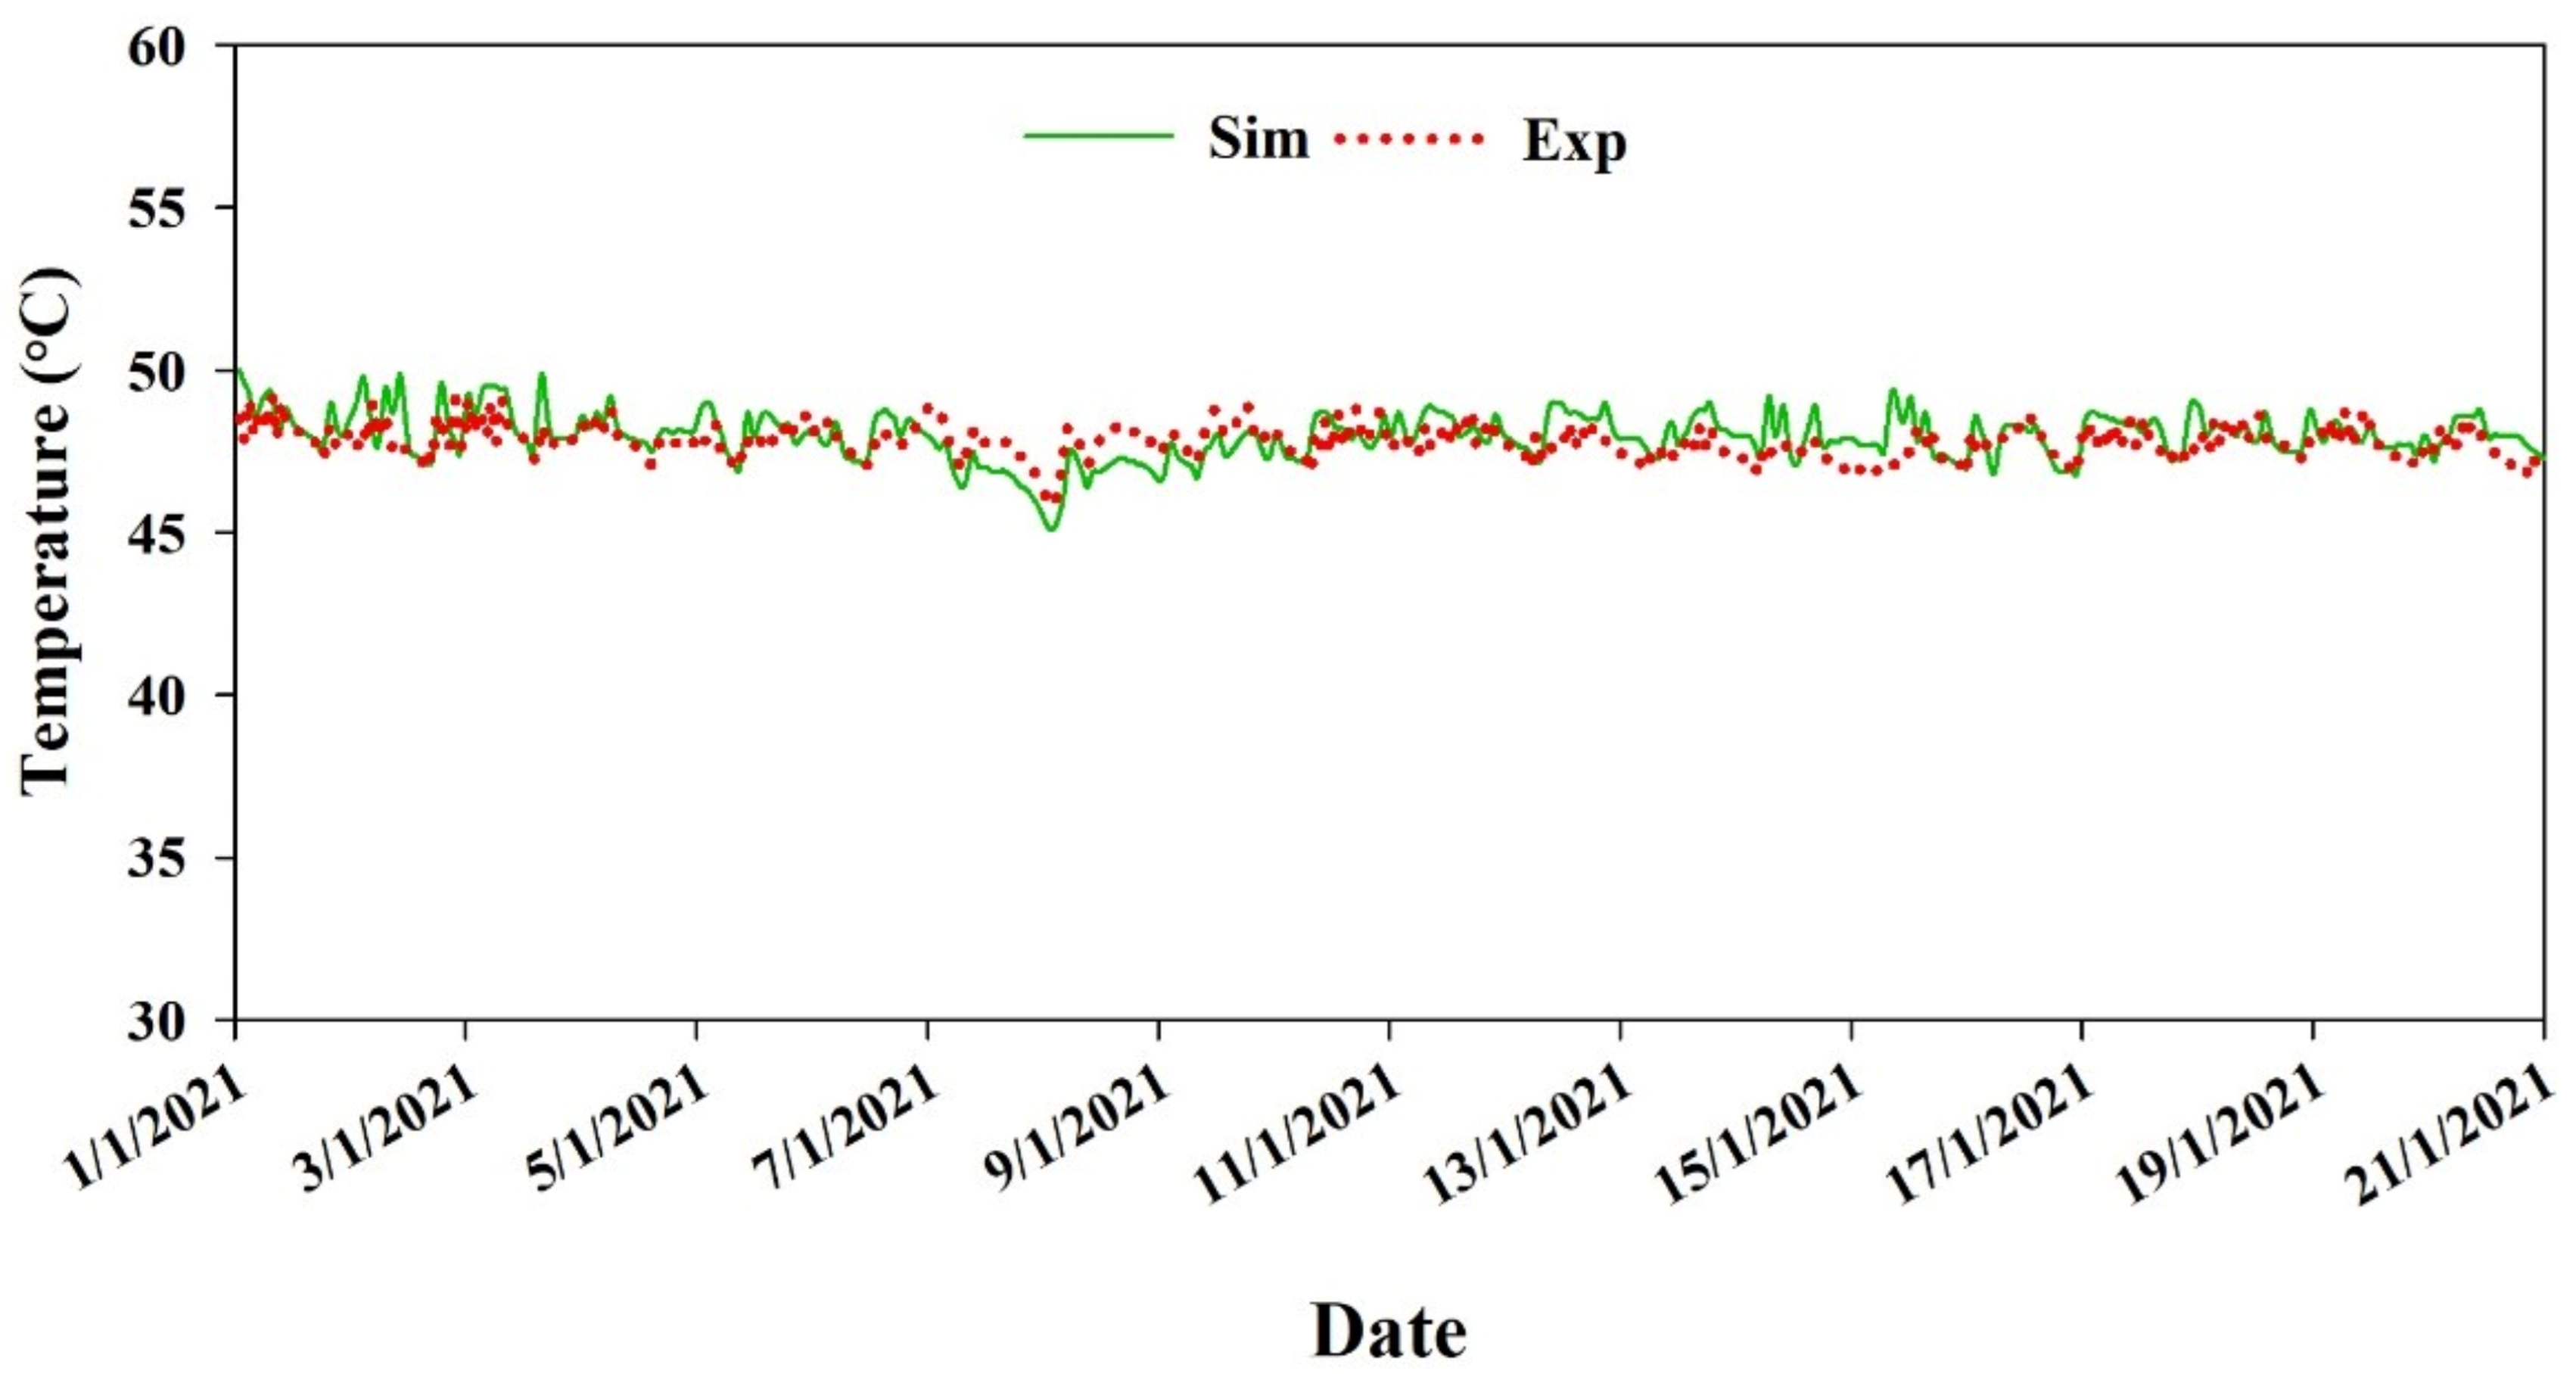
- The validation results for the water storage tank temperature show an RMSE value of 0.5 °C.
- The maximum heating energy demand for the studied greenhouse was found to be 250 kcal·h−1·m−2.
Author Contributions
Funding
Institutional Review Board Statement
Informed Consent Statement
Data Availability Statement
Conflicts of Interest
Appendix A

| 25 | 30 | 35 | 40 | 45 | 50 | T_water_in |
|---|---|---|---|---|---|---|
| 2.2 | 7.2 | 12.2 | 15 | 20 | T_air_in | |
| 0.759 | 0.787 | !Fraction capacity and power at T_air = 2.2 | deg. C and T_water_in = 25 | |||
| 1.08 | 0.868 | !Fraction capacity and power at T_air = 7.2 | deg. C and T_water_in = 25 | |||
| 1.137 | 0.843 | !Fraction capacity and power at T_air = 12.2 | deg. C and T_water_in = 25 | |||
| 1.233 | 0.843 | !Fraction capacity and power at T_air = 15 | deg. C and T_water_in = 25 | |||
| 1.403 | 0.844 | !Fraction capacity and power at T_air = 20 | deg. C and T_water_in = 25 | |||
| 0.737 | 0.86 | !Fraction capacity and power at T_air = 2.2 | deg. C and T_water_in = 30 | |||
| 1.048 | 0.938 | !Fraction capacity and power at T_air = 7.2 | deg. C and T_water_in = 30 | |||
| 1.106 | 0.923 | !Fraction capacity and power at T_air = 12.2 | deg. C and T_water_in = 30 | |||
| 1.199 | 0.924 | !Fraction capacity and power at T_air = 15 | deg. C and T_water_in = 30 | |||
| 1.359 | 0.924 | !Fraction capacity and power at T_air = 20 | deg. C and T_water_in = 30 | |||
| 0.714 | 0.944 | !Fraction capacity and power at T_air = 2.2 | deg. C and T_water_in = 35 | |||
| 1.017 | 1.044 | !Fraction capacity and power at T_air = 7.2 | deg. C and T_water_in = 35 | |||
| 1.075 | 1.016 | !Fraction capacity and power at T_air = 12.2 | deg. C and T_water_in = 35 | |||
| 1.165 | 1.017 | !Fraction capacity and power at T_air = 15 | deg. C and T_water_in = 35 | |||
| 1.314 | 1.018 | !Fraction capacity and power at T_air = 20 | deg. C and T_water_in = 35 | |||
| 0.692 | 1.027 | !Fraction capacity and power at T_air = 2.2 | deg. C and T_water_in = 40 | |||
| 0.986 | 1.136 | !Fraction capacity and power at T_air = 7.2 | deg. C and T_water_in = 40 | |||
| 1.043 | 1.108 | !Fraction capacity and power at T_air = 12.2 | deg. C and T_water_in = 40 | |||
| 1.131 | 1.109 | !Fraction capacity and power at T_air = 15 | deg. C and T_water_in = 40 | |||
| 1.269 | 1.112 | !Fraction capacity and power at T_air = 20 | deg. C and T_water_in = 40 | |||
| 0.67 | 1.132 | !Fraction capacity and power at T_air = 2.2 | deg. C and T_water_in = 45 | |||
| 0.955 | 1.255 | !Fraction capacity and power at T_air = 7.2 | deg. C and T_water_in = 45 | |||
| 1.012 | 1.224 | !Fraction capacity and power at T_air = 12.2 | deg. C and T_water_in = 45 | |||
| 1.097 | 1.226 | !Fraction capacity and power at T_air = 15 | deg. C and T_water_in = 45 | |||
| 1.224 | 1.229 | !Fraction capacity and power at T_air = 20 | deg. C and T_water_in = 45 | |||
| 0.648 | 1.249 | !Fraction capacity and power at T_air = 2.2 | deg. C and T_water_in = 50 | |||
| 0.923 | 1.385 | !Fraction capacity and power at T_air = 7.2 | deg. C and T_water_in = 50 | |||
| 0.981 | 1.352 | !Fraction capacity and power at T_air = 12.2 | deg. C and T_water_in = 50 | |||
| 1.062 | 1.355 | !Fraction capacity and power at T_air = 15 | deg. C and T_water_in = 50 | |||
| 1.18 | 1.359 | !Fraction capacity and power at T_air = 20 | deg. C and T_water_in = 50 | |||
| Hot Water Outlet Temperature | Ambient Temperature °C | |||||||||||||
|---|---|---|---|---|---|---|---|---|---|---|---|---|---|---|
| −10 | −6 | −2 | 2 | 7 | 10 | 13 | ||||||||
| Capacity | Power | Capacity | Power | Capacity | Power | Capacity | Power | Capacity | Power | Capacity | Power | Capacity | Power | |
| °C | kW | kW | kW | kW | kW | kW | kW | kW | kW | kW | kW | kW | kW | kW |
| 40 | 43.51 | 13.70 | 54.39 | 15.57 | 63.98 | 17.30 | 71.09 | 18.81 | 77.28 | 19.80 | 86.55 | 20.98 | 99.53 | 22.66 |
| 41 | 42.05 | 13.98 | 52.63 | 15.89 | 61.98 | 17.65 | 68.95 | 19.19 | 75.03 | 20.20 | 83.88 | 21.41 | 96.29 | 23.12 |
| 42 | 40.83 | 14.27 | 51.17 | 16.21 | 60.34 | 18.01 | 67.19 | 19.58 | 73.20 | 20.61 | 81.69 | 21.85 | 93.61 | 23.60 |
| 43 | 39.85 | 14.56 | 50.0 | 16.54 | 59.03 | 18.38 | 65.80 | 19.98 | 71.76 | 21.03 | 79.94 | 22.29 | 91.45 | 24.08 |
| 44 | 39.08 | 14.86 | 49.09 | 16.88 | 58.03 | 18.76 | 64.76 | 20.39 | 70.70 | 21.46 | 78.62 | 22.75 | 89.78 | 24.57 |
| 45 | 38.51 | 15.16 | 48.44 | 17.23 | 57.32 | 19.14 | 64.05 | 20.81 | 70.00 | 21.90 | 77.70 | 23.21 | 88.58 | 25.07 |
| 46 | 37.76 | 15.31 | 47.55 | 17.40 | 56.34 | 19.33 | 63.02 | 21.01 | 68.95 | 22.12 | 76.40 | 23.45 | 86.94 | 25.32 |
| 47 | 36.64 | 15.62 | 46.20 | 17.75 | 54.81 | 19.72 | 31.38 | 21.43 | 67.23 | 22.56 | 74.35 | 23.92 | 84.46 | 25.83 |
| 48 | 35.19 | 16.09 | 44.44 | 18.28 | 52.77 | 20.31 | 59.16 | 22.08 | 64.87 | 23.24 | 71.62 | 24.63 | 81.22 | 26.60 |
| 49 | 33.28 | 16.73 | 42.07 | 19.01 | 50.02 | 21.12 | 56.14 | 22.96 | 61.63 | 24.17 | 67.92 | 25.62 | 76.88 | 27.67 |
| 50 | 31.14 | 17.57 | 39.41 | 19.96 | 46.92 | 22.18 | 52.72 | 24.11 | 57.93 | 25.38 | 63.73 | 26.90 | 72.01 | 29.05 |
References
- Rasheed, A.; Lee, J.; Lee, H. Development and optimization of a building energy simulation model to study the effect of greenhouse design parameters. Energies 2018, 11, 2001. [Google Scholar] [CrossRef] [Green Version]
- Bartzanas, T.; Tchamitchian, M.; Kittas, C. Influence of the heating method on greenhouse microclimate and energy consumption. Biosyst. Eng. 2005, 91, 487–499. [Google Scholar] [CrossRef]
- Yang, S.H.; Lee, C.G.; Lee, W.K.; Ashtiani, A.A.; Kim, J.Y.; Lee, S.D.; Rhee, J.Y. Heating and cooling system for utilization of surplus air thermal energy in greenhouse and its control logic. J. Biosyst. Eng. 2012, 37, 19–27. [Google Scholar] [CrossRef]
- Lee, J.-Y. Current status of ground source heat pumps in korea. J. Renew. Sustain. Energy Rev. 2009, 13, 1560–1568. [Google Scholar] [CrossRef]
- Dongellini, M.; Morini, G.L. On-off cycling losses of reversible air-to-water heat pump systems as a function of the unit power modulation capacity. Energy Convers. Manag. 2019, 196, 966–978. [Google Scholar] [CrossRef]
- Zhang, Q.; Zhang, L.; Nie, J.; Li, Y. Techno-economic analysis of air source heat pump applied for space heating in northern china. Appl. Energy 2017, 207, 533–542. [Google Scholar] [CrossRef]
- Carlini, M.; Monarca, D.; Biondi, P.; Honorati, T.; Castellucci, S. A simulation model for the exploitation of geothermal energy for a greenhouse in the viterbo province. In Work Safety and Risk Prevention in Agro-Food and Forest Systems, Proceedings of the International Conference Ragusa SHWA2010, Ragusa Ibla, Italy, 16–18 September 2010; ElleDue Editore: Ragusa Ibla, Italy, 2010; pp. 16–18. [Google Scholar]
- Kozai, T. Thermal performance of an oil engine driven heat pump for greenhouse heating. J. Agric. Eng. Res. 1986, 35, 25–37. [Google Scholar] [CrossRef]
- Tong, Y.; Kozai, T.; Nishioka, N.; Ohyama, K. Greenhouse heating using heat pumps with a high coefficient of performance (cop). Biosyst. Eng. 2010, 106, 405–411. [Google Scholar] [CrossRef]
- Chargui, R.; Sammouda, H.; Farhat, A. Geothermal heat pump in heating mode: Modeling and simulation on trnsys. Int. J. Refrig 2012, 35, 1824–1832. [Google Scholar] [CrossRef]
- Rasheed, A.; Lee, J.W.; Lee, H.W. A review of greenhouse energy management by using building energy simulation. Prot. Hortic. Plant. Fact. 2015, 24, 317–325. [Google Scholar] [CrossRef]
- Benli, H.; Durmuş, A. Evaluation of ground-source heat pump combined latent heat storage system performance in greenhouse heating. Energy Build. 2009, 41, 220–228. [Google Scholar] [CrossRef]
- Yang, S.-H.; Lee, S.-D.; Kim, Y.J.R. Greenhouse heating and cooling with a heat pump system using surplus air and underground water thermal energy. Eng. Agric. Environ. Food 2013, 6, 86–91. [Google Scholar] [CrossRef]
- Kim, M.-H.; Lee, D.-W.; Yun, R.; Heo, J. Operational energy saving potential of thermal effluent source heat pump system for greenhouse heating in jeju. Int. J. Air Cond. Refrig. 2017, 25, 01–12. [Google Scholar] [CrossRef]
- Yildirim, N.; Bilir, L. Evaluation of a hybrid system for a nearly zero energy greenhouse. Energy Convers. Manag. 2017, 148, 1278–1290. [Google Scholar] [CrossRef]
- Boughanmi, H.; Lazaar, M.; Guizani, A. A performance of a heat pump system connected a new conic helicoidal geothermal heat exchanger for a greenhouse heating in the north of tunisia. Sol. Energy 2018, 171, 343–353. [Google Scholar] [CrossRef]
- Hassanien, R.H.E.; Li, M.; Tang, Y. The evacuated tube solar collector assisted heat pump for heating greenhouses. Energy Build. 2018, 169, 305–318. [Google Scholar] [CrossRef]
- Ozgener, O.; Hepbasli, A. Experimental investigation of the performance of a solar-assisted ground-source heat pump system for greenhouse heating. Int. J. Energy Res. 2005, 29, 217–231. [Google Scholar] [CrossRef]
- Ozgener, O.; Hepbasli, A. Experimental performance analysis of a solar assisted ground-source heat pump greenhouse heating system. Energy Build. 2005, 37, 101–110. [Google Scholar] [CrossRef]
- Ozgener, O.; Hepbasli, A. A parametrical study on the energetic and exergetic assessment of a solar-assisted vertical ground-source heat pump system used for heating a greenhouse. Build. Environ. 2007, 42, 11–24. [Google Scholar] [CrossRef]
- Ozgener, O. Use of solar assisted geothermal heat pump and small wind turbine systems for heating agricultural and residential buildings. J. Energy 2010, 35, 262–268. [Google Scholar] [CrossRef]
- Aye, L.; Fuller, R.J.; Canal, A. Evaluation of a heat pump system for greenhouse heating. Int. J. Therm. Sci. 2010, 49, 202–208. [Google Scholar] [CrossRef] [Green Version]
- Le, K.; Shah, N.; Huang, M.; Hewitt, N. High temperature air-water heat pump and energy storage: Validation of trnsys models. In Proceedings of the World Congress on Engineering and Computer Science WCECS 2017, San Francisco, CA, USA, 25–27 October 2017; Volume II. [Google Scholar]
- Moon, J.; Kwon, J.; Kim, S.; Kang, Y.; Park, S.; Lee, J. Effect on yield increase and energy saving in partial heating for high-bed strawberries by using an air to water heat pump. In Proceedings of the 2019 ASABE Annual International Meeting, Boston, MA, USA, 7–10 July 2019; American Society of Agricultural and Biological Engineers: Boston, MA, USA, 2019; p. 1. [Google Scholar]
- Lim, T.; Baik, Y.-K.; Kim, D.D. Heating performance analysis of an air-to-water heat pump using underground air for greenhouse farming. Energies 2020, 13, 3863. [Google Scholar] [CrossRef]
- Nemś, A.; Nemś, M.; Świder, K. Analysis of the possibilities of using a heat pump for greenhouse heating in polish climatic conditions—A case study. Sustainability 2018, 10, 3483. [Google Scholar] [CrossRef]
- Klein, S.A. Trnsys, a transient system simulation program. In Solar Energy Laborataory; University of Wisconsin: Madison, WI, USA, 2012. [Google Scholar]
- Casetta, D. Implementation and Validation of a Ground Source Heat Pump Model in Matlab. Master’s Thesis, Chalmers University of Technology, Gothenburg, Sweden, 2012. [Google Scholar]
- Rasheed, A.; Na, W.H.; Lee, J.W.; Kim, H.T.; Lee, H.W. Optimization of greenhouse thermal screens for maximized energy conservation. Energies 2019, 12, 3592. [Google Scholar] [CrossRef] [Green Version]
- Rasheed, A.; Kwak, C.S.; Na, W.H.; Lee, J.W.; Kim, H.T.; Lee, H.W. Development of a building energy simulation model for control of multi-span greenhouse microclimate. Energies 2020, 10, 1236. [Google Scholar] [CrossRef]
- Lee, S.-N.; Park, S.-J.; Lee, I.-B.; Ha, T.-H.; Kwon, K.-S.; Kim, R.-W.; Yeo, U.-H.; Lee, S.-Y. Design of energy model of greenhouse including plant and estimation of heating and cooling loads for a multi-span plastic-film greenhouse by building energy simulation. Prot. Hortic. Plant. Fact. 2016, 25, 123–132. [Google Scholar] [CrossRef]
- Seo, I.-H.; Lee, I.-B.; Kwon, K.-S.; Park, S.-J.J.A.H. Bes computation for periodical energy load of greenhouse with geothermal heating system. Acta Hortic 2014, 1037, 113–118. [Google Scholar]
- Ahamed, M.S.; Guo, H.; Tanino, K. Modeling heating demands in a chinese-style solar greenhouse using the transient building energy simulation model trnsys. J. Build. Eng. 2020, 29, 101114. [Google Scholar] [CrossRef]
- Baglivo, C.; Mazzeo, D.; Panico, S.; Bonuso, S.; Matera, N.; Congedo, P.M.; Oliveti, G. Complete greenhouse dynamic simulation tool to assess the crop thermal well-being and energy needs. Appl. Therm. Eng. 2020, 179, 115698. [Google Scholar] [CrossRef]
- Ritter, A.; Munoz-Carpena, R. Performance evaluation of hydrological models: Statistical significance for reducing subjectivity in goodness-of-fit assessments. J. Hydrol. 2013, 480, 33–45. [Google Scholar] [CrossRef]


| Weather Parameter | Unit | Time Interval | Sensor | Accuracy of Sensors |
|---|---|---|---|---|
| Air temperature | ℃ | 10 min | MTV Active, Ridder | ±1% |
| Relative humidity | % | 10 min | MTV Active, Ridder | ±2% |
| Solar radiation | W·m−2 | 10 min | SR05-D2A2-TMBL, Hukseflux | IEC 61724-1:2017 standard, Class C, Basic |
| Wind speed | m·s−1 | 10 min | Clima Sensor US, Thies Clima | ±5% |
| Wind direction | degrees | 10 min | Clima Sensor US, Thies Clima | ±5% of measured value |
| Water temperature | ℃ | 10 min | HortiMax Omni, Ridder | ±0.5% |
| Water flow rate | Liter | 10 min | FS-WLH 40, FLSTRONIC | ±1% of measured value |
| Ambient pressure | hPa | 10 min | PTB-220TS, VAISALA | ±5% hPa |
| Component | Properties | Specification |
|---|---|---|
| Heat pump | Model | PSET-C60W (MIDEA) |
| Heating capacity | 70 kW | |
| Power consumption | 21.9 | |
| Voltage | 380 V–415 V, 3-phase, 60 Hz | |
| Refrigerant | R-410a | |
| Heat storage tank | Heat storage fluid | Water |
| Capacity | 50 m3 | |
| Water circulation pump | Model | Wilo TOP-S 40/7 |
| Max. fluid temperature | 130 °C | |
| Max. fluid temperature | −20 °C | |
| Power consumption | 390 W | |
| Fan coil unit | Model | IN-FCG0016-L |
| Heating capacity | 27,000 W | |
| Airflow rate | 83 m3·m−1 |
| Component | Type | Description |
|---|---|---|
| Data reader | 9 | Reads the user-defined weather data file |
| Solar radiation processor | 16 | Uses total direct solar radiation on the horizontal surface as an input and calculates the total, beam, reflected, and diffuse radiation on all greenhouse tilt surfaces |
| Sky temperature calculator | 69 | Input: dewpoint temperature, beam, and diffuse radiation on horizontal surface to calculate sky temperature |
| Psychrometric chart | 33 | Calculates dewpoint temperature using dry bulk temperature and humidity ratio |
| Equation editor | Inserts equation in the model | |
| Greenhouse building model | 56-TRNFlow | Uses TRNBuild and processes the thermal behavior of the greenhouse along with the natural ventilation |
| Air-to-water heat pump (AWHP) | 941 | This model is based on user-supplied data files containing catalog data for water capacity and power. It takes air-relative humidity and outside temperature as an input |
| Water storage tank | 4 | Water storage tank |
| Pipe | 709 | Models the fluid flow into the pipe; calculates the heat loss from the pipe |
| Fan coil unit | 928 | Takes hot water as an input and provides hot air to the greenhouse for temperature control |
| Pump | 3 | Variable-speed water circulation pump |
| Pump | 114 | Constant-speed water circulation pump |
| Valve | 649 | Water-mixing valve, which combines different liquid streams into a single output mass flow. Combines the output water of three heat pumps and delivers water to the storage tank |
| Thermostat | 108 | A five-stage thermostat for the on/off control function. Controls the circulation pump and fan coil unit for the greenhouse’s internal temperature setpoint |
| Controller | 165 | Controls the natural ventilation of the greenhouse |
| Monthly forcing function | 518 | Inputs schedules and screen opening and closing times that change monthly |
| Printer | 25 | Prints results on user-provided external files |
| Plotter | 65 | This type was used to plot the results. |
| Cover Characteristics | Covering | Screens | ||
|---|---|---|---|---|
| HG | PC | PH_66 | Luxous | |
| Solar transmittance front | 0.89 | 0.78 | 0.38 | 0.58 |
| Solar transmittance back | 0.89 | 0.78 | 0.38 | 0.57 |
| Solar reflectance front | 0.08 | 0.14 | 0.50 | 0.30 |
| Solar reflectance back | 0.08 | 0.14 | 0.48 | 0.25 |
| Visible radiation transmittance front | 0.91 | 0.75 | 0.38 | 0.58 |
| Visible radiation transmittance back | 0.91 | 0.75 | 0.38 | 0.57 |
| Visible radiation reflectance front | 0.08 | 0.15 | 0.50 | 0.30 |
| Visible radiation reflectance back | 0.08 | 0.15 | 0.48 | 0.25 |
| Thermal radiation transmittance | 0.1 | 0.02 | 0.35 | 0.26 |
| Thermal radiation emission front | 0.90 | 0.89 | 0.48 | 0.45 |
| Thermal radiation emission back | 0.90 | 0.89 | 0.55 | 0.42 |
| Conductivity (W·m−1·K−1) | 0.1 | 0.19 | 0.06 | 0.05 |
| Air permeability (m2) | — | — | 1.49 × 10⁻¹¹ | 1.33 × 10⁻¹¹ |
| Thickness (mm) | 4 | 16 | 0.24 | 0.25 |
| Material | Thickness (m) | Thermal Conductivity (kJ·h−1·m−1·K−1) | Thermal Capacity (kJ·kg−1·K−1) | Density (kJ·m−3) | Convective Heat Transfer Coefficient (kJ·h−1·m−2·K−1) | |
|---|---|---|---|---|---|---|
| Front | Back | |||||
| Steel | 0.04 | 54 | 1.8 | 7800 | 11 | 64 |
| Ground | 0.100 | 0.97 | 0.75 | 2900 | 11 | 0.001 |
| Parameter | Operating Condition |
|---|---|
| Greenhouse type | Multi-span |
| Roof type | Venlo |
| No. of spans | 3 |
| Roof glazing | HG, 4 mm |
| Side glazing | PC, 16 mm |
| GH portion dividing glazing | HG, 4 mm |
| Orientation | North–South |
| Dimension | 20.6 m × 16.3 m × 7.6 m |
| Floor area | 391.2 m2 |
| Volume | 2362.8 m3 |
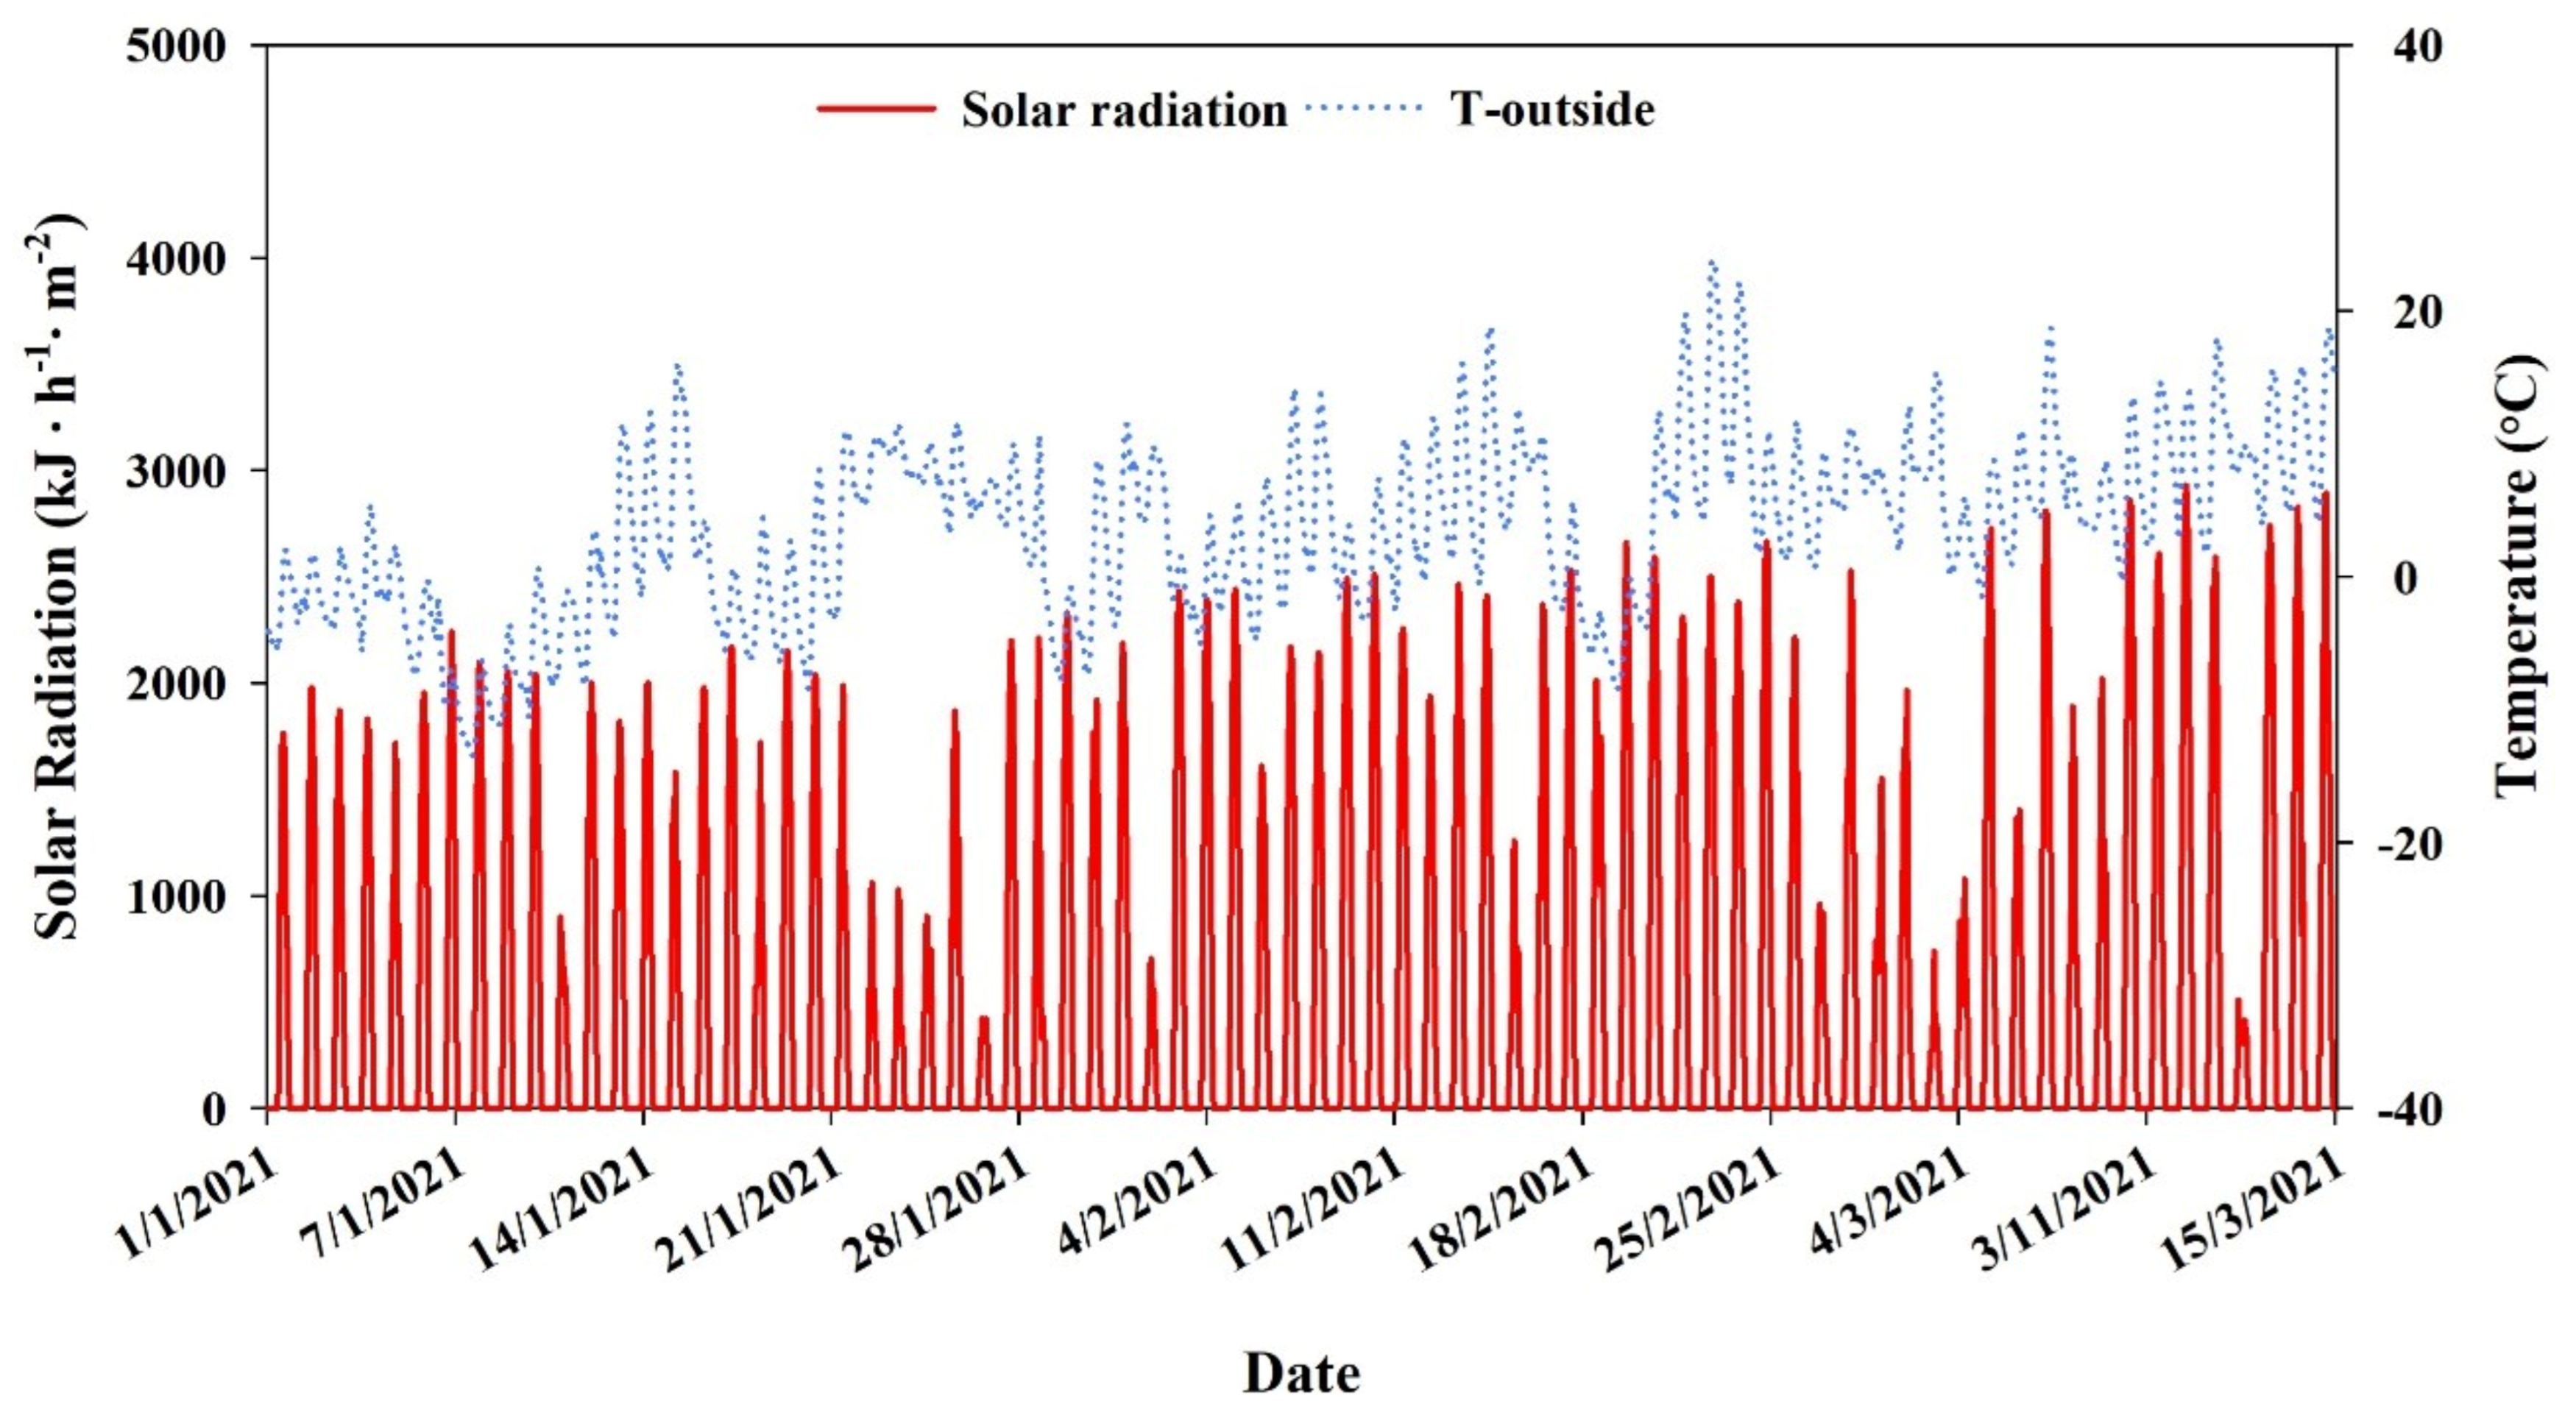
| Period | 1 January 2021 to 28 February 2021 |
| Natural ventilation | roof vents |
| Natural vents control set point temp | 26 °C |
| Energy screen position | Roof only |
| Energy screens (1 and 2) | PH-66, Luxous |
| Thermal screens’ control | Ph-66 retract (After sunrise, OR S.R 100 W) Ph-66 Deploy (After sunset, AND S.R 100 W) Luxous_1 retract (After sunrise, OR S.R 150 W) Luxous_1 deploy (After sunset, AND S.R 150 W) |
| Heating setpoints, GH portion (1, 2, 3) | 16, 18, and 17 ℃ |
| Lowest Outside Air Temp (℃) | Greenhouse Setpoint Temp (℃) | Greenhouse Heating Area (m2) | Max. Heating Load (kcal·h−1) | Max. Heating Load per Unit Area (kcal·h−1·m−2) |
|---|---|---|---|---|
| −13 | 18 | 391.2 | 97,800 | 250 |
Publisher’s Note: MDPI stays neutral with regard to jurisdictional claims in published maps and institutional affiliations. |
© 2021 by the authors. Licensee MDPI, Basel, Switzerland. This article is an open access article distributed under the terms and conditions of the Creative Commons Attribution (CC BY) license (https://creativecommons.org/licenses/by/4.0/).
Share and Cite
Rasheed, A.; Na, W.H.; Lee, J.W.; Kim, H.T.; Lee, H.W. Development and Validation of Air-to-Water Heat Pump Model for Greenhouse Heating. Energies 2021, 14, 4714. https://doi.org/10.3390/en14154714
Rasheed A, Na WH, Lee JW, Kim HT, Lee HW. Development and Validation of Air-to-Water Heat Pump Model for Greenhouse Heating. Energies. 2021; 14(15):4714. https://doi.org/10.3390/en14154714
Chicago/Turabian StyleRasheed, Adnan, Wook Ho Na, Jong Won Lee, Hyeon Tae Kim, and Hyun Woo Lee. 2021. "Development and Validation of Air-to-Water Heat Pump Model for Greenhouse Heating" Energies 14, no. 15: 4714. https://doi.org/10.3390/en14154714