1. Introduction
As it is detailed in the Offshore Renewable Energy Strategy released by the European Commission in November 2020 [
1], the European Union (EU) is raising its climate targets for 2030 and is committed to becoming climate-neutral by 2050. To achieve this, the EU is setting ambitious targets, including the generation of more energy at sea and from the sea. The goals for 2030 include an EU offshore wind energy capacity of 60 GW and an ocean energy capacity (including wave and tidal energy) of 1 GW. The targets are even more ambitious for 2050, where the aim is at installing 300 GW of offshore wind and 40 GW of wave and tidal energy.
The European strategic energy technology plan (SET-Plan) declaration of intent for ocean energy [
2] has also set ambitious economic targets for wave and tidal energy technologies. Wave energy technologies are expected to reach a levelised cost of energy (LCoE) of 200 EUR/MWh in 2025, of 150 EUR/MWh in 2030 and of 100 EUR/MWh in 2035 (export infrastructure costs or the costs for delivering the electricity to onshore substations are taken into account within the LCoE). These numbers show that the economic and market potential of wave energy in Europe is large and reaching the SET-Plan target numbers is an ambitious goal.
When a new type of wave energy converter starts its development path (the point in time when the initial idea or its working principle is conceived), it is a challenge to estimate its potential economic value when reaching the commercialisation stage. It is also commonly agreed that the primary metric for judging the economic potential of energy technologies is the LCoE. However, it is also commonly agreed that estimates of the LCoE for wave energy technologies are affected by the lack of a dominating technology as well as uncertainties caused by unproven technologies in terms of electricity generation [
3,
4,
5,
6]. In an attempt to answer these limitations, other metrics have been introduced to compare technologies at low Technology Readiness Levels (TRL) [
7,
8,
9]. For example, the ACE metric, which is the ratio of the average climate capture width to the Characteristic Capital Expenditure (ACE), was introduced in [
8] to assess the economic capabilities of wave energy concepts at early stages of technology development. In [
10], the ACE is calculated as an optional cost metric for assessing technologies at early stages when not sufficient or reliable data for calculating the LCoE is available. Together with the Hydrodynamic Quality Factor (HQF), the ACE can be useful to compare different WEC concepts. This method is convenient when comparing concepts at low TRLs. However, when setting up the development pathway for a wave energy project, the target market indicator is the LCoE. When looking solely at one technology throughout its development lifetime, choosing a single metric, such as the LCoE, can therefore facilitate tracking the economic performances of the technology so that it follows the preferred pathway for development [
11].
Assessing the LCoE of a technology at the early stages of technology development is associated with some uncertainties. Instead of a bottom-up approach, a top-down approach can be used, where the LCoE of a technology is defined by the entry LCoE value for the target market. There will still be some uncertainties in the costs found using this approach, but it will give a range of target costs for a technology to reach in order to achieve the end goal of commercialisation in the specific market.
In this context, guidance for the economic assessment of a wave energy technology at an early development stage or TRL (TRL1 to TRL4) [
12] is proposed in this work with a focus on a target market while considering the uncertainties associated with the calculations. A methodology that can be applied to any project deployed at any location around the globe is presented in the following section, and this methodology is afterwards applied to a specific wave energy technology at an early stage of development. Limitations of the methodology and uncertainties on the calculations are also discussed. The methodology can eventually enable the identification of possible improvements for the particular concept studied.
2. Proposed Methodology
The proposed methodology to assess the economic potential of a wave energy converter at early development stages is presented in this section. The first step is to define the target market for the commercialisation of a specific technology. Afterwards, all assumptions and relevant relations are introduced to enable the reverse calculation of costs associated with a particular project. Then, a detailed breakdown of costs is presented, which can enable identifying bottlenecks and possibilities for the improvement of the technology. Finally, a review of estimates for economic indicators, such as Capital Expenditures (CAPEX), Operational Expenditures (OPEX), capacity factors () and availability, is presented in order to aid the economic evaluation.
2.1. Target Market for Commercialisation
In order to setup the right frame for the economic assessment of a wave energy concept, it is important to identify the target market for commercialisation. For a wave energy technology aiming at the utility-scale market, the SET-Plan has defined an LCoE target in the range of 100 to 200 EUR/MWh [
2]. These numbers can be compared to the target LCoE for offshore wind energy for 2030 of 65 EUR/MWh, including grid connection [
13]. An exemption to this could be islands that are not connected to the mainland grid and have their own power supply based on traditional diesel generators. In this case, a competitive LCoE to the diesel alternative depends on oil prices. These are variable and will fluctuate throughout the project lifetime, but something in the range of 300 to 400 EUR/MWh, as reported for Kiritimati Island, in the Pacific Ocean [
14], seems reasonable. Similar values were reported in [
15] for a diesel engine farm in the United Kingdom. As a comparison, in 2018, a value for diesel generation in the range of 560 to 730 EUR/MWh was reported for Christmas Island, Australia [
16]. Overall, identifying the target market has a significant impact in the boundary conditions for the economic assessment. (Even though this work focuses on the target market, existing frameworks for accelerating the development of wave energy is not to be neglected when developing a new concept. See for example [
17] for existing European frameworks.)
2.2. Assumptions and Economic Computations
In order to perform an economic assessment at the early stages of the concept development (TRLs 1–4), some assumptions are made. Through reverse calculations, the initial estimates on the CAPEX and OPEX of the project can be obtained. The goal is to get an indication of the values that would allow achieving a given target LCoE. To perform the reverse calculation, some values need to be assumed for the following parameters:
Based on the project interest rate and the project lifetime, it is possible to extend the discount rate on an annual basis by calculating the annualisation factor (
):
The Normalised Annual Energy Production (NAEP), in MWh per installed kW per year, can be calculated using the following relation:
where 8765 corresponds to the number of hours in a year.
The LCoE (in EUR/MWh) relates the parameters, CAPEX, OPEX, NAEP, and the annualisation factor through the following simplified equation:
By assuming a given LCoE, NAEP and annualisation factor, a relation between the CAPEX (in EUR per kW of installed power) and the OPEX (in EUR per kW of installed power per year) can be obtained. Because the OPEX is typically expressed as a percentage of the CAPEX (this relation is further described in
Section 2.3.2) by choosing a given percentage, the CAPEX can be estimated; and from that, the OPEX can also be derived.
2.3. Breakdown of Costs
The costs related to a wave energy project are usually divided into CAPEX and OPEX. These two categories are further divided into cost centres. This categorisation is performed in order to quantify the influence of the different cost centres on the overall cost of a project. For wave energy projects, this exercise was performed in [
4,
21,
22,
23,
24,
25], but in all cases, either a single technology was considered or a limited number of technologies were considered.
A literature review was performed by Têtu and Fernandez Chozas in [
26] to build a cost database for wave energy projects [
27]. This database is the baseline for the technology agnostic breakdown of costs presented in this section, which can be used to assign ranges of cost for the different cost centres when target values for the CAPEX and OPEX are known.
2.3.1. CAPEX
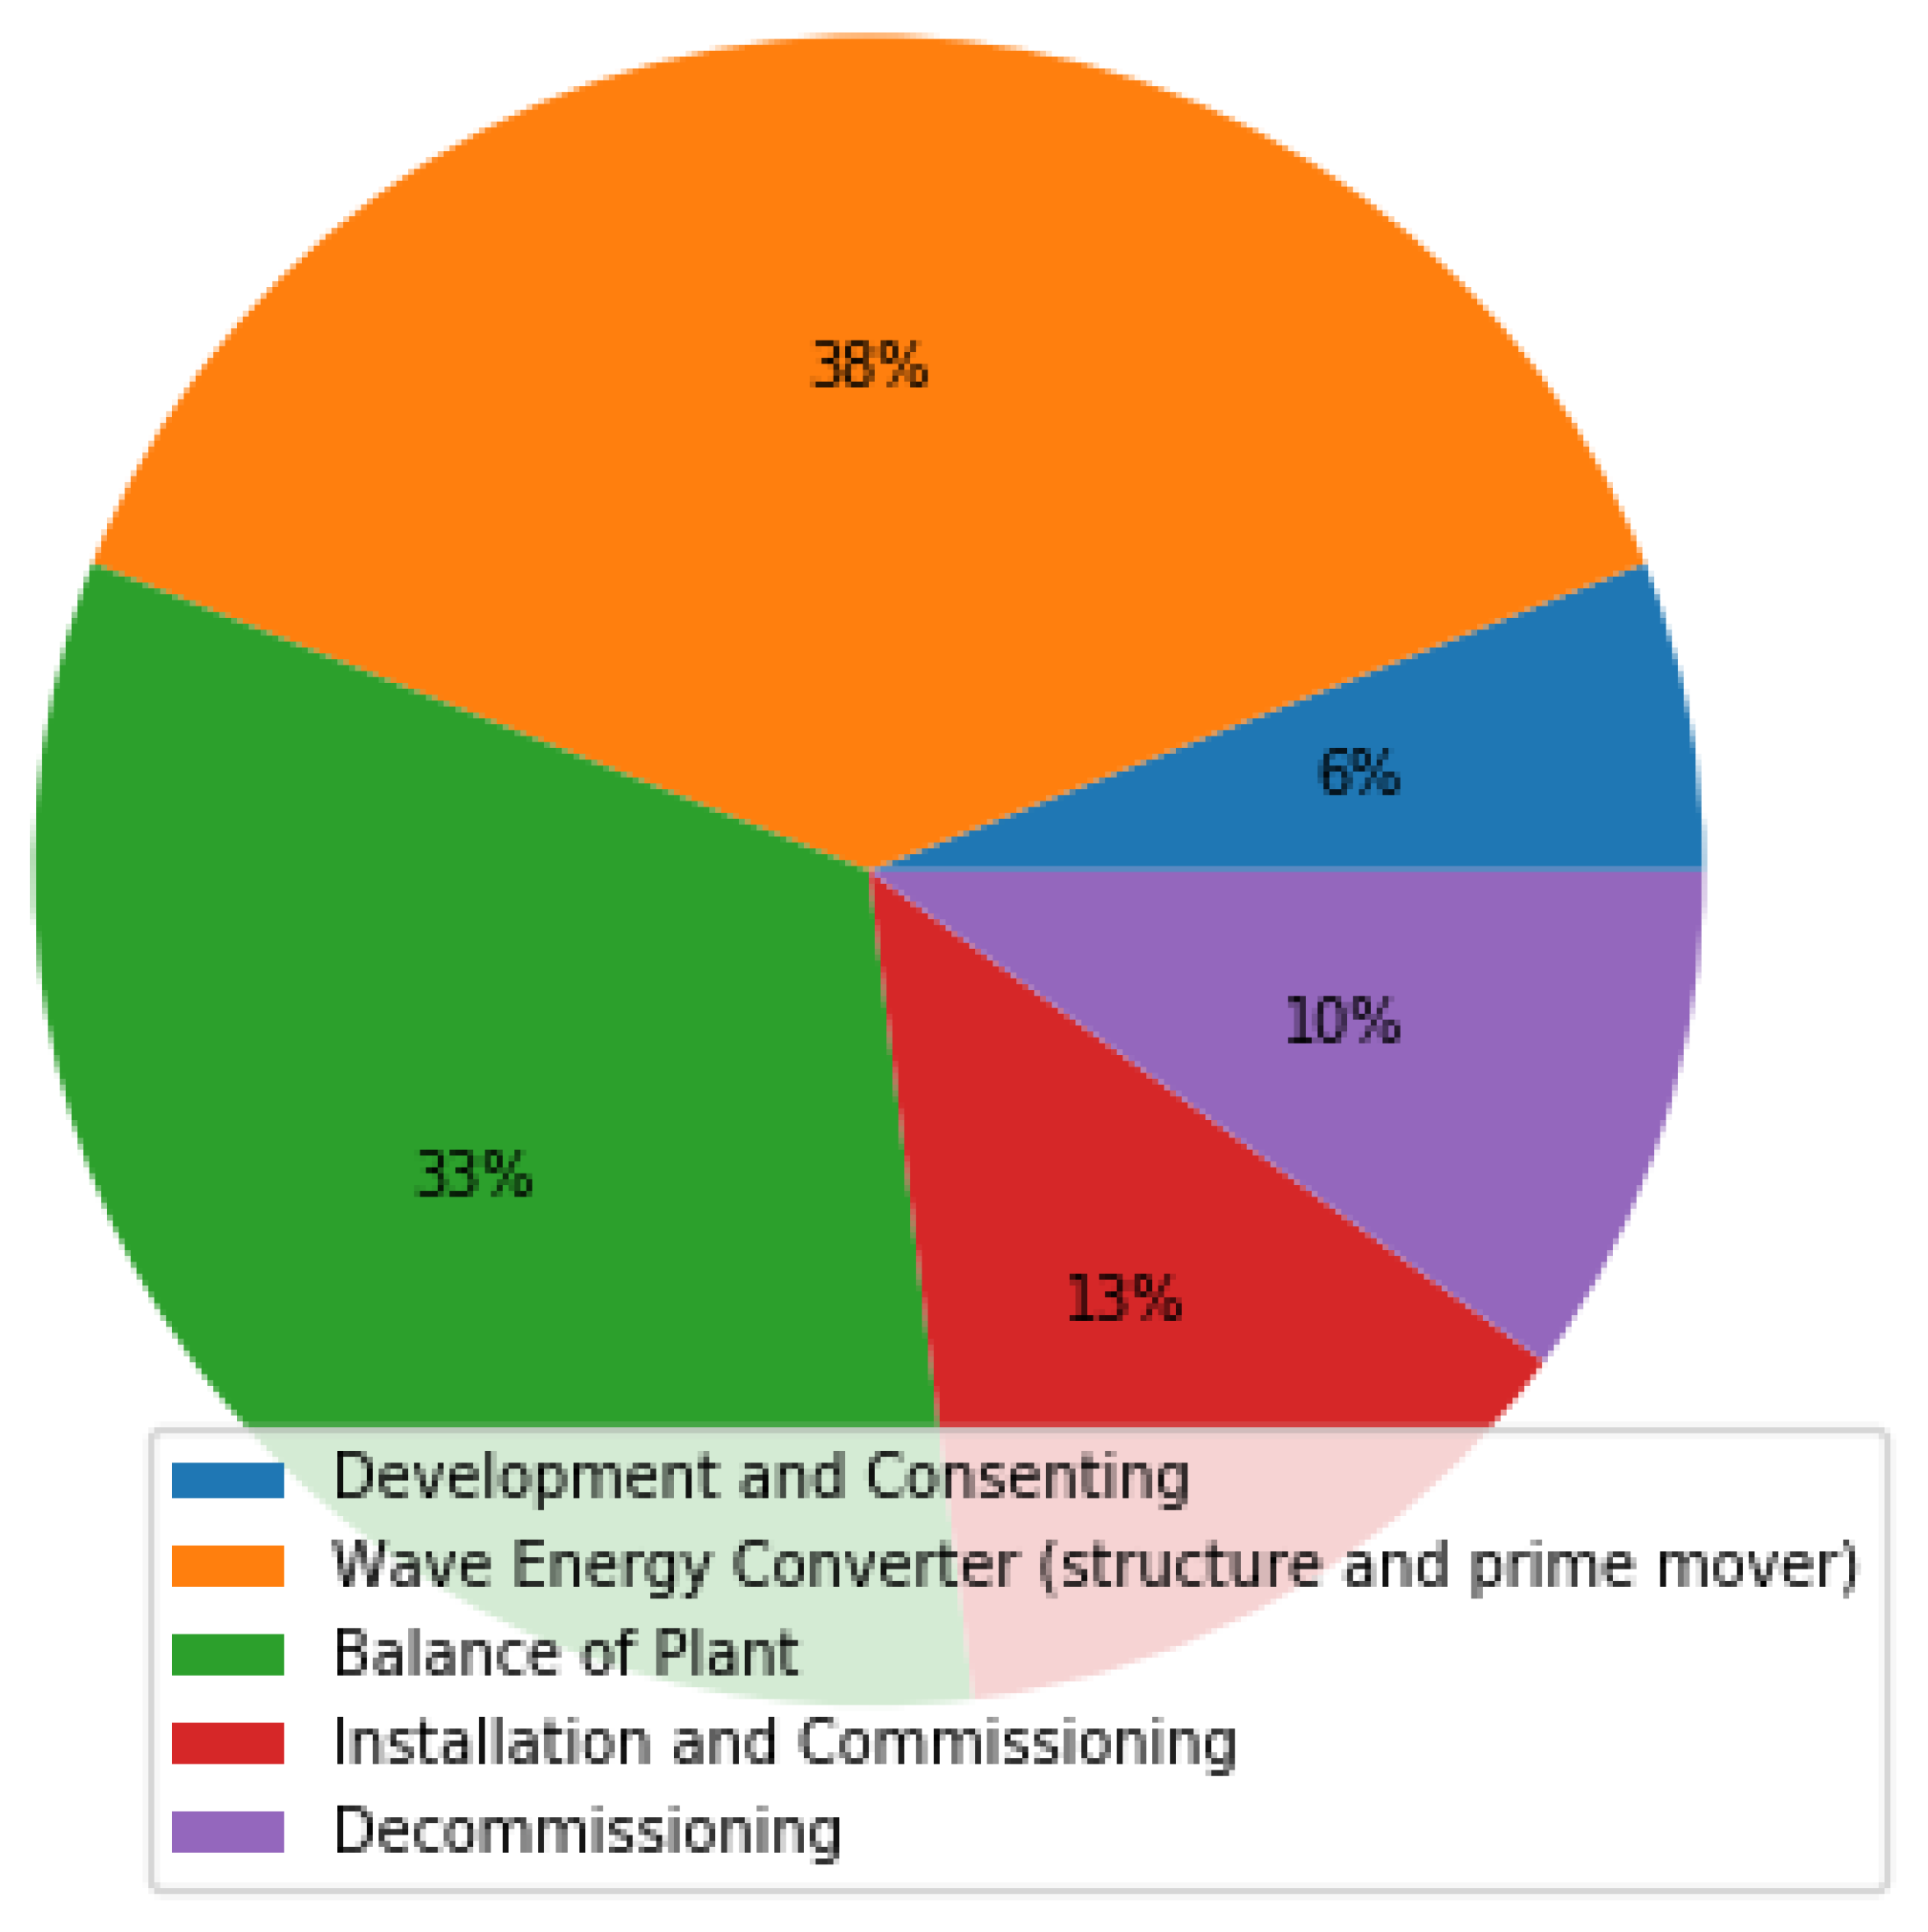
CAPEX for a wave energy project can be summarised as all the expenditures associated with the project development, its deployment and commissioning until the operation of the WEC farm starts. It also includes decommissioning at the end of the project life. A thorough literature review of costs related to the CAPEX can be found in [
26]. Costs found in this category include costs related to the multifaceted process of developing a WEC farm from inception through to the handing over of the farm to the customer. A cost breakdown for the CAPEX is presented in
Figure 1 based on the work compiled in [
26]. The different costs centres are explained further in the following subsections.
Development and Consenting
The development and consenting services account for the following costs: project management, design engineering, planning and consenting. These costs are normally reported as percentage of CAPEX and this percentage is expected to decrease proportionally as the installed power capacity increases and standard procedures are developed [
28]. Percentage values range from 2% up to 12% of the CAPEX [
21,
29,
30,
31], and this may well be due to the fact that these cost are very project (i.e., single prototype or wave energy farm) and site-specific. From a general point of view and by taking the experience gathered in the wind energy sector [
32], development and consenting can be estimated at 6% of the CAPEX.
Wave Energy Converter (Structure and Prime Mover)
The wave energy converter, including its structure and prime mover, has been reported many times to have the most significant impact on CAPEX. The structure cost includes the detailed infrastructure design and supply of all components from the mooring attachment point, excluding the power take-off system. This also includes delivery to a port. Again, the costs reported in the literature are very project-specific, as they depend on the structure’s main materials and volumes [
21,
24,
25,
33]. A value of 38% of the CAPEX is reasonable according to [
26], where a range of 27% to 38% of the CAPEX has been found for this category.
Balance of Plant
The Balance of plant costs include costs related to the power take-off (PTO) system [
34,
35,
36], the supply of all its constituting components and its delivery to the port. Mooring [
24,
25,
33,
37,
38] and foundation [
30,
39] costs are also included in this cost centre together with the electrical installation necessary to render the farm grid-connected [
30,
33,
40,
41,
42,
43,
44]. All in all, this cost centre has the second most significant impact on the CAPEX. From the costs gathered in [
26], this cost centre can be estimated at 33% of the CAPEX.
Installation and Commissioning
Installation costs [
21,
24,
33] include the installation of the WECs on site and the commissioning of these to a fully operational state, up to the point of issue of any takeover certificate. Those costs are to a great extent driven by vessel-chartering costs. Installation methods that require small and, thus, cheaper vessels lead to a lower cost, and the installation in port followed by towing can provide significant cost-reduction opportunities. According to the review of costs presented in [
26], installation and commissioning costs include the costs of installing the foundation or moorings, the offshore substation, the WEC and the cables; they typically fall in the range of 8% to 17% of the CAPEX. In this particular exercise, they are estimated at 13% of the CAPEX.
Decommissioning
Decommissioning costs [
24,
41] include all costs related to the removal of the WECs, the foundation or mooring system and the electrical cables according to the legally binding contract. The decommissioning of an offshore project is often seen at the reverse operation of the installation and commissioning process. Experience from the wind sector [
45,
46,
47] helps estimating costs for decommissioning of a wave energy farm project, and according to [
26], 10% of the CAPEX is a reasonable estimate for this cost centre.
2.3.2. OPEX
The OPEX relates to all expenditures associated with the operation of a WEC farm from the moment a takeover certificate is issued, including the cost of all operation and maintenance (O&M) activities as well as the cost associated to site leasing and insurance.
Table 1 summarises the cost breakdown for the OPEX obtained from the literature review presented in [
26]. The main two cost centres are the site lease and insurance, accounting for 6% of the OPEX, and the O&M, accounting for the remaining part of OPEX.
For a wave energy farm for which data is scarce, the annual OPEX can be estimated as a percentage of the CAPEX. As shown in the literature, estimates of the total OPEX per year roughly range from 1.5% to 9% of the CAPEX [
29,
33,
48,
49]. This is due to different factors (e.g., single prototype or utility-scale project, distance to shore, floating or submerged WEC, innovative or traditional O&M techniques applied, etc). For example, the OPERA project [
25] has shown that when specific innovative O&M techniques are applied, the OPEX can be as low as 1.8% to 2.2% of the CAPEX, depending on the deployment location and size of the array. If a utility-scale project is considered, then the experience from the offshore wind energy sector (with the annual OPEX as 4.5% of the CAPEX [
6] and the annual OPEX as 3% of the CAPEX [
50] ) can be used.
2.4. Estimates for CAPEX, OPEX and Other Relevant Economic Indicators
It is very pertinent to provide different references that may assist in the application of the proposed guidance to a particular WEC. The purpose of this subsection is to present estimated relations between the CAPEX and OPEX as well as targeted values of the CAPEX, OPEX, capacity factors, availability and interest rates provided by different technology developers in the wave energy sector. The references have been selected according to their relevance. All of them aim to take into account the views and state of the art of several wave energy developments.
Ocean Energy System [
4] reviewed current and projected costs (CAPEX, OPEX and LCoE) for wave energy converters at a TRL 6 and above by engaging with a large number of international stakeholders globally involved in wave energy developments. Three different development stages were considered: i) first array deployed, ii) second array deployed and iii) first commercial-scale project (first project that is constructed with a view to generate commercial return without the need for capital or public sector support outside of an authorised feed-in-tariff). The costs of a generic WEC were derived by considering the different TRLs of the concepts being consulted and the uncertainty behind the data. A summary of the main findings is provided in
Table 2, and the reader is referred to [
4] for the detailed methodology employed.
In 2018–2019, a second study [
51] had the main goal of updating the previous findings. With the aim of targeting a higher number of respondents, all active wave energy developers around the world were invited to participate in the study. Based on the respondents, the typical features and costs of a generic, utility-scale floating wave energy farm were obtained and are provided in
Table 3. These costs represent only the start of the learning curve, and the values are expected to decrease as more farms are deployed.
To complement the previous figures, the estimates of future costs for wave power included in the Technology Catalogue of Denmark [
15] are shown in
Table 4. The costs presented aim to provide an estimate for what capital and operational costs of wave power converters might be in the future assuming most of the research and development challenges have been overcome, economics of scale have been realised and efficiencies in production and operation due to the learning curve effect have been achieved.
3. Example and Discussion
The methodology presented in the previous section is applied in this section to the LiftWEC concept. The LiftWEC project [
52] aims to develop a new type of wave energy converter (the LiftWEC concept) that couples with the waves through lift forces generated by one or more hydrofoils that rotate in a single direction. LiftWEC is currently at TRL 2, and it is expected to reach TRL 4 [
52] by the end of the project (late 2022). The concept is ultimately designed to work in wave energy farms and supply electricity at grid-scale. Unlike other projects, the concept is yet to be defined during the LiftWEC project. No developer is involved, and the resulting concept will be the fruit of the unique development process detailed in [
52].
The target deployment location for the LiftWEC concept is off the North Atlantic coast of France, close to Quimper, where the water depth at the deployment location is 50 m and the wave resource is estimated at 40 kW/m. The targeted rated power is still an unknown for the final concept but it should be in the range [0.75, 2] MW, while the lifetime of the project is set at 25 years.
The project has set two reasonable economic goals to its technology development. The first goal is to prove an LCoE of 200 EUR/MWh by mid-project, coinciding with TRL 2. The second goal is proving an LCoE of 120 EUR/MWh by project end, i.e., when reaching TRL 4. The latter LCoE is aligned with target values to be achieved for a utility-scale project, and both target values will be used in the following section to perform the reverse calculation and obtain ranges for the CAPEX and OPEX for the concept using the technology agnostic breakdown of costs presented in
Section 2.3.
3.1. LCoE Calculation
The goal behind the LCoE calculation is to get an indication of the values that would allow achieving the LiftWEC project mid-term target (TRL 2) LCoE of 200 EUR/MWh and end-of-project (TRL 4) target LCoE of 120 EUR/MWh. In
Section 2.2, the assumptions and equations leading to the calculation of the LCoE were introduced. The values for the parameters affecting the LCoE calculation, i.e., the capacity factor, the discount rate, the project lifetime and the availability, are presented in the top four rows of
Table 5.
From the discount rate and the lifetime, according to Equation (
1), the annualisation factor becomes
for both cases. The normalised annual energy production is then obtained from Equation (
2), providing the value of NAEP
MWh/kW/year for the mid-term target and NAEP
MWh/kW/year for the end-of-project target.
As also presented in
Section 2, a relation can be established between the CAPEX and OPEX. An estimate of the OPEX accounting for 5% the CAPEX seems reasonable for the mid-term project (TRL 2), where no O&M optimisation has been done. For the end-of-project (TRL 4), where O&M optimisation techniques shall be considered, a reduction of the OPEX is expected, and hence, it seems reasonable to estimate an OPEX value of about 2.5% CAPEX.
Isolating the CAPEX and OPEX in Equation (
3) and considering the OPEX as
x% of the CAPEX gives:
resulting in a CAPEX value of 4181 EUR/kW for the mid-term project, assuming the OPEX accounts for 5% the CAPEX; and a CAPEX value of 3780 EUR/kW for the end-project, assuming the OPEX accounts for 2.5% the CAPEX. For clarity purposes, the two estimates of the CAPEX are rounded to 4200 EUR/kW and 3800 EUR/kW, respectively. OPEX values are consecutively calculated and obtained at 210 EUR/kW/year and 95 EUR/kW/year, respectively, providing the two target LCoEs to be achieved by mid-project and end-of-project of 200 EUR/MWh and 120 EUR/MWh, respectively.
Table 5 summarises the values for the different parameters and the results to be achieved in order to reach the two target LCoEs of 200 EUR/MWh and 120 EUR/Mwh.
By comparing the numbers shown in
Table 2 to the estimates presented in this work, it can be seen that the present estimates of CAPEX (4200 EUR/kW and 3800 EUR/kW) and OPEX (210 EUR/kW/year and 95 EUR/kW/year) are in the same order of magnitude that the minimum values expected in the three deployment stages addressed by the OES study (first array, second array and first-commercial scale project). From this, we could argue that the calculations and targets presented in this paper—and also worked throughout the LiftWEC project—are aligned to the sector’s targets. However, it is also important to notice that there are still considerable R&D efforts to go from the LCoE of 200 EUR/MWh to the 120 EUR/MWh, especially in terms of increasing the ability of the LiftWEC concept to capture more energy (and hence, increasing the AEP without compromising costs) and to lower the OPEX by applying innovative O&M techniques. Two aspects that have proven to be of the utmost importance to the sector [
53]. It is also important to note that the presented values (i.e., LCoE, CAPEX, OPEX, capacity factors and availability) are estimates with a relevant degree of uncertainty (the LifWTEC Concept is currently in TRL 2), as indicated in
Section 3.3.
3.2. Estimates of the CAPEX Breakdown for the Mid-Term Project (TRL 2)
As presented in
Section 2 and shown in
Figure 1, the expected breakdown of the CAPEX for a generic wave energy converter has been suggested, which gives a reasonable starting point for a low-TRL project where detailed information of all costs is not yet available. Based on the assumption at the mid-term project and TRL 2 of CAPEX at 4200 EUR/kW, the estimates for the different CAPEX cost centres can be inferred too. They are presented in
Table 6.
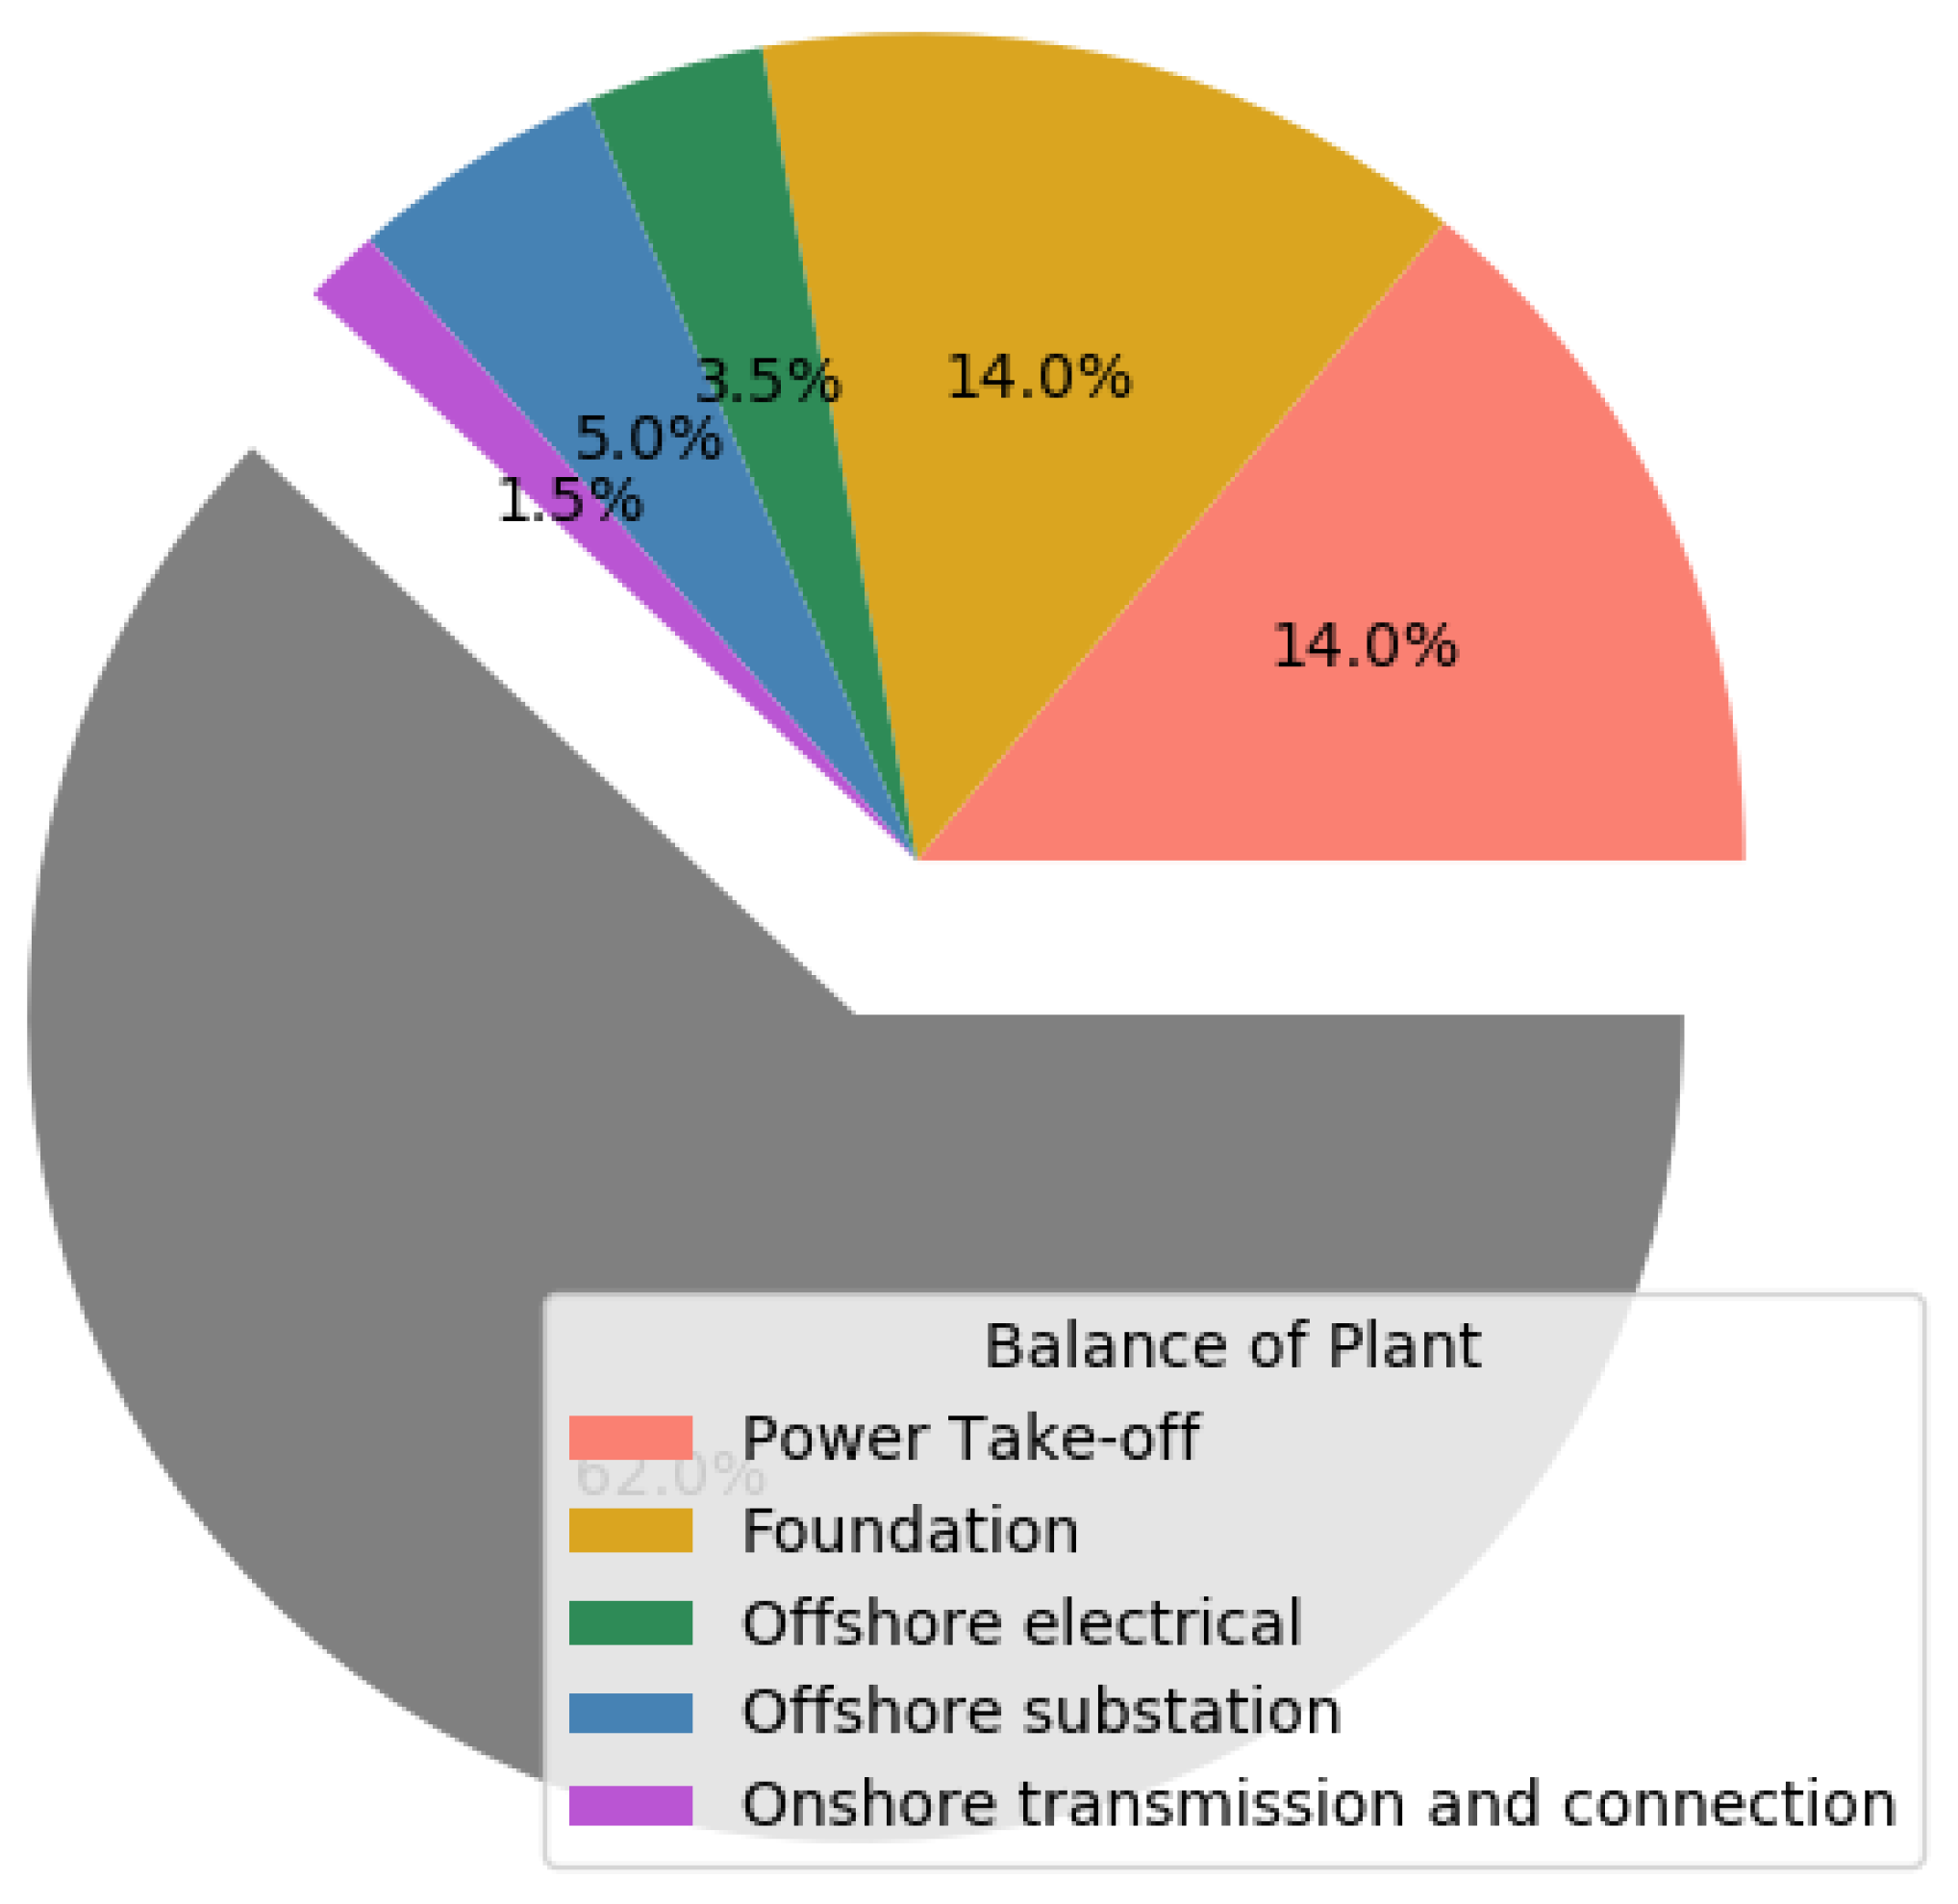
To exemplify the meaning of these numbers,
Table 7 and
Figure 2 provides a deeper insight into the cost centre labeled
Balance of plant. With an allocated percentage contribution to CAPEX of 38%, the following estimates can be inferred for the different parts that compose it. These are the power take-off system, the foundation or support structure, the offshore electrical cables, the offshore substation and the onshore transmission and connection [
26].
By looking into each of the categories depicted in
Table 7, it is relevant to compare how the suggested numbers coming from the reverse calculation fall into the costs experienced by the wave energy sector. Ricci et al. [
36] suggest that 600 EUR/kW for a linear generator PTO-type or 800 EUR/kW for a hydraulic PTO-type are reasonable estimates. Other studies [
34,
35] suggest that a unit cost of 340 EUR/kW can be used for the different PTO systems (mechanical, air, water and hydraulic) if series production is considered. Therefore, assuming a value around 600 EUR/kW seems to be reasonable.
The estimated costs for the foundation (590 EUR/kW) are also comparable with the costs presented in [
30] for a monopile structure at 30 m water depth.
With regards to the costs of the electrical connections, they are in the same range as the ones presented in [
32] for the inter-array electric cable, in [
30,
42] for the offshore substation and in [
40] for the onshore transmission and connection.
It is important to note that the costs of an offshore electrical connection are very much project-specific and site-dependent. Denmark has traditionally financed the electrical connections for offshore wind energy projects. This fact has had an important impact on the final LCoE for offshore wind energy in Denmark compared to the one obtained in other countries, i.e., Great Britain, where developers shall self-finance the export infrastructure, and the difference of these on the final LCoE is estimated at 25% [
54].
Overall, the example presented in this section has allowed drawing some estimates of the values and costs that will allow the LiftWEC concept to be competitive in the energy market. It is the primary goal that this economic exercise is done in combination and in collaboration with technological development, so every advancement in the concept’s design decision is considering all the technological and economic aspects together. It is also important to note that the presented values may be read as orders of magnitudes rather than absolute figures, and therefore, the overall exercise is also found to be useful in helping to identify expected costs ranges for the different categories, elements or cost-centres that compose a WEC. Those values and the breakdown of costs are likely to change as the project evolves to higher TRL.
3.3. Uncertainties and Improvement Possibilities
It is important to be aware that there are uncertainties in all the data handled throughout the calculations. Therefore, there will be uncertainties in the output results.
A quantification of the uncertainties that accompanied the cost assessment of wave energy technologies was proposed in [
55]. The quantification depends on the technology’s development stage (TRL) and the type of assessment (preliminary, baseline, detailed, etc.) that is carried out. This quantification has been used in [
4,
29,
51], among others, and has allowed us to provide a sensitive evaluation of uncertainties.
Table 8 summarises the uncertainties associated to a preliminary cost evaluation.
Accordingly, the associated uncertainty to the estimated values at the present development stage of the LiftWEC concept (at TRL 2) is about %. This is an important fact to take into account, as it reflects that there are also lot of uncertainties on the technological side. The end-of-project target LCoE of 120 EUR/MWh (expected at TRL 4) has an associated uncertainty of . This reduction in uncertainty is associated to the advancements of technology development. The first results form tank testing, and refined numerical modeling will be available. Furthermore, annual energy production estimates will include the contribution of a specific-designed control strategy. The inclusion of such a control strategy will also affect the OPEX (to a large extent) and CAPEX, which will be evaluated and examined in detail. At this stage, a more specific description of costs will be drawn.
4. Conclusions
The economic assessment of wave energy projects is highly recommended at any stage of development. Setting target LCoE goals for a specific market is paramount to understand the key values that shall be achieved in order to be competitive in that specific market. The concepts to be evaluated in the LiftWEC project are at a very early stage of development. Nevertheless, as the target is to deliver electricity to the grid at a competitive price, some key economic indicators can be used to facilitate achieving the end goal. The present work has defined estimate values for overall project interest rate, capacity factor, WEC availability, CAPEX and OPEX when a specific LCoE is set as a target. The estimates have shown to be aligned with the targets of the wave energy sector and provide reasonable orders of magnitude for the different elements that constitute a wave energy converter. The uncertainty associated with these estimates has also been discussed. With an extensive database of costs, the estimated values enable to define ranges of costs for all cost centres of a WEC project. By keeping these in mind throughout the design process, it is the aim to ensure that the development of a WEC concept is following a competitive pathway to commercialisation.
Author Contributions
Conceptualization, A.T. and J.F.C.; methodology, A.T. and J.F.C.; formal analysis, A.T. and J.F.C.; writing—original draft preparation, A.T. and J.F.C.; writing—review and editing, A.T. and J.F.C. All authors have read and agreed to the published version of the manuscript.
Funding
This research was funded by European Union’s Horizon 2020 research and innovation programme under grant agreement No 851885.
Acknowledgments
This paper is supported by the European Union’s Horizon 2020 research and innovation programme under grant agreement No 851885, project LiftWEC (the development of a novel wave energy converter based on hydrodynamic lift forces). The authors would also like to acknowledge the fruitful discussions and comments from the LiftWEC project participants, especially Matt Foley and Paul Lamont-Kane (Queens University Belfast).
Conflicts of Interest
The authors declare no conflict of interest.
Abbreviations
The following abbreviations are used in this manuscript:
| ACE | Ratio of the Average climate capture width to the Characteristic capital Expenditure |
| NAEP | Normalised Annual Energy Production |
| EU | European Union |
| WEC | Wave energy converter |
| LCoE | Levelised cost of energy |
| CAPEX | Capital expenditure |
| OPEX | Operating expenditure |
| O&M | Operation and maintenance |
| TRL | Technology readiness level |
| LiftWEC | lift-based WEC |
| PTO | Power Take-Off |
References
- European Commission. An EU Strategy to Harness the Potential of Offshore Renewable Energy for a Climate Neutral Future; Technical Report; European Commission: Brussels, Belgium, 2020; Available online: https://ec.europa.eu/energy/sites/ener/files/offshore_renewable_energy_strategy.pdf (accessed on 8 February 2021).
- European Commission—SET Plan Secretariat. SET Plan–Declaration of Intent on Strategic Targets in the Context of an Initiative for Global Leadership in Ocean Energy; Technical Report; European Commission: Brussels, Belgium, 2016; Available online: https://setis.ec.europa.eu/system/files/integrated_set-plan/declaration_of_intent_ocean_0.pdf (accessed on 8 February 2021).
- Magagna, D.; Monfardini, R.; Uihlein, A. JRC Ocean Energy Status Report, 2016th ed.; Joint Research Centre, Directorate for Energy, Ed.; Technical, Report; Publications Office of the European Union: Luxembourg, 2016; Available online: https://publications.jrc.ec.europa.eu/repository/bitstream/JRC104799/kj1a28407enn.pdf (accessed on 8 February 2021).
- Fernandez Chozas, J.; MacGillivray, A.; Raventos, A.; Jeffrey, H.; Nielsen, K.; Aderibigbe, D. International Levelised Cost of Energy for Ocean Energy Technologies; Technical Report; Ocean Energy Systems (OES): Lisbon, Portugal, 2015. [Google Scholar]
- Falcão, A. Wave energy utilization: A review of the technologies. Renew. Sustain. Energy Rev. 2010, 14, 899–918. [Google Scholar] [CrossRef]
- Pecher, A.; Kofoed, J.P. Handbook of Ocean Wave Energy; Springer, Ocean Engineering &Oceanography: Cham, Switzerland, 2017. [Google Scholar]
- Barbarit, A. A database of capture width ratio of wave energy converters. Renew. Energy 2015, 80, 610–628. [Google Scholar] [CrossRef] [Green Version]
- Jenne, S.; Weber, J.; Thresher, R.; Bull, D.; Driscoll, F.; Dallman, A.; Newborn, D.; Quintero, M.; LaBonte, A.; Karwat, D. Methodology to Determining the ACE Metric Used in the Wave Energy Prize. In Proceedings of the 12th European Wave and Tidal Energy Conference, Cork, Ireland, 27 August–1 September 2017. [Google Scholar]
- EIA. Levelised Costs of New Generation Resources in the Annual Energy Outlook 2021; Technical Report; U.S. Energy Information Administration: Washington, DC, USA, 2021. Available online: https://www.eia.gov/outlooks/aeo/pdf/electricity_generation.pdf (accessed on 8 February 2021).
- Correia da Fonseca, F.; Amaral, L.; Armayor, A.; Cândido, J.; Arede, F.; Henderson, J.; Hudson, B.; Nava, V.; Tunga, I.; Petrov, A. System Lifetime Costs Tools–Alpha Version; Technical Report; H2020 DTOceanPlus Project Deliverable. 2019. Available online: https://ec.europa.eu/research/participants/documents/downloadPublic?documentIds=080166e5ca810ef1&appId=PPGMS (accessed on 8 February 2021).
- Weber, J. WEC Technology Readiness and Performance Matrix – finding the best research technology development trajectory. In Proceedings of the 4th International Conference on Ocean Energy (ICOE), Dublin, Ireland, 17–19 October 2012. [Google Scholar]
- European Commission. Horizon 2020 Work Programme 2014–2015. 19. General Annexes Revised; Technical Report; European Commission: Brussels, Belgium, 2014; Available online: http://ec.europa.eu/research/participants/portal/doc/call/h2020/common/1617621-part_19_general_annexes_v.2.0_en.pdf (accessed on 8 February 2021).
- WindEurope. Unleashing Europe’s Offshore Wind Potential; Technical Report; WindEurope: Brussels, Belgium, 2017. [Google Scholar]
- SPC; GIZ. A Least Cost Analysis of Electricity Generation Options for Kiritimati Island (Draft). Available online: http://prdrse4all.spc.int/system/files/first_draft_kiritimati_lca_report.pdf (accessed on 8 February 2021).
- Danish Energy Agency and Energinet. In Technology Data–Energy Plants for Electricity and District Heating Generation; Technical Report; Danish Energy Agency and Energinet: Copenhagen, Denmark, 2016.
- 75 % Cost Savings Compared to Diesel Generator-Christmas Island, Australia. Available online: https://www.tesvolt.com/en/projects/75-cost-savings-compared-to-diesel-generator.html (accessed on 8 February 2021).
- Ramos, V.; Giannini, G.; Calheiros-Cabral, T.; Rosa-Santos, P.; Taveira-Pinto, F. Legal framework of marine renewable energy: A review for the Atlantic region of Europe. Renew. Sustain. Energy Rev. 2021, 137, 110608. [Google Scholar] [CrossRef]
- Short, W.; Packey, D.; Holt, T. A Manual for the Economic Evaluation of Energy Efficiency and Renewable Energy Technologies; Technical Report; National Renewable Energy Laboratory: Golden, CO, USA, 1995; Available online: https://digital.library.unt.edu/ark:/67531/metadc678552/m2/1/high_res_d/35391.pdf (accessed on 8 February 2021).
- Paredes, M.; Padilla-Rivera, A.; Güereca, L. Life Cycle Assessment of Ocean Energy Technologies: A Systematic Review. J. Mar. Sci. Eng. 2019, 7, 322. [Google Scholar] [CrossRef] [Green Version]
- Capacity Factors at Danish Offshore Wind Farms. Available online: https://energynumbers.info/capacity-factors-at-danish-offshore-wind-farms (accessed on 8 February 2021).
- Carbon Trust. Future Marine Energy, Results of the Marine Energy Challenge: Cost Competitiveness and Growth of Wave and Tidal Stream Energy; Technical Report; Carbon Trust: London, UK, 2006. [Google Scholar]
- Carbon Trust. Accelerating Marine Energy: The Potential for Cost Reduction–Insights from the Carbon Trust Marine Energy Accelerator; Technical Report; Carbon Trust: London, UK, 2011. [Google Scholar]
- SI Ocean. Ocean Energy: Cost of Energy and Cost Reduction Opportunities; Technical Report; SI Ocean Project. 2013. Available online: https://oceanenergy-sweden.se/wp-content/uploads/2018/03/130501-si-ocean-cost-of-energy-report.pdf (accessed on 8 February 2021).
- OPERA Project. In Tracking Metrics for Wave Energy Technology Performance; Technical Report; Deliverable D7.3; University of Edinburgh for the OPERA Project: Edinburgh, UK, 2019.
- 2019. Available online: http://opera-h2020.eu/wp-content/uploads/2019/09/OPERA_D7.5-Final-assessment-and-recommendations_TECNALIA_20190724_v1.0.pdf (accessed on 8 February 2021).
- Têtu, A.; Fernandez Chozas, J. Deliverable D8.1-Cost Database. Technical Report, LiftWEC–Development of a New Class of Wave Energy Converter Based on Hydrodynamic Lift Forces. 2020. Available online: https://liftwec.com/wp-content/uploads/2020/06/LW-D08-01-1x3-Cost-database.pdf (accessed on 8 February 2021).
- Têtu, A.; Fernandez Chozas, J. Database of Costs for Wave Energy Projects. Available online: https://zenodo.org/record/4442080#.YQj69EARVhE (accessed on 8 February 2021).
- Nielsen, K. Point Absorber Feasibility and Development Requirements; Technical Report; Danish Energy Agency: Copenhagen, Denmark, 2001. [Google Scholar]
- Fernandez Chozas, J.; Kofoed, J.P.; Helstrup Jensen, N.E. User Guide—The COE Calculation Tool for Wave Energy Converters; Technical Report; DCE Technical Report No. 161; Aalborg University: Aalborg, Denmark, 2014. [Google Scholar]
- Siegel, S. Final Scientific Report. In Cycloidal Wave Energy Converter; Technical Report; DE-EE0003635; Atargis Energy Corporation: Pueblo, CO, USA, 2012. [Google Scholar]
- Nielsen, K.; Bingham, H.; Bjerg Thomsen, J. On the Absorption of Wave Power Using Ship Like Structures. In Proceedings of the Twenty-Eighth International Ocean and Polar Engineering Conference, Sapporo, Japan, 10–15 June 2018. [Google Scholar]
- Vikkelsø, A.; Larsen, J.H.M.; Sørensen, H.C. The Middelgrunden Offshore Wind Farm; Technical Report; Copenhagen Environment and Energy Office CEEO: Copenhagen, Denmark, 2003; ISBN 87-986690-3-6. Available online: https://base.socioeco.org/docs/a118_doc1.pdf (accessed on 8 February 2021).
- Previsic, M. System Level Design, Performance, and Costs of California Pelamis Wave Power Plant; Technical Report; EPRI: Washington, DC, USA, 2004. [Google Scholar]
- Nielsen, K. Development of Recommended Practices for Testing and Evaluating Ocean Energy Systems; Technical Report; OES (Ocean Energy Systems), Annex II: Lisbon, Portugal, 2003. [Google Scholar]
- Meyer, N. Rambøll: Bølgekraftprogram-Afsluttende Rapport fra Energistyrelsens Rådgivende Bølgekraftudvalg; Technical Report; Rambøll: Copenhagen, Denmark, 2002. [Google Scholar]
- Ricci, P.; Lopez, J.; Touzón, I.; Duperray, O.; Villate, J. A methodology for the global evaluation of wave energy array performance. In Proceedings of the Fourth International Conference on Ocean Energy, Dublin, Ireland, 17–19 October 2012. [Google Scholar]
- Nielsen, K.; Friis-Madsen, E. Deliverable 6 on the LCOE; Technical Report; Danish Beton til Bølgekraft Project, b2b Project: Copenhagen, Denmark, 2020. [Google Scholar]
- Harris, R.; Johanning, L.; Wolfram, J. Mooring systems for wave energy converters: A review of design issues and choices. Proc. Inst. Mech. Eng. Part J. Eng. Manuf. 2004, 220, 159–168. [Google Scholar]
- Serrano González, J.; Burgos Payán, M.; Riquelme Santos, J.M. An improved evolutive algorithm for large offshore wind farm optimum turbines layout. In Proceedings of the 2011 IEEE Trondheim PowerTech, Trondheim, Norway, 19–23 June 2011. [Google Scholar]
- O’Connor, M.; Lewis, T.; Dalton, G. Techno-economic performance of the Pelamis P1 and Wavestar at different ratings and various locations in Europe. Renew. Energy 2013, 50, 889–900. [Google Scholar] [CrossRef]
- Bimep. Best Practice for Developers When Preparing Sea Trials; Technical Report; Bimep, Biscay Marine Energy Platform: Armintza, Spain, 2018. [Google Scholar]
- Catapult, O. Wind Farm Costs–Guide to an Offshore Wind Farm BVG Associates; Technical Report; ORE Catapul: Scotland, UK, 2019; Available online: https://guidetoanoffshorewindfarm.com/wind-farm-costs (accessed on 14 May 2020).
- Iglesias, G.; Astariz, S.; Vazquez, A. The Economics of Wave and Tidal Energy. In Wave and Tidal Energy; Greaves, D., Iglesias, G., Eds.; John Wiley & Sons, Ltd: Hoboken, NJ, USA, 2018. [Google Scholar]
- Beels, C.; Troch, P.; Kofoed, J.; Frigaard, P.; Vindahl Kringelum, J.; Carsten Kromann, P.; Heyman Donovan, M.; De Rouck, J.; De Backer, G. A methodology for production and cost assessment of a farm of wave energy converters. Renew. Energy 2011, 36, 3402–3416. [Google Scholar] [CrossRef]
- Myhr, A.; Bjerkseter, C.; Ågotnes, A.; Nygaard, T.A. Levelised cost of energy for offshore floating wind turbines in a life cycle perspective. Renew. Energy 2014, 66, 714–728. [Google Scholar] [CrossRef] [Green Version]
- Maslov, N.; Charpentier, J.F.; Claramunt, C. A modelling approach for a cost-based evaluation of the energy produced by a marine energy farm. Int. J. Mar. Energy 2015, 9, 1–19. [Google Scholar] [CrossRef] [Green Version]
- Kaiser, M.J.; Snyder, B. Modeling the decommissioning cost of offshore wind development on the U.S. Outer Continental Shelf. Mar. Policy 2012, 36, 153–164. [Google Scholar] [CrossRef]
- Carbon Trust. In Oscillating Water Column Wave Energy Converter Evaluation Report; Technical Report; Carbon Trust: London, UK, 2005.
- Nielsen, K.; Thomsen, J.B.; Ferri, F.; Friis-Madsen, E.; Rasmussen, K.D.; Thomas, S.; Kofoed, J. Impact of Cost of Selected Mooring Solutions on CoE of Partner WECs; Technical Report; DCE Contract Report No.197; Aalborg University: Aalborg, Denmark, 2018. [Google Scholar]
- IRENA. Renewable Power Generation Costs in 2017; Technical Report; International Renewable Energy Agency: Abu Dhabi, UAE, 2017. [Google Scholar]
- OES. Cost of Ocean Energy: Energy Cost Analysis and Forecasts for Ocean Energy Converters; Technical Report; Ocean Energy Systems (OES): Lisbon, Portugal, 2019. [Google Scholar]
- A Horizon 2020 Project Developing a Lift-Based Wave Energy Converter. Available online: http://https://liftwec.com/ (accessed on 8 March 2021).
- Hodges, J.; Henderson, J.; Ruedy, L.; Soede, M.; Weber, J.; Ruiz-Minguela, P.; Jeffrey, H.; Bannon, E.; Holland, M.; Maciver, R.; et al. An International Evaluation and Guidance Framework for Ocean Energy Technology; Technical Report; IEA_OES: Paris, France, 2021. [Google Scholar]
- Wiser, J.S.R.; Paulos, B. B. Fact Sheet: Cost Reductions for Offshore Wind; Technical Report; Lawrence Berkeley National Laboratory: Berkeley, CA, USA, 2016. Available online: https://eta-publications.lbl.gov/sites/default/files/offshore-wind-fact-sheet.pdf (accessed on 3 May 2021).
- Previsic, M. Cost Reduction Pathways for Wave Energy. In Ocean Energy Systems Annual Report 2012; Ocean Energy Systems (OES): Lisboa, Portugal, 2012; pp. 108–115. [Google Scholar]
| Publisher’s Note: MDPI stays neutral with regard to jurisdictional claims in published maps and institutional affiliations. |
© 2021 by the authors. Licensee MDPI, Basel, Switzerland. This article is an open access article distributed under the terms and conditions of the Creative Commons Attribution (CC BY) license (https://creativecommons.org/licenses/by/4.0/).


