Article

Combining Sufficiency, Efficiency and Flexibility to Achieve Positive Energy Districts Targets

eERG, End-Use Efficiency Research Group, Politecnico di Milano, 20133 Milano, Italy
*
Author to whom correspondence should be addressed.
Energies 2021, 14(15), 4697; https://doi.org/10.3390/en14154697
Submission received: 1 May 2021 / Revised: 13 July 2021 / Accepted: 21 July 2021 / Published: 3 August 2021

Abstract

:
Energy efficiency, generation from renewable sources and more recently energy flexibility are key elements of present sustainability policies. However, we are beginning to see a recognition of the need to couple technological solutions with lifestyle and behavioral changes, sometimes labeled under the term “sufficiency”. Appropriate policies and design principles are necessary to enable sufficiency options, which in turn reveal that there is a bidirectional influence between the building and the district/city level. In this context, the authors discuss how city and building re-design should be implemented combining energy efficiency, flexibility, production from renewables and sufficiency options for achieving a positive energy balance at the district level even within the constraints of dense cities. Based on a review of recent advances, the paper provides a matrix of interactions between building and district design for use by building designers and city planners. It also compares possible scenarios implementing different strategies at the building and urban level in a case study, in order to evaluate the effect of the proposed integrated approach on the energy balance at yearly and seasonal time scales and on land take.

Graphical Abstract

1. Introduction

The challenge of sustainable development of urban areas is of key importance for the European Union, which has defined an ambitious strategy and implementation plans to make cities inclusive, safe, resilient and sustainable, in accordance with the 2030 Agenda for Sustainable Development of the United Nations [1]. Ongoing and foreseen accelerated urbanization in many areas of the world interacts with other challenges, including overpopulation, climate change, environmental quality and access to energy [2]. Urban and regional planning is called to reassess how to sustainably supply the population with the needed services at an affordable cost. Reflecting this, urban actors and scholars have created a number of city labels, such as “sustainable city”, “smart city”, “green city” and “resilient city”, to represent cities’ responses to various challenges of urban transformation. Among them, the ‘smart city’ has prevailed as the most researched concept in the recent period [3], even if it is sometimes presented as being focused only on the application of information and communication technologies (ICTs) and leaving in the background a number of issues related to building a physics and space and social organization. Most recently a “15 min City” concept has been presented that proposes fundamental changes in urban planning aimed at redesigning neighborhoods so that individuals can reach the school, workplace, groceries, sport and recreational sites, etc., within a 15 min travel distance, either by bike or on foot [4,5]. Each neighborhood should fulfil six social functions: living, working, supplying, caring, learning and enjoying. The concept may have relevant implications on energy and material use not only in the area of mobility, but also elsewhere, as we will discuss in the paper.
The EU has been investing in sustainable urban development research for over twenty years [6] and has recently announced the mission [7] to guide the transformation of 100 European cities to climate neutrality by 2030, supporting the cities through different financial means, e.g., the new framework program Horizon Europe.
In particular, the area of “Smart City & Community” has been defined as strategic and a priority since the previous European Horizon 2020 Program, which has funded numerous projects to foster European Smart cities and communities, e.g., [8,9]. Over time, however, it has been realized that financing large smart city projects at the urban level was complex and with a huge demand for resources and investments. As an intermediate step, to be achieved in a shorter time frame, a focus has been developed towards smaller urban areas, such as districts.
In June 2018, the European Strategic Energy Technology Plan (SET Plan), based also on previous planning, has proposed an implementation plan on “Smart Cities and Communities” dedicated to develop 100 smart positive energy districts (PEDs) in Europe by 2025 (Action 3.2), characterized by improved sustainability, livability and going beyond carbon neutrality. The Program on Positive Energy Districts and Neighborhoods (PED Program), led by the intergovernmental Joint Programming Initiative (JPI) Urban Europe, has been established to support this ambitious action, and has realized a review of early attempts to PEDs in Europe [10]. The district approach is mentioned also within Article 19 of the revised Energy Performance of Buildings Directive (2018/844) [11], which, also for the first time, does not limit to energy use of buildings but underlines the link between buildings, mobility and urban planning (recital 28 and article 8). Finally, the Horizon 2020 work program [12] stresses the importance of deploying positive energy blocks and districts by 2050 in Europe to achieve the needed energy transition in cities, in addition to foster the integration between energy systems and improve the buildings’ energy performance significantly beyond the levels of current EU codes.
Within the dedicated calls of the H2020 program, a definition for positive energy blocks and districts is given: “Positive Energy Blocks/Districts consist of several buildings… that actively manage their energy consumption and the energy flow between them and the wider energy system. Positive Energy Blocks/Districts have an annual positive energy balance”.
The PED Program has elaborated a framework definition, which also uses the concept of yearly energy balance and extends from the urban to regional level the boundary of the system where a positive value of the balance should be achieved: “Positive Energy Districts are energy-efficient and energy-flexible urban areas, which produce net zero greenhouse gas emissions and actively manage an annual local or regional surplus production of renewable energy.” [13]. However, according to Lindholm et al. [14] the concept of a positive energy district is still in an early conceptual phase and research to exploit its value shall be taken into account. PEDs may offer interesting replicability and scalability potentials [15], thus it is crucial to identify clearly objectives, strengths and opportunities, via explicitly and univocally defined indicators and with an explicit and structured calculation methodology [16]. A strong critique, backed by detailed optimization calculations, of the yearly net zero energy metric is presented in [17]. The authors apply optimization for example to a district made up of well-insulated apartments, heated by a heat pump and endowed with PV panels and an electric battery. By optimizing with the objective of maximizing the net generation over a year they find that the battery would not be utilized, since “battery losses will result in net increase in electricity consumption compared with the no storage case” hence damaging the yearly energy positivity goal. A conflict arises with the objective of maximizing the use of renewable energy at the time when it is available, that is with the objective of being “flexible” about the time when the district uses energy, either for direct production of services or for storage and delayed use.
Comparing the above PED definitions, it can be observed that in the definition by the PED Program a threefold objective is highlighted: energy-flexibility (though not quantitatively characterized), the target of positive energy balance and that of net zero greenhouse gas emission, which recalls the concept of the zero emission neighborhood (ZEN) [18,19]. Regarding the target of net zero greenhouse gas emissions, it is worth noting that of the 29 districts in Europe that declared a PED ambition in the booklet under development by JPI Urban Europe [10], 19 cases indicate at least one target between carbon neutrality, zero emission or climate neutrality. According to the definitions reported in the IPCC Special Report: Global Warming of 1.5 °C [20], a carbon neutral goal refers to carbon dioxide only, whereas a ‘net-zero’ target includes all greenhouse gases, and a ‘climate-neutral’ goal extends to all causes of radiative forcing.
The framework definition distinguishes three main functions related to PEDs: energy efficiency, energy flexibility and energy production.
Currently, energy efficiency and, more recently, energy flexibility drive the policy practices to achieve high sustainability goals, e.g., a clever utilization of thermal mass may allow one to manage the building as a thermal battery over a time frame of a few days rather than hours, if the building fabric is highly insulated and high efficiency heat recovery on ventilation is applied (as analyzed in Section 3 of this paper). Therefore, in the case of existing buildings, the path of deep renovation focused first at improving the building fabric can be a prerequisite enabler. This flexibility (in new or retrofitted building fabrics) allows dealing with the challenges linked to the intermittent nature of many renewable energy sources and their exploitation at the level of a cluster of buildings. Given the need of a means of storage from the daily to the interseasonal scale, a strong reduction of energy needs for heating and cooling via efficiency techniques and physical and regulatory frameworks that enable low-energy life-styles (i.e., sufficiency, discussed in detail in Section 4) might prove decisive. This would reduce the size of the required storage and the connected embedded energy and energy losses.
At the same time, a strong reduction of energy needs and hence of the physical infrastructures required to serve those needs, appears as a fundamental step for achieving the European and international goals related to halting land consumption. The United Nations Sustainable Development Goal (SDG) indicator 11.3.1: “Ratio of land consumption rate to population growth rate” postulates that when this ratio is high, such a “growth turns out to violate every premise of sustainability that an urban area could be judged by”. In Europe, where population is projected to remain stable or even slightly declining throughout this century [21], the EU institutions have taken a commitment to be “a frontrunner in implementing […] the SDGs” and to aim at “no net land take by 2050” [22,23]. On 29 April 2021 the European Parliament approved with a majority of 605/660 a resolution asking the EU Commission to draft a new directive for the protection of soil with the objectives of “no land degradation” by 2030 and “no net land take” by 2050 at the latest.
Essential to reach the transformation of cities is the involvement of citizens and stakeholders because of their central role in interacting with the buildings and the district’s infrastructures. In this regard, we are beginning to see a recognition (e.g., in some of the H2020 calls, in the IEA outlook 2020 [24], in chapter 5 of the upcoming IPCC report) of the need to couple technological solutions with lifestyle and behavioral changes, sometimes labeled under the term “sufficiency”. However, sufficiency is not simply an issue of choices of each individual: sociological and psychological research indicates the need for enabling infrastructures and social frameworks [25,26]. Hence, appropriate policies and design principles are necessary to enable sufficiency options, which in turn reveal that there is a bidirectional influence between the building and the district/city level.
In this context, the authors discuss how city and building redesign should be implemented combining efficiency, flexibility and renewables production with the emerging new dimension of sufficiency options for achieving a positive energy balance at the district level even within the constraints of dense cities (Figure 1). The paper focuses on the buildings related aspect of the energy district while transports, public spaces and mobility are discussed in terms of their interaction with building infrastructure.

2. Energy Efficiency

One of the key elements frequently present in the current PED concepts is that the district generates more renewable energy than it consumes on a yearly basis. This is achieved by integrating renewable energy systems and energy storage and improving the energy efficiency of the district [14].
An energy efficient district will take into account the energy uses of different sectors and building typologies and it will be constituted by mixed use and relatively dense settlements in order to minimize transportation needs.
Further, it will be characterized by buildings with low energy needs for heating, cooling and hot water, low energy use for lighting and ventilation, energy efficient building service systems, smart energy management and technologies and energy efficient street lighting.
The directive 2012/27/EU [27] requires all EU countries to use energy more efficiently at all stages of the energy chain, including energy generation, transmission, distribution and end-use consumption. In the 2018 recast of the directive [11], the Commission proposed an ambitious energy efficiency target by 2030, regarding final energy use (whichever the source, renewable or non-renewable) and primary energy, and more stringent revisions are ongoing.
In addition, specifically for the building sector, the EU has established the Energy Performance of Building Directive 2010/31/EU [28], amended in 2018 [11], which sets out policies and supportive measures to improve the buildings energy performance and upgrade the existing building stock. The directive requires all new buildings (and major retrofits) from 2021 (public buildings from 2019) to be nearly-zero energy buildings (nZEBs), defined as buildings that:
-
Have a very high energy performance;
-
Cover, to a very significant extent, the nearly zero or very low amount of energy required by energy from renewable sources (including energy from renewable sources produced on-site or nearby).
The detailed choice of indicators, rather than only of the numerical values to be achieved, has been left to Member States. The resulting national implementations of the nZEB concept are hence considerably different in terms of the selected indicators, which makes it difficult to compare nZEBs in different countries [29,30,31,32,33,34].
EU has also promoted research dedicated to find out and clarify the best strategies and technological solutions to make the nZEBs affordable, in order to allow a rapid market uptake and thus helping to achieve the EU’s energy and environmental goals [32,35].
According to ISO 52000-1 [36], the indicators to assess and design a nZEB should be three and should be considered in the following order: (1) energy needs for heating and cooling, to reflect the performance of the building fabric, quantifying and promoting the reduction of energy losses through the envelope and ventilation; (2) total primary energy, to reflect the performance of the technical building systems; (3) non-renewable primary energy for quantifying and promoting the reduction of the non-renewable fraction within total primary energy use. Within the AZEB project, the authors have developed a series of simplified graphical illustrations (Figure 2) and a video to show in a clear and concise way the above concepts and nomenclature [35]. The indicators energy needs and total primary energy do respond to the energy efficiency first (EEF) principle, which is one of the key principles of the Energy Union, intended to ensure secure, sustainable, competitive and affordable energy supply in the EU. The parameter non-renewable primary energy responds to the objective of “increasing the share of renewables”. Reducing energy needs will not reduce the necessity of (and the market for) renewables and controls. On the contrary, it constitutes an indispensable prerequisite for these to be deployed with effective and acceptable results from the social and environmental point of view, including the EU objective of zero “land take”, and therefore for their rapid penetration.
To move beyond the concept of nZEB to that of PED, it should be followed a similar rational sequence of steps, starting by reducing the overall energy use of the district, then covering this use fully with renewables, by making it flexible in order to accommodate short term fluctuations in RES supply, creating an interseasonal storage infrastructure, and providing a set of RES coherent with the territory. On this line, the technical report by the European Commission Joint Research Centre [37] suggests to extend the application of the minimum energy performance requirements by the EPBD from the building’s to the cluster of buildings’ level, keeping the priority on the EEF principle.
Different examples of energy efficient districts are spreading in Europe, characterized by the presence of high performance buildings, which act as a starting point to reduce the overall energy use of the neighborhood, e.g., in the Carquefou district (Nantes), France-Fleuriaye West, all of the new residential buildings are certified Passivhaus [38] and due to the correct orientation of the housing units, the careful design of the envelope, the proper management of solar heat gains and the exploitation of night ventilation, they are able to minimize the energy needs for heating and cooling guaranteeing thermal comfort throughout the year. The choice of energy efficient equipment allows one to further reduce the electric energy use. In Bærum, Norway-Fornebu [39], all the buildings will be nZEB, with the minimum passive house standard and energy class A. In addition, all buildings should be certified according to BREEAM-NOR Excellent. In Bodø, Norway-NyBy Buildings are planned to be built according to the ZEB standard [40].
In a PED not only new constructions but also existing buildings need to be addressed. Presently, roughly 75% of the EU building stock is energy inefficient and the poorly insulated buildings are not suitable for effectively helping the logic of positive energy districts. “Deep renovations” are a necessary condition to allow the building to modulate demand and provide flexibility to the network, as we discuss in Section 3. A unique definition of “deep renovation” or “deep energy renovation” is still not available; however, the literature offers studies and benchmarks that allow one to identify the main targets of this strategy [41,42,43]. A report by the European Parliament (30 July 2012), states that “deep renovation means a refurbishment that reduces both the delivered and the final energy consumption of a building by at least 80% compared with the pre-renovation levels” [44].
To reach and verify these goals, the process should start with the assessment of the existing building performance, proceeding with the design (preferably the codesign in multiproperty buildings), the construction, the commissioning, the management and operation of the building. Recent deep retrofits have proven the possibility to reduce the energy need for heating to 15–20 kWh/(m2·y) even with a limited budget as often is the case in social housing [8]. However, concern has been expressed about the effectiveness of energy efficiency upgrades in bringing about the level of energy savings foreseen at the design stage [45]. The energy performance gap and prebound and rebound effects are often reported when dealing with energy efficiency upgrades and there is relatively ample literature on the subject [46]. To measure and verify the actual building performance, i.e., the energy performance and the indoor environmental quality (IEQ), measurement and verification (M&V) protocols should be implemented after the design phase of a new construction or a building retrofit. Since 1996, when EVO published the so called “International Performance Measurement and Verification Protocol” (IPMVP) [47], different guidelines and procedures have been developed to verify that a building performs according to design expectations, suggest energy saving measures to be adopted to further improve the building performance or to facilitate operation and maintenance. Specific work has been developed to define M&V plans for ZEBs [48] and more recently addressing zero energy settlements [49]. One of the increasingly discussed solutions to mitigate the performance gap is to enhance the awareness of the consumer and encourage a more efficient and sustainable energy-saving behavior at the building [50] and district level. It should be noticed that some measurement campaigns show good agreement between the predicted and actual performance in the case of Passivhaus buildings, which might be a consequence of a particularly accurate design and execution under this voluntary label. A recent report by the Universite de Geneve and SUPSI [51] finds that for the buildings labeled Minergie A and Minergie P, “the analysis yields a negative Energy Performance Gap (EPG) of −14% (i.e., the median building consumes slightly less than its standard), which provides further support for the initial hypothesis that the most efficient buildings are more robust to the EPG”.
Currently there is no formalized standard to calculate an energy balance applied at the district scale but the literature offers the first attempts to define methodologies for the development of positive energy district targets and optimization techniques [16,37]. According to Shnapp et al. [37], the EPBD’s cost-optimality calculation methodology, set up to calculate the minimum performance of individual buildings in MS regulation, might be adapted to establish minimum district performance requirements for zero or positive energy district solutions. We notice here that presently the cost-optimal methodology does not include external costs (including damage due to local pollution and climate change), which are large and increasing, and hence its adaptation to a wider context should in our view include explicitly those “negative externalities” in its calculation methodology [52,53].
Gabaldón et al. [16] have proposed a methodology to support cities at the design stage of a district evaluating its annual energy balance. It follows the approach of the ISO 52000 standard and it is made of eight steps: after the definition of the PED boundaries, the energy needs are calculated and followed by a series of iterative steps that finish calculating the equivalent primary energy, the primary energy balance and an associated Sankey diagram. The primary energy balance is defined in the paper as the difference between the non-renewable primary energy delivered to the district and the renewable primary energy that is exported outside the PED’s boundaries. The authors also warn that “Because it is possible to achieve a Positive Energy District through an unrealistic system (as huge on-site generation, to give an example), a standardized calculation is needed similar to the nZEB rating, where lowering the energy needs is a first requisite to certifying the building (and by extension a district)“.
Both at the district and building level a general critique holds with respect of an energy balance performed over a year when compensation is allowed between different time steps: it allows one to compensate for continued fossil use in some moments (e.g., winter) with overproduction of RES at other times (e.g., summer) This obviously does not lead to zero emissions and requires potentially large interseasonal storage locally or somewhere in the network, with associated land occupation, energy losses and use of materials, embedded energy and related costs. Additionally, the fact of choosing a long time interval for the energy balance creates a conflict with other objectives, e.g., the self-consumption of renewables as already mentioned [17]. As for buildings, some MS such as Italy and Spain have opted for running the balance with only partial compensations, meaning that compensation happens within months but not between different months. Additionally, in fact lower time periods for compensation might be chosen in case more detailed calculation methods [54] would be adopted for the energy certification (e.g., when hourly calculation methods would be adopted) rather than the most current monthly calculation method. A similar method to limit the negative effects of the simplistic yearly balance should be adopted also in performing the energy balance of a district. We offer an example of the issues in the case study presented in Section 5.

3. Energy Flexibility

Demand for energy flexibility is increasing due to the growing penetration of variable renewable energy sources into the energy system. Among non-dispatchable sources, solar power and wind power contribute noticeably to the electrical grid and a generation above a 30% share in annual electricity consumption strongly increases flexibility requirements [55]. This creates a challenge for the energy use in buildings to become in the future flexible, capable to adapt to the needs of the network and renewable production, maintaining standards related to comfort and low operating costs.
Different ways of obtaining energy flexibility can be listed such as the building thermal mass, which can be utilized to store energy, active storage systems such as domestic hot water (DHW) storage and buffer tanks, chemical batteries, connection to more energy networks, etc. [56].
The revised EPBD [11] highlights the importance of buildings’ energy flexibility in relation to the development of a smart readiness indicator, which will assess the technological readiness of buildings to adapt in response to the occupant’s needs, to be flexible according to the needs of the grid and to facilitate maintenance and efficient operation.
It requires that one of the key functionalities of smart readiness in buildings is “the flexibility of a building’s overall electricity demand, including its ability to enable participation in active and passive and implicit and explicit demand-response, in relation to the grid, for example through flexibility and load shifting capacities.”.
Individual buildings or clusters of buildings can provide flexibility. Annex 67 [56] defines the energy flexibility of a building as “the ability to manage its demand and generation according to local climate conditions, user needs, and energy network requirements. It will thus allow for demand side management/load control and thereby demand response based on the requirements of the surrounding energy networks”. Compared to a single building, the flexibility and use of new technologies can in principle be increased by focusing at the district level [57,58] since this might ensure a larger accommodation of RES supply systems and easily flatten the load profiles due to the presence of different occupancy patterns and a potential variety of RES sources and heat sinks (e.g., soil, water bodies, night sky and night ventilation in summer). Besides, a larger scale might offer economies of scale in the case of retrofit actions aggregating groups of buildings and options for energy production and storage, which may not be economically or practically suitable in the case of a single building.
In the literature, a consolidated definition of the energy flexible district is missing; however, different concepts are available to describe the synergy of energy efficient buildings and renewable energy utilization at an aggregated level. In particular, Vigna et al. [59] focused their review on the characterization of the concept of energy flexible building cluster, defining it as a group of buildings interconnected to the same energy infrastructure, which should be able to manage their generation, storage and consumption in response to forcing factors with the aim to exploit as much as possible RES while reducing CO2 emissions. As noted, those objectives are not coincident with the objective of net (or positive) zero energy over a year.
Among the different systems that can compete to determine energy flexibility we highlight in this paper the potential for energy storage of the buildings’ envelope and structural elements, which allows it to accumulate energy when the demand is low in order to reduce it during peak periods. The aim of this analysis is to show the energy demand management ability of different types of buildings to allow preliminary evaluations of the potential within a district, which can include a mix of highly insulated buildings with large time constants and poorly insulated buildings with smaller time constants (as it might happen in historical centers where some buildings present limitations for external insulation). Different studies have shown the potential of structural thermal mass in achieving flexibility. The majority of the studies uses dynamic modeling to identify this potential [60,61,62,63,64,65,66,67,68,69,70]. Fewer studies have been implemented through the realization of experimental campaigns [71,72,73,74]. We provide in this paper (Section 5) the findings from a case study of a multifamily residential building located in Milan, Italy, which has been assessed via modeling and verified through experimental tests. We chose to focus the attention on the potential linked to the thermal mass since it can be considered as a “passive” thermal storage, whose cost is already paid off by energy savings, requiring just one extra investment, i.e., appropriate controllers of the heating system.
The principle underpinning the exploitation of the building thermal mass, e.g., in winter is to increase the building set point indoor temperature to accumulate heat when energy/electricity locally generated by renewables is available and to decrease it when the power production is too low. However, at the same time, it is necessary to guarantee adequate comfort conditions for the users, which can be controlled by keeping the operative temperature within the limits of the occupants’ thermal comfort range as derived from comfort models and made explicit, e.g., in comfort standards (EN 16798 [75] and ASHRAE 55 [76]).
Le Dréau and Heiselberg [63] evaluated the use of thermal mass to modulate the energy use of the heating system, comparing poorly versus highly insulated buildings through energy modeling. They showed that poorly insulated buildings can modulate a large amount of heat only for short periods of time (2–5 h). Contrarily, well-insulated buildings are able to modulate a smaller amount of heat but they can maintain acceptable indoor comfort conditions after a complete switch-off of the heating systems for more than one day. Similarly in [67] they applied an energy flexibility index to show that poorly insulated houses are less energy flexible than well insulated ones. A proper level of thermal insulation allows one to reduce the energy needs for heating and to recover a greater share of the accumulated thermal energy. Their analyses show that the insulation level in a building has the key role in determining its energy flexibility compared to the building’s total thermal inertia, the type of heat emitter or the kind of additional indoor thermal mass. Additionally, Foteinaki et al. [61] have highlighted similar conclusions quantifying, e.g., in more than two days, the period of time during which a low-energy single-family house is able to maintain the temperature above 20 °C, after the heat supply is interrupted.
Currently, a significant part of the existing building stock is still characterized by buildings with low energy performance, which in winter require energy generally in the same morning time slot after the night attenuation. For this reason, it is important to couple this strategy with the deep energy retrofit of the buildings.

4. Energy Sufficiency

The concept of “sufficiency” was introduced by a number of researchers both from the energy and the sociology fields, following the energy crises of the 1970s and 1980s [77,78]; in the 1990s it was brought into the sustainability debate by W. Sachs: “A society in balance with nature can in fact only be approximated through a twin-track approach: through both intelligent rationalization of means and prudent moderation of ends” [79] and “While efficiency is about doing things right, sufficiency is about doing the right things” [80]. Since then the concept has been the subject of a rather large body of academic research [81], sometimes under different terminology frameworks. A recent review of concepts and terminology is offered in [82], which summarizes: “… Samadi et al. [83] make a distinction between efficiency, consistency and sufficiency defined as follows: “efficiency is an option in which the input-output relation is improved…consistency aims at fundamental changes in production and consumption by substituting non-renewable resources with renewable resources…[and] sufficiency is linked to the level of demand for goods and services”. This distinction can be compared with the distinctions of the avoid-shift-improve (ASI) framework [84]: improve matches with efficiency and technological substitution (i.e., consistency), while shift and avoid correspond to lifestyle change (i.e., sufficiency)” (see Table 1).
Recently, the sufficiency concept has been incorporated as a key element into the Energy Plan 2020–2030 of the State of Genève, under the French name “sobrietè” [85], it has been included into the French Law for Energy Transition (2015) on equal footing with energy efficiency and has appeared as an element of future energy scenarios in the analysis of international bodies officially appointed to deal with energy (IEA) and climate (IPCC).
The latest World Energy Outlook by the International Energy Agency introduces explicitly sufficiency actions, described there with the term “behaviour changes”, and their effect on energy use between 2020 and 2030 [24]. IEA included in its list various sufficiency actions, e.g., changing the thermostat settings for summer and winter, line-drying clothes, walking and cycling, working from home, car-sharing, etc. The next Advancement Report (AR6) by the Intergovernmental Panel on Climate Change (IPCC) is expected to cover demand-side solutions in a new chapter (Chapter 5 of the WGIII: Demand, services, and social aspects of mitigation) where “demand refers to end-use demand for services, such as nutrition, mobility, thermal comfort and lighting. It emphasizes services rather than consumption as essential dimension to guarantee constituents of wellbeing” [84,86]. Concrete examples of communities embracing the concept of physical limits, rather than simply of “doing more with less” via technical efficiency, are, e.g., the cities of Amsterdam and Brussels, which have adopted the “doughnut” concept proposed by ecological economist Kate Raworth [87] in which the outer ring of the diagram represents Earth’s environmental ceiling, a place where the collective use of resources has an adverse impact on the planet. Lower energy use, though, should not be confused with lower welfare levels, nor with a concept of restriction or deprivation, either voluntary or imposed [88]. A wealth of research shows that the growth in the use of energy and materials has in many countries reached levels where this use becomes dysfunctional and detrimental to general and individual welfare [89,90], due to its impacts on, e.g., in the case of the large reliance on private cars, “physical inactivity, obesity, death and injury from crashes, cardio- respiratory disease from air pollution, noise, community severance and climate change” [91,92]. Recent work quantifies, on the contrary, the economic benefits of reducing space devoted to cars in favor of green areas [93,94] and the negative outcomes of affluence.
It should also be noted that change in the end-use demand for services/sufficiency is not simply an issue of personal investment choices and behavioral changes at the individual level: sociological research indicates the need for enabling infrastructures and social frameworks [25,95]. This is also summarized in a UNEP report on “sustainable lifestyle” [96]: “A ‘sustainable lifestyle’ is a cluster of habits and patterns of behavior embedded in a society and facilitated by institutions, norms and infrastructures that frame individual choice, in order to minimize the use of natural resources and generation of wastes, while supporting fairness and prosperity for all”. Hence, we explored in this section, institutions, norms and infrastructures that can foster energy sufficiency actions (sometimes overlapping with energy efficiency actions/technologies) at the building and district/city level showing that those two levels are strictly connected.

4.1. Designing (Spaces and Legislation) for Sufficiency

4.1.1. Comfort Scenarios, including Air Velocity and Ceiling Fans

A tendency to develop an architecture fully detached from the external environment and to aim at maintaining internal spaces strictly controlled in terms of temperature and humidity and with essentially zero air movement has dominated the second part of the XX century and the start of the XXI. This was paralleled by a rather narrow interpretation, by the construction and systems industry, of the then predominant comfort model, developed by Fanger [97], proposed for application in mechanically controlled environments. In reality the model allows for a rather large range of temperatures, also depending on clothing and chair insulation and activity levels, and does not mandate for a narrow range of humidity. Fanger states that “the influence of humidity [on comfort] is small” and presents calculations and graphs showing that a change of 1% R.H. produces changes of 1/100 to 1/1000 of a unit of PMV [97], while the comfort range spans from −1 to +1 in terms of PMV [97]. At the same time the adaptive comfort model has been developed based on a large body of data in real buildings [98,99] and was included in standards (EN 16798 [75] and ASHRAE 55 [76]) for non-mechanically conditioned spaces and for conditioned spaces when systems are turned off. The necessity for an extension of the PMV model was acknowledged also by Fanger [100]. The adaptive comfort model, which proposes a linear positive correlation of summer indoor comfort temperature with the average outdoor temperature in the previous week, allows for lower energy needs when compared to a restrictive interpretation and application of the PMV model [101], while providing comfort, based on an a very large database of measurements and surveys [99,102]. Finally the role of air velocity in providing comfort in the warm season at temperatures higher than calculated with the PMV formula has been confirmed in a long series of experiments and included in both EN 16798 and ASHRAE 55. By adopting higher air temperatures during warm seasons, building operators may reduce HVAC energy use by approximately 7–10 percent per degree Celsius of temperature increase [103].
However, in spite of the fact that results from over 35,000 occupant surveys contained in the ASHRAE Global Thermal Comfort Database [99] show that occupants prefer more air movement than they are currently experiencing in buildings, designers still have little guidance for designing rooms with ceiling fans (spacing, sizing and cooling effect) [104] and rarely ceiling fans are considered in the energy concept at the design stage and actually installed and coordinated with the lighting design. A new design and sizing tool has been created and made available by the Berkeley group [105], which also provided results and analysis from the largest study to date of air speeds generated by ceiling fans [106].
The possibility to apply (as a user of a building as much as a designer of a building) efficiency/sufficiency measures such as night ventilation in summer nights [107] and use ceiling fans during the day instead of (or to reduce use of) air-conditioning depends on explicit recognition at the regulation level of the following issues:
(1)
In summer, the same level of thermal comfort, as measured, e.g., via the index predicted mean vote (PMV), can be achieved via various combinations of the physical parameters (operative temperature, relative humidity and air velocity), each scenario leading to different values of energy need for cooling and energy need for dehumidification (if any) [101,108].
(2)
The choice of the comfort category (I, II or III according to EN 16798-1, formerly known as EN 15251, or A, B and C according to ASHRAE 55), which is aimed at the building design and/or controls that strongly affect energy needs [109].
(3)
A number of research works show that comfort category I (A), which is the more energy demanding, cannot be perceived subjectively [110] and it is below the accuracy of measurements [111]. In the EU standard (EN 16798-1), category I (A) is reserved to buildings occupied by people with special needs (children, elderly, persons with disabilities, etc.), but it may nevertheless be perceived by designers and presented to clients/operators as the “best” condition.
(4)
An important parameter affecting comfort in the warm season is the insulation level of clothing and of furniture, as e.g., office chairs (both measured in the unit clo and with indicative values reported e.g., in ISO 7730 [112]). Regulation and cultural norms may actively and explicitly promote the adoption of dressing codes where light clothing in summer is the norm rather than the exception (see e.g., the Cool Biz program in Japan [113]) and office furniture is chosen with low thermal insulation.

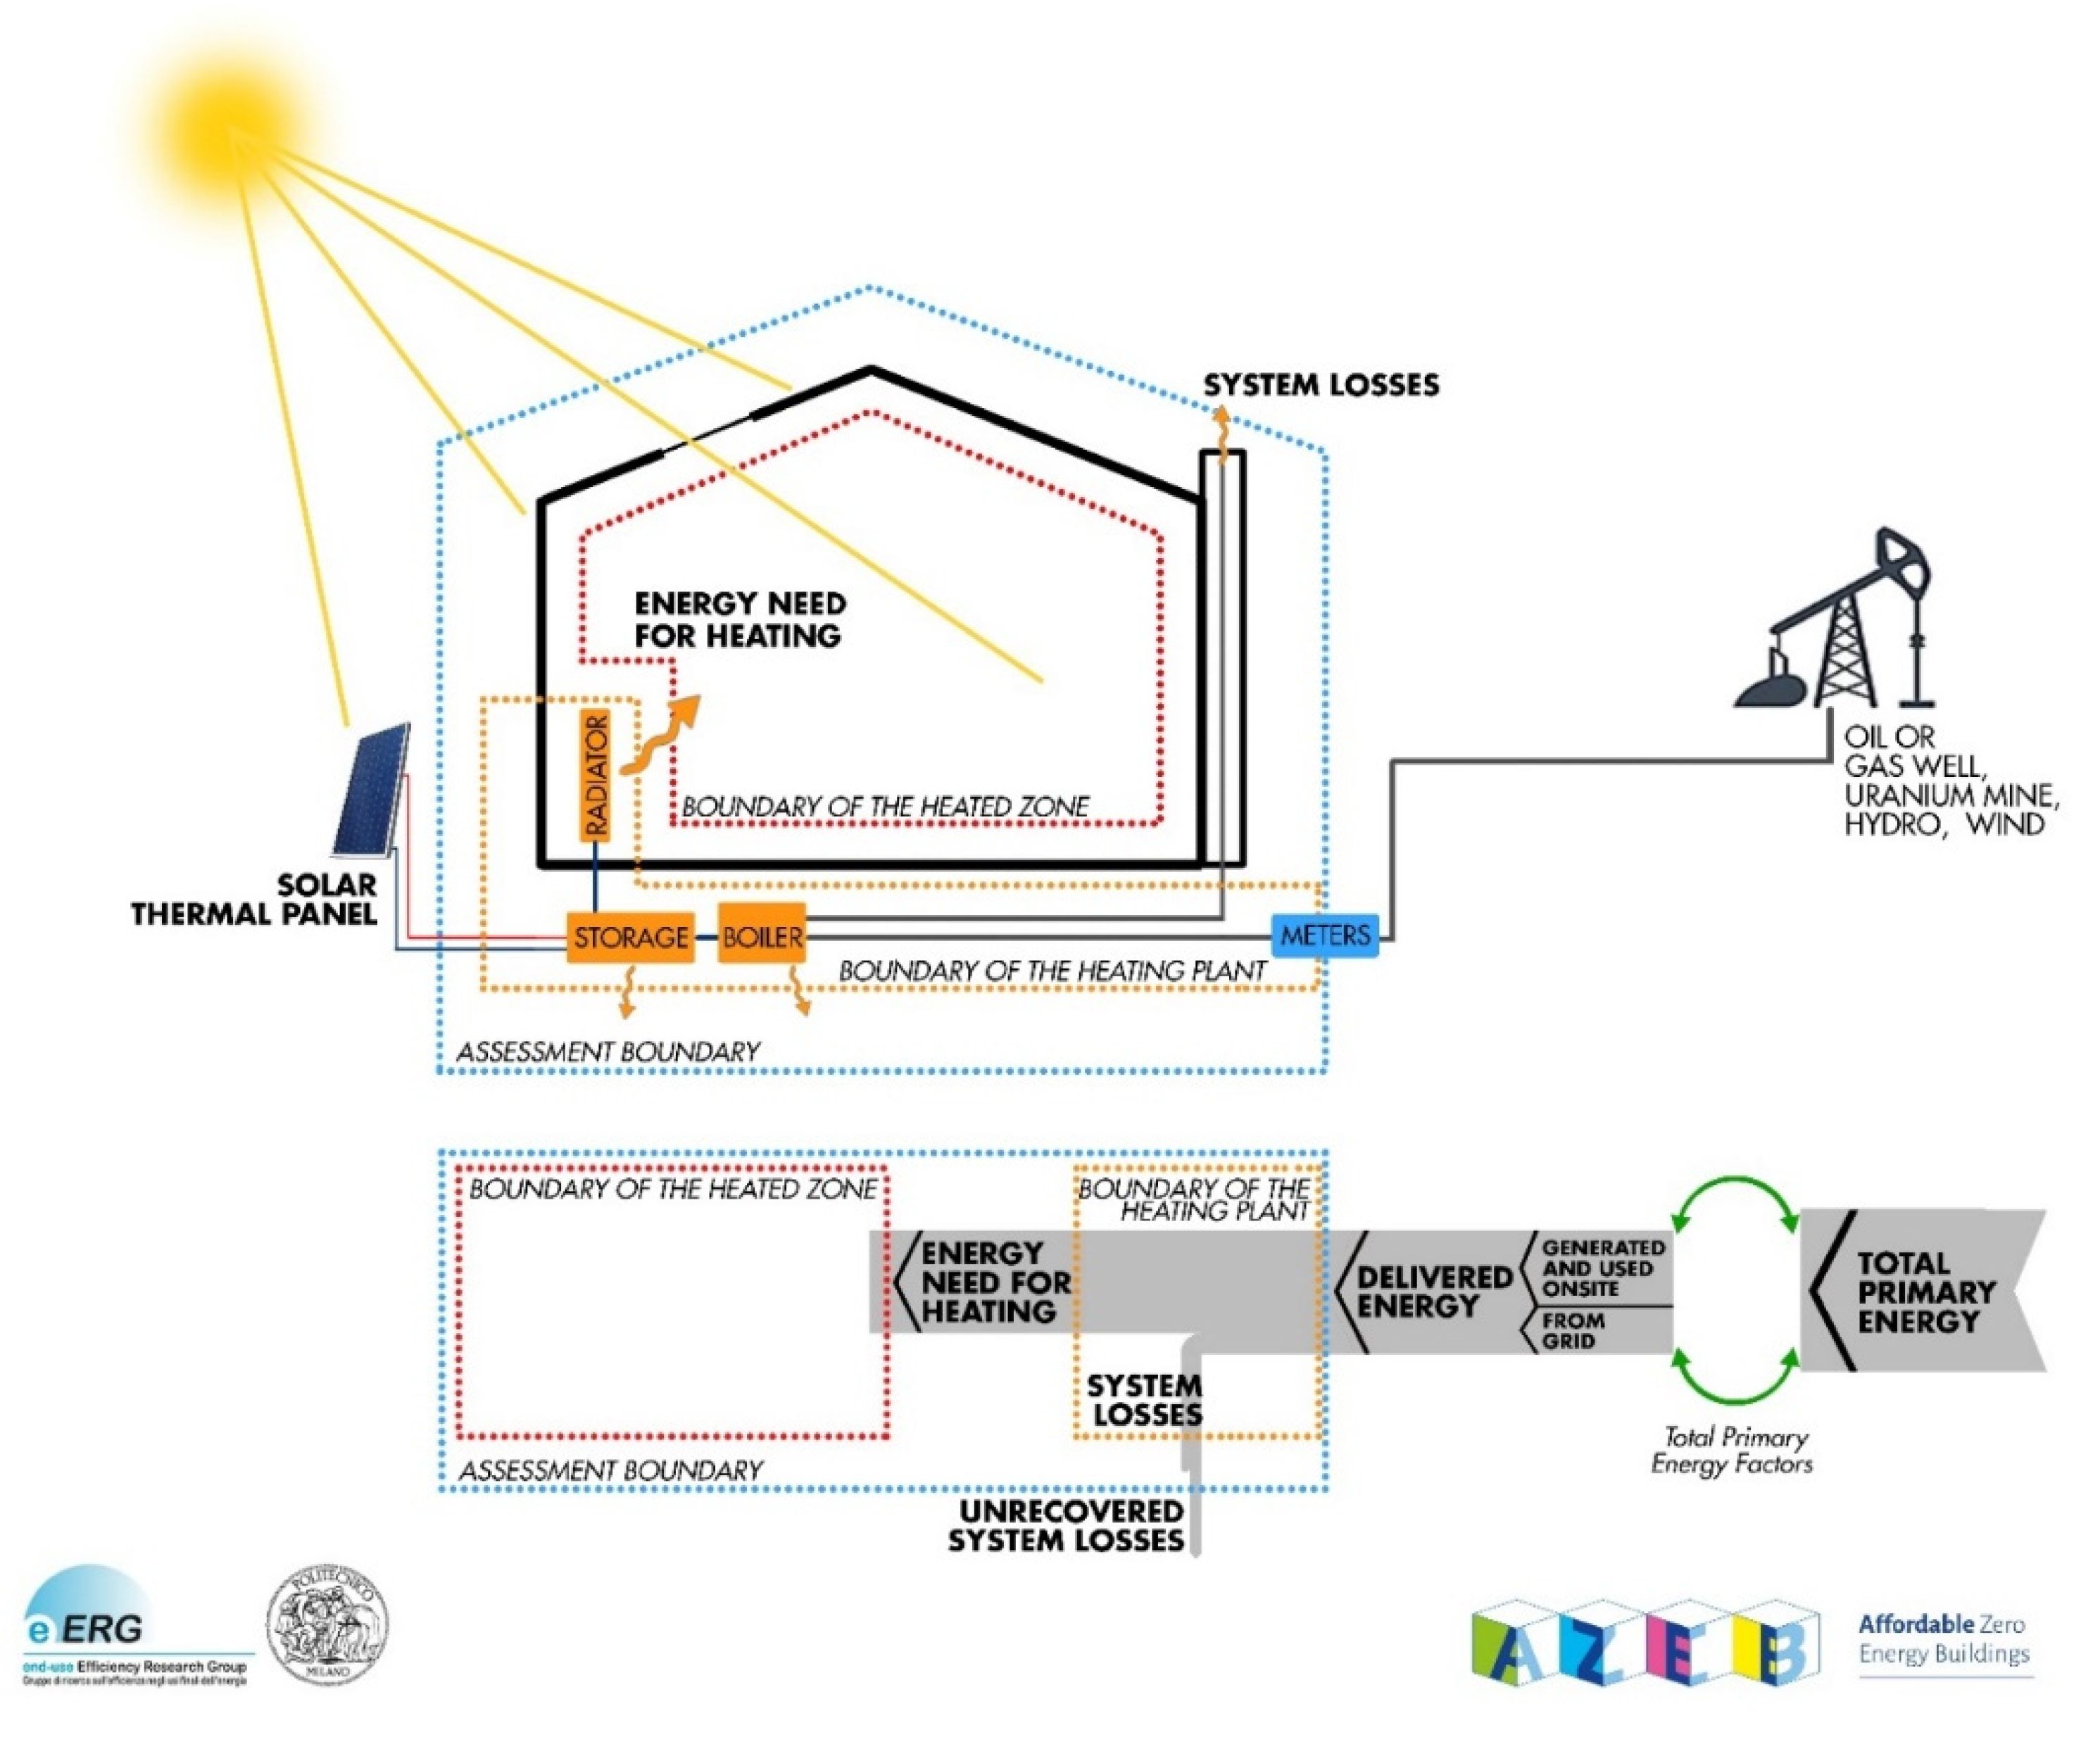
4.1.2. Using Energy Needs and Total Primary Energy as Indicators and Following the “Priority Order” Foreseen in the Standard EN-ISO 52000

A situation where all the actors involved in the development of efficiency/sufficiency measures in the field, regulators and policymakers use consistently the same set of physical concepts, definitions and nomenclature would ensure better final results in terms of comfort levels and energy use and would be a prerequisite for devising clear guidelines for design and construction focused on allowing sufficient behavior and operation. The necessity of using a unified nomenclature in legislation and regulation has been stated very explicitly in a report commissioned by the European Commission on ZEB definition [32] and has been supported in the scientific literature [34] and EU projects [31]. The Standard ISO EN 52000-1 [36] explains which indicators are needed (energy needs for heating and cooling, total primary energy use and non-renewable primary energy use) and why (see Section 2. Energy Efficiency). The indicators energy needs for heating and cooling and total primary energy do respond to the “energy efficiency first” principle and to the aim of quantifying the effect of sufficiency actions, while the indicator non-renewable primary energy use responds to the objective of “increasing the share of renewables”. Lowering the value of those indicators via improvements of the building fabric, by providing a more uniform comfort in spaces and reducing the daily fluctuations of temperature facilitates the adoption of sufficiency actions by occupants of buildings (e.g., adapting clothing, prioritizing use of fans over air conditioning, etc.), which would not be possible in buildings with a poor quality of opaque and transparent envelope components.

4.1.3. Integration of Actions at the Building and District Level

Design of buildings as guided by building codes and city planning are still to a large extent dealt separately. On the contrary, sufficiency (and efficiency) actions in buildings are strongly connected with enabling/hindering conditions in cities. An overview of interactions between districts and buildings favoring efficiency and sufficiency actions and the necessary supporting urban design and regulation is presented in Table 2.

Natural Ventilation and Ventilative Cooling Need Silence and Clean Air; Interactions with Mobility Planning

In the district of Florés Malacca, a group of buildings offers a recent example [114] of holistic planning of buildings and districts. Orientation of buildings and shape and openings of each apartments take advantage of dominant Alisee wind for achieving cross ventilation and cooling the building fabric at night. Ceiling fans are an integral part of the comfort concept. The presence of cars has been limited to an underground parking in order to achieve an acoustically quiet environment allowing the opening of windows for natural ventilation for a large fraction of time without acoustic discomfort and degradation of indoor air quality (IAQ) by external pollution.
Recent actions in large cities (e.g., Paris) aimed at creating opportunities for walking and cycling (in parallel to limiting individual motorized vehicles use and speed) and increasing green areas might allow for better opportunities also in the use of buildings, as in the previous example. Solar protection of streets and small squares is relatively common in some towns in the South of Spain and Portugal and by lowering the air temperature in the street canyon might allow for better conditions for night summer ventilation. The use of spaces for introducing vegetation and low solar absorptance surfaces, if practiced at a large scale, can reduce the heat island effect [115] and maintain the potential for using night ventilation as an effective passive cooling technique.
Analyses performed by the Department of Architecture and Urban Studies of Politecnico di Milano [116,117] show how a combination of diffused coworking spaces and safe biking infrastructure might allow a practice of “near working” coherent with the idea of “15 min city”.
One important feature of some of the above described actions (e.g., shifting mode to walking and cycling for the short-mid range, relocating some type of work) is the fact that they can be implemented quite quickly; some of them have very low cost [118] and deploy effects in a very short time span [119], which are now available in order to limit emissions quickly enough to remain in the 1.5 °C carbon budget [120]. Just between 2011 and 2016 the world has wasted 200 out of 365 GtCO2 of the available 1.5 °C CO2 budget to 2100 [121].

Common Spaces and Dedicated Spaces for Line Drying and Bike Sheltering

Common spaces within buildings favor conviviality and cohesion and may reduce the need for excessively large private (conditioned) spaces. e.g., the Geneve Plan (2000 W) foresees the promotion of common spaces, the rationalization of empty private spaces via “la multifonctionnalité des espaces, le partage et le recyclage de l’espace, des équipements et des biens; la pratique du coworking, le télétravail, les coopératives d’habitation, les colocations”. Common, car-free spaces outdoors (in particular green spaces) can also offer an important alternative to indoor spaces for many activities (e.g., children playing activities, elderly people physical exercise and social interaction) and, hence, deliver multiple benefits (reduced need of indoor-conditioned spaces, reduced pollution and noise and surfaces to be dedicated to heat island effect mitigation [122]). Green spaces between the buildings, on the roof and some facades, help reduce the air and surface radiant temperatures and hence create better conditions for effective summer night ventilation.
A provision for spaces adequate to line drying outdoors (on facades, balconies and roofs) and well designed for convenience and aesthetic can enable this practice, very relevant in terms of energy saving (drying a kilogram of clothes indoors or with a drying machine can be 3–5 times more energy expensive than washing it, due to the high value of the heat of vaporization of water).
Spaces for bike sheltering for all new buildings and renovations (in place of the current practice of imposing car-parking spaces) may support the modal shift and liberate public space for the common uses. The 2018 Energy Performance of Buildings Directive recast [11] calls MS to promote bike sheltering and holistic, coherent urban planning (article 8 and recital 28).

(Hot) Water Savings

Voluntary labeling schemes are available for taps and showers (e.g., the Water Efficiency Label, the Swiss Energy Label for Sanitary Fittings and the European Water Label scheme) and could potentially apply to almost all products used in domestic and non-domestic applications. A variety of water saving devices are available on the market: low flow shower heads and taps, asymmetric commands for avoiding unwanted use of hot water and devices with timers. Particularly effective are devices with the aeration mechanism that make use of the Venturi principle: while water passes through a restriction, its pressure is lowered below atmospheric pressure. Such a depression sucks in a certain amount of air, which mixes with the water, increasing its apparent volume. As an order of magnitude, the water consumption is reduced by 40–50% with respect to a traditional shower at parity of the “volume” feeling. The tendency to install showers rather than bathtubs may also be favored in new design and retrofits with the objectives of encouraging a lower use of water, of facilitating access to the elderly people (especially in places like EU where population is aging) and of saving conditioned space.

Drain Water Heat Recovery

Various heat exchanger typologies are available on the market to recover thermal energy from the water outflow of showers, bathtubs and sinks and preheat incoming water, e.g., in the gravity falling-film method, surface tension and gravity cause falling films of water to adhere to the inner wall of a vertical drainpipe, thus enabling a high rate of heat transfer. The cold water from the aqueduct passes through a coil that is tightly wrapped around the vertical drainpipe. This system can recover 45–65% of the available heat in the wastewater. In cases that a vertical pipe proves difficult to install, horizontal heat exchangers are available, with slightly lower efficacy. The system cost effectiveness is obviously higher in the cases of a large use of water as, e.g., in sport facilities [123].

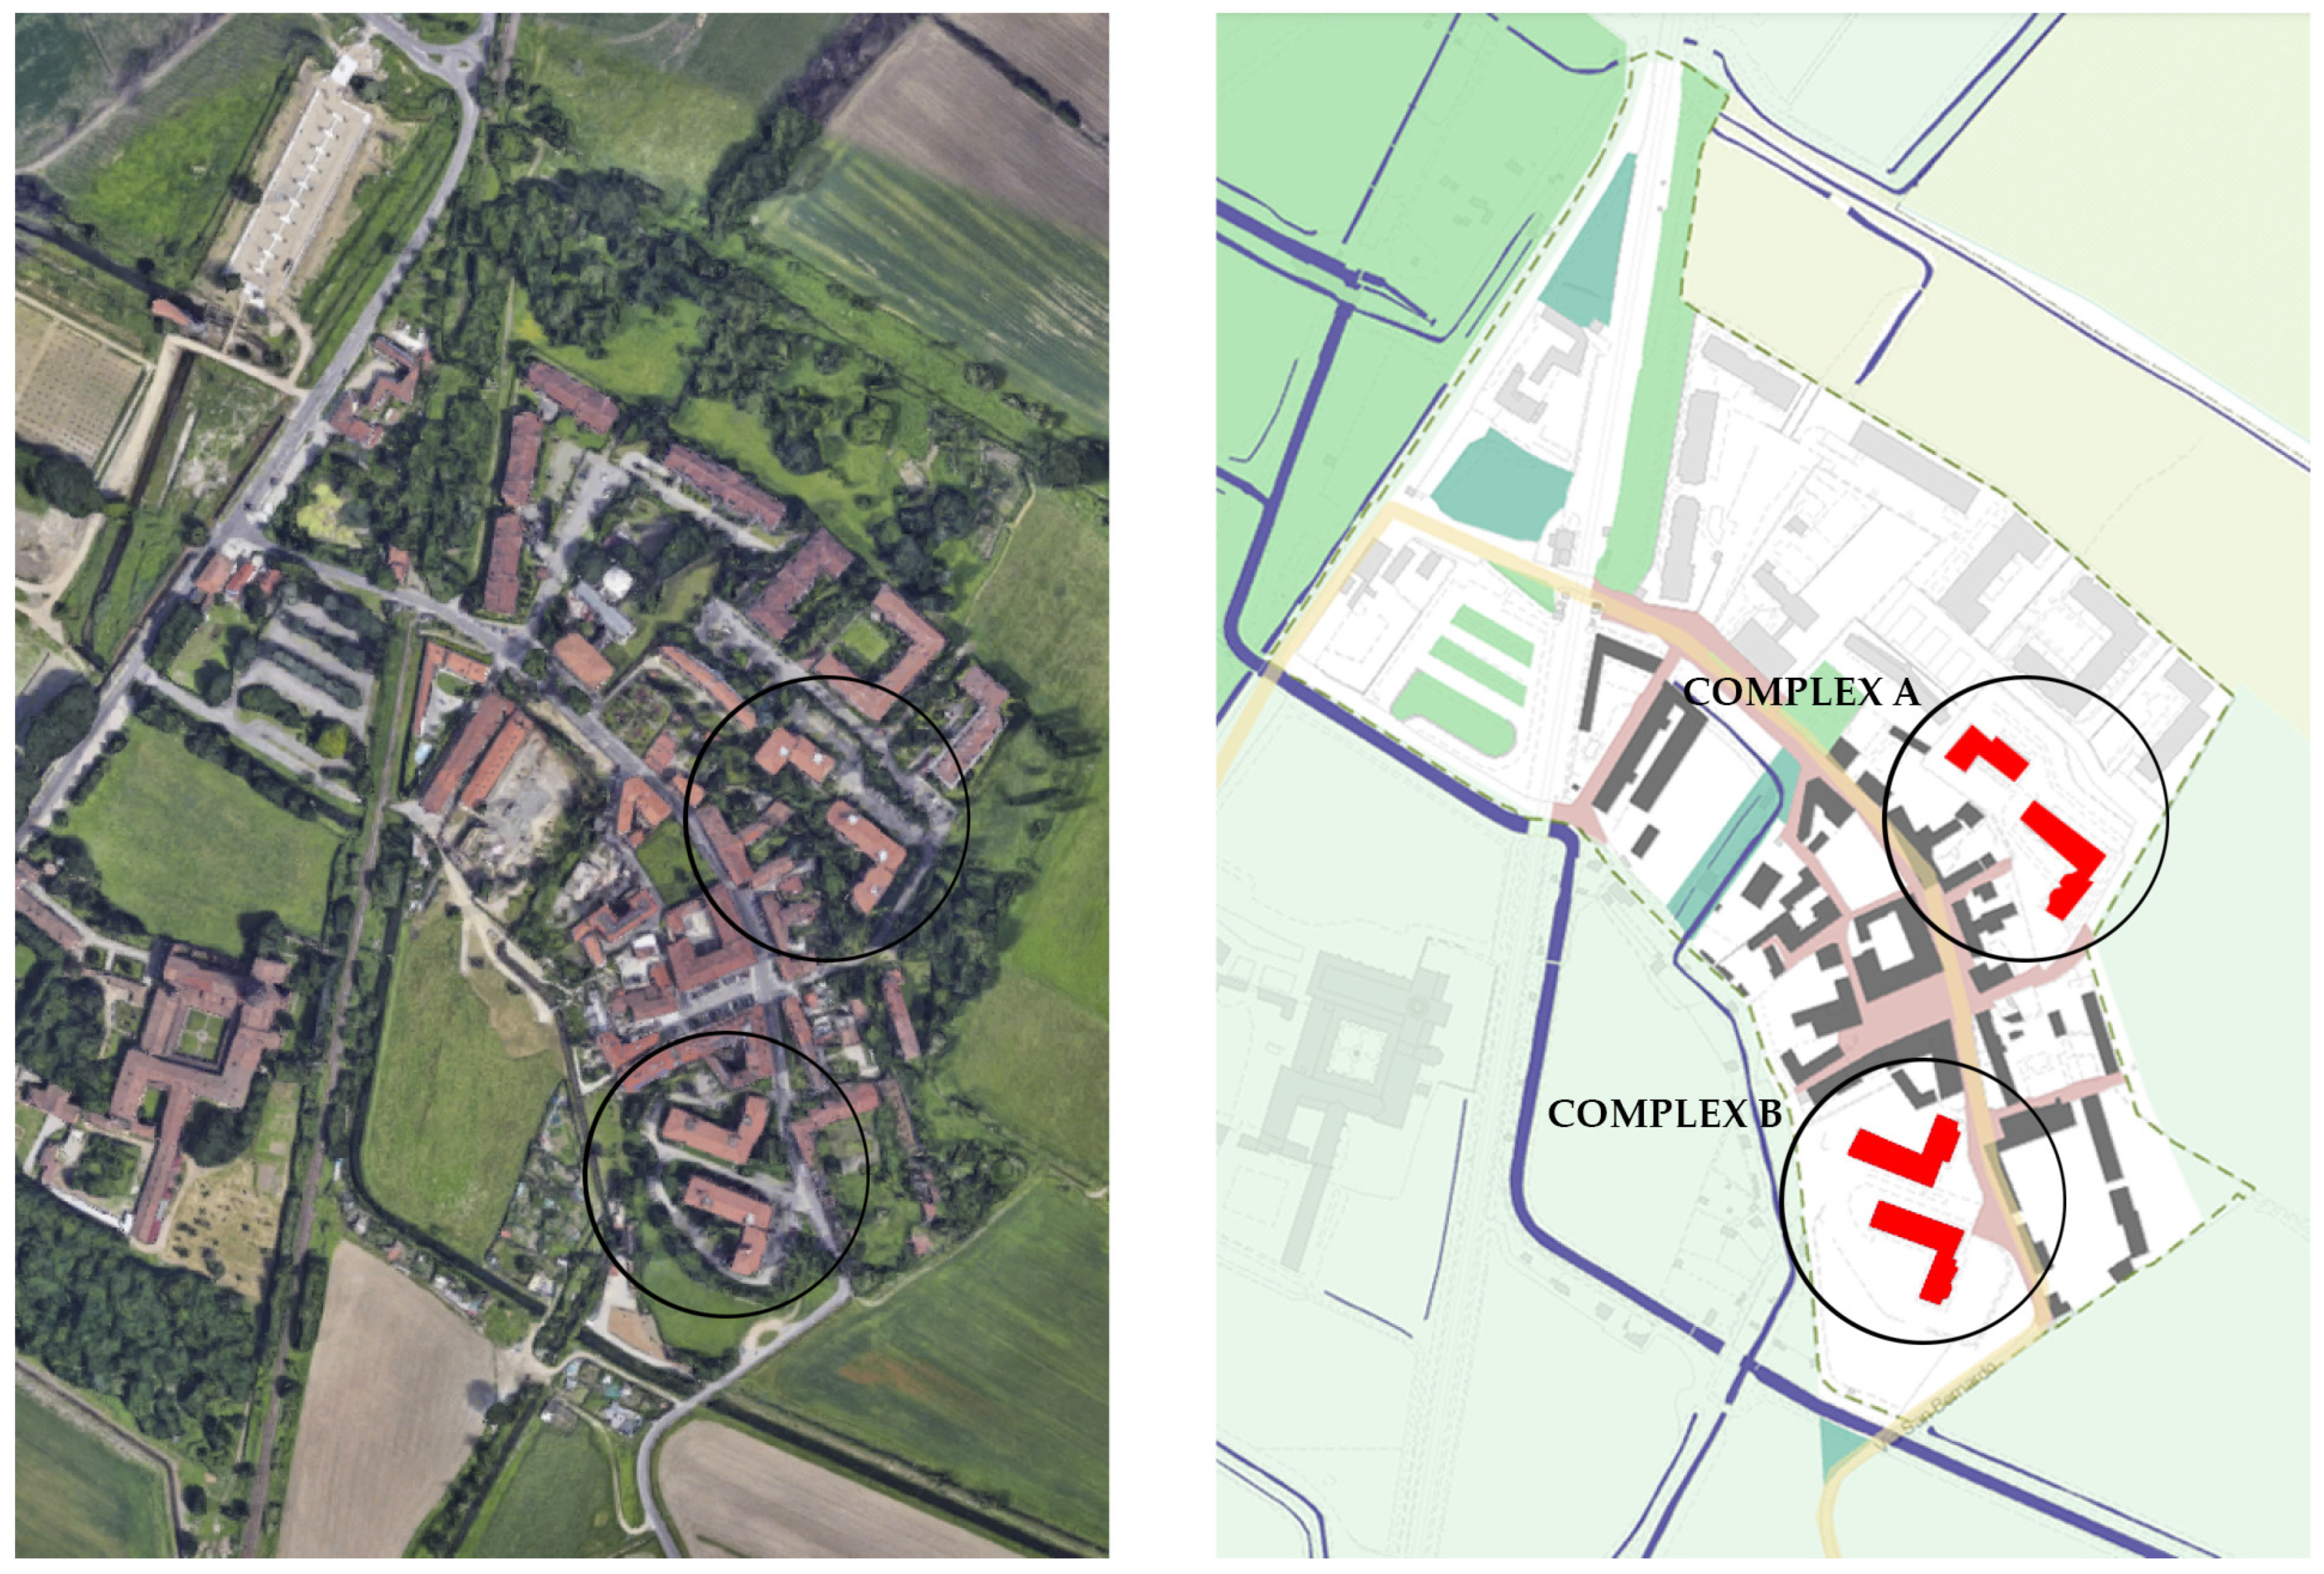
5. The Case Study of the Chiaravalle District in Milan, Italy

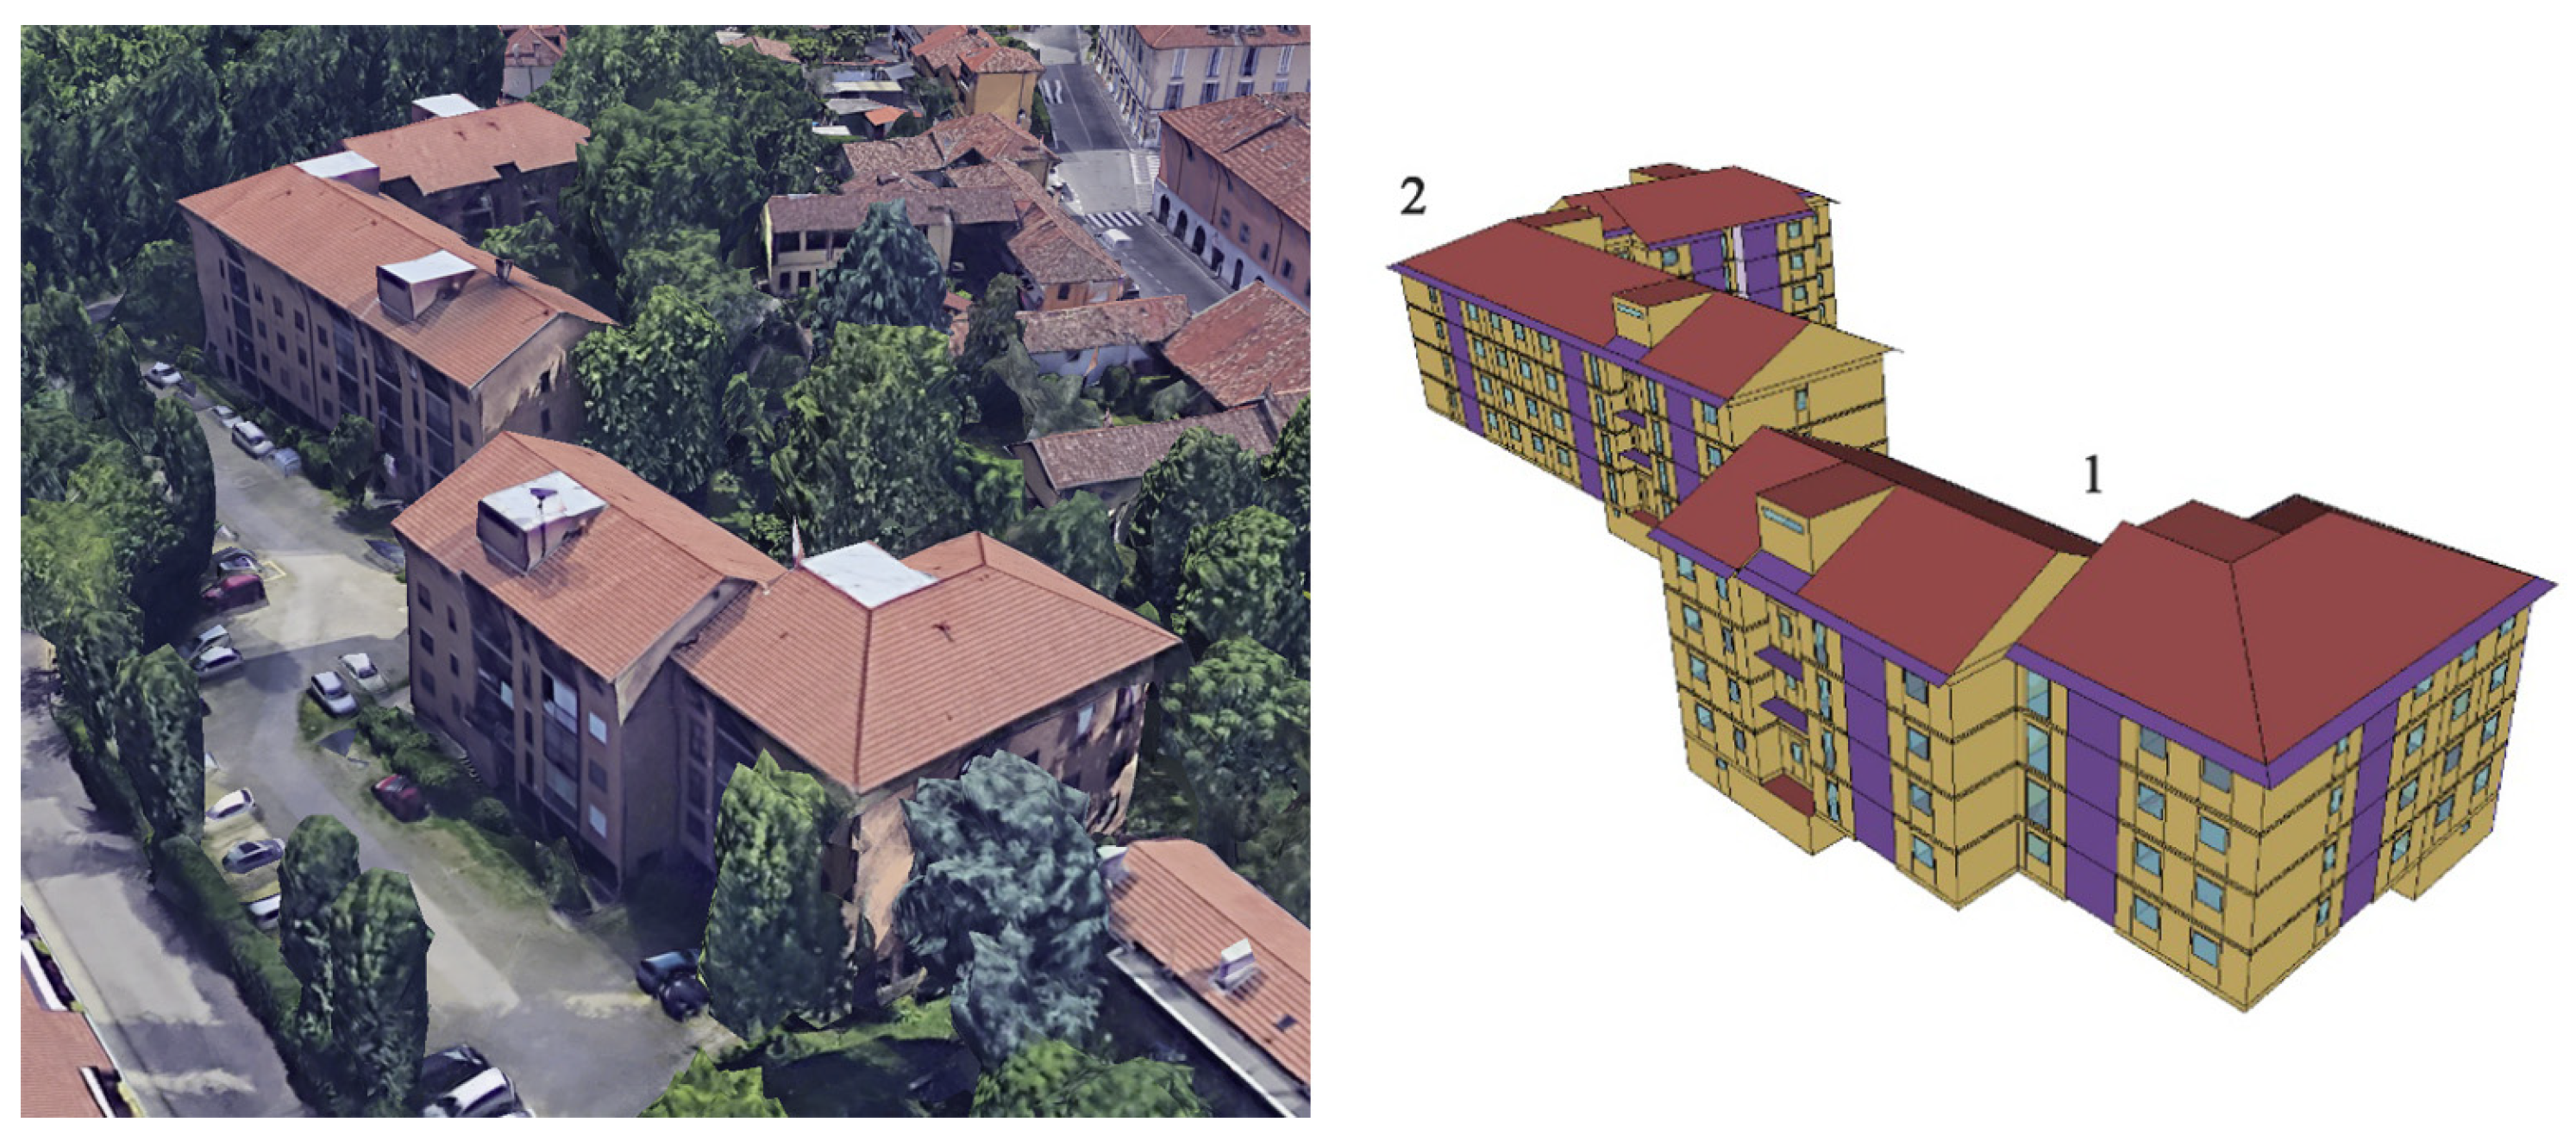
5.1. Description of the Case Study

We present here a case study of transformation of an existing district into a PED where part of the measures have been already successfully realized with the retrofit of multiapartment social housing buildings and a part is under analysis/planning. We performed a “what if” analysis comparing two scenarios:
-
Scenario (A) under which only active systems were upgraded/installed (heat pumps and PV) and there was no change in energy needs/uses;
-
Scenario (B) where a series of efficiency measures and sufficiency enablers were implemented thus strongly reducing the energy needs/uses; in addition, active systems were upgraded/installed.
A strong focus was given to measures for summer comfort in the expectation of a further increase of temperature and exacerbation of the heat island effect. We compared the effects under both a yearly and seasonal (winter/summer) balanced approach and estimated the resulting land take necessary for achieving a zero (or positive) energy balance.
The Chiaravalle district is located in the southern periphery of Milan, Italy, at the border with the Parco Agricolo Sud Milano nature reserve. The size of the project area is around 330,000 m2, comprising a monastery, public and private residential units, public offices, restaurants, hotels and public spaces (Figure 3).
Despite being annexed to Milan, Chiaravalle has maintained the character of an autonomous town. The district is separated from the urban agglomeration of the city by the park and this isolation is reinforced by the scarcity of public transportation to the centre. The district is undergoing renovation in the framework of several EU projects (e.g., EU-Gugle, SharingCities and SATO—self assessment towards optimization of building energy) aimed to rehabilitate the area starting from the deep energy retrofit and the energy optimization of four residential apartment blocks (highlighted in red in Figure 3).
They are public housing blocks, consisting of L-shaped buildings with four stories each. This kind of housing represents an important share of the national public building stock; most of these buildings were built in the 1970s and 1980s and have never been renovated, thus presenting both poor energy performance and serious IAQ problems. The needed retrofit has been carefully planned and executed without moving the occupants out of their apartments.
We focused the analysis on the complex A (Figure 3), but the results can be extended to the complex B, since the buildings are characterized by a similar shape and materials and have undergone the same type of retrofit. A number of similar buildings are present in the national building stock so this analysis may provide indications on the potential of deep retrofitted buildings for sufficiency, efficiency, flexibility and coverage of energy needs via on-site renewables.
The complex is made of two buildings, named Building 1 and 2 (Figure 4). They present a gross surface area equal to respectively 1797 m2 and 2836 m2, accounting for 66 residential units and an estimated population of 210 persons.
The building envelope is made of prefabricated concrete elements and presents a window/wall ratio of 14%. The pre-retrofit state included thin layers of thermal insulation material only in some areas, and presented low performance windows with no proper solar shading (only roller shutters that when operated blocked completely both daylight and ventilation). The centralized heating system used fuel oil as the energy carrier (η = 0.7), whereas each apartment was equipped with a local boiler for DHW generation (η = 0.7), using natural gas as the energy carrier. Natural gas was used also for cooking, while all the other energy uses relied on electrical energy, supplied by the national grid.
The retrofit aimed at improving first of all the energy performance of the building envelope: substantial exterior insulation of the opaque elements including walls, roof and exposed ground floor slab, extremely detailed reduction of thermal bridges, low-e double pane glazing and window frames with thermal break and exterior solar blinds (Figure 5). Table 3 shows the physical characteristics of the building fabric, before and after the deep energy retrofit.
After the envelope renovation design, the project focused on improvements of the building systems, as follows:
-
Installation of a centralized generation system for heating and DHW based on water-to-water heat pump technology (92 kW and a seasonal coefficient of performance (SCOP) of 2.7 according to standard EN 14825 [124]);
-
Installation of thermostatic valves on each radiator;
-
Installation of a centralized mechanical ventilation system with heat recovery and bypass (to allow for free cooling in summer and mid seasons) and an average specific fan power of 2 kW/(m3/s);
-
Installation of LED lamps for common area lighting.
Finally, according to the climatic conditions and to the available roof surface, a PV system for the exploitation of renewable energy sources was designed and installed.
The analysis of the building behavior was performed through the energy model that was developed in an EnergyPlus (Illinois–CA, USA) simulation environment with a high number of thermal zones, in order to be able to assess the behavior of the individual apartments including the effect of the orientation. The geometric modeling was realized on the basis of laser scanning topographic surveys, validated and corrected by on-site inspections and verifications. The model considers the presence of thermal bridges, characterized by the calculated linear thermal transmittance value before and after the retrofit. Building 1 was subdivided into 41 thermal zones and Building 2 in 66 thermal zones. In particular, twenty-two of the twenty-four apartments of Building 1 were modeled as individual thermal zones; the remaining two apartments, which accommodated an advanced indoor environmental monitoring equipment for assessing indoor comfort conditions, were modeled considering a thermal zone for each single room (for a total of about seven thermal zones per apartment). Finally, six thermal zones were dedicated to unheated environments: staircases, basement and attic floor. In Building 2, thirty-nine of the forty-two apartments were modeled as individual thermal zones; the remaining three were modeled considering a thermal zone for each single room (for about seven thermal zones per apartment), whereas eight thermal zones were used for unheated environments.
For the calculation of the energy needs, the heating system was characterized in EnergyPlus by an ideal system able to maintain a temperature of 20 °C during the heating season that is defined according to Italian national regulations from 15 October to 14 April, for the considered climatic zone. During the cooling season, from 15 April to 14 October, an ideal active cooling system able to maintain an indoor set-point temperature of 26 °C was simulated. The mechanical ventilation system was modeled considering 0.5 air changes per hour (ACH) with night attenuation (22:00–6:00) equal to 0.25 ACH. In the pre-retrofit model, an air infiltration value of 0.5 ACH was set for the apartments and staircase units, whereas it was set equal to 1 ACH for unheated areas. In the post-retrofit model, air infiltration was reduced to 0.05 ACH in the apartments and to 0.5 ACH for staircases. After a sensitivity analysis, it was decided to activate the shading devices in the post-retrofit whenever the solar irradiance level exceeded 200 W/m2, simulating an “average” occupant behavior. In the pre-retrofit model, no shading device was considered; only rolling shutters were applied at night-time. To simulate the presence of people and therefore to improve the estimation of internal gains, a schedule based on measured electric consumption was created (the input values were used after a careful analysis on the quality of existing electrical energy data). Further analyses based on data-driven procedures were performed to derive even more detailed occupancy and occupant-related load profiles and are presented in [125].

5.2. Assessing Energy Efficiency Improvements

The effectiveness of the renovation actions was evaluated calculating the energy needs for heating and cooling per net conditioned floor area before and after the deep energy retrofit. The simulations were performed considering as the yearly outdoor weather dataset the typical meteorological year (TMY) file of the location, obtained through the TMY tool developed and updated by the Joint Research Centre of the European Commission.
The weather dataset was characterized by 2593 heating degree days (HDD) and by 69 cooling degree days (CDD), calculated according to ISO 15927-6:2007 [126]. Figure 6, Figure 7 and Figure 8 show respectively the hourly outdoor air temperature, the monthly global horizontal solar irradiation and the frequency distribution of wind speed and direction in Chiaravalle, Milan.
The outputs of the dynamic simulations show, as a result of the deep retrofit, a reduction of the yearly energy need for heating from 147.4 to 16.6 kWh/m2net and of the yearly energy need for cooling from 19.6 to 9.1 kWh/m2net. In summer, the application of natural night ventilation and the use of ceiling fans for achieving comfort at higher air temperature was expected to further significantly reduce the energy needs for cooling. Conservatively we assumed a remaining level of energy need for cooling at 7 kWh/m2y.

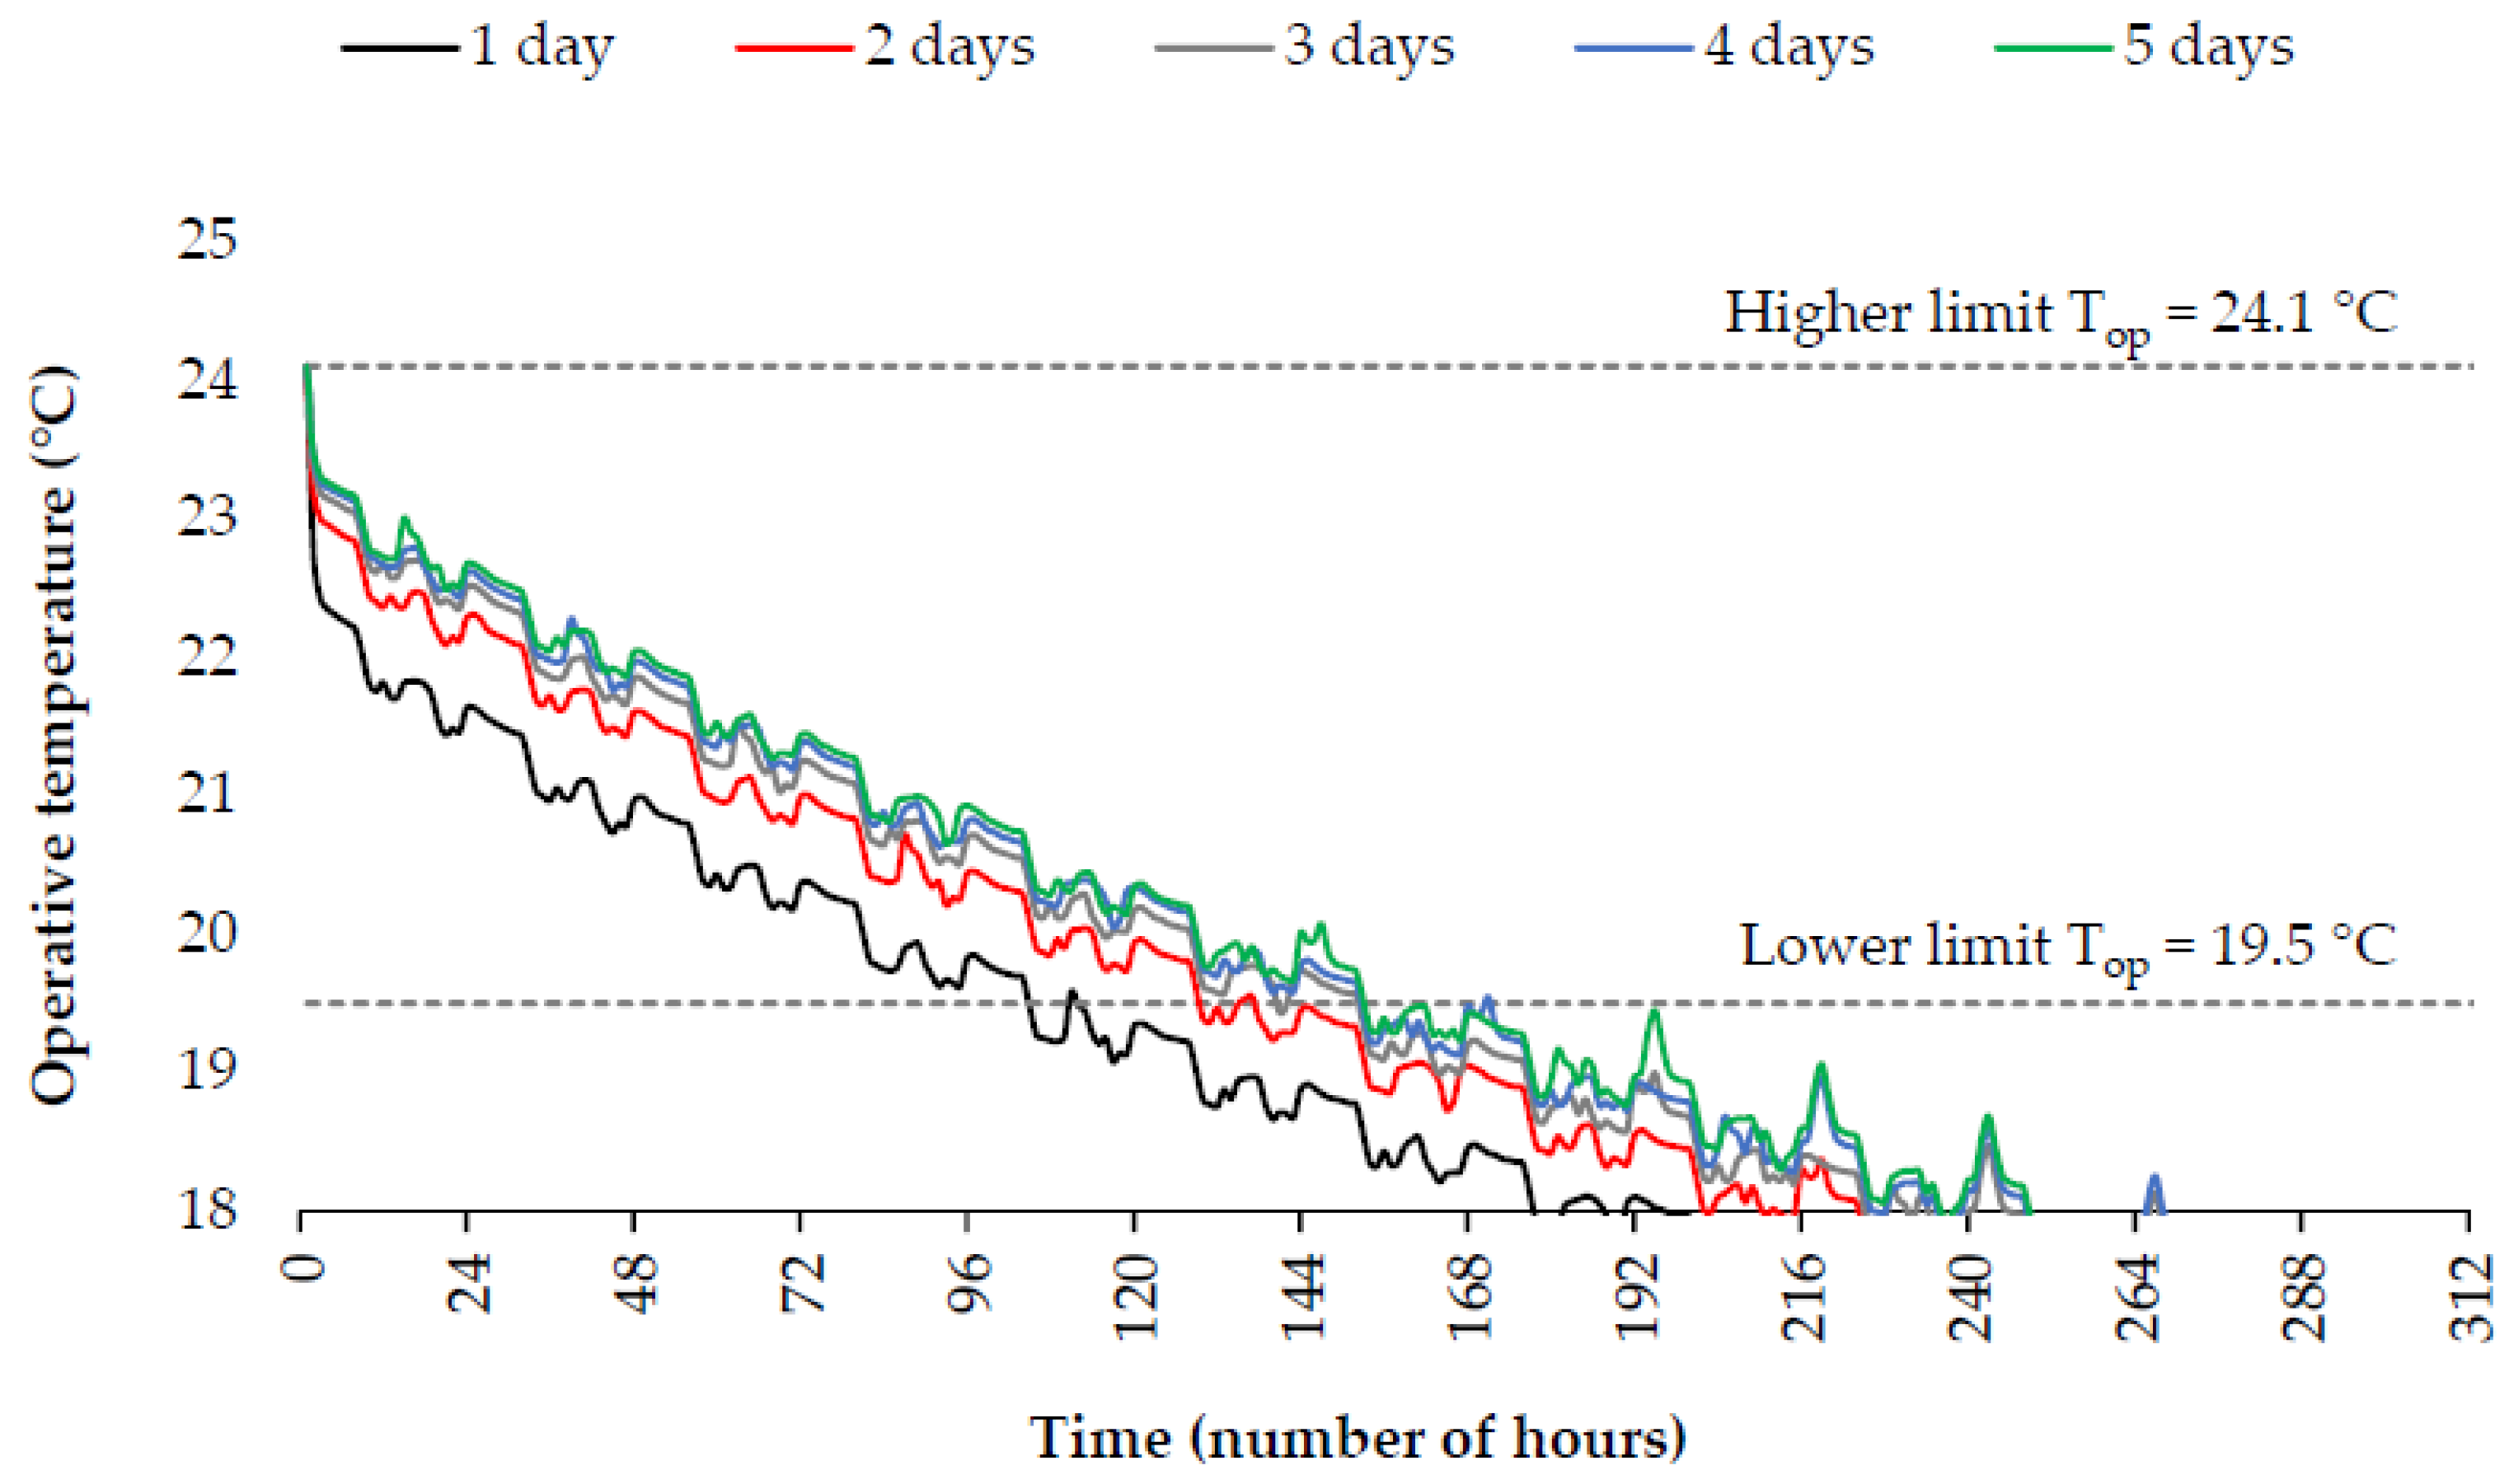
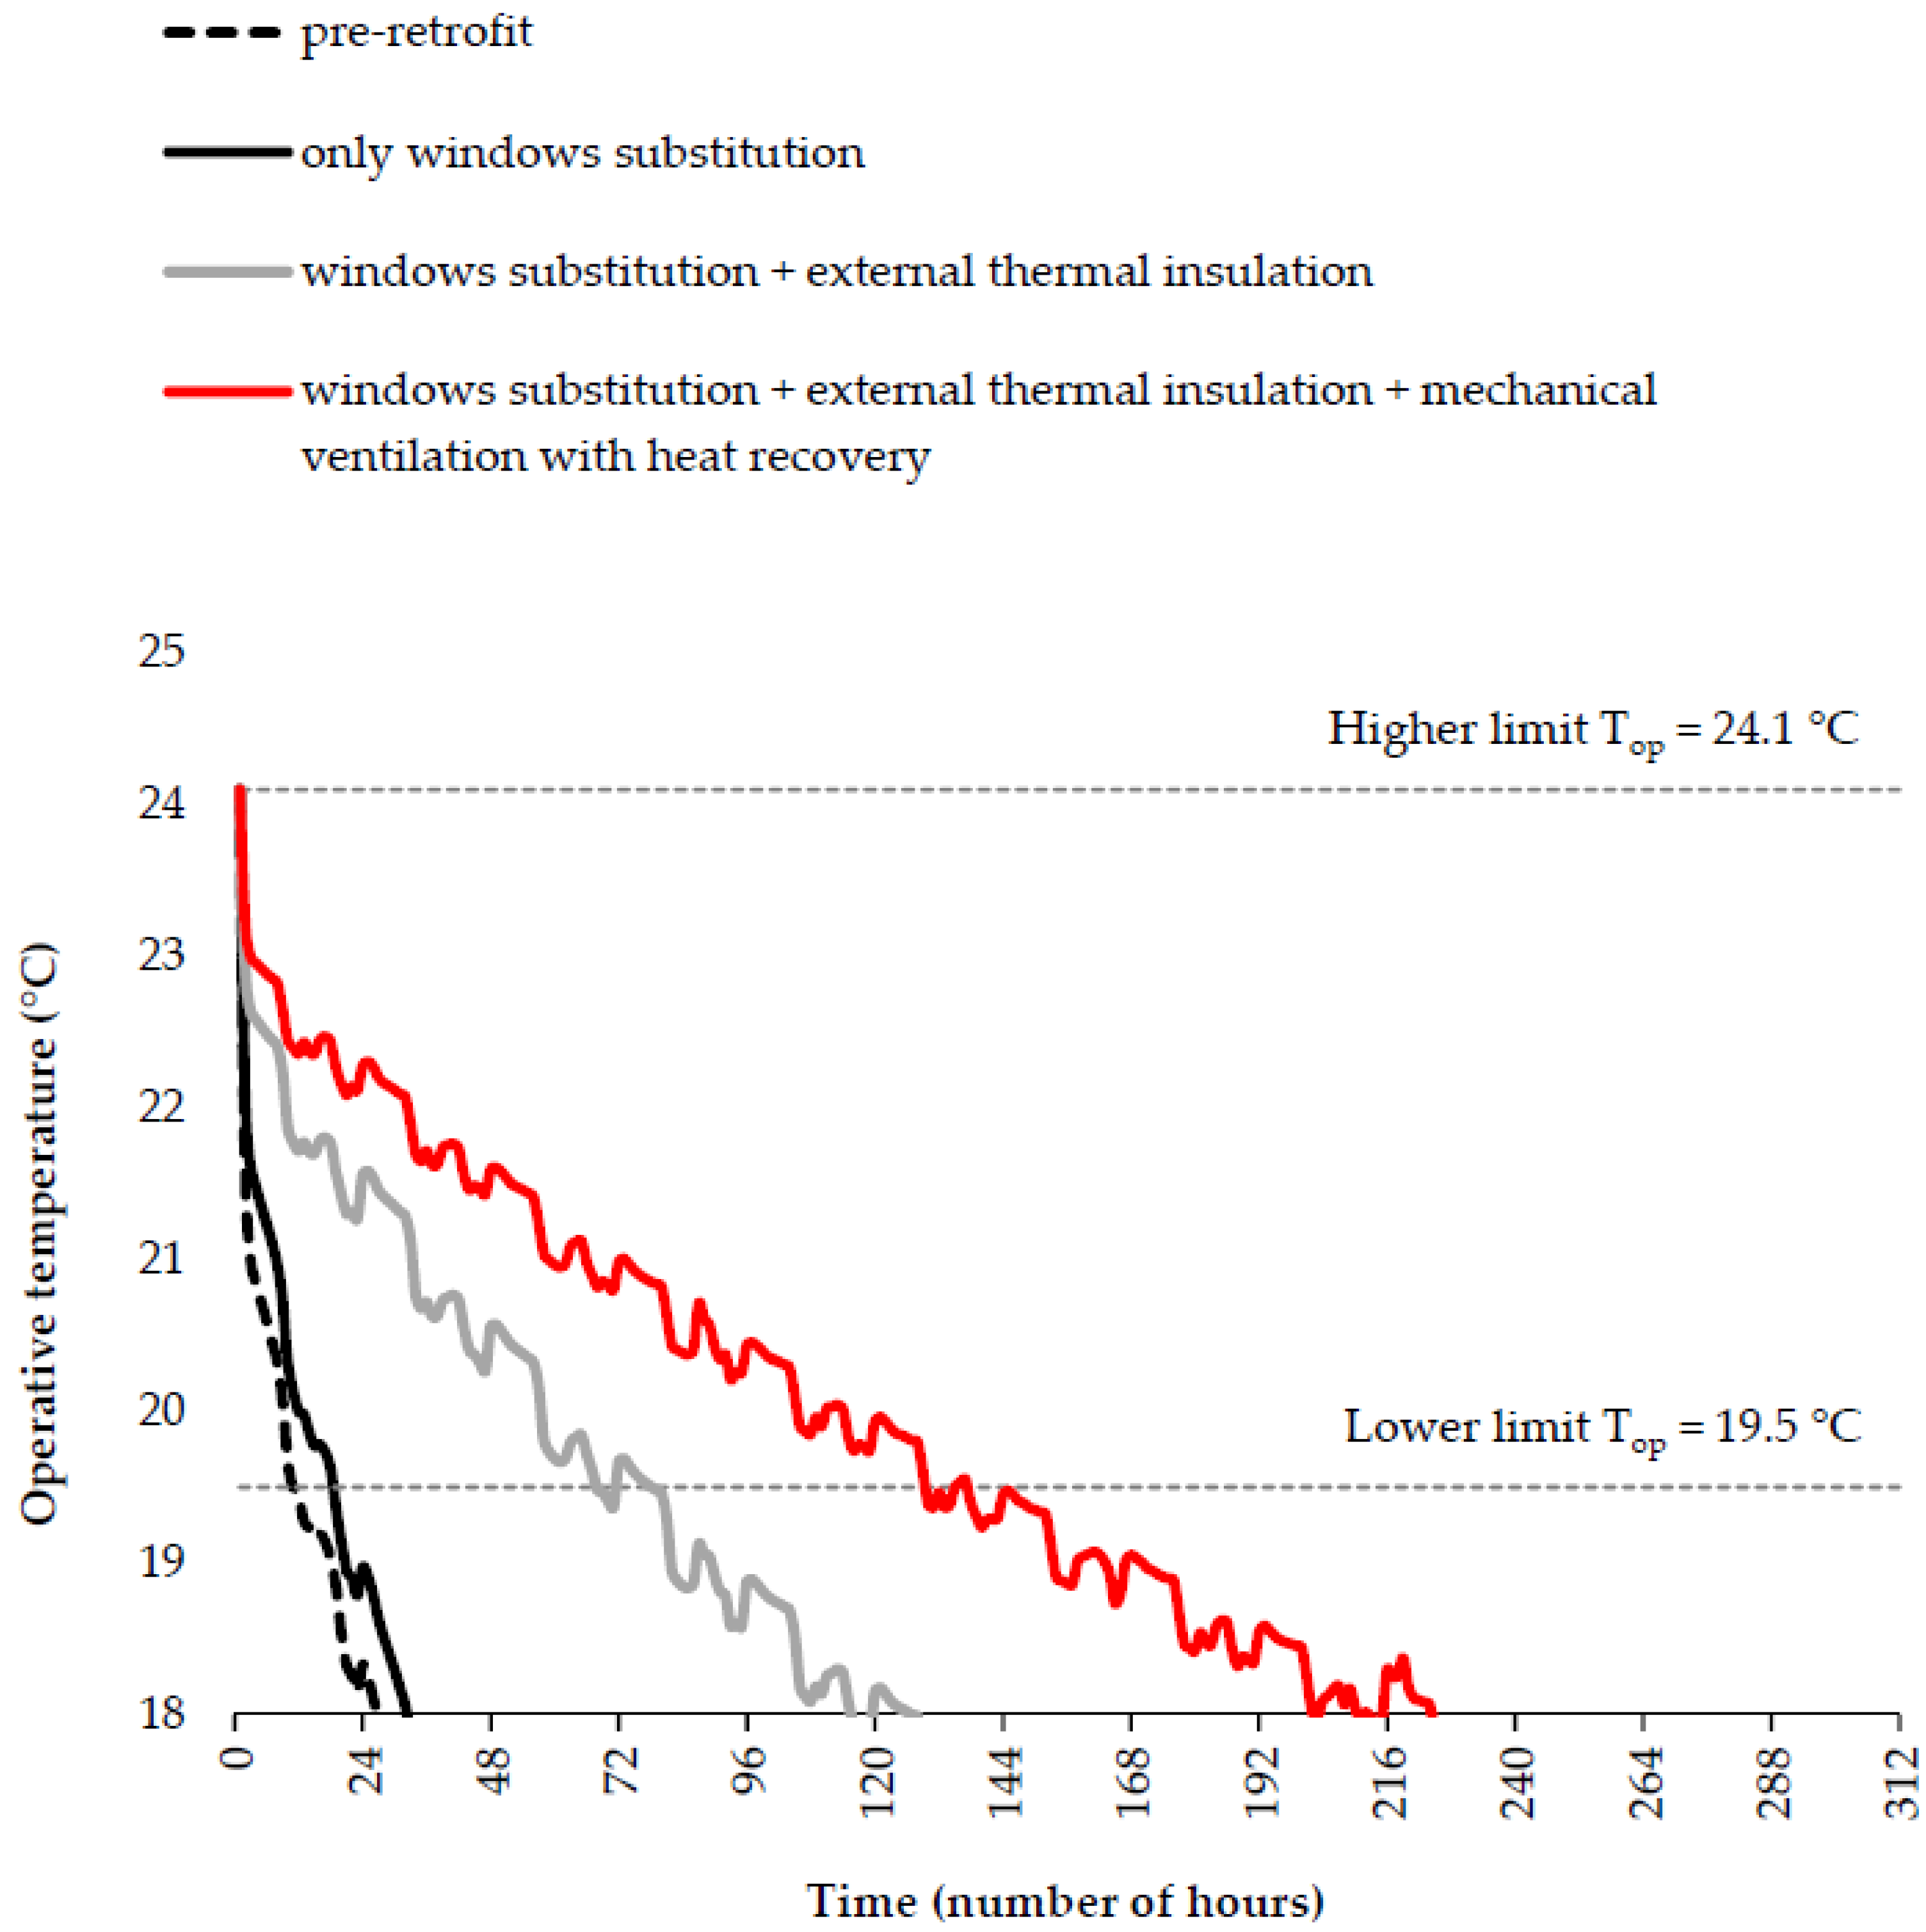
5.3. Assessing the Energy Flexibility Potential after the Renovation

To evaluate the storage potential of the thermal mass during winter [127], after the renovation, in our simulations we brought the conditioned space to an operative temperature of 24.1 °C. This temperature corresponds to the upper value of the comfort range of category II using the Fanger PMV model, when assuming typical indoor winter clothing (1 clo), metabolic activity corresponding to office work (1.2 met), low air velocity (0.1 m/s) and relative humidity (40%) [75].
This temperature was maintained in the simulation for respectively 1, 2, 3, 4 and 5 days. Afterwards the heating system was turned off. In order to eliminate climate variability from the calculation and focus the analysis on the effect of the thermal capacity plus thermal insulation in delivering flexibility, we selected an “average winter day” (Figure 9 and Figure 10), which during a set of simulations was cyclically repeated.
The time interval during which the space remained in the comfort zone (24.1–19.5 °C), under a climate given by the cyclic repetition of an “average winter day”, was different for each of the five cases, but the difference was limited. By heating up (within the comfort zone) the envelope for 1 day, the conditioned space will remain in the comfort zone after turning off the heating system for approximately 4 days (96 h, as shown in Figure 11). By heating up the envelope for 2 days, the conditioned space remained in the comfort zone after turning off the heating for more than 5 days (more than 120 h, as shown in Figure 11). A further increase in the time interval during which the heating was kept on produced marginal results showing that it was possible to activate a large part of the thermal storage potential by keeping the heating system turned on for just one day.
The hypothesis underlying the study is that the increased external thermal insulation of walls, roofs and basements, and the heat recovery on ventilation, considerably extends the time interval during which a building will maintain indoor conditions in the comfort range. This fact will make it possible to: (i) coordinate the demand with the supply of local energy, by removing the current rigidity of energy demand from buildings and thus allow them to “ask for” energy precisely when it is available from local sources (renewable or recovered energy) or to exchange energy with other buildings in a flexible way; (ii) exploit moments of supply overabundance of renewable energy on the grid by making available energy storage capabilities (in the form of thermal capacity of the building fabric) when such moments occur; (iii) manage conditions of energy supply shortage by attenuating the peak power demand on the grid or district heating network (peak shaving, demand response, potential participation in the capacity market creating added value that is in addition to the value associated with energy savings and increased comfort).
In the case of a series of adverse days (night temperature dropping to −7 °C and maximum hourly irradiation reduced to 100 Wh/m2), the time of permanence in comfort after one day of “thermal charge” reduced slightly, to 70 h, e.g., about 3 days.
Figure 12 shows that the substitution of windows and doors was not, by itself, enough to significantly modify the thermal dynamics of a building with a window/wall ratio typical of existing residential buildings in Italy. Thermal insulation of the opaque parts of the building fabric to the level of quality taken under consideration in this case (conductivity in the order of 0.035–0.040 W/(m·K) and a 25 cm thickness of external insulation) was indispensable for obtaining building flexibility (in addition to saving energy by reducing the energy need for heating). Obviously, limiting the renovation to just the substitution of the thermal energy generation system, without any intervention on the building fabric, would have no effect on the flexibility.
Considering the situation before renovation of the building fabric, even delivering heat for one day with a set-point temperature of 24 °C, once the heating system was turned off the building will only remain in the comfort range for about ten hours. The effect of a potential shift of the demand was limited and very costly in terms of energy dissipation. In fact, most existing buildings behaved like short-circuited (thermal) batteries.
Thermal insulation of the building fabric, possibly with the addition of a mechanical ventilation system with heat recovery, proves to be an indispensable condition to enable the building to be flexible with respect to the moment in time when energy is required. Most of the current buildings were “rigid” in this respect and in winter they all needed energy in the same morning time slot after the reduction of the set-point temperature at night.

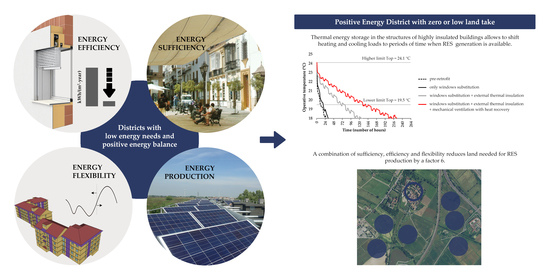
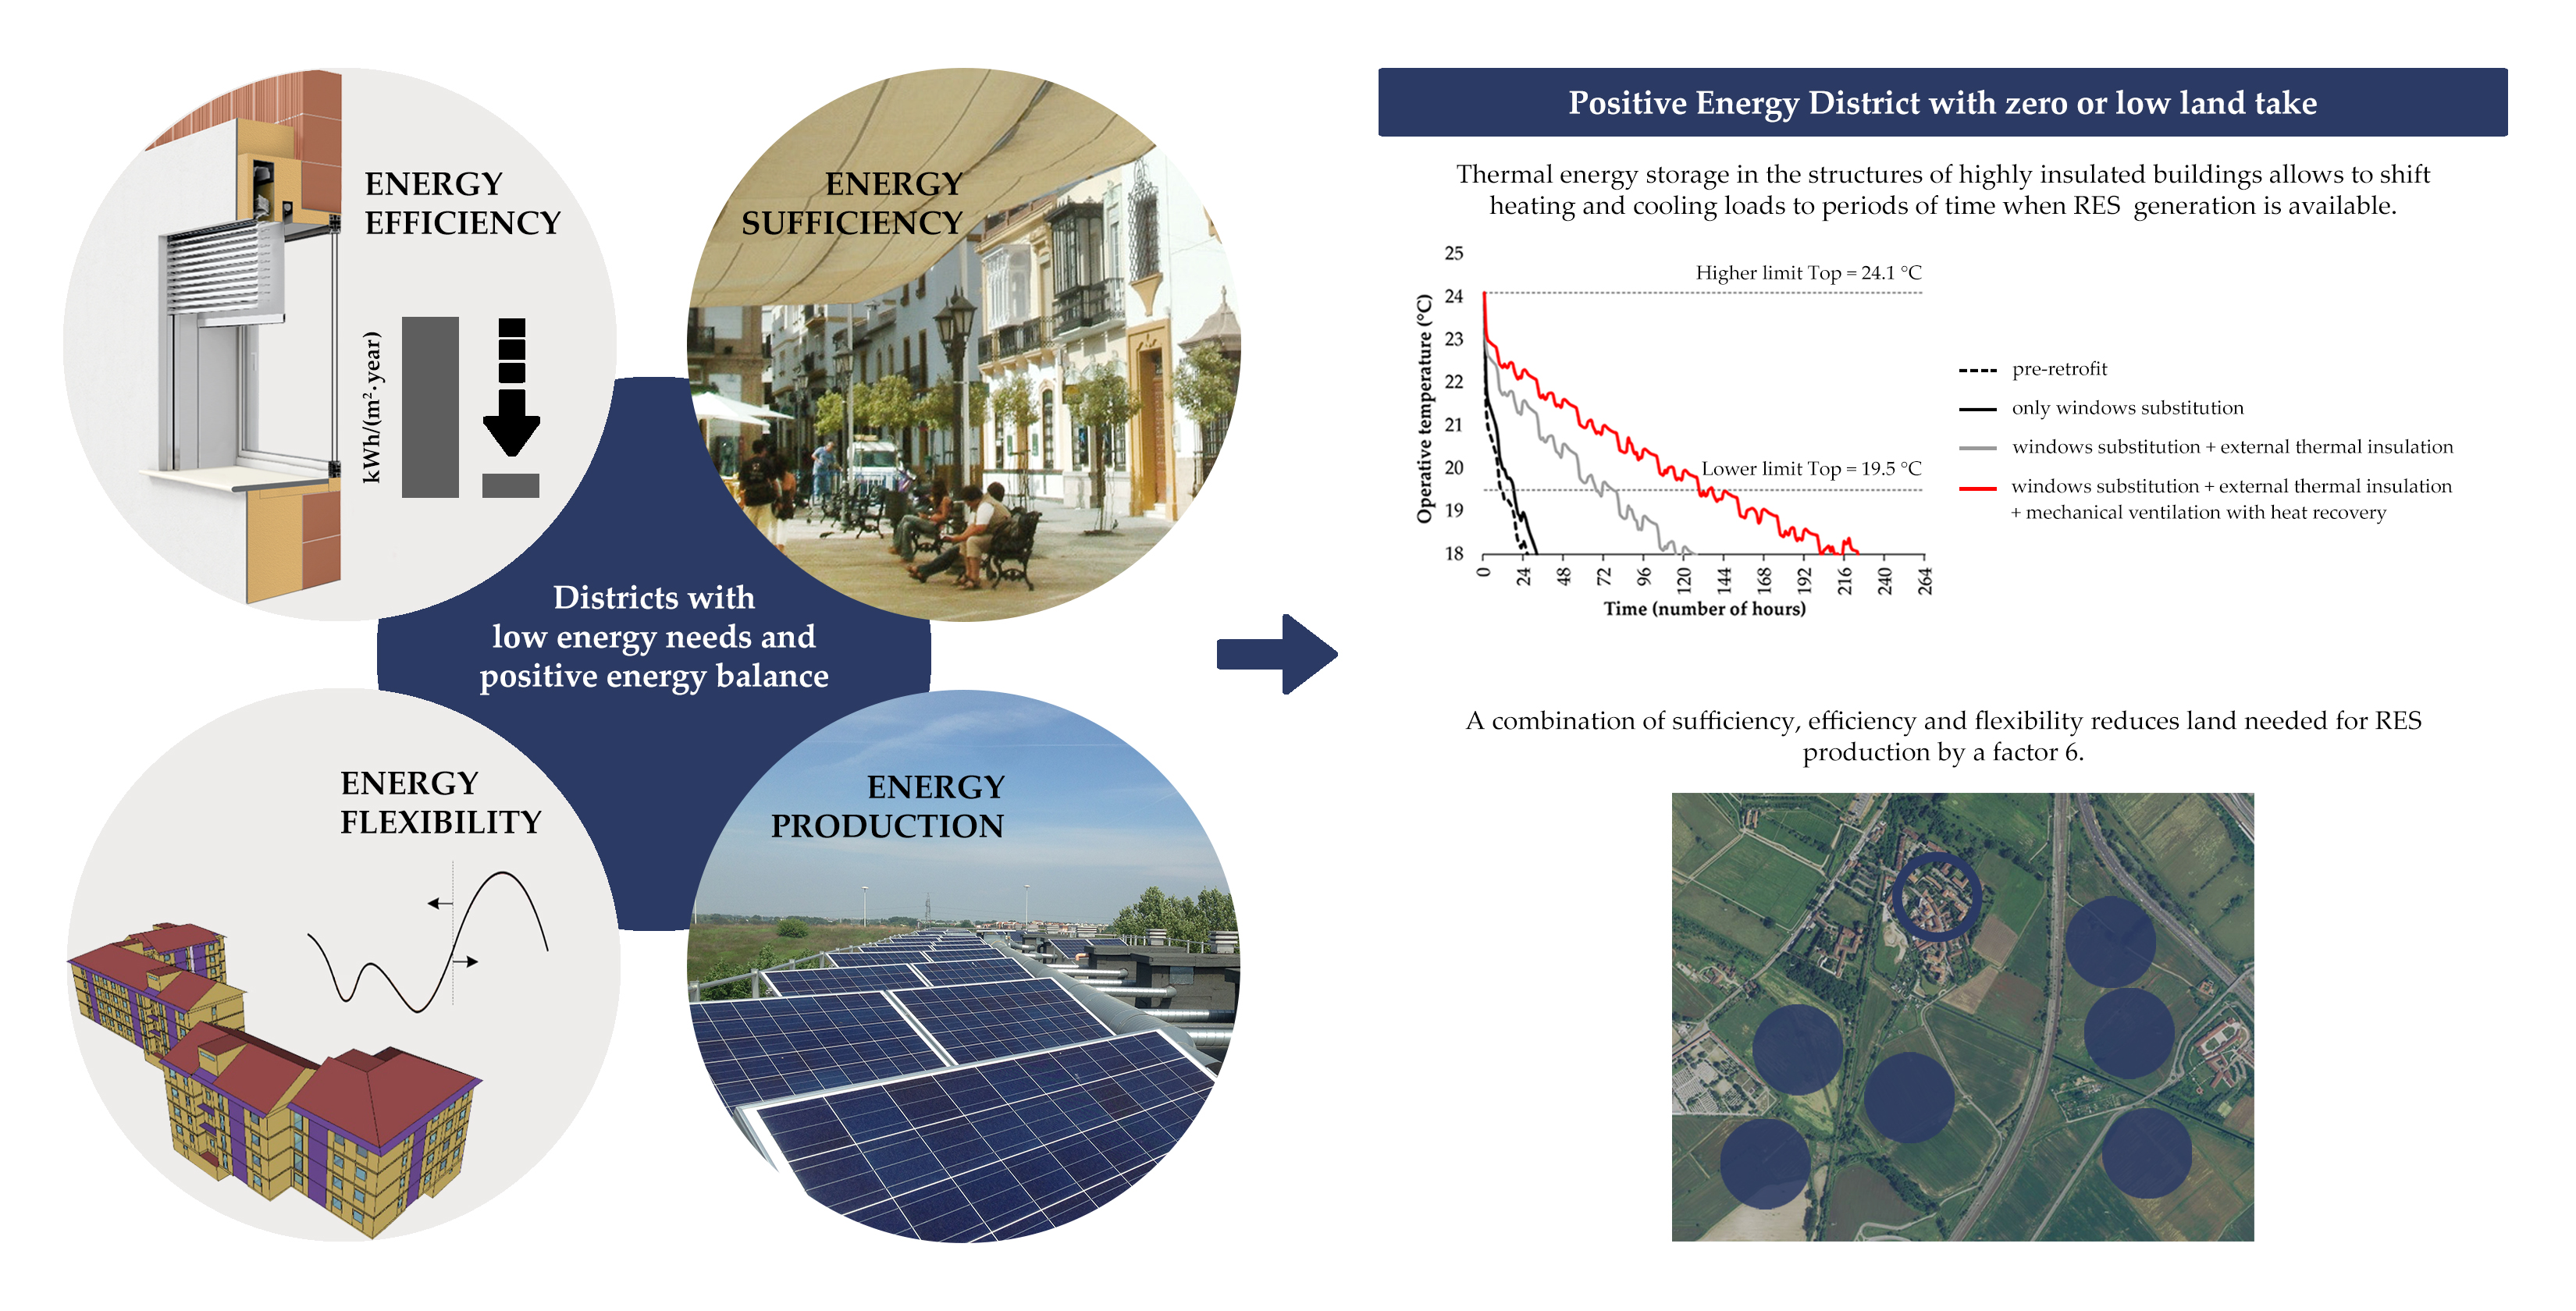
“Storage of Coolness” in the Thermal Mass

The achieved “physical” flexibility will be exploited with the support of the H2020 project SATO. Energy use and state of various systems (heat pumps, mechanical ventilation and PV panels on the roof) and indoor condition of some representative apartments will be continuously monitored and the optimization procedure will provide instructions to the building manager and occupants on how to take profit of the local availability of renewable energy in order to “thermally charge” the structures and avoid energy use at times of low or zero availability of RES energy, taking into account also current and forecasted weather conditions. This “Building as Battery” concept will allow one to combine in the best way “physical” flexibility and control and optimization, where the storage cost will be essentially zero since the insulation that avoids the “batteries” to quickly discharge into the environment is paid back already and in a short time via the energy savings.

5.4. Enabling Energy Sufficiency Actions

As we discussed in previous sections, sufficiency actions could be hindered or enabled by physical and regulatory infrastructures. In the case of the considered Chiaravalle buildings a number of enabling features are already installed, others are in the phase of evaluation and planning.

5.4.1. Enablers Already Approved/Installed

The relatively ample balconies will enjoy external movable shading devices and external movable insect screens (Figure 5); this creates an external area where to spend time in the evening in the summer and mid seasons and allows for night ventilation, complementing the fact that almost all apartments have openings in opposite facades of the building, hence allowing for cross ventilation and heat flushing of the thermal mass. The thick external insulation contributes to greatly smoothing and delaying the heat wave crossing the walls and ceiling, hence reducing mean radiant temperature of the rooms, in cooperation with external solar protections at each opening and cross night ventilation. Some of the occupants spontaneously reported their appreciation for the substantial reduction of the temperature of the indoor surfaces in summer compared to the pre-retrofit situation.
These improvements in comfort by passive means might enable occupants to adopt sufficiency behaviors such as moving to the fresher part of the space, adapting clothing, and avoiding the installation/use of air conditioning units.

5.4.2. Enablers under Analysis/Planning

-
Offering support to families for the choice and installation of efficient ceiling fans, which would allow it to deliver at 28–29 °C, the same summer comfort level as at 25–26 °C according to a large number of experiments and surveys in many world locations and consolidated in the new version of comfort standards (EN 16798 and ASHRAE 55).
-
Installation of a water tap on the balconies for easing the installation and use of simple sprinkles to add evaporative cooling in extreme days.
-
Offering support (or direct installation) of low flow shower heads and heat recovery on drainage water.
-
National funding is available for the above improvements (both for devices and installation cost) up to 65% via tax rebates.
-
Installation of well designed, comfortable to use devices for line drying outdoor, as is traditional in many parts of Italy.
-
Creation of shelters for bikes, cargo bikes and strollers in some of the rooms on the ground floor.
-
Creation of a bike path, separated from the road, along the path of a disabled train line, to connect the Chiaravalle district to the public transit hub of Rogoredo (where it is possible to take long distance trains, urban trains and metro, buses; the Duomo, center of the city, can be joined from Rogoredo in 12 min by metro).
-
Reduction of the velocity limit to 20 km/h in the whole district and the availability of alternatives to private cars (shared electric/cargo bikes and trolleys and an automated small bus taking profit of the abandoned rail connecting Chiaravalle to Rogoredo to allow more flexible rides in addition to the present bus line).
The whole measures for enabling a significant modal shift from private cars to biking and public transit is supposed to reduce the use of a private car from 12,000 to 5000 km per household. In both scenarios it is assumed that a small electric car per family was used, with a performance of 18.6 kWh per 100 km [128].

5.5. Yearly and Seasonal Energy Balance of the District

Based on the data from the literature and our own analyses described in the previous sections of the paper, we drew an energy balance of a representative unit footprint (1 m2) of the buildings, in terms of orders of magnitude. The analysis reported in Table 4 was performed for the entire year and for “winter” (October to March) and “summer” (April to September). We assumed an average height of the building of four stories, which is representative of the district. A number of input data were taken from national statistics, such as average electric energy use/household, flat average size, in order to be able to generalize the result to other situations. Sources of data are indicated in the table; specific calculations performed by the authors are briefly described in the notes and were based on the energy efficiency and sufficiency options analyzed in the previous sections. The objective was to identify the key areas and to draw general conclusions on the feasibility of a net (or positive) energy balance and the land take impact of this objective in the two scenarios:
(A)
In which no action was taken to reduce the energy needs and only supply was improved, by installing a heat pump for heating/cooling and DHW and PV on the rooftop (consistency of supply);
(B)
In which energy needs were reduced by sufficiency and efficiency measures and supply was improved by installing a heat pump and PV on the rooftop and part of the facades (sufficiency, efficiency and consistency of supply).

6. Discussion

The challenge of defining and realizing positive energy districts is made complex by various factors, in particular if the balance is performed over the entire year rather than on smaller time intervals. For example, if one assumes the aim of a net yearly zero (or positive) energy balance between exports to and imports from the grid, using any energy storage creates a penalty by increasing energy use, due to unavoidable energy losses of the storage. Hence a conflict arises with the objective of maximizing the self-use of on-site generated renewable energy at the time when it is available, that is with the objective of being “flexible” about the time when the district uses energy, either for direct services or for storage and delayed use.
Both at the district and building level, another general critique holds with respect to an energy balance performed over a year when compensation is allowed between different time steps: it allows one to compensate for continued fossil use in some moments (e.g., winter) with overproduction of RES at other times (e.g., summer). This obviously does not lead to zero emissions and/or requires large interseasonal storage locally or somewhere in the network, with associated land occupation, energy losses and use of materials, embedded energy and related costs.
In the case of buildings, some MS, such as Italy and Spain, have chosen in their Energy Performance Certificate to perform the balance with only partial compensation, meaning that compensation happens within months but not between different months. Additionally, in the future even lower time periods for compensation might be chosen in case more detailed calculation methods would be adopted for the energy certification (e.g., when hourly calculation methods would be adopted), rather than the most current calculation method, based on monthly average weather data. A similar accounting method to limit the negative effects of the simplistic yearly balance should be adopted also when performing the energy balance of a district.
An additional difficulty arises due to urban density when comparing the load with the available solar production per unit area of the buildings footprint. To show the order of magnitude of the mismatch we performed the assessment presented in Section 5.5. We performed the energy balance at a yearly level and further detailed it into the “winter semester” (October to March) and “summer semester” (April to September) in the two scenarios:
(A)
In which no action was taken to reduce the energy needs and only supply was improved, by installing a heat pump for heating/cooling and DHW and PV on the rooftop (consistency of supply);
(B)
In which energy needs were reduced by sufficiency and efficiency measures and supply was improved by installing a heat pump and PV on the rooftop and part of the facades (sufficiency, efficiency and consistency of supply).
Aiming at a yearly net zero energy balance in scenario A, the energy use was so high that, in order to generate energy with additional PV installed on the ground, it would be necessary to take a land approximately 3.2 times larger than the footprint of the buildings, e.g., by subtracting that land to the adjacent park. However, obviously the balance was made over one year, so this accounting was virtual rather than physical. Even adding a PV plant 3.2 times larger than the district would only bring to zero the “paper” yearly accounting. In physical terms there will be an overproduction in summer and a portion of uses in winter not covered by the PV generation. Hence the buildings would still rely on fossil fuels and continue to generate emissions.
By performing an analysis where the aim is to achieve a zero energy balance per semester (“winter” and summer”), which is making the “paper” balance just a bit closer to physical reality, the land required in scenario A to achieve zero balance in winter was 8.4 times larger than the footprint of the buildings, assuming that no interseasonal storage was available. Achieving a zero energy balance month by month would require even more land.
In scenario B, where sufficiency and efficiency allowed for a significant reduction of energy needs and uses, the addition of a reasonable amount of PV on facades would allow one to obtain on paper a yearly zero energy balance and avoid any additional land use. Obviously, when performing the balance per semester the result was different. A zero energy balance in winter still required additional surface for installation of PV, but this time the surface was 1.5 times the footprint of the buildings and one could imagine to find this surface, e.g., via structures suspended over the parking lots serving the Abbazia, a fraction of the area of the water treatment plant, portions of the adjacent provincial road and train rails in such a way to avoid the need to take land from the surrounding agricultural and park area.
Even in this case obviously there would remain additional penalties for the losses due to daily and seasonal mismatch of generation and use. However, the scale of the challenge and of the use of material and land was reduced by a factor of about 6. In fact the situation in case A would be even more unfavorable, since demand in that scenario was highly inflexible, hence in the physical reality the generated PV will only partially be used onsite due to mismatch between the time of supply and time of demand. In case B the flexibility of demand will be much higher and a better match between generation and demand will be possible. Taking into account the negative effect of inflexibility, scenario A would probably need a land take of at least an order of magnitude higher than scenario B.
In conclusion the problem of land requirement might be greatly reduced when applying efficiency and sufficiency measures, which would drastically reduce energy needs and increase flexibility.
Similarly for meeting the challenge to provide storage at various time scales, from the daily to the interseasonal, a strong reduction of energy needs for heating and cooling via efficiency techniques and physical and regulatory frameworks that enable low-energy lifestyles (sufficiency) might prove decisive since this would reduce the size of required storage and the connected embedded energy and energy losses.
Further research work is required to explore in more detail the potential offered by the combination of a) increased flexibility in demand offered by improvements of the building fabric and heat recovery on ventilation and b) controls that optimize the use of this flexibility based on forecasts of weather, use conditions and renewable generation, e.g., in the following days up to one week. The authors plan to contribute to this further analysis within the ongoing H2020 SATO project.

Author Contributions

Conceptualization, S.E. and L.P.; methodology, S.E. and L.P.; software, S.E.; formal analysis, S.E. and L.P.; writing—original draft preparation, S.E. and L.P.; writing—review and editing, S.E. and L.P.; visualization, S.E.; funding acquisition, S.E. and L.P. All authors have read and agreed to the published version of the manuscript.

Funding

The study was partly developed within the framework of the project SATO (Self Assessment Towards Optimization of Building Energy), which has received funding from the European Union’s Horizon 2020 research and innovation programme under grant agreement No 957128. This study will also contribute to the project FULFILL (Fundamental Decarbonisation Through Sufficiency By Lifestyle Changes), which has received funding from the European Union’s Horizon 2020 research and innovation programme under grant agreement No 101003656, as per the potential role of sufficiency.

Acknowledgments

We acknowledge help in data collection and useful discussions with Arch. S. Bardeschi and F. Manzoni of Municipality of Milano, A. Roscetti and A. Barbieri from eERG-Polimi and stimulating discussions within EERA (European Energy Research Alliance).

Conflicts of Interest

The authors declare no conflict of interest.

References

  1. United Nations. Resolution Adopted by the General Assembly on 25 September 2015-Transforming Our World: The 2030 Agenda for Sustainable Development. Available online: https://www.un.org/ga/search/view_doc.asp?symbol=A/RES/70/1&Lang=E (accessed on 3 July 2021).
  2. Grubler, A.; Bai, X.; Buettner, T.; Dhakal, S.; Fisk, D.J.; Ichinose, T.; Keirstead, J.E.; Sammer, G.; Satterthwaite, D.; Schulz, N.B.; et al. Urban Energy Systems. In Global Energy Assessment (GEA); Cambridge University Press (CUP): Cambridge, UK, 2012; pp. 1307–1400. [Google Scholar]
  3. Schraven, D.; Joss, S.; de Jong, M. Past, present, future: Engagement with sustainable urban development through 35 city labels in the scientific literature 1990–2019. J. Clean. Prod. 2021, 292, 125924. [Google Scholar] [CrossRef]
  4. Moreno, C.; Allam, Z.; Chabaud, D.; Gall, C.; Pratlong, F. Introducing the “15-Minute City”: Sustainability, Resilience and Place Identity in Future Post-Pandemic Cities. Smart Cities 2021, 4, 93–111. [Google Scholar] [CrossRef]
  5. Yeung, P. How “15-Minute Cities” Will Change the Way We Socialise. Available online: https://www.bbc.com/worklife/article/20201214-how-15-minute-cities-will-change-the-way-we-socialise (accessed on 30 July 2021).
  6. Maestosi, P.C.; Andreucci, M.B.; Civiero, P. Sustainable Urban Areas for 2030 in a Post-COVID-19 Scenario: Focus on Innovative Research and Funding Frameworks to Boost Transition towards 100 Positive Energy Districts and 100 Climate-Neutral Cities. Energies 2021, 14, 216. [Google Scholar] [CrossRef]
  7. Proposed Mission: 100 Climate-Neutral Cities by 2030—by and for the Citizens. Report of the Mission Board for Climate-Neutral and Smart Cities; European Commission: Brussels, Belgium, 2020.
  8. Monteiro, C.S.; Causone, F.; Cunha, S.; Pina, A.; Erba, S. Addressing the challenges of public housing retrofits. Energy Procedia 2017, 134, 442–451. [Google Scholar] [CrossRef]
  9. Calzada, I. Replicating Smart Cities: The City-to-City Learning Programme in the Replicate EC-H2020-SCC Project. Smart Cities 2020, 3, 978–1003. [Google Scholar] [CrossRef]
  10. Europe towards Positive Energy Districs. A Compilation of Projects towards Sustainable Urbanization and the Energy Transition; Urban Europe: Vienna, Austria, 2020.
  11. Amending Directive 2010/31/EU on the Energy Performance of Buildings and Directive 2012/27/EU on Energy Efficiency. In Proceedings of the Directive (EU) 2018/844 of the European Parliament and of the Council, Brussels, Belgium, 30 May 2018.
  12. Horizon Work Programe 2018–2020. Secure, Clean and Efficient Energy; European Commission: Brussels, Belgium, 2020.
  13. Framework Definition for Positive Energy Districts and Neighbourhoods; Urban Europe: Vienna, Austria, 2019.
  14. Lindholm, O.; Rehman, H.U.; Reda, F. Positioning Positive Energy Districts in European Cities. Buildings 2021, 11, 19. [Google Scholar] [CrossRef]
  15. Alpagut, B.; Akyürek, Ö.; Mitre, E.M. Positive Energy Districts Methodology and Its Replication Potential. Proceedings 2019, 20, 8. [Google Scholar] [CrossRef] [Green Version]
  16. Moreno, A.G.; Vélez, F.; Alpagut, B.; Hernández, P.; Montalvillo, C.S. How to Achieve Positive Energy Districts for Sustainable Cities: A Proposed Calculation Methodology. Sustainability 2021, 13, 710. [Google Scholar] [CrossRef]
  17. Good, N.; Ceseña, E.M.; Mancarella, P. Energy Positivity and Flexibility in Districts. In Energy Positive Neighborhoods and Smart Energy Districts; Elsevier BV: Amsterdam, The Netherlands, 2017; pp. 7–30. [Google Scholar]
  18. Skaar, C.; Labonnote, N.; Gradeci, K. From Zero Emission Buildings (ZEB) to Zero Emission Neighbourhoods (ZEN): A Mapping Review of Algorithm-Based LCA. Sustainability 2018, 10, 2405. [Google Scholar] [CrossRef] [Green Version]
  19. Zero Emission Neighbourhoods in Smart Cities. Definition, Key Performance Indicators and Assessment Criteria; SINTEF and NTNU: Trondheim, Norway, 2018.
  20. IPCC. Global Warming of 1.5 °C. An IPCC Special Report on the Impacts of Global Warming of 1.5 °C above Pre-Industrial Levels and Related Global Greenhouse Gas Emission Pathways, in the Context of Strengthening the Global Response to the Threat of Climate Change, Sustainable Development, and Efforts to Eradicate Poverty; Masson-Delmotte, V.P., Zhai, H.-O., Pörtner, D., Roberts, J., Skea, P.R., Shukla, A., Pirani, W., Moufouma-Okia, C., Péan, R., Pidcock, S., et al., Eds.; SINTEF and NTNU: Trondheim, Norway, 2018. [Google Scholar]
  21. World Urbanization Prospects: The 2018 Revision. Available online: https://population.un.org/wup/Publications/Files/WUP2018-KeyFacts.pdf (accessed on 3 July 2021).
  22. Marquard, E.; Bartke, S.; Font, J.G.I.; Humer, A.; Jonkman, A.; Jürgenson, E.; Marot, N.; Poelmans, L.; Repe, B.; Rybski, R.; et al. Land Consumption and Land Take: Enhancing Conceptual Clarity for Evaluating Spatial Governance in the EU Context. Sustainability 2020, 12, 8269. [Google Scholar] [CrossRef]
  23. European Commission. Directorate General for the Environment, University of the West of England (UWE). Science Communication Unit. No Net Land Take by 2050? Available online: http://ec.europa.eu/science-environment-policy (accessed on 31 July 2021).
  24. International Energy Agency. Achieving Net-Zero Emissions by World Energy Outlook Report Extract. Available online: https://www.iea.org/reports/world-energy-outlook-2020/achieving-net-zero-emissions-by-2050 (accessed on 3 July 2021).
  25. Sahakian, M.; Wilhite, H. Making practice theory practicable: Towards more sustainable forms of consumption. J. Consum. Cult. 2013, 14, 25–44. [Google Scholar] [CrossRef]
  26. Axon, S. “Keeping the ball rolling”: Addressing the enablers of, and barriers to, sustainable lifestyles. J. Environ. Psychol. 2017, 52, 11–25. [Google Scholar] [CrossRef]
  27. Amending Di-rectives 2009/125/EC and 2010/30/EU and Repealing Directives 2004/8/EC and 2006/32/EC. In Proceedings of the Directive 2012/27/EU of the European Parliament and of the Council on Energy Efficiency, Brussels, Belgium, 25 October 2012.
  28. Directive 2010/31/EU of the European Parliament and of the Council; Publications Office of the European Union: Luxembourg, 2010. Available online: https://eur-lex.europa.eu/legal-content/EN/TXT/PDF/?uri=CELEX:32010L0031&from=IT (accessed on 30 July 2021).
  29. Sartori, I.; Napolitano, A.; Voss, K. Net zero energy buildings: A consistent definition framework. Energy Build. 2012, 48, 220–232. [Google Scholar] [CrossRef] [Green Version]
  30. Erba, S.; Pagliano, L.; Shandiz, S.C.; Pietrobon, M. Energy consumption, thermal comfort and load match: Study of a monitored nearly Zero Energy Building in Mediterranean climate. IOP Conf. Ser. Mater. Sci. Eng. 2019, 609, 062026. [Google Scholar] [CrossRef] [Green Version]
  31. Pagliano, L.; Erba, S.; Peuportier, B. Definition of Indicators and Assessment Methods for Cost Effective nZEB and Energy+ Buildings—An AZEB Projects Report. 2019. Available online: https://cordis.europa.eu/project/id/754174 (accessed on 30 July 2021).
  32. Hermelink, A.; Pagliano, L.; Voss, K.; Zangheri, P.; Schimschar, S.; Armani, R.; Voss, K.; Musall, E. Towards Nearly Zero-Energy Buildings-Definition of Common Principles under the EPBD—Final Report; European Commission: Brussels, Belgium, 2013. [Google Scholar]
  33. Erhorn-Kluttig, H.; Erhorn, H. National applications of the NZEB Definition–The Complete Overview. In Concerted Action Energy Performance of Buildings; Fraunhofer Institute for Building Physics: Stuttgart, Germany, 2018. [Google Scholar]
  34. Attia, S.; Eleftheriou, P.; Xeni, F.; Morlot, R.; Ménézo, C.; Kostopoulos, V.; Betsi, M.; Kalaitzoglou, I.; Pagliano, L.; Cellura, M.; et al. Overview and future challenges of nearly zero energy buildings (nZEB) design in Southern Europe. Energy Build. 2017, 155, 439–458. [Google Scholar] [CrossRef]
  35. EU HProject: AZEB—Affordable Zero Energy Buildings. Available online: https://azeb.eu/ (accessed on 3 July 2021).
  36. ISO 52000-1:Energy Performance of Buildings–Overarching EPB Assessment–Part 1: General Framework and Procedures; International Organization for Standardization: Geneva, Switzerland, 2017.
  37. Shnapp, S.; Paci, D.; Bertoldi, P. Enabling Positive Energy Districts across Europe: Energy Efficiency Couples Renewable Energy; LU: European Commission. Joint Research Centre: Brussels, Belgium, 2020. [Google Scholar]
  38. Le Quartier de la Fleuriaye à Carquefou. Available online: http://www.quartierlafleuriaye.fr/ (accessed on 3 July 2021).
  39. Fornebu, Bærum–ZEN Pilot Project. Available online: https://fmezen.no/fornebu-baerum/ (accessed on 3 July 2021).
  40. NyBy–Ny Flyplass (New City–New Airport), Bodø–ZEN Pilot Project. Available online: https://fmezen.no/airport-redevelopment-bodo/ (accessed on 3 July 2021).
  41. Agliardi, E.; Cattani, E.; Ferrante, A. Deep energy renovation strategies: A real option approach for add-ons in a social housing case study. Energy Build. 2018, 161, 1–9. [Google Scholar] [CrossRef]
  42. Semprini, G.; Gulli, R.; Ferrante, A. Deep regeneration vs shallow renovation to achieve nearly Zero Energy in existing buildings. Energy Build. 2017, 156, 327–342. [Google Scholar] [CrossRef]
  43. Shnapp, S.; Sitjà, R.; Laustsen, J. What is a Deep Renovation Definition? Global Buildings Performance Network (GBPN): Paris, France, 2013. [Google Scholar]
  44. European Parliament. Report on the Proposal for a Directive of the European Parliament and of the Council on Energy Efficiency and Repealing Directives 2004/8/EC and 2006/32/EC. Available online: https://www.europarl.europa.eu/doceo/document/A-7-2012-0265_EN.html 2012 (accessed on 30 July 2021).
  45. Galvin, R. Making the ‘rebound effect’ more useful for performance evaluation of thermal retrofits of existing homes: Defining the ‘energy savings deficit’ and the ‘energy performance gap’. Energy Build. 2014, 69, 515–524. [Google Scholar] [CrossRef]
  46. Zou, P.X.; Xu, X.; Sanjayan, J.; Wang, J. Review of 10 years research on building energy performance gap: Life-cycle and stakeholder perspectives. Energy Build. 2018, 178, 165–181. [Google Scholar] [CrossRef]
  47. International Performance Measurement and Verification Protocol. Available from: Concepts and Options for Determining Energy and Water Savings, Vol. 1, International Performance Measurement and Verification Protocol Committee. Available online: http://www.evo-world.org (accessed on 3 July 2021).
  48. Noris, F.; Napolitano, A.; Lollini, R. Measurement and Verification Protocol for Net Zero Energy Buildings; IEA SHC/ECBS Task 40/Annex 52; International Energy Agency Solar Heating and Cooling Program; EURAC Research: Bolzano, Italy, 2013. [Google Scholar]
  49. Mavrigiannaki, A.; Gobakis, K.; Kolokotsa, D.; Kalaitzakis, K.; Pisello, A.; Piselli, C.; Gupta, R.; Gregg, M.; Laskari, M.; Saliari, M.; et al. Measurement and Verification of Zero Energy Settlements: Lessons Learned from Four Pilot Cases in Europe. Sustainability 2020, 12, 9783. [Google Scholar] [CrossRef]
  50. Salvia, G.; Morello, E.; Rotondo, F.; Sangalli, A.; Causone, F.; Erba, S.; Pagliano, L. Performance Gap and Occupant Behavior in Building Retrofit: Focus on Dynamics of Change and Continuity in the Practice of Indoor Heating. Sustainability 2020, 12, 5820. [Google Scholar] [CrossRef]
  51. Cozza, S.; Chambers, J. GAPxPLORE: Energy Performance Gap in Existing, New, and Renovated Buildings. Learning from Large-Scale Datasets; Office Fédéral de l’Énergie OFEN: Geneva, Switzerland, 2019.
  52. Bulc, V. Speech at Conference on “Multimodal Sustainable Transport: Which Role for the Internalisation of External Costs?”. Available online: https://www.linkedin.com/pulse/speech-conference-multimodal-sustainable-transport-which-violeta-bulc/ (accessed on 3 July 2021).
  53. Krogstrup, S.; Oman, W. Macroeconomic and Financial Policies for Climate Change Mitigation: A Review of the Literature; International Monetary Fund: Bretton Woods, NH, USA, 2019. [Google Scholar]
  54. EN ISO 52016-1:Energy Performance of Buildings—Energy needs for Heating and Cooling, Internal Temperatures and Sensible and Latent Heat Loads-Part 1: Calculation Procedures; European Committee for Standardization: Brussels, Belgium, 2017.
  55. Huber, M.; Dimkova, D.; Hamacher, T. Integration of wind and solar power in Europe: Assessment of flexibility requirements. Energy 2014, 69, 236–246. [Google Scholar] [CrossRef] [Green Version]
  56. Jensen, S.Ø.; Marszal, A.J.; Lollini, R.; Pasut, W.; Knotzer, A.; Engelmann, P.; Stafford, A.; Reynders, G. IEA EBC Annex 67 Energy Flexible Buildings. Energy Build. 2017, 155, 25–34. [Google Scholar] [CrossRef] [Green Version]
  57. Hedman, Å.; Rehman, H.; Gabaldón, A.; Bisello, A.; Albert-Seifried, V.; Zhang, X.; Guarino, F.; Grynning, S.; Eicker, U.; Neumann, H.-M.; et al. IEA EBC Annex83 Positive Energy Districts. Buildings 2021, 11, 130. [Google Scholar] [CrossRef]
  58. Junker, R.G.; Azar, A.G.; Lopes, R.A.; Lindberg, K.B.; Reynders, G.; Relan, R.; Madsen, H. Characterizing the energy flexibility of buildings and districts. Appl. Energy 2018, 225, 175–182. [Google Scholar] [CrossRef]
  59. Vigna, I.; Pernetti, R.; Pasut, W.; Lollini, R. New domain for promoting energy efficiency: Energy Flexible Building Cluster. Sustain. Cities Soc. 2018, 38, 526–533. [Google Scholar] [CrossRef]
  60. Reynders, G.; Lopes, R.A.; Marszal, A.J.; Aelenei, D.; Martins, J.; Saelens, D. Energy flexible buildings: An evaluation of definitions and quantification methodologies applied to thermal storage. Energy Build. 2018, 166, 372–390. [Google Scholar] [CrossRef]
  61. Foteinaki, K.; Li, R.; Heller, A.; Rode, C. Heating system energy flexibility of low-energy residential buildings. Energy Build. 2018, 180, 95–108. [Google Scholar] [CrossRef]
  62. Favre, B.; Peuportier, B. Application of dynamic programming to study load shifting in buildings. Energy Build. 2014, 82, 57–64. [Google Scholar] [CrossRef]
  63. Le Dréau, J.; Heiselberg, P. Energy flexibility of residential buildings using short term heat storage in the thermal mass. Energy 2016, 111, 991–1002. [Google Scholar] [CrossRef]
  64. Liu, M.; Heiselberg, P. Energy flexibility of a nearly zero-energy building with weather predictive control on a convective building energy system and evaluated with different metrics. Appl. Energy 2019, 233, 764–775. [Google Scholar] [CrossRef]
  65. Foteinaki, K.; Li, R.; Péan, T.; Rode, C.; Salom, J. Evaluation of energy flexibility of low-energy residential buildings connected to district heating. Energy Build. 2020, 213, 109804. [Google Scholar] [CrossRef]
  66. Reynders, G.; Diriken, J.; Saelens, D. Generic characterization method for energy flexibility: Applied to structural thermal storage in residential buildings. Appl. Energy 2017, 198, 192–202. [Google Scholar] [CrossRef] [Green Version]
  67. Johra, H.; Heiselberg, P.; Le Dréau, J. Influence of envelope, structural thermal mass and indoor content on the building heating energy flexibility. Energy Build. 2019, 183, 325–339. [Google Scholar] [CrossRef]
  68. Reynders, G.; Nuytten, T.; Saelens, D. Potential of structural thermal mass for demand-side management in dwellings. Build. Environ. 2013, 64, 187–199. [Google Scholar] [CrossRef]
  69. Reilly, A.; Kinnane, O. The impact of thermal mass on building energy consumption. Appl. Energy 2017, 198, 108–121. [Google Scholar] [CrossRef] [Green Version]
  70. Stinner, S.; Huchtemann, K.; Müller, D. Quantifying the operational flexibility of building energy systems with thermal energy storages. Appl. Energy 2016, 181, 140–154. [Google Scholar] [CrossRef]
  71. Kuczyński, T.; Staszczuk, A. Experimental study of the influence of thermal mass on thermal comfort and cooling energy demand in residential buildings. Energy 2020, 195, 116984. [Google Scholar] [CrossRef]
  72. Orosa, J.A.; Oliveira, A. A field study on building inertia and its effects on indoor thermal environment. Renew. Energy 2012, 37, 89–96. [Google Scholar] [CrossRef]
  73. Panão, M.O.; Mateus, N.M.; Da Graça, G.C. Measured and modeled performance of internal mass as a thermal energy battery for energy flexible residential buildings. Appl. Energy 2019, 239, 252–267. [Google Scholar] [CrossRef]
  74. Kensby, J.; Trüschel, A.; Dalenbäck, J.-O. Potential of residential buildings as thermal energy storage in district heating systems—Results from a pilot test. Appl. Energy 2015, 137, 773–781. [Google Scholar] [CrossRef]
  75. EN 16798-1:Energy Performance of Buildings-Ventilation for Buildings-Part 1: Indoor Environmental Input Parameters for Design and Assessment of Energy Performance of Buildings Addressing Indoor Air Quality, Thermal Environment, Lighting and Acoustics-Module M1-6; European Committee for Standardization: Brussels, Belgium, 2019.
  76. ANSI/ASHRAE Standard 55-Thermal Environmental Conditions for Human Occupancy; American Society of Heating, Refrigerating and Air-Conditioning Engineers: Atlanta, GA, USA, 2020.
  77. Illich, I. Energy and Equity; Harper & Row: New York, NY, USA, 1978. [Google Scholar]
  78. Goldemberg, J.; Johansson, T.B.; Reddy, A.K.N.; Williams, R.H. Basic Needs and Much More with One Kilowatt per Capita. Ambio 1985, 14, 190–200. [Google Scholar]
  79. Sachs, W. Die vier E’s-Merkposten für Einen Maß-Vollen Wirtschaftsstil; in Politische Ökologie; nr. 33, 69–72; Wuppertal Institut: Wuppertal, Germany, 1993. [Google Scholar]
  80. Sachs, W. Planet Dialectics: Explorations in Environment and Development; Zed Books Ltd.: London, UK, 1999. [Google Scholar]
  81. Toulouse, E.; Sahakian, M.; Lorek, S.; Bohnenberger, K.; Bierwirth, A.; Leuser, L. Energy Sufficiency: How Can Research Better Help and Inform Policy-Making? ECEEE Summer Study Proceedings. Available online: https://www.eceee.org/library/conference_proceedings/eceee_Summer_Studies/2019/2-whats-next-in-energy-policy/energy-sufficiency-how-can-research-better-help-and-inform-policy-making/ (accessed on 30 July 2021).
  82. Berg, N.J.V.D.; Hof, A.F.; Akenji, L.; Edelenbosch, O.Y.; van Sluisveld, M.A.; Timmer, V.J.; van Vuuren, D.P. Improved modelling of lifestyle changes in Integrated Assessment Models: Cross-disciplinary insights from methodologies and theories. Energy Strat. Rev. 2019, 26, 100420. [Google Scholar] [CrossRef]
  83. Samadi, S.; Gröne, M.-C.; Schneidewind, U.; Luhmann, H.-J.; Venjakob, J.; Best, B. Sufficiency in energy scenario studies: Taking the potential benefits of lifestyle changes into account. Technol. Forecast. Soc. Chang. 2017, 124, 126–134. [Google Scholar] [CrossRef] [Green Version]
  84. Creutzig, F.; Roy, J.; Lamb, W.F.; Azevedo, I.M.; De Bruin, W.B.; Dalkmann, H.; Edelenbosch, O.Y.; Geels, F.W.; Grubler, A.; Hepburn, C.; et al. Towards demand-side solutions for mitigating climate change. Nat. Clim. Chang. 2018, 8, 260–263. [Google Scholar] [CrossRef] [Green Version]
  85. Plan Directeur de l’Énergie 2020–2030 République et Canton de Genève; République et Canton de Genève: Genève, Switzerland, 2020. Available online: https://www.ge.ch/document/22488/telecharger (accessed on 31 July 2021).
  86. Creutzig, F.; Callaghan, M.W.; Ramakrishnan, A.; Javaid, A.; Niamir, L.; Minx, J.C.; Müller-Hansen, F.; Sovacool, B.K.; Afroz, Z.; Andor, M.; et al. Reviewing the scope and thematic focus of 100 000 publications on energy consumption, services and social aspects of climate change: A big data approach to demand-side mitigation. Environ. Res. Lett. 2021, 16, 033001. [Google Scholar] [CrossRef]
  87. Raworth, K. Doughnut Economics. Seven Ways to Think Like a 21st Century Economist; Joni Praded, Chelsea Green Publishing: White River Junction, VT, USA, 2017. [Google Scholar]
  88. Jackson, T. Prosperity without Growth. Foundations for the Economy of Tomorrow, 2nd ed.; Routledge: London, UK, 2016. [Google Scholar]
  89. Burke, M.J. Energy-Sufficiency for a Just Transition: A Systematic Review. Energies 2020, 13, 2444. [Google Scholar] [CrossRef]
  90. Brown, H.S.; Vergragt, P.J. From consumerism to wellbeing: Toward a cultural transition? J. Clean. Prod. 2016, 132, 308–317. [Google Scholar] [CrossRef]
  91. Douglas, M.J.; Watkins, S.J.; Gorman, D.R.; Higgins, M. Are cars the new tobacco? J. Public Health 2011, 33, 160–169. [Google Scholar] [CrossRef] [PubMed] [Green Version]
  92. Impact de La Pollution de L’air Ambiant Sur la Mortalité en France Métropolitaine. Réduction en Lien Avec le Confinement du Printemps 2020 et Nouvelles Données sur le Poids Total Pour la Période 2016–2019; Santé Publique France: Paris, France, 2021. Available online: https://www.santepubliquefrance.fr/determinants-de-sante/pollution-et-sante/air/documents/enquetes-etudes/impact-de-pollution-de-l-air-ambiant-sur-la-mortalite-en-france-metropolitaine.-reduction-en-lien-avec-le-confinement-du-printemps-2020-et-nouvelle (accessed on 30 July 2021).
  93. Becker, D.A.; Browning, M.H. Chapter 3: Total area greenness is associated with lower per-capita medicare spending, but blue spaces are not. City Environ. Interact. 2021, 2021, 100063. [Google Scholar] [CrossRef]
  94. Wiedmann, T.; Lenzen, M.; Keyßer, L.T.; Steinberger, J.K. Scientists’ warning on affluence. Nat. Commun. 2020, 11, 1–10. [Google Scholar] [CrossRef] [PubMed]
  95. Ivanova, D.; Barrett, J.; Wiedenhofer, D.; Macura, B.; Callaghan, M.W.; Creutzig, F. Quantifying the potential for climate change mitigation of consumption options. Environ. Res. Lett. 2020, 15, 093001. [Google Scholar] [CrossRef]
  96. Akenji, L.; Chen, H. A Framework for Shaping Sustainable Lifestyles. Determinants and Strategies; UNEP: Nairobi, Kenya, 2016. [Google Scholar]
  97. Fanger, P.O. Thermal Comfort, Analysis and Applications in Environmental Engineering; McGraw-Hill Book Company: New York, NY, USA, 1970. [Google Scholar]
  98. de Dear, R. A global database of thermal comfort field experiments. ASHRAE Trans. 1998, 104, 1141–1152. [Google Scholar]
  99. Ličina, V.F.; Cheung, T.; Zhang, H.; de Dear, R.; Parkinson, T.; Arens, E.; Chun, C.; Schiavon, S.; Luo, M.; Brager, G.; et al. Development of the ASHRAE Global Thermal Comfort Database II. Build. Environ. 2018, 142, 502–512. [Google Scholar] [CrossRef] [Green Version]
  100. Fanger, P.O.; Toftum, J. Extension of the PMV model to non-air-conditioned buildings in warm climates. Energy Build. 2002, 34, 533–536. [Google Scholar] [CrossRef]
  101. Pagliano, L.; Zangheri, P. Comfort models and cooling of buildings in the Mediterranean zone. Adv. Build. Energy Res. 2010, 4, 167–200. [Google Scholar] [CrossRef]
  102. Carlucci, S.; Erba, S.; Pagliano, L.; de Dear, R. ASHRAE Likelihood of Dissatisfaction: A new right-here and right-now thermal comfort index for assessing the Likelihood of Dissatisfaction according to the ASHRAE adaptive comfort model. Energy Build. 2021, in press. [Google Scholar] [CrossRef]
  103. Lipczynska, A.; Schiavon, S.; Graham, L.T. Thermal comfort and self-reported productivity in an office with ceiling fans in the tropics. Build. Environ. 2018, 135, 202–212. [Google Scholar] [CrossRef] [Green Version]
  104. He, Y.; Chen, W.; Wang, Z.; Zhang, H. Review of fan-use rates in field studies and their effects on thermal comfort, energy conservation, and human productivity. Energy Build. 2019, 194, 140–162. [Google Scholar] [CrossRef] [Green Version]
  105. Raftery, P. CBE Fan Tool, Center for the Built Environment, University of California Berkeley. 2019. Available online: Cbe.berkeley.edu/fan-tool (accessed on 30 July 2021).
  106. Raftery, P.; Fizer, J.; Chen, W.; He, Y.; Zhang, H.; Arens, E.; Schiavon, S.; Paliaga, G. Ceiling fans: Predicting indoor air speeds based on full scale laboratory measurements. Build. Environ. 2019, 155, 210–223. [Google Scholar] [CrossRef] [Green Version]
  107. Erba, S.; Sangalli, A.; Pagliano, L. Present and future potential of natural night ventilation in nZEBs. IOP Conf. Ser. Earth Environ. Sci. 2019, 296. [Google Scholar] [CrossRef]
  108. Dama, A.; De Lena, E.; Masera, G.; Pagliano, L.; Ruta, M.; Zangheri, P. Design and Passive Strategies Optimization Towards Zero Energy Target: The Case Study of an Experimental Office Building in Milan. Simul. Optim. Conf. 2014, 7. [Google Scholar] [CrossRef]
  109. Sfakianaki, A.; Santamouris, M.; Hutchins, M.; Nichol, F.; Wilson, M.; Pagliano, L.; Pohl, W.; Alexandre, J.; Freire, A. Energy Consumption Variation due to Different Thermal Comfort Categorization Introduced by European Standard EN 15251 for New Building Design and Major Rehabilitations. Int. J. Vent. 2011, 10, 195–204. [Google Scholar] [CrossRef]
  110. Arens, E.; Humphreys, M.A.; de Dear, R.; Zhang, H. Are ‘class A’ temperature requirements realistic or desirable? Build. Environ. 2010, 45, 4–10. [Google Scholar] [CrossRef] [Green Version]
  111. Alfano, F.R.D.; Palella, B.I.; Riccio, G. The role of measurement accuracy on the thermal environment assessment by means of PMV index. Build. Environ. 2011, 46, 1361–1369. [Google Scholar] [CrossRef]
  112. International Standard Organization. ISO 7730:Ergonomics of the Thermal Environment—Analytical Determination and Interpretation of Thermal Comfort Using Calculation of the PMV and PPD Indices and Local Thermal Comfort Criteria; ISO: Geneva, Switzerland, 2005. [Google Scholar]
  113. Aliagha, G.U.; Cin, N.Y. Perceptions of Malaysian Office Workers on the Adoption of the Japanese Cool Biz Concept of Energy Conservation. J. Asian Afr. Stud. 2013, 48, 427–446. [Google Scholar] [CrossRef]
  114. The District of Florés Malacca. Available online: https://www.smartweb.re/envirobat/files/fiches_envirobat_reunion/logements/FICHE_ENVIROBAT_Reunion_FLORES_MALACCA.pdf (accessed on 3 July 2021).
  115. Kleerekoper, L.; Esch, M.P.-V.; Salcedo, T.B. How to make a city climate-proof, addressing the urban heat island effect. Resour. Conserv. Recycl. 2012, 64, 30–38. [Google Scholar] [CrossRef]
  116. Mariotti, I.; Akhavan, M.; Rossi, F. The preferred location of coworking spaces in Italy: An empirical investigation in urban and peripheral areas. Eur. Plan. Stud. 2021, 1–23. [Google Scholar] [CrossRef]
  117. Akhavan, M.; Mariotti, I.; Astolfi, L.; Canevari, A. Coworking Spaces and New Social Relations: A Focus on the Social Streets in Italy. Urban Sci. 2018, 3, 2. [Google Scholar] [CrossRef] [Green Version]
  118. Guth, C. The New Cycle Network and Speed Limit Areas in Paris. First Results and Lessons Learnt. Available online: https://www.ridef2.com/uploads/9/5/1/2/95124774/20191216_ms_guth_on_plan_velo_paris_x_ridef_milano.pdf (accessed on 3 July 2021).
  119. Kraus, S.; Koch, N. Provisional COVID-19 infrastructure induces large, rapid increases in cycling. Proc. Natl. Acad. Sci. USA 2021, 118. [Google Scholar] [CrossRef]
  120. Jackson, T. Zero Carbon Sooner—The Case for an Early Zero Carbon Target for the UK. Available online: https://www.cusp.ac.uk/wp-content/uploads/WP18%E2%80%94Zero-carbon-sooner.pdf (accessed on 30 July 2021).
  121. Mundaca, L.; Ürge-Vorsatz, D.; Wilson, C. Demand-side approaches for limiting global warming to 1.5 °C. Energy Effic. 2019, 12, 343–362. [Google Scholar] [CrossRef] [Green Version]
  122. Santamouris, M.; Kolokotsa, D. Urban Climate Mitigation Techniques; Routledge: London, UK, 2016. [Google Scholar]
  123. Ip, K.; She, K. Waste heat recovery from showers: Case study of a university sport facility in the UK. In Proceedings of the Water Efficiency Conference, Coventry UK, 7–9 September 2016. [Google Scholar]
  124. EN 14825:Air Conditioners, Liquid Chilling Packages and Heat Pumps, with Electrically Driven Compressors, for Space Heating and Cooling-Testing and Rating at Part Load Conditions and Calculation of Seasonal Performance; European Committee for Standardization: Brussels, Belgium, 2018.
  125. Causone, F.; Carlucci, S.; Ferrando, M.; Marchenko, A.; Erba, S. A data-driven procedure to model occupancy and occupant-related electric load profiles in residential buildings for energy simulation. Energy Build. 2019, 202, 109342. [Google Scholar] [CrossRef]
  126. International Organization for Standardization. ISO 15927-6:Hygrothermal Performance of Buildings—Calculation and Presentation of Climatic Data Accumulated Temperature Differences (Degree-Days); International Organization for Standardisationn (IOS): Geneva, Switzerland, 2007. [Google Scholar]
  127. Pagliano, L.; Armani, R.; Erba, S.; Sangalli, A. Highly Insulated Buildings as a Crucial Element for Smart Cities, Grid Balancing and Energy Storage for Renewables. Knauf Insulation Report. 2020. Available online: https://www.knaufinsulation.com/news/thermal-insulation-of-buildings-for-a-smart-and-renewable-energy-system (accessed on 31 July 2021).
  128. Joint Research Centre. Institute for Energy and Transport. Individual Mobility: From Conventional to Electric Cars; LU: Publications Office, European Commission: Brussels, Belgium, 2015. [Google Scholar]
  129. Festa, M. Rapporto Immobiliare Il Settore Residenziale. 2019. Available online: https://www.agenziaentrate.gov.it/portale/documents/20143/263076/rapporto+immobiliare2019+ri_RI2019_Residenziale_20190523.pdf/a175f856-2363-dda7-da64-b1c0e544eb12 (accessed on 31 July 2021).
  130. Lenoir, A.; Thellier, F.; Garde, F. Towards Net Zero Energy Buildings in Hot Climate, Part 2: Experimental Feedback. ASHRAE Trans. 2011, 117, 8. [Google Scholar]
  131. Relazione Annuale. Stato dei Servizi 2019. ARERA 2019. Available online: https://www.arera.it/allegati/relaz_ann/19/RA19_volume1.pdf (accessed on 30 July 2021).
  132. Brischke, L.-A.; Lehmann, F.; Leuser, L.; Thomas, S.; Baedeker, C. Energy Sufficiency in Private Households Enabled by Adequate Appliances, ECEEE Summer Study Proceedings. 2015. Available online: https://epub.wupperinst.org/frontdoor/deliver/index/docId/5932/file/5932_Brischke.pdf (accessed on 30 July 2021).
  133. Consigli Piani di Cottura. Available online: https://www.topten.ch/private/adviser/consigli-piani-di-cottura (accessed on 3 July 2021).
  134. European Commission. Ecodesign and Energy Labelling Preparatory Study on Electric Kettles. Available online: https://ec.europa.eu/energy/studies_main/preparatory-studies/ecodesign-and-energy-labelling-preparatory-study-electric-kettles_en (accessed on 3 July 2021).
  135. Patrão, C.; Rivet, L.; Fong, J.; de Almeida, A. Energy Efficient Elevators and Escalators. ECEEE 2009 Summer Study Act! Innovate! Deliver! Reducing Energy Demand Sustainably Proceedings. 2009. Available online: https://www.eceee.org/static/media/uploads/site-2/library/conference_proceedings/eceee_Summer_Studies/2009/Panel_4/4.037/paper.pdf (accessed on 30 July 2021).
  136. SIA 2024:2015 Costruzione. Dati D’utilizzo di Locali per L’energia e L’impiantistica Degli Edifici. 2015. Available online: http://shop.sia.ch/normenwerk/architekt/sia%202024/i/D/Product (accessed on 31 July 2021).
  137. Abitudini di Guida Degli Italiani nel 2018 in Seguito all’analisi dei Dati Delle Scatole Nere Installate Nelle Automobile; Osservatorio UnipolSai Assicurazioni: Bologna, Italy, 2019.
  138. L’Efficienza Energetica nei Trasporti; ENEA; ENEA (Agenzia Nazionale per le Nuove Tecnologie, l’Energia e lo Sviluppo Economico Sostenibile): Roma, Italy, 2011.
  139. Šúri, M.; Huld, T.; Dunlop, E.D.; Ossenbrink, H.A. Potential of solar electricity generation in the European Union member states and candidate countries. Sol. Energy 2007, 81, 1295–1305. [Google Scholar] [CrossRef]
Figure 1. Schematization of the functions of a PED.
Energies 14 04697 g001
Figure 2. Graphical representation of energy levels developed by the authors (S. Erba and L. Pagliano): case where the energy service considered is space heating, delivered by a boiler and on-site solar thermal panels.
Energies 14 04697 g002
Figure 3. Map of Chiaravalle district, Milan, Italy: in red the public housing blocks are highlighted. The analyses performed by the authors are referred to complex A but the results can be extended to complex B, because of their similarities.
Energies 14 04697 g003
Figure 4. Aerial view and geometrical model of the public housing estate.
Energies 14 04697 g004
Figure 5. Window-wall detail after the deep energy retrofit: the new windows, characterized by highly insulating glass and frame, are protected by movable solar blinds and mosquito nets, which create a barrier for insects with a small reduction of the air flow when natural ventilation is used.
Energies 14 04697 g005
Figure 6. Hourly outdoor air temperature distribution in Chiaravalle, Milan (latitude: 45.417, longitude: 9.214, height: 105 m).
Energies 14 04697 g006
Figure 7. Monthly global horizontal solar irradiation in Chiaravalle, Milan (latitude: 45.417, longitude: 9.214, height: 105 m).
Energies 14 04697 g007
Figure 8. Frequency distribution of wind speed and direction during the year in Chiaravalle, Milan (latitude: 45.417, longitude: 9.214, height: 105 m).
Energies 14 04697 g008
Figure 9. Outdoor air temperature during an “average winter day”.
Energies 14 04697 g009
Figure 10. Hourly global horizontal irradiation during an “average winter day”.
Energies 14 04697 g010
Figure 11. Variation over time of operative temperature in a reference indoor heated space as a function of the number of days (1–5) during which the heating system was kept on (before being turned off), with external conditions given by the cyclic repetition of an “average winter day”.
Energies 14 04697 g011
Figure 12. Variation over time of the operative temperature in a reference heated space as a function of the retrofit measures undertaken, after two days during which the heating system was kept on (before being turned off) and with the cyclic repetition of an “average winter day”.
Energies 14 04697 g012
Table 1. Schematic comparison of different types of behavior changes, adapted by authors from [82].
Integrated Assessment Models (IAM) DistinctionEfficiency(Technological) SubstitutionLifestyle Change
EFFICIENCYCONSISTENCYSUFFICIENCY
TransportFuel-efficient vehiclesVehicles powered from RESPublic transportTeleconferencing, walking, cycling
ResidentialEnergy-efficient appliances (high level in energy labeling)On-site generation by RESThermostat adjustmentSmaller apartments, reduced number and size of appliances
Consumer goods and servicesEfficient supply chainPurchase sustainable goodsSustainable use of goodsSharing goods
ImproveShiftAvoid
Table 2. Interactions between districts and buildings favoring efficiency and sufficiency actions and supporting urban design choices and regulation.
Sufficiency Actions in Buildings→Summer Night Ventilation and Ceiling Fans Rather Than Air ConditioningSummer Night Ventilation Rather Than Air ConditioningAdequate m2 per Capita Floor SpaceAdopt “Sufficient” Mobility Modes: Bicycle, Walk, Public TransportLine Drying and Water/Hot Water Saving
In order to perform sufficiency actions, inhabitants would needSilence at night, clean airExternal air temperature < 20 °C at nightPleasant common indoor/outdoor spaces (shared guest rooms, music rooms, office space, playing spaces for children, etc.) to reduce the need for individual volumesEasy access to services, schools, work and coworking spaces, equally distributed in the city; independence of movement for children and eldersWell-designed spaces for line-drying, installed water saving devices. Comfortable showers in place of bathtubs
Presently cities create constraintsNoise, mainly from cars and motorcycles. PM10, PM2.5 pollution and other air contaminantsAsphalt, city canyonsInhospitable districts, obligation for car parking spaces at buildings and free car parking on streetsDistance between functions, unacceptable risks for cyclists, pedestrians and persons with disabilitiesDust in air
Cities should offer enabling conditionsCar-free residential districts and zones at 20 or 30 km/hWhite/cool surfaces. Geometries facilitating air movement. Water surfaces and urban vegetationWalkable, cyclable districts, green spaces, spaces for playing and spaces in the building for common activitiesEquitable access to street space and equal access to various transportation modesInformation campaigns on water saving devices and on the high quality of drinking water from the tap
Legislation and Regulation shouldaddressObjective and adequate temperature and humidity set-points in regulation. Limitations to car number and to speed limits to 20–30 km/hMandatory white/cool surfaces, mandatory external solar protections (as, e.g., in Switzerland)Minimum requirements of green spaces and of common spaces for meetingsEPBD (and national build codes): mandatory protected spaces inside buildings for bicycles, wheelchairs and strollersMandatory spaces for line drying, mandatory labeling of low-flow water devices, mandatory showers rather or in addition to bathtubs (with access at the same level of the floor for easy access by aging population)
Table 3. Physical characteristics of the building, before and after the renovation.
Before RenovationAfter Renovation
Thermal transmittance of opaque vertical structures U (W/(m2K))1.150.13
Thermal transmittance of the ceiling under the uninhabitable attic U (W/(m2K))3.000.15
Thermal transmittance of the pilotis supported slab U (W/(m2K))2.400.17
Thermal transmittance of glass panes U (W/(m2K))3.001.42
Thermal transmittance of the window frames U (W/(m2K))5.001.60
Total solar transmittance of glass panes (%)0.750.52
Table 4. Overall energy balance over a year, “winter” and “summer”.
Scenario A (Only Consistency of Supply)Scenario B (Sufficiency, Efficiency and Consistency of Supply)
SI UnitsScenario A (Whole Year)Ref.Scenario A (“Winter”)Scenario A (“Summer”)Scenario B (Whole Year)RefScenario B (“Winter”)Scenario B (“Summer”)
Reference buildingApartment average floor aream2105.9[129]105.9[129]
SEER, SCOP2.7[124]2.7[124]
Ventilated volumem3/m22.7(a)
Air changes/hvol/h0.5(b)
Air volume flow ratem3/s0.00038*
SFPkW/(m3/s)2(c)
Mechanical power for ventilationkW/m20.00083*
Average number of hours of ventilation (15/10 to 15/04)hNot active4320(d)
Energy needsEnergy need for heatingkWhthermal/m2/y147.4(e) [16]16.6(e)
Energy need for hot waterkWhthermal/m2/y20.0[16,130]12.0(f)
Energy need for coolingkWhthermal/m2/y19.6(e)7.0(e, f)
Energy usesEnergy use for heatingkWhelectric/m2/y54.6*54.66.1*6.1
Energy use for hot waterkWhelectric/m2/y7.4*4.13.34.4*2.42.0
Energy use for coolingkWhelectric/m2/y7.3*7.32.6*2.6
Average electricity use in apartments (for appliances, lighting, ICT, etc.)kWhelectric/y2870[131]1800[132]
Electricity use in apartments (for appliances, lighting, ICT, etc.)kWhelectric/m2/y27.1*15.112.017.0*9.57.5
Energy use for cookingkWhelectric/m2/y3.9[133,134]2.31.63.3[133,134]2.01.3
Energy use by ceiling fanskWhelectric/m2/yNot installed00.2[105]0.2
Energy use by elevatorskWhelectric/m2/y3.0[135]1.51.51.8[135]0.90.9
Energy use for lighting in common areaskWhelectric/m2/y1.2[136]0.70.50.6[136]0.40.2
Energy use for mechanical ventilationkWhelectric/m2/yNot installed003.6*3.60
MobilitySpace travelled with electric private vehicle/householdkm11,885[137]5000(f)
Energy use per distance traveled of a small sized electric carkWhelectric/km0.186[128]0.186[128]
Total use with private vehiclekWhelectric/m2/y20.9*12.28.78.8*5.13.7
Public transport usekWhelectric/m2/y2.0[138]1.01.05.0[138]2.52.5
Total energy use (delivered energy) per unit conditioned floor areakWhelectric/m2/y127.3*91.635.853.5*32.620.9
Average number of stories4(c)4(c)
Total energy use (delivered energy) per unit footprint area of the buildingkWhelectric/m2/y509.4*366.2143.2214.0*130.383.7
RESGeneration by PV on roof per unit footprint area of the buildingkWhelectric/m2/y120.0(g)39.081.0120.0(g)39.081.0
Generation by PV on facades per unit footprint area of the buildingkWhelectric/m2/yNot installed0095.0[139]30.964.1
Overall energy balancekWhelectric/m2/y−389.4*−327.2−62.21.0*−60.461.5
Land take necessary to achieve a zero energy balancem2 land/ m2 footprint−3.2*−8.4−0.80*−1.50
(a)—An average height equal to 2.7 m is considered. (b)—Air change per hour defined according to the Italian standard. (c)—Values according to the technical documentation of the project, see Section 5.1. (d)—The number of hours during which the mechanical ventilation is active is calculated considering full utilization (24/7) during the heating season (from 15/10 to 14/04 in the climatic zone E). (e)—The values of energy needs have been estimated through the dynamic energy simulations realized for the case study (see Section 5.2). (f)—The values reported take into account energy sufficiency actions described in Section 4.1 and 5.4. (g)—These values were calculated via PVGIS simulations assuming: solar radiation database PVGIS-SARAH; PV technology crystalline silicon; installed peak PV power of 0.205 kWp/m2; system loss of 14%; slope of 35°; azimuth of +45° and −45°. For each m2 of footprint 0.5 m2 of PV panels can be installed, taking into account the geometry of the roof and the orientation of the building. * All these values were calculated using the values shown in the text, defined on the base of literature or simulations (see letters a–g).
Publisher’s Note: MDPI stays neutral with regard to jurisdictional claims in published maps and institutional affiliations.

