
Analysis of Natural and Power Plant CO2 Emissions in the Mount Amiata (Italy) Volcanic–Geothermal Area Reveals Sustainable Electricity Production at Zero Emissions

 ,
,
Abstract
:1. Introduction
2. Geological, Hydrogeological, and Geothermal Settings
3. Natural Gas Emissions and Origin of CO2
4. Methods
5. Results
6. Discussion
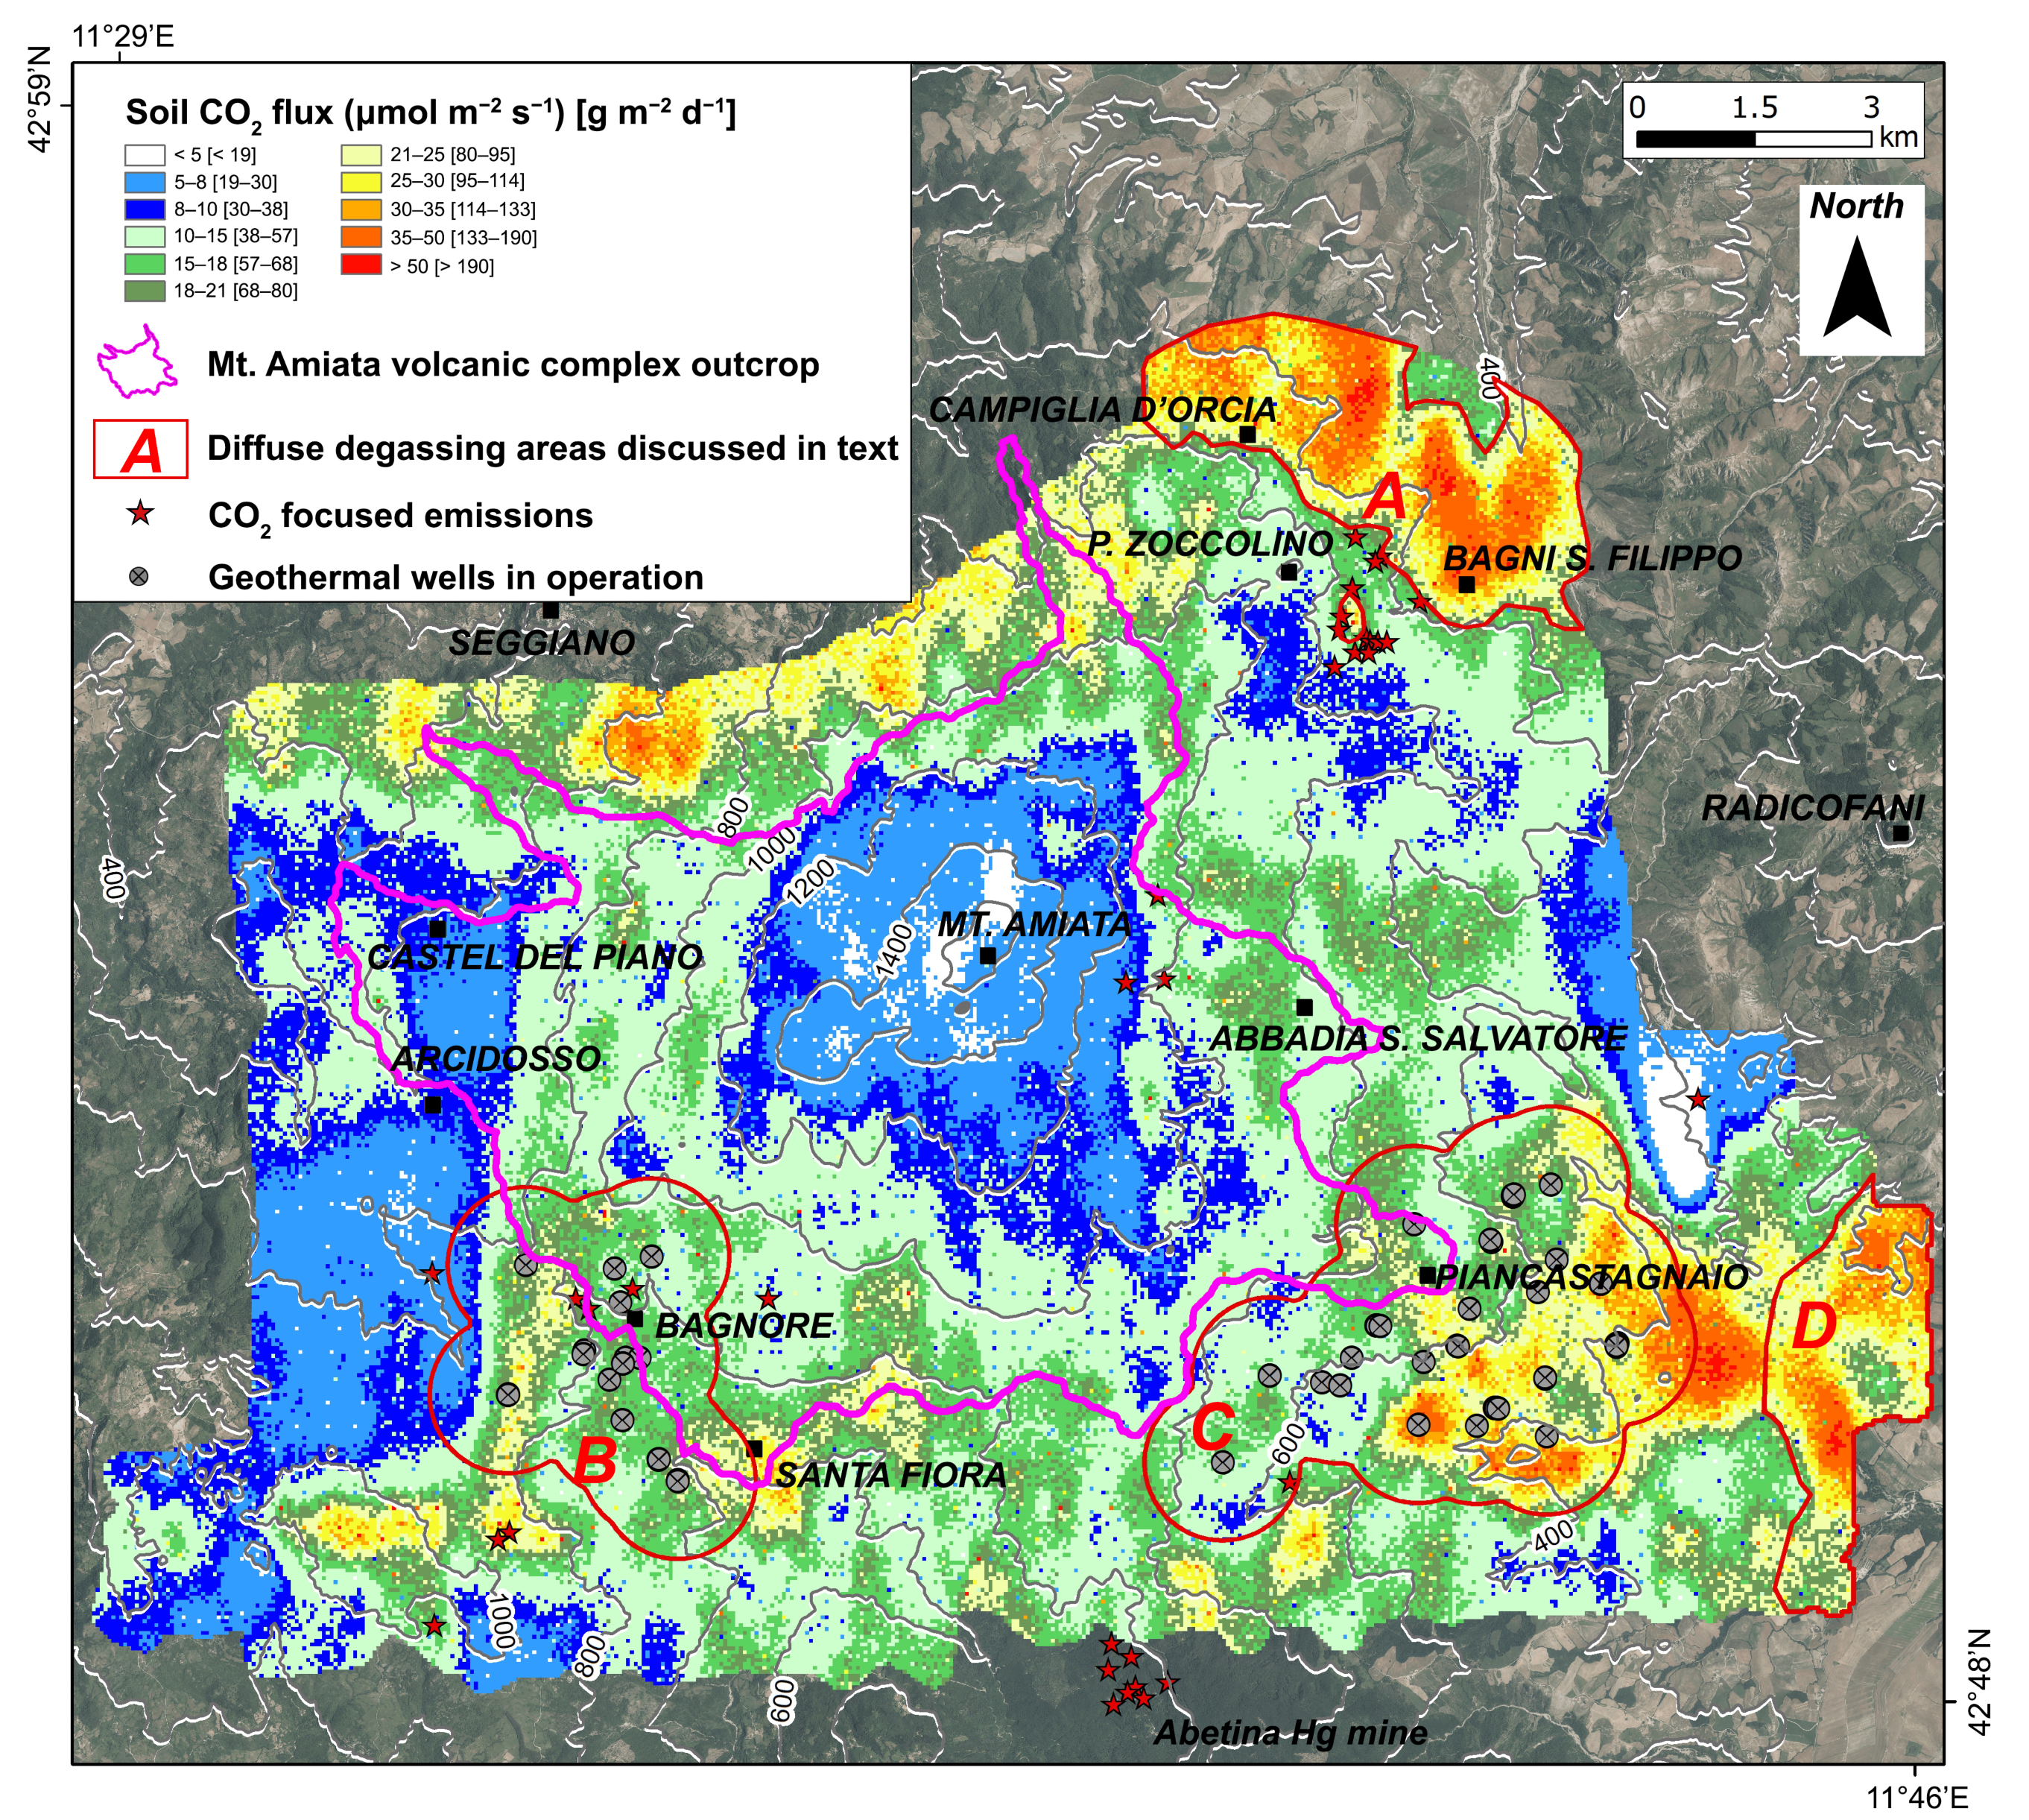
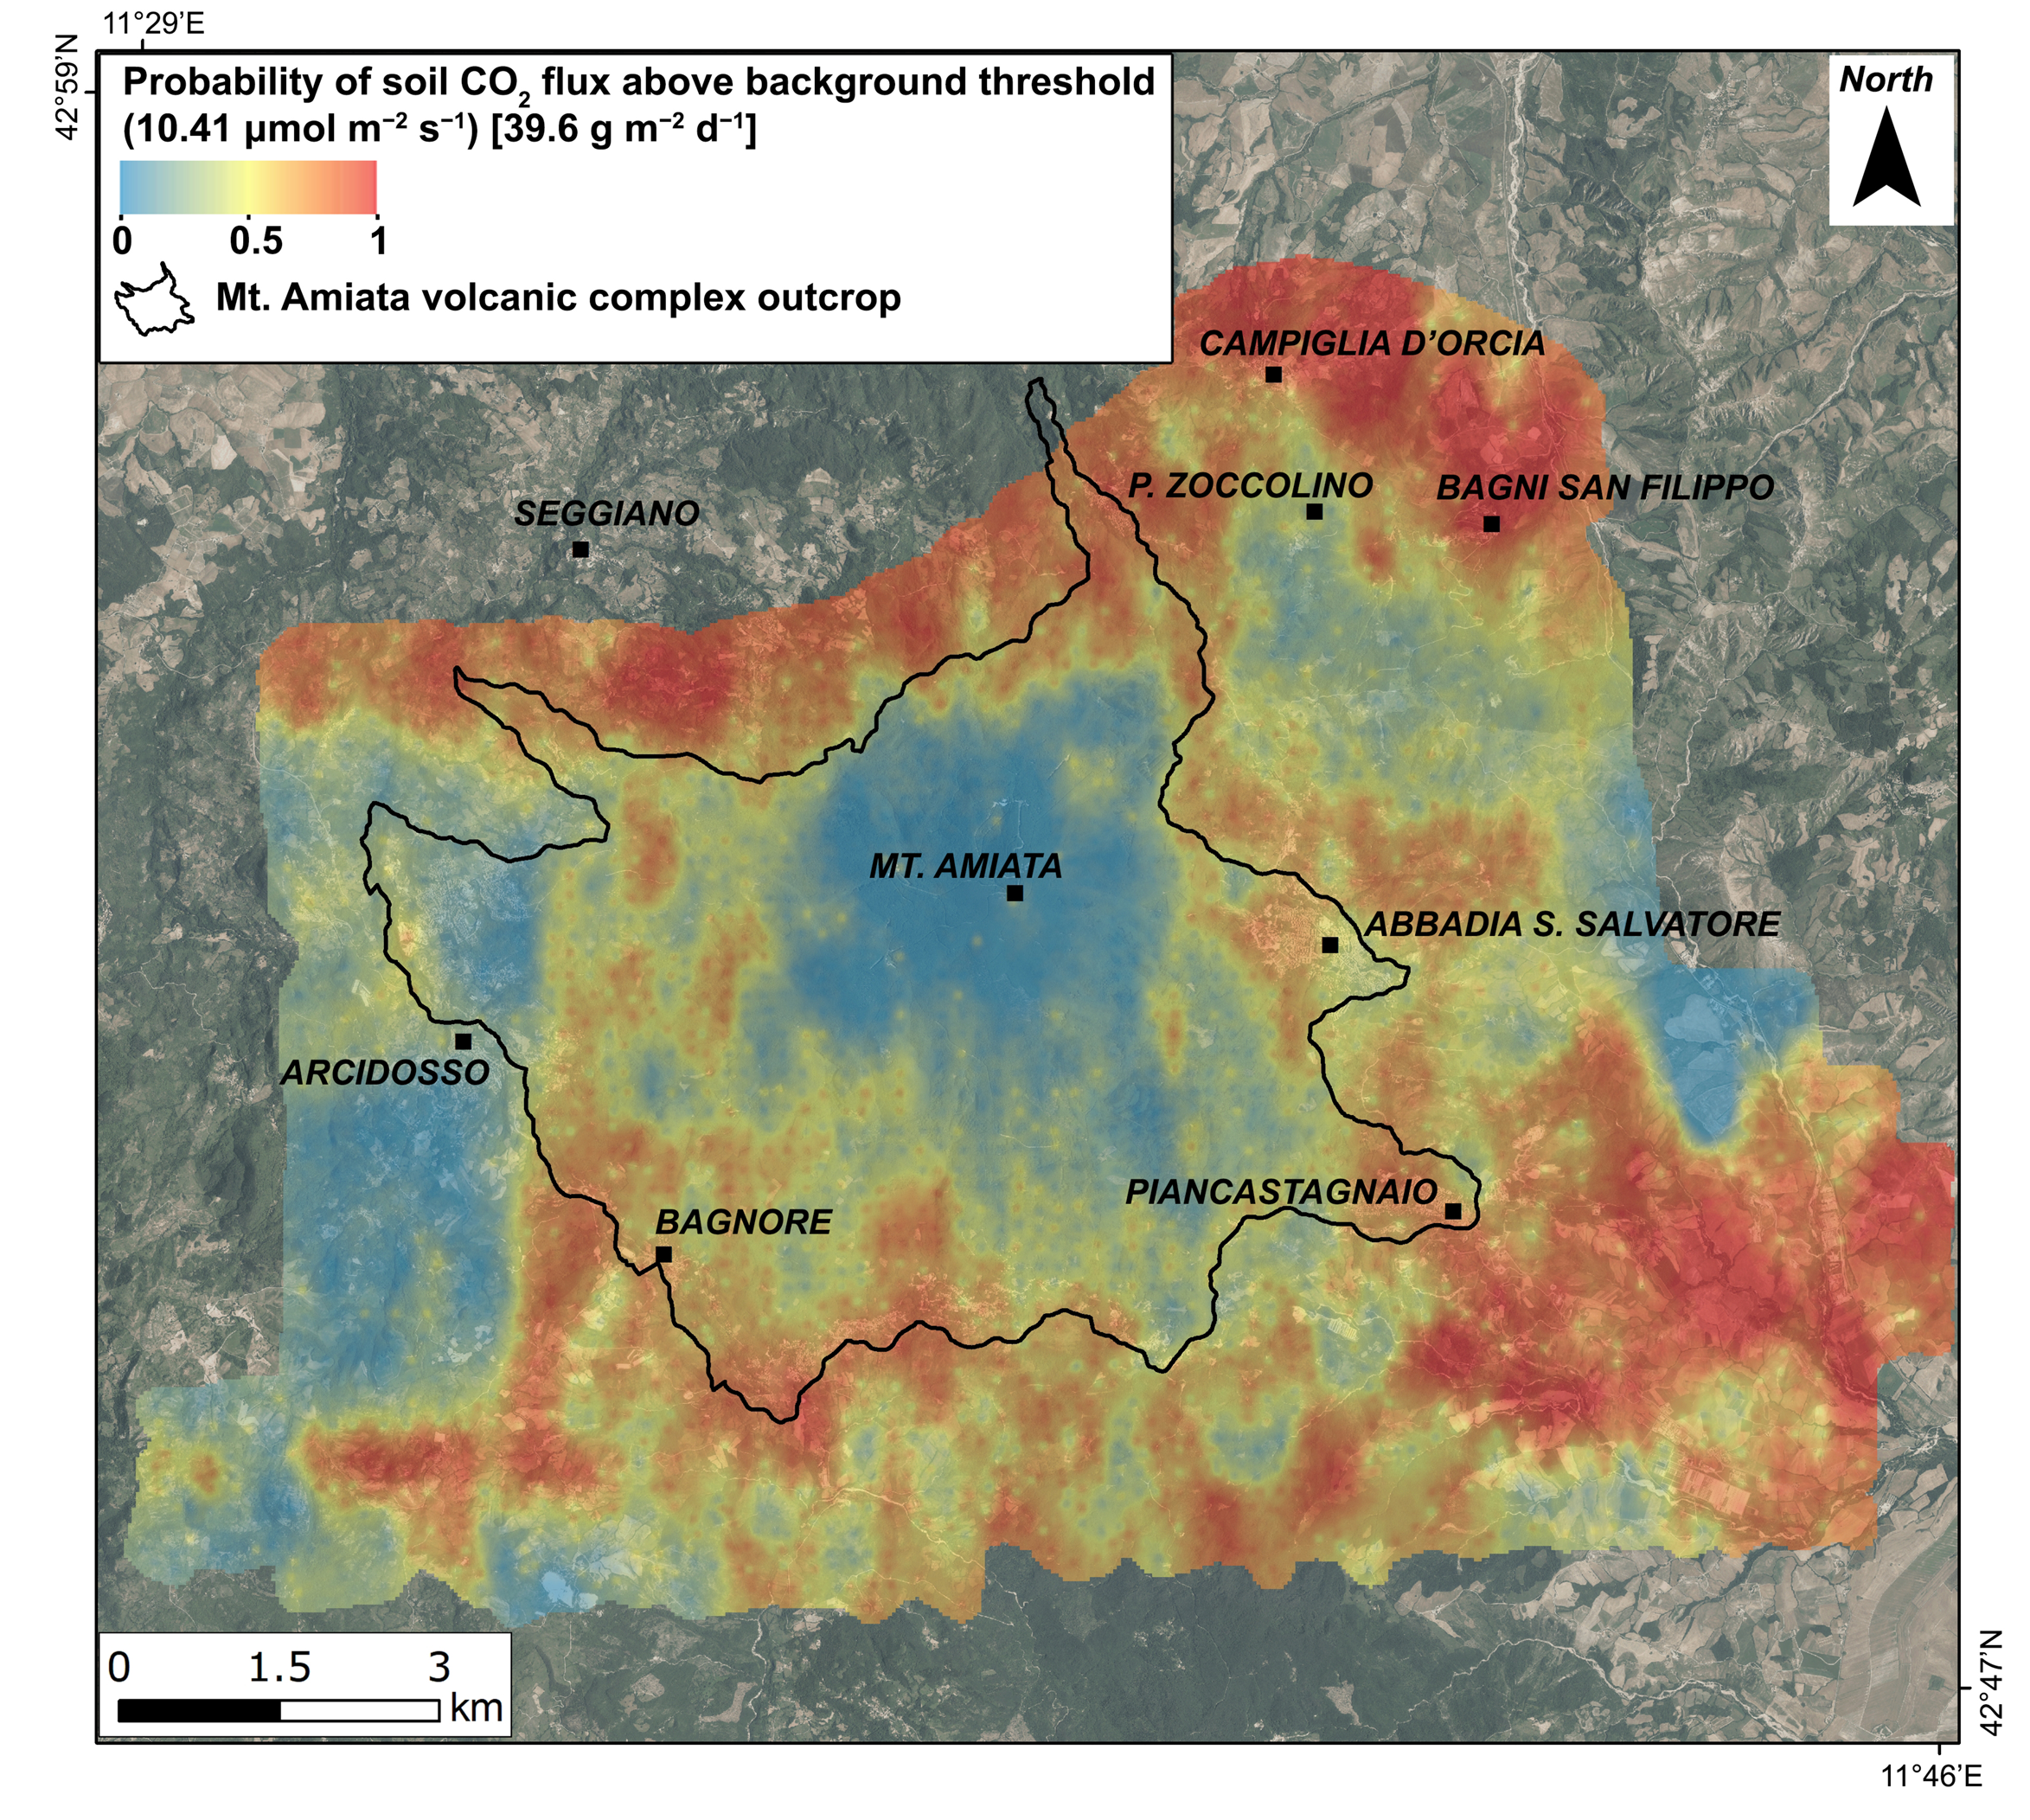
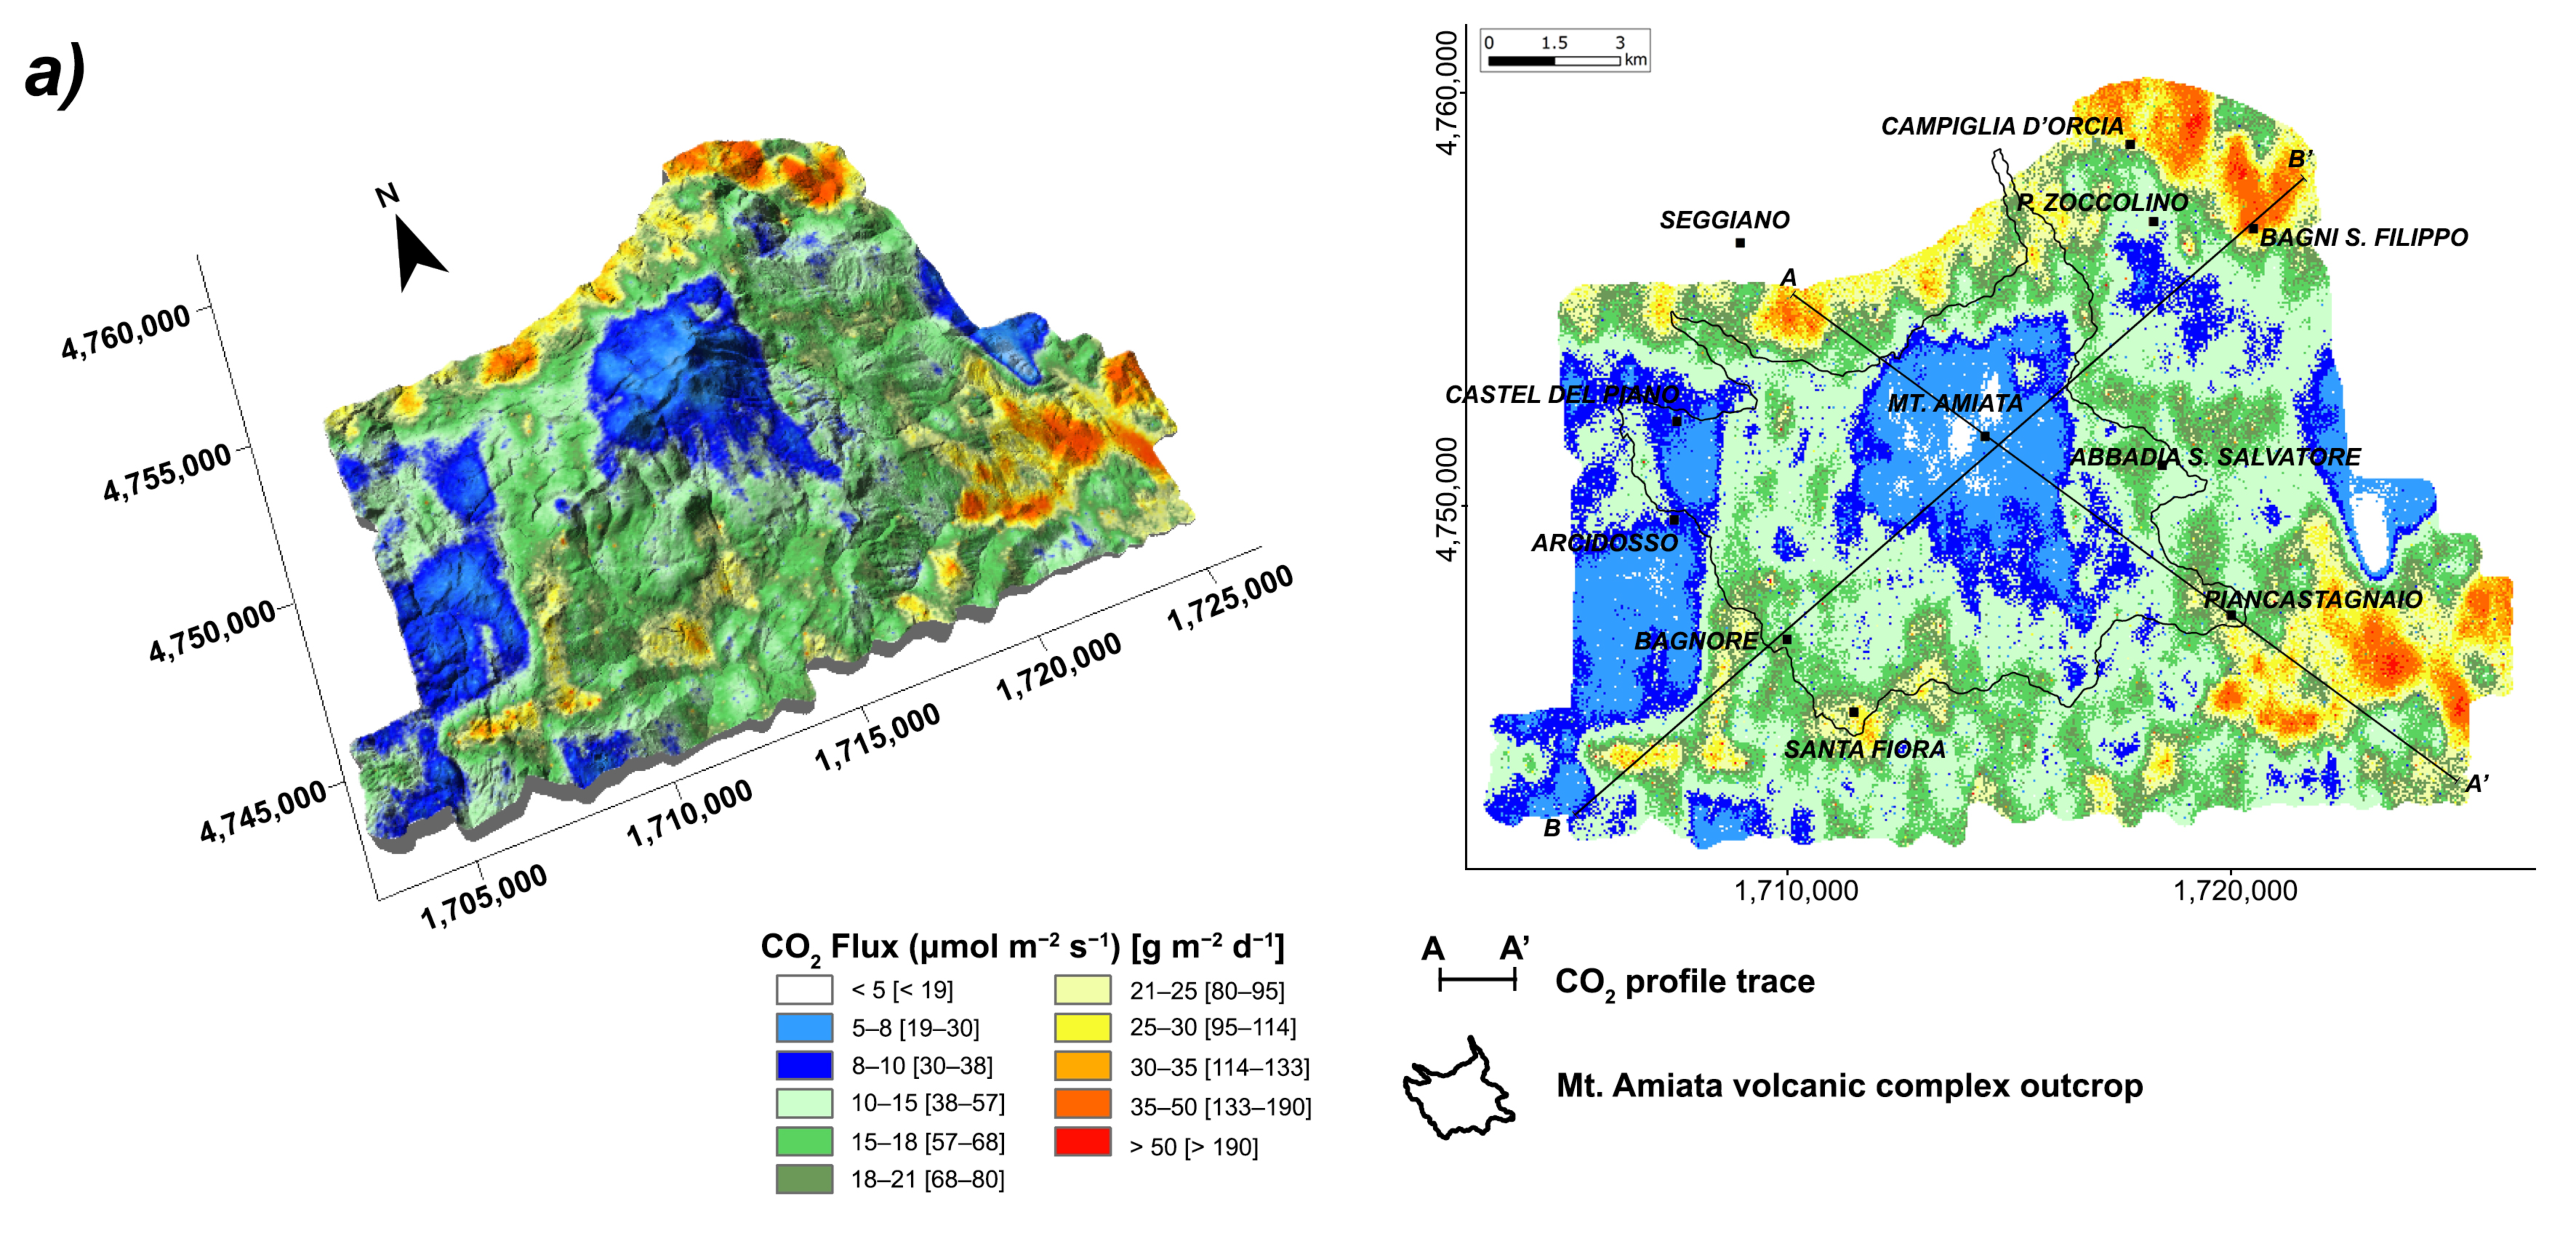
6.1. Natural CO2 Flux
6.2. CO2 Emissions from GPPs
6.3. Merging Natural Soil CO2 Flux and GPPs’ CO2 Emissions
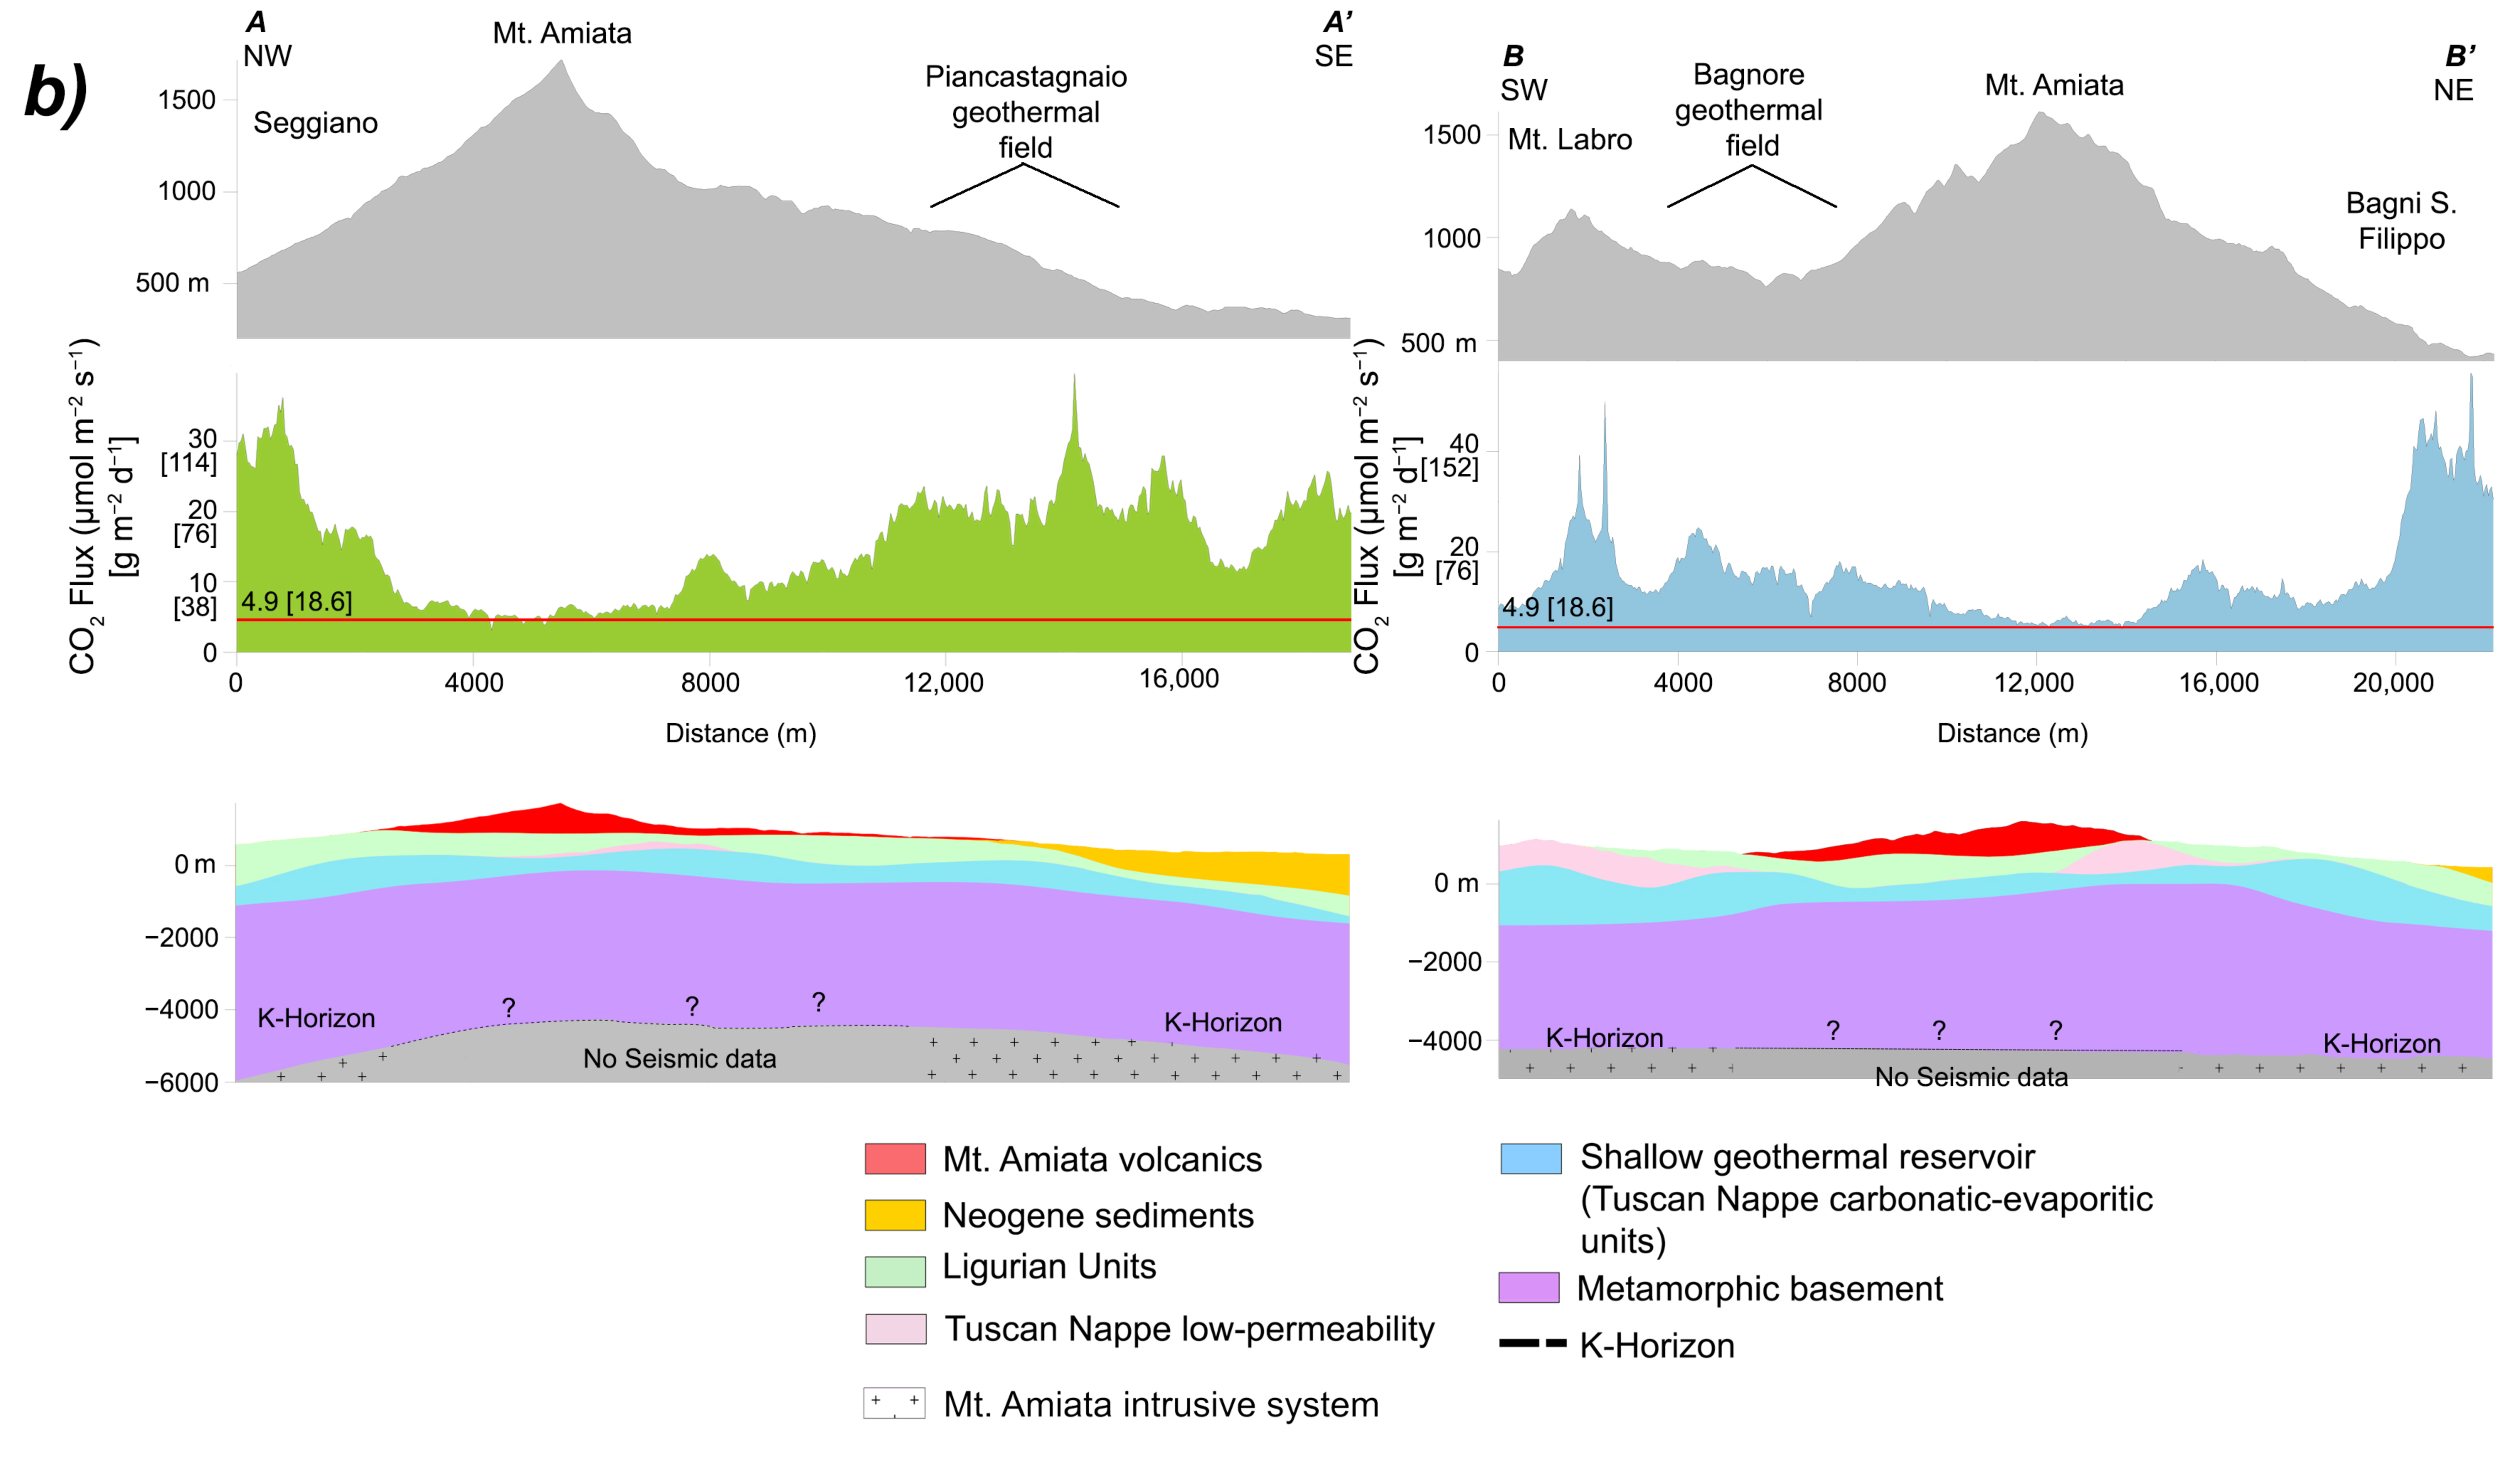
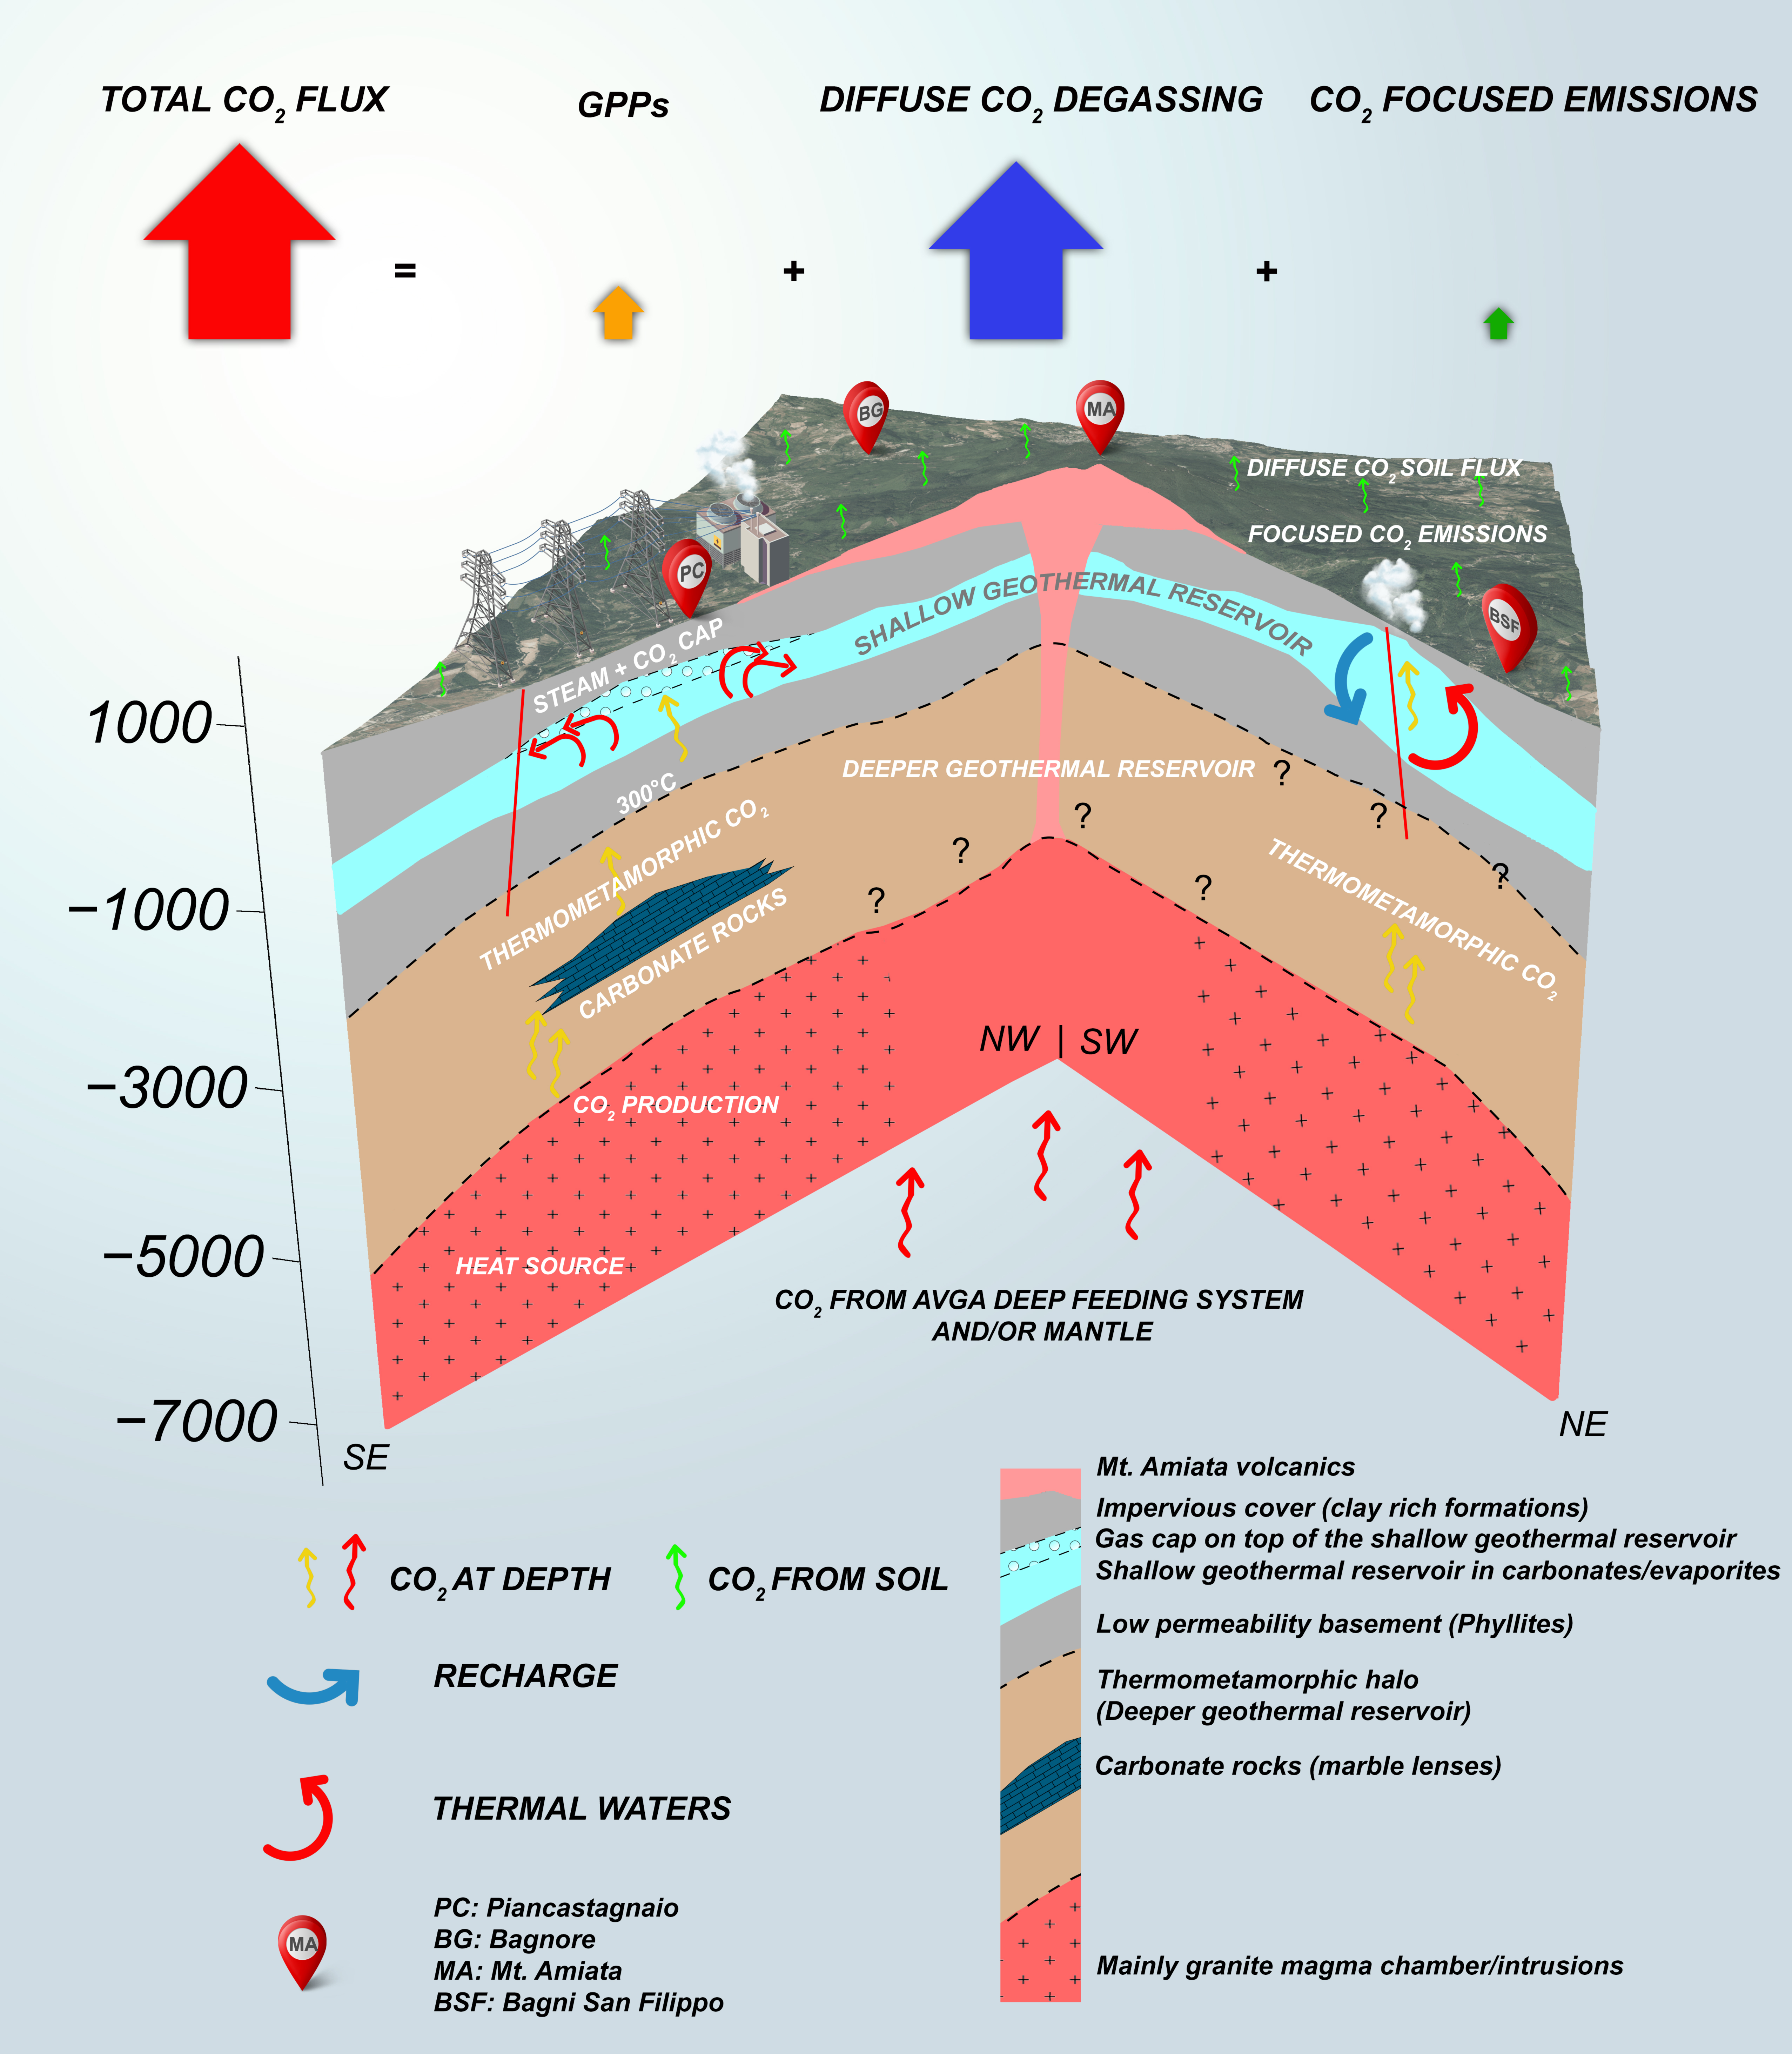
6.4. The Conceptual Model
7. Conclusions
Supplementary Materials
Author Contributions
Funding
Data Availability Statement
Acknowledgments
Conflicts of Interest
References
- Ferrari, R.; Conticelli, S.; Burlamacchi, L.; Manetti, P. Volcanological evolution of the Monte Amiata, Southern Tuscany: New geological and petrochemical data. Acta Vulcanol. 1996, 8, 41–56. [Google Scholar]
- Laurenzi, M.A.; Braschi, E.; Casalini, M.; Conticelli, S. New 40Ar-39Ar dating and revision of the geochronology of the Monte Amiata Volcano, Central Italy. Ital. J. Geosci. 2015, 134, 255–265. [Google Scholar] [CrossRef]
- Calcagnile, G.; Panza, G.F. The main characteristics of the lithosphere–asthenosphere system in Italy and surrounding regions. Pure Appl. Geophys. 1981, 119, 865–879. [Google Scholar] [CrossRef]
- Carmignani, L.; Decandia, F.A.; Disperati, L.; Fantozzi, P.L.; Lazzarotto, A.; Liotta, D.; Meccheri, M. Tertiary extensional tectonics in Tuscany (Northern Apenines Italy). Tectonophysics 1994, 238, 295–315. [Google Scholar] [CrossRef]
- Liotta, D. Analisi del settore centro-meridionale del bacino pliocenico di Radicofani (Toscana Meridionale). Boll. Soc. Geol. Ital. 1996, 115, 115–143. [Google Scholar]
- Gianelli, G.; Puxeddu, M.; Batini, F.; Bertini, G.; Dini, I.; Pandeli, E.; Nicolich, R. Geological model of a young volcano-plutonic system: The geothermal region of Monte Amiata (Tuscany, Italy). Geothermics 1988, 17, 719–734. [Google Scholar] [CrossRef]
- Ceroti, M.; Fiordelisi, A.; Fulignati, P.; Marianelli, P.; Sbrana, A.; Scazzola, S. Integrated Approach for a successful geothermal wells location in the Monte Amiata area (Southern Tuscany). In Proceedings of the World Geothermal Congress, Melbourne, Australia, 19–25 April 2015; pp. 1–9. [Google Scholar]
- Girolami, C.; Barchi, M.R.; Heyde, I.; Pauselli, C.; Vetere, F.; Cannata, A. The Gravity anomaly of Mount Amiata; Different approaches for understanding anomaly source distribution. Geophys. J. Int. 2017, 211, 865–882. [Google Scholar] [CrossRef]
- Brogi, A.; Fabbrini, L.; Liotta, D. Sb-Hg ore deposit distribution controlled by brittle structures: The case of the Selvena mining district (Monte Amiata, Tuscany, Italy). Ore Geol. Rev. 2011, 41, 35–48. [Google Scholar] [CrossRef]
- Vaselli, O.; Higueras, P.; Nisi, B.; Esbrì, J.M.; Cabassi, J.; Martìnez-Coronado, A.; Tassi, F.; Rappuoli, D. Distribution of gaseous Hg in the Mercury mining district of Mt. Amiata (Central Italy): A geochemical survey prior the reclamation project. Environ. Res. 2013, 125, 179–187. [Google Scholar] [CrossRef] [Green Version]
- Della Vedova, B.; Bellani, S.; Pellis, G.; Squarci, P. Deep temperatures and surface heat flow distribution. In Anatomy of an Orogen the Apennines and Adjacent Mediterranean Basins; Vai, G.B., Martini, I.P., Eds.; Springer: Dordrecht, The Netherlands, 2001; pp. 65–76. ISBN 978-94-015-9829-3. [Google Scholar]
- Calamai, A.; Cataldi, R.; Squarci, P.; Taffi, L. Geology, geophysics and hydrogeology of the Monte Amiata geothermal fields. Geothermics 1970, 1, 1–95. [Google Scholar]
- ARPAT (Tuscany Regional Agency for Environmental Protection), Monitoraggio Delle Aree Geotermiche Toscane—Anno 2018 (Monitoring of Geothermal Areas in Tuscany, 2018). Available online: http://www.arpat.toscana.it/documentazione/report/report-geotermia/monitoraggio-delle-aree-geotermiche-toscane-anno-2018 (accessed on 10 June 2021).
- Minissale, A.; Magro, G.; Vaselli, O.; Verrucchi, C.; Perticone, I. Geochemistry of water and gas discharges from the Mt. Amiata silicic complex and surrounding areas central Italy. J. Volcanol. Geotherm. Res. 1997, 79, 223–251. [Google Scholar] [CrossRef]
- Frondini, F.; Caliro, S.; Cardellini, C.; Chiodini, G.; Morgantini, N. Carbon dioxide degassing and thermal energy release in the Monte Amiata volcanic-geothermal area (Italy). Appl. Geochem. 2009, 24, 860–875. [Google Scholar] [CrossRef]
- Sbrana, A.; Marianelli, P.; Belgiorno, M.; Sbrana, M.; Ciani, V. Natural CO2 degassing in the Mount Amiata volcanic–geothermal area. J. Volcanol. Geotherm. Res. 2020, 397, 106852. [Google Scholar] [CrossRef]
- Marroni, M.; Moratti, G.; Costantini, A.; Conticelli, S.; Benvenuti, M.G.; Pandolfi, L.; Bonini, M.; Cornamusini, G.; Laurenzi, M.A. Geology of the Monte Amiata region, Southern Tuscany, Central Italy. Italian J. Geosci. 2015, 134, 171–199. [Google Scholar] [CrossRef]
- Barelli, A.; Ceccarelli, A.; Dini, I.; Fiordelisi, A.; Giorgi, N.; Lovari, F.; Romagnoli, P. A Review of the Mt. Amiata Geothermal System (Italy). In Proceedings of the World Geothermal Congress, Bali, Indonesia, 25–29 April 2010. [Google Scholar]
- Dini, I.; Ceccarelli, A.; Brogi, A.; Giorgi, N.; Galleni, P.; Rossi, L. Geological Evaluation of the Base of the Mt. Amiata Volcanic Complex (Tuscany, Italy). In Proceedings of the World Geothermal Congress, Bali, Indonesia, 25–29 April 2010. [Google Scholar]
- Fulignati, P.; Marianelli, P.; Sbrana, A.; Ciani, V. 3D geothermal modelling of the Mount Amiata hydrothermal system in Italy. Energies 2014, 7, 7434–7453. [Google Scholar] [CrossRef] [Green Version]
- Bertini, G.; Cappetti, G.; Dini, I.; Lovari, F. Deep drilling results and updating of geothermal knowledge on the Mount Amiata area. In Proceedings of the World Geothermal Congress, Florence, Italy, 18–31 May 1995; pp. 1283–1286. [Google Scholar]
- Orlando, L.; Bernabini, M.; Bertini, G.; Cameli, G.M.; Dini, I. Interpretazione preliminare del minimo gravimetrico del Monte Amiata. Studi Geol. Camerti 1994, 1, 175–181. [Google Scholar]
- Gianelli, G.; Ruggieri, G.; Mussi, M. Isotopic and fluid inclusion study of hydrothermal and metamorphic carbonates in the Larderello geothermal field and surrounding areas, Italy. Geothermics 1997, 26, 393–417. [Google Scholar] [CrossRef]
- Liotta, D.; Ranalli, G. Correlation between seismic reflectivity and rheology in extended lithosphere: Southern Tuscany, inner Northern Apennines, Italy. Tectonophysics 1999, 315, 109–122. [Google Scholar] [CrossRef]
- Brogi, A. The structure of the Monte Amiata volcano-geothermal area (Northern Apennines, Italy): Neogene-Quaternary compression versus extension. Int. J. Earth Sci. 2008, 97, 677–703. [Google Scholar] [CrossRef]
- Bertini, G.; Casini, M.; Gianelli, G.; Pandeli, E. Geological structure of a long living geothermal system, Larderello, Italy. Terra Nova 2006, 18, 163–169. [Google Scholar] [CrossRef]
- Carella, M.; Fulignati, P.; Musumeci, G.; Sbrana, A. Metamorphic consequences of Neogene thermal anomaly in the northern Apennines (Radicondoli-Travale area, Larderello geothermal field—Italy). Geodinamica Acta 2000, 13, 345–366. [Google Scholar] [CrossRef]
- D’Amore, F.; Fancelli, R.; Saracco, L.; Truesdell, A. Gas geothermometry based on CO content: Application to Italian geothermal fields. In Proceedings of the 12th Workshop on Geothermal Reservoir Engineering, Stanford, CA, USA, 20–22 January 1987; pp. 247–252. [Google Scholar]
- Gasparrini, M.; Ruggieri, G.; Brogi, A. Diagenesis versus hydrothermalism and fluid–rock interaction within the Tuscan Nappe of the Monte Amiata CO2-rich geothermal area (Italy). Geofluids 2013, 13, 159–179. [Google Scholar] [CrossRef]
- ENEL, ENI-AGIP, CNR and ENEA with the Coordination of the Ministry, 1988, Geothermal Resources National Inventory, Law December 9, 1986 n.896, Repealed by Legislative Decree February 11, 2010 n.22. Available online: https://unmig.mise.gov.it/index.php/it/dati/risorse-geotermiche/inventario-delle-risorse-geotermiche-nazionali (accessed on 10 June 2021).
- Frondini, F.; Caliro, S.; Cardellini, C.; Chiodini, G.; Morgantini, N.; Parello, F. Carbon dioxide degassing from Tuscany and Northern Latium (Italy). Global Planet. Chang. 2008, 61, 89–102. [Google Scholar] [CrossRef]
- Doveri, M.; Nisi, B.; Cerrina Feroni, A.; Ellero, A.; Menichini, M.; Lelli, M.; Masetti, G.; Da Prato, S.; Principe, C.; Raco, B. Geological, hydrodynamic and geochemical features of the volcanic aquifer of Mt. Amiata (Tuscany, Central Italy): An overview. Acta Vulcanol. 2012, 23, 51–72. [Google Scholar]
- Barazzuoli, P.; Bosco, G.; Nante, N.; Rappuoli, D.; Salleolini, M. The aquifer of Mount Amiata: Evaluation of perennial yields its quality. Mem. Soc. Geol. Ital. 1994, 48, 825–832. [Google Scholar]
- Chiodini, G.; Cardellini, C.; Amato, A.; Boschi, E.; Caliro, S.; Frondini, F.; Ventura, G. Carbon dioxide Earth degassing and seismogenesis in central and southern Italy. J. Geophys. Res. 2004, 31. [Google Scholar] [CrossRef]
- Vaselli, O.; Cuccoli, F.; Buccianti, A.; Nisi, B.; Lognoli, E.; Lombardi, L.; Moretti, S.; Capannesi, L.; Ramaldi, E.; Tassi, F.; et al. Le emanazioni gassose nel Comune di Castiglione d’Orcia, Final Report of the Agreement between the Department of Earth Sciences of Florence and the Civil Protection of Tuscany; Florence, Italy, July 2006; 120p. [Google Scholar]
- Nisi, B.; Vaselli, O.; Tassi, F.; de Elio, J.; Ortega, M.; Caballero, J.; Rappuoli, D.; Mazadiego, L.F. Origin of the gases released from the Acqua Passante and Ermeta wells (Mt. Amiata, central Italy) and possible environmental implications for their closure. Ann. Geophys. 2014, 57, S0438. [Google Scholar] [CrossRef]
- Lenzi, A.; Caprai, A. Emissioni naturali di idrogeno solforato nell’area amiatina parte I: Prospezioni. In Proceedings of the CODICE ARMONICO 2016, Castiglioncello, Italy, 13–15 October 2016; Volume 6. [Google Scholar]
- Lenzi, A.; Caprai, A. Emissioni naturali di idrogeno solforato nell’area amiatina parte II: Misure. In Proceedings of the CODICE ARMONICO 2016, Castiglioncello, Italy, 13–15 October 2016; Volume 6. [Google Scholar]
- MaGa, Mapping Gas Emissions. Available online: http://www.magadb.net/ (accessed on 10 June 2021).
- Brogi, A.; Fabbrini, L. Extensional and strike-slip tectonics across the Monte Amiata–Monte Cetona transect (Northern Apennines, Italy) and seismotectonic implications. Tectonophysics 2009, 476, 195–209. [Google Scholar] [CrossRef]
- Brogi, A.; Liotta, D.; Meccheri, M.; Fabbrini, L. Transtensional shear zones controlling volcanic eruptions: The Middle Pleistocene Mt. Amiata volcano (inner Northern Apennines, Italy). Terra Nova 2010, 22, 137–146. [Google Scholar] [CrossRef]
- Orlando, A.; Conte, A.M.; Borrini, D.; Perinelli, C.; Gianelli, G.; Tassi, F. Experimental investigation of CO2-rich fluids production in a geothermal area: The Mt. Amiata (Tuscany, Italy) case study. Chem. Geol. 2010, 274, 177–186. [Google Scholar] [CrossRef]
- D’Amore, F.; Panichi, C. Evaluation of deep temperatures of hydrothermal systems by a new gas geothermometer. Geochim. Cosmochim. Acta 1980, 44, 549–556. [Google Scholar] [CrossRef]
- Chiodini, G.; Baldini, A.; Barberi, F.; Carapezza, M.L.; Cardellini, C.; Frondini, F.; Granieri, D.; Ranaldi, M. Carbon dioxide degassing at Latera caldera (Italy): Evidence of geothermal reservoir and evaluation of its potential energy. J. Geophys. Res. 2007, 112(B12). [Google Scholar] [CrossRef]
- Madsen, R.; Xu, L.; Claassen, B.; Mc Dermitt, D. Surface Monitoring Method for Carbon Capture and Storage Projects. Energy Procedia 2009, 1, 2161–2168. [Google Scholar] [CrossRef] [Green Version]
- Chiodini, G.; Cioni, R.; Guidi, M.; Marini, L.; Raco, B. Soil CO2 flux measurements in volcanic and geothermal areas. Appl. Geochem. 1998, 13, 543–552. [Google Scholar] [CrossRef]
- Licor Bioscience. LI-8100 Automated Soil CO2 Flux System & LI-8150 Multiplexer Instruction Manual; LI-COR Inc.: Lincoln, NE, USA, 2010. [Google Scholar]
- Sinclair, A.J. Selection of threshold values in geochemical data using probability graphs. J. Geochem. Explor. 1974, 3, 129–149. [Google Scholar] [CrossRef]
- Cardellini, C.; Chiodini, G.; Frondini, F. Application of stochastic simulation to CO2 flux from soil: Mapping and quantification of gas release. J. Geophys. Res. 2003, 108. [Google Scholar] [CrossRef]
- David, M. Geostatistical Ore Reserve Estimation (Developments in Geomathematics 2); Elsevier: New York, NY, USA, 1977. [Google Scholar]
- Remy, N.; Boucher, A.; Wu, J. Applied Geostatistics with SGeMS: A User’s Guide; Cambridge University Press: Cambridge, UK, 2009. [Google Scholar]
- Bertani, R.; Thain, I. Geothermal power generating plant CO2 emission survey. IGA News 2002, 49, 1–3. [Google Scholar]
- Óladóttir, A.A.; Fridriksson, T.H. The Evolution of CO2 Emissions and Heat Flow through Soil since 2004 in the Utilized Reykjanes Geothermal Area, SW Iceland: Ten Years of Observations on Changes in Geothermal Surface Activity. In Proceedings of the World Geothermal Congress, Melbourne, Australia, 19–25 April 2015. [Google Scholar]
- Ármansson, H. CO2 emission from Geothermal Plants. In Proceedings of the International Geothermal Conference, Reykjavík, Iceland, 14–17 September 2003. Session #12. [Google Scholar]
- Manzella, A.; Serra, D.; Cesari, G.; Bargiacchi, E.; Cei, M.; Cerutti, P.; Conti, P.; Giudetti, G.; Lupi, M.; Vaccaro, M. Geothermal Energy Use, Country Update for Italy. In Proceedings of the European Geothermal Congress, Den Haag, The Netherlands, 11–14 June 2019. [Google Scholar]
- GSE (Gestore dei Servizi Energetici). Statistical Report 2018: Energy from Renewables in Italy; Edizioni GSE: Roma, Italy, 2019; pp. 101–105. [Google Scholar]
- ARPAT (Tuscany Regional Agency for Environmental Protection). Monitoraggio delle Aree Geotermiche Toscane—Anno 2016 (Monitoring of Geothermal Areas in Tuscany, 2016). Available online: http://www.arpat.toscana.it/documentazione/report/report-geotermia/monitoraggio-delle-aree-geotermiche-toscane-anno-2016 (accessed on 10 June 2021).
- ARPAT (Tuscany Regional Agency for Environmental Protection). Monitoraggio delle Aree Geotermiche Toscane—Anno 2014 (Monitoring of Geothermal Areas in Tuscany, 2014). Available online: http://www.arpat.toscana.it/documentazione/report/report-geotermia/monitoraggio-delle-aree-geotermiche-toscane-anno-2014 (accessed on 10 June 2021).
- Bravi, M.; Basosi, R. Environmental impact of electricity from selected geothermal power plants in Italy. J. Clean. Prod. 2014, 66, 301–308. [Google Scholar] [CrossRef]
- Ferrara, N.; Parisi, M.L.; Basosi, R. Emissions Data from Geothermal Energy Exploitation in Italy. Mendeley Data V1, 2019. Available online: https://data.mendeley.com/datasets/gvpy69796n/1 (accessed on 29 July 2021).
- Conti, P.; Cei, M.; Razzano, F. Geothermal Energy Use, Country Update for Italy (2010–2015). In Proceedings of the European Geothermal Congress, Strasbourg, France, 19–24 September 2016. [Google Scholar]
- ISPRA, Istituto Superiore per la Protezione e la Ricerca Ambientale. Fattori di Emissione Atmosferica di Gas a Effetto Serra nel Settore Elettrico Nazionale e Nei Principali Paesi Europei; Report n. 303/2019; ISPRA: Rome, Italy, 2019; ISBN 978-88-448-0945-4.
- Enel Green Power. Dichiarazione Ambientale anni 2017–2019, Dati Relativi All’anno 2016 Per Gli Impianti di Produzione di Energia Elettrica da Fonti Rinnovabili di Enel Green Power S.p.A. Geotermia Italia. Available online: https://corporate.enel.it/content/dam/enel-it/progetti/documenti/impianti-emas-geotermici/ItaliaEnelGreenPower/Dichiarazione-Ambientale-2017.pdf (accessed on 10 June 2021).
- Orkustofnun, National Energy Authority, Data Repository. Available online: http://www.os.is/orkustofnun/gagnasofn/talnaefni (accessed on 10 June 2021).
- Fridriksson, T.; Merino, A.M.; Orucu, A.Y.; Audinet, P. Greenhouse gas emissions from geothermal power production. In Proceedings of the 42nd Workshop on Geothermal Reservoir Engineering, Stanford University, Stanford, CA, USA, 13–15 February 2017. [Google Scholar]
- Yuniarto, T.E.B.S.; Heviati, E. Geothermal Power Plant Emissions in Indonesia. In Proceedings of the World Geothermal Congress, Melbourne, Australia, 19–25 April 2015. [Google Scholar]
- Bloomfield, K.K.; Moore, J.N.; Neilson, R.N. Geothermal energy reduces greenhouse gases. Geotherm. Resour. Counc. Bull. 2003, 32, 77–79. [Google Scholar]
- US DoE (U.S. Department of Energy). The Energy Information Administration (EIA), Electric Power Generation and Fuel Consumption, 1989–2010. Power Plants Generation Report and Emissions from Energy Consumption for Electricity Generation Report. Available online: https://www.eia.gov/totalenergy/data/annual/index.php (accessed on 10 June 2021).


| Surveyed Area (km2) | Number of Measurements | CO2 Flux Range (µmol m−2 s−1) (g m−2 d−1) | CO2 Flux Mean (µmol m−2 s−1) (g m−2 d−1) | CO2 Flux Median (µmol m−2 s−1) (g m−2 d−1) |
|---|---|---|---|---|
| 280 | 3208 | 0.43–296.41 (1.6–1127) | 14.97 (56.9) | 11.2 (42.6) |
| CO2 Population | Proportion (%) | Mean and 95% Confidence Interval (µmol m−2 s−1) (g m−2 d−1) | Threshold (µmol m−2 s−1) (g m−2 d−1) |
|---|---|---|---|
| Population A | 20 | 4.9 (4.78–5.03) [18.6 (18.18–19.13)] | 10.41 (39.6) |
| Population B | 74 | 12.3 (12–12.6) [46.8 (45.6–48)] | 25 (95) |
| Population C | 6 | 49.75 (47.6–51.7) [189.2 (181–196.6)] | 32.6 (123.9) |
| Plant Name | Year Commissioned | Number of Units | Type | Installed Capacity (MWe) |
|---|---|---|---|---|
| Bagnore 3 | 1998 | 1 | Single Flash | 20 |
| Binary Group Bagnore3 | 2013 | 1 | Binary-ORC | 1 |
| Bagnore 4 | 2014 | 2 | Single Flash | 40 |
| Piancastagnaio 3 | 1990 | 1 | Single Flash | 20 |
| Piancastagnaio 4 | 1991 | 1 | Single Flash | 20 |
| Piancastagnaio 5 | 1994 | 1 | Single Flash | 20 |
| Total | - | - | - | 121 |
| Year | No. of GPPs | GPPs’ Total Annual CO2 Emissions (t/y) | Annual Electricity Production (GWh/y) | CO2 g/kWh |
|---|---|---|---|---|
| 2018 | 5/5 | 515,193 | 1064 (a) | 484 |
| 2016 | 4/5 | 449,299 | 842 (b) | 524 |
| 2014 | 4/4 | 342,669 | 681 (c) | 503 |
| 2002–2009 | Variable | - | - | 497 (d) |
| Geothermal Area | Year | CO2 g/kWh | Reference |
|---|---|---|---|
| Larderello (Italy) | 2018 | 343 | Calculated based on ARPAT data |
| Italian geothermal fields (average) | 2014 | 321 | [63] |
| Italian geothermal fields (average) | 2015 | 343 | [63] |
| Italian geothermal fields (average) | 2016 | 311 | [63] |
| Iceland | 2018 | 26 | [64] |
| Iceland | 2012 | 34 | [65] |
| Indonesia | 2013 | 62.9 | [66] |
| USA | 2003 | 91 | [67] |
| USA | 2010 | 25.7 | [68] |
| California | 2014 | 107 | [65] |
| California, the geysers | 2013 | 45 | [65] |
| California, Coso | 2013 | 245 | [65] |
| New Zealand | 2012 | 104 | [65] |
| Turkey | 2014 | 1050 | [65] |
| Global | 2001 | 122 | [52] |
| Fossil-Fueled Power Plants | CO2 g/kWh (2017) | Percentage of Fossil-Fuel Electricity Production in 2017 |
|---|---|---|
| Coal | 870 | 15.6 |
| Natural gas | 368.3 | 67.2 |
| Derived gas | 1498.4 | 1.2 |
| Petroleum | 548.9 | 5.5 |
| Others * | 133.3 | 10.5 |
| Diffuse Degassing Area | Diffuse CO2 Degassing (Biological Component) (t/d) | Diffuse CO2 Degassing (Deep Component) (t/d) | GPPs (t/d) | CO2 Focused Emissions (t/d) | Sum (t/d) |
|---|---|---|---|---|---|
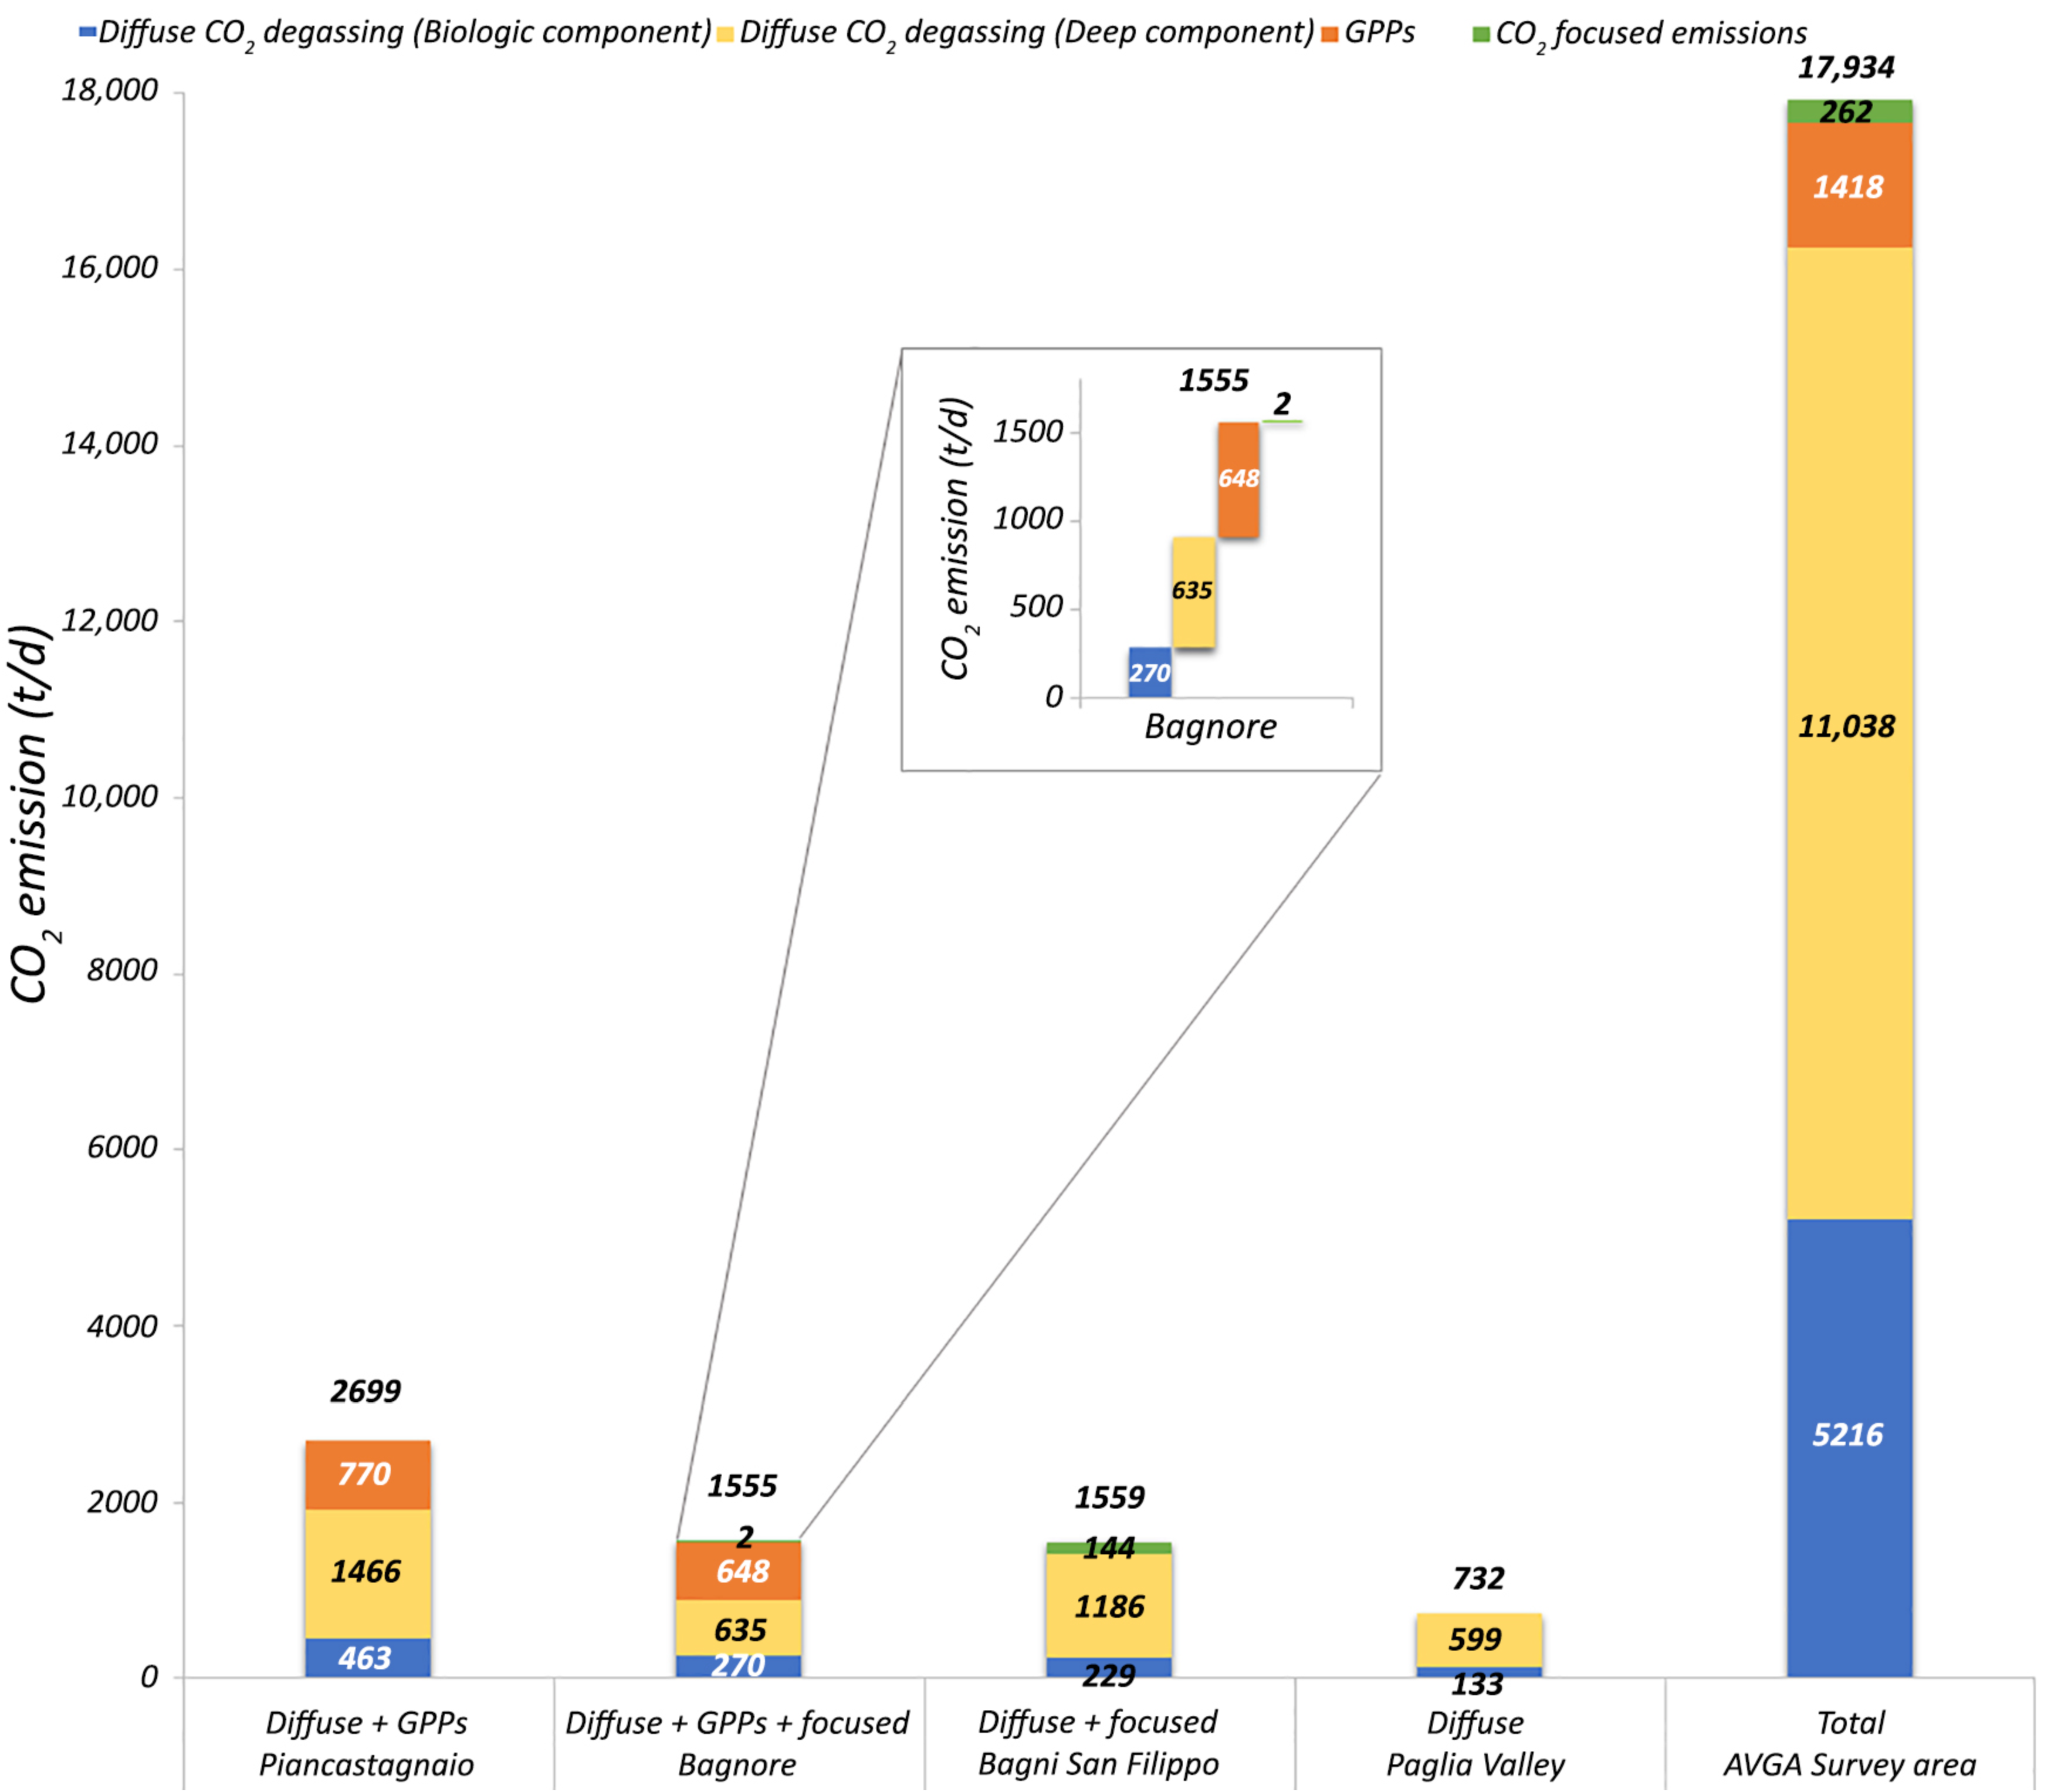
| Piancastagnaio (24.8 km2) (brownfield) | 463 | 1466 | 770 | - | 2699 |
| Bagnore (14.5 km2) (brownfield) | 270 | 635 | 648 | 2 | 1555 |
| Bagni San Filippo (12.3 km2) (greenfield) | 229 | 1186 | - | 144 | 1559 |
| Paglia Valley (7.13 km2) (greenfield) | 133 | 599 | - | - | 732 |
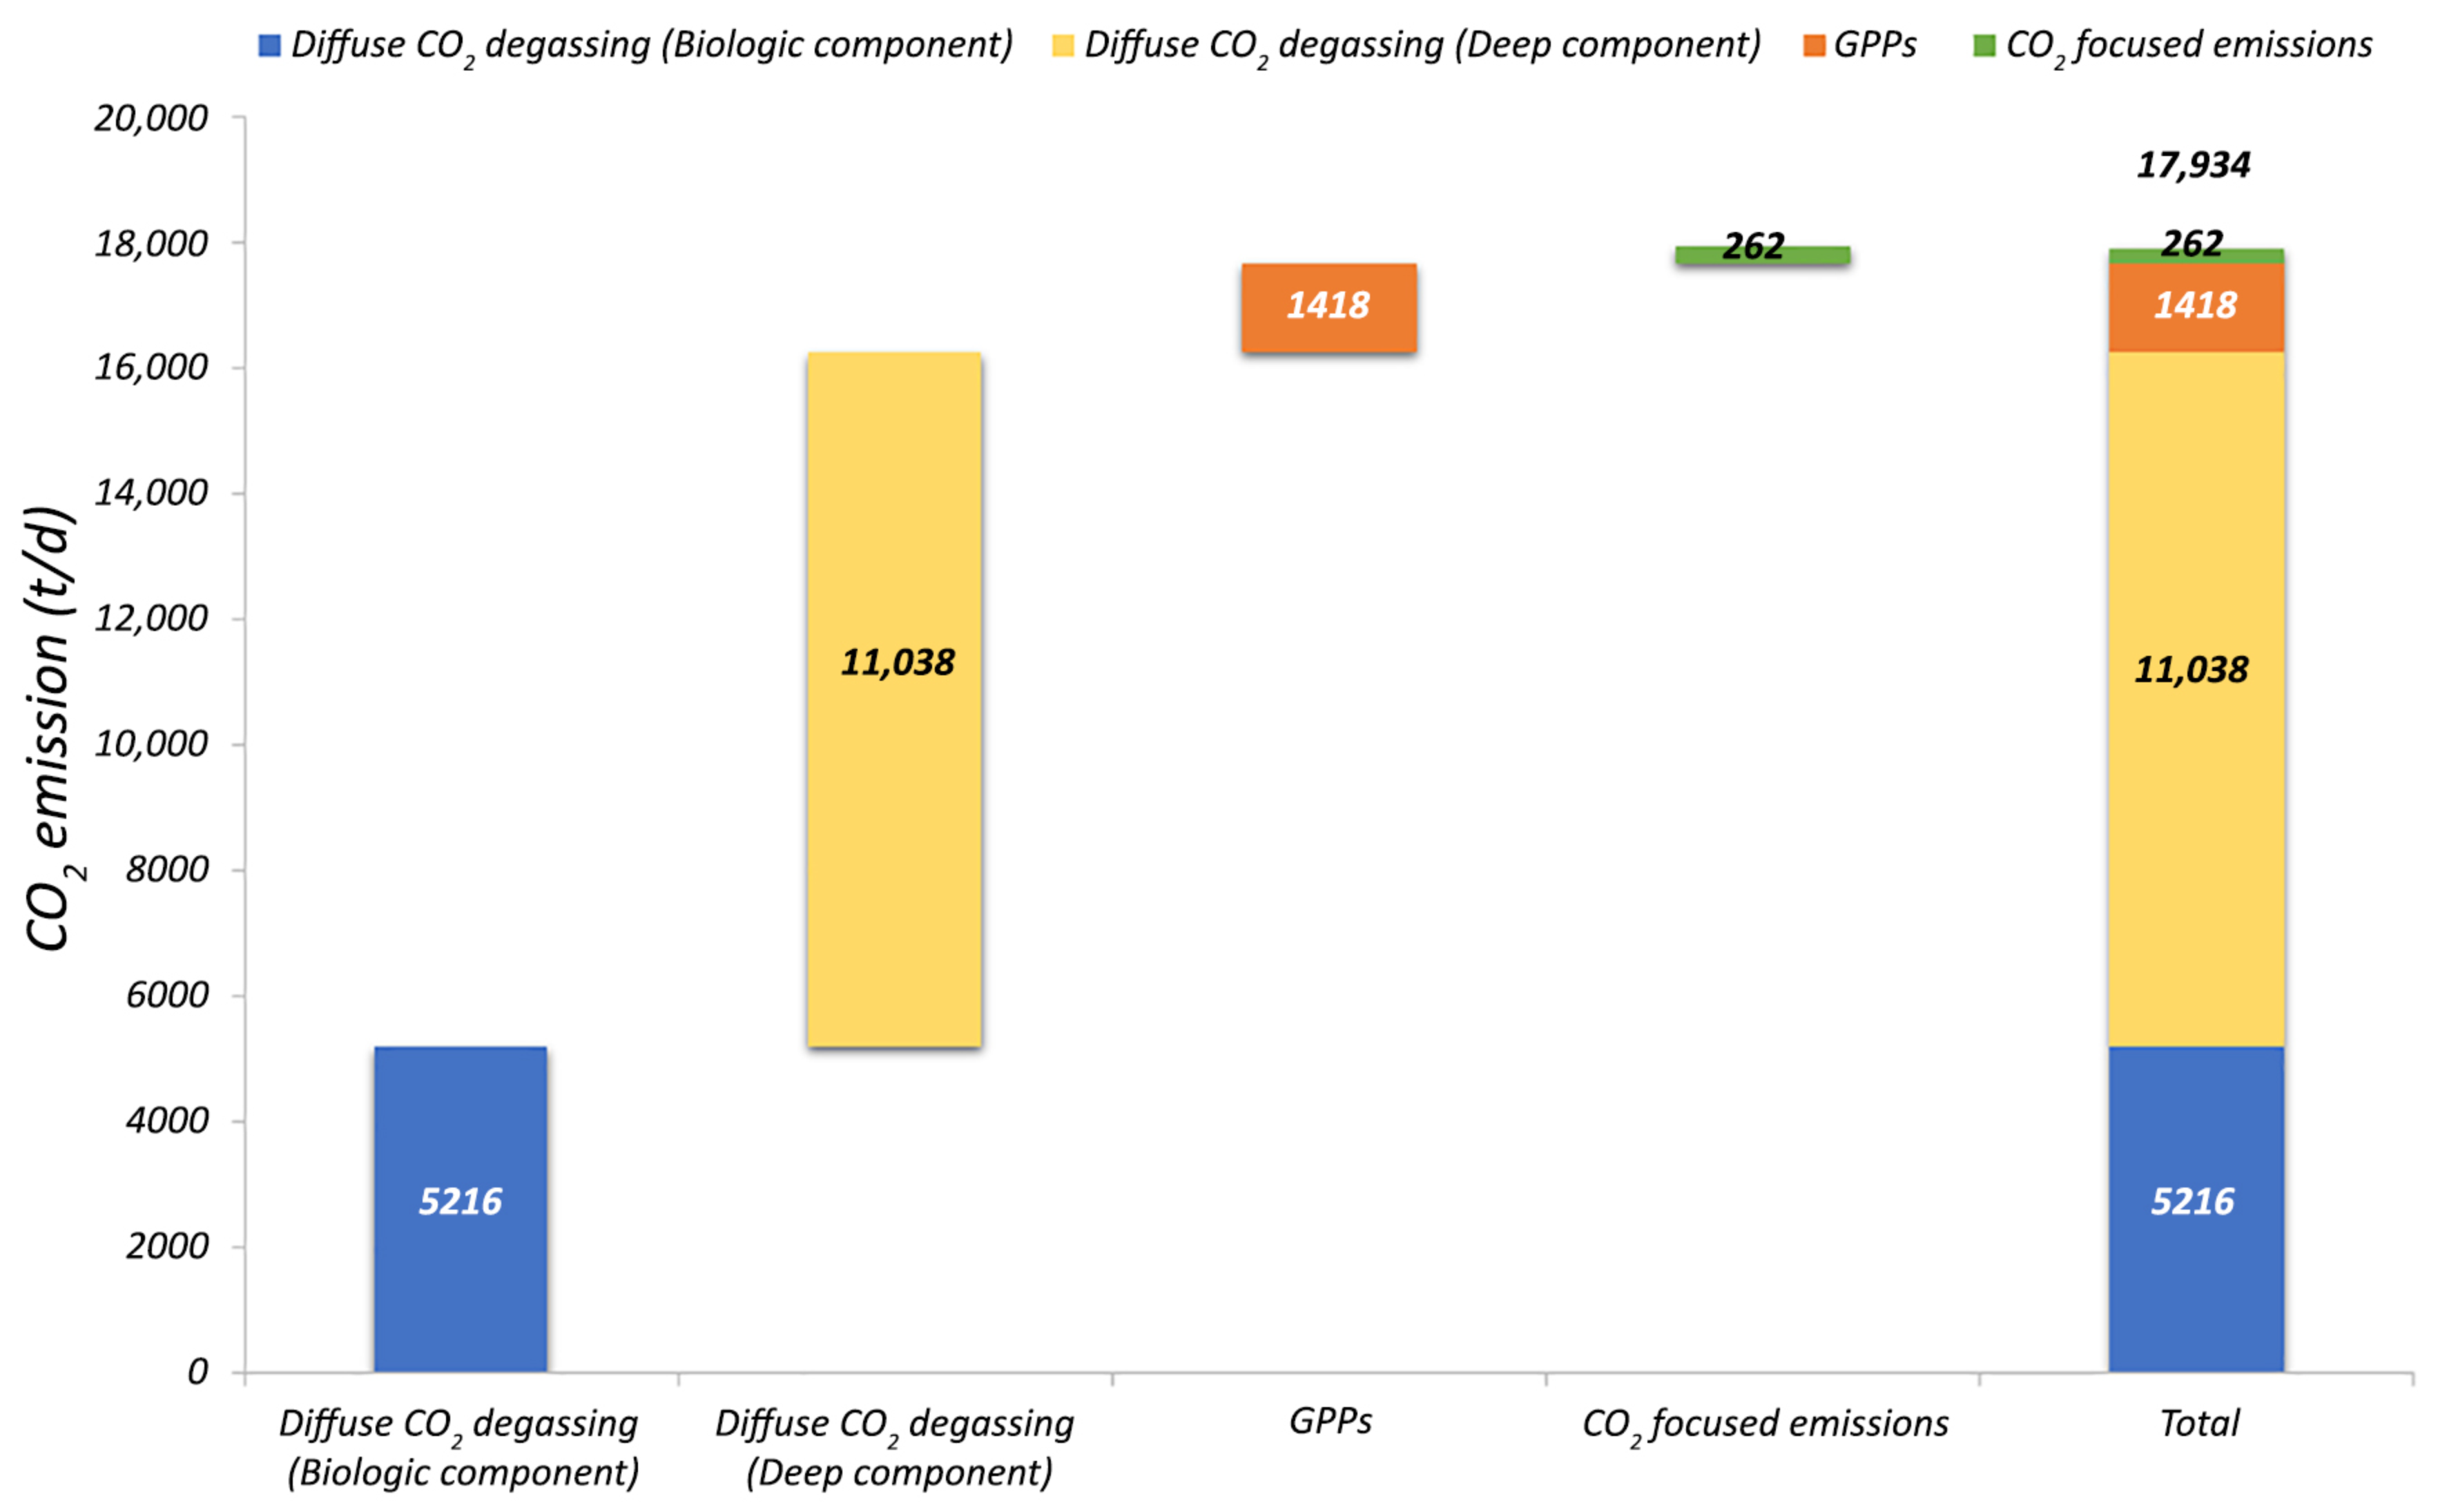
| Survey Area (280 km2) | 5216 | 11,038 | 1418 | 262 (*) | 17,934 |
| Diffuse Degassing Area | Diffuse CO2 Degassing (Biological Component) (t/d km2) | Diffuse CO2 Degassing (Deep Component) (t/d km2) | GPPs (t/d km2) | Sum (t/d km2) |
|---|---|---|---|---|
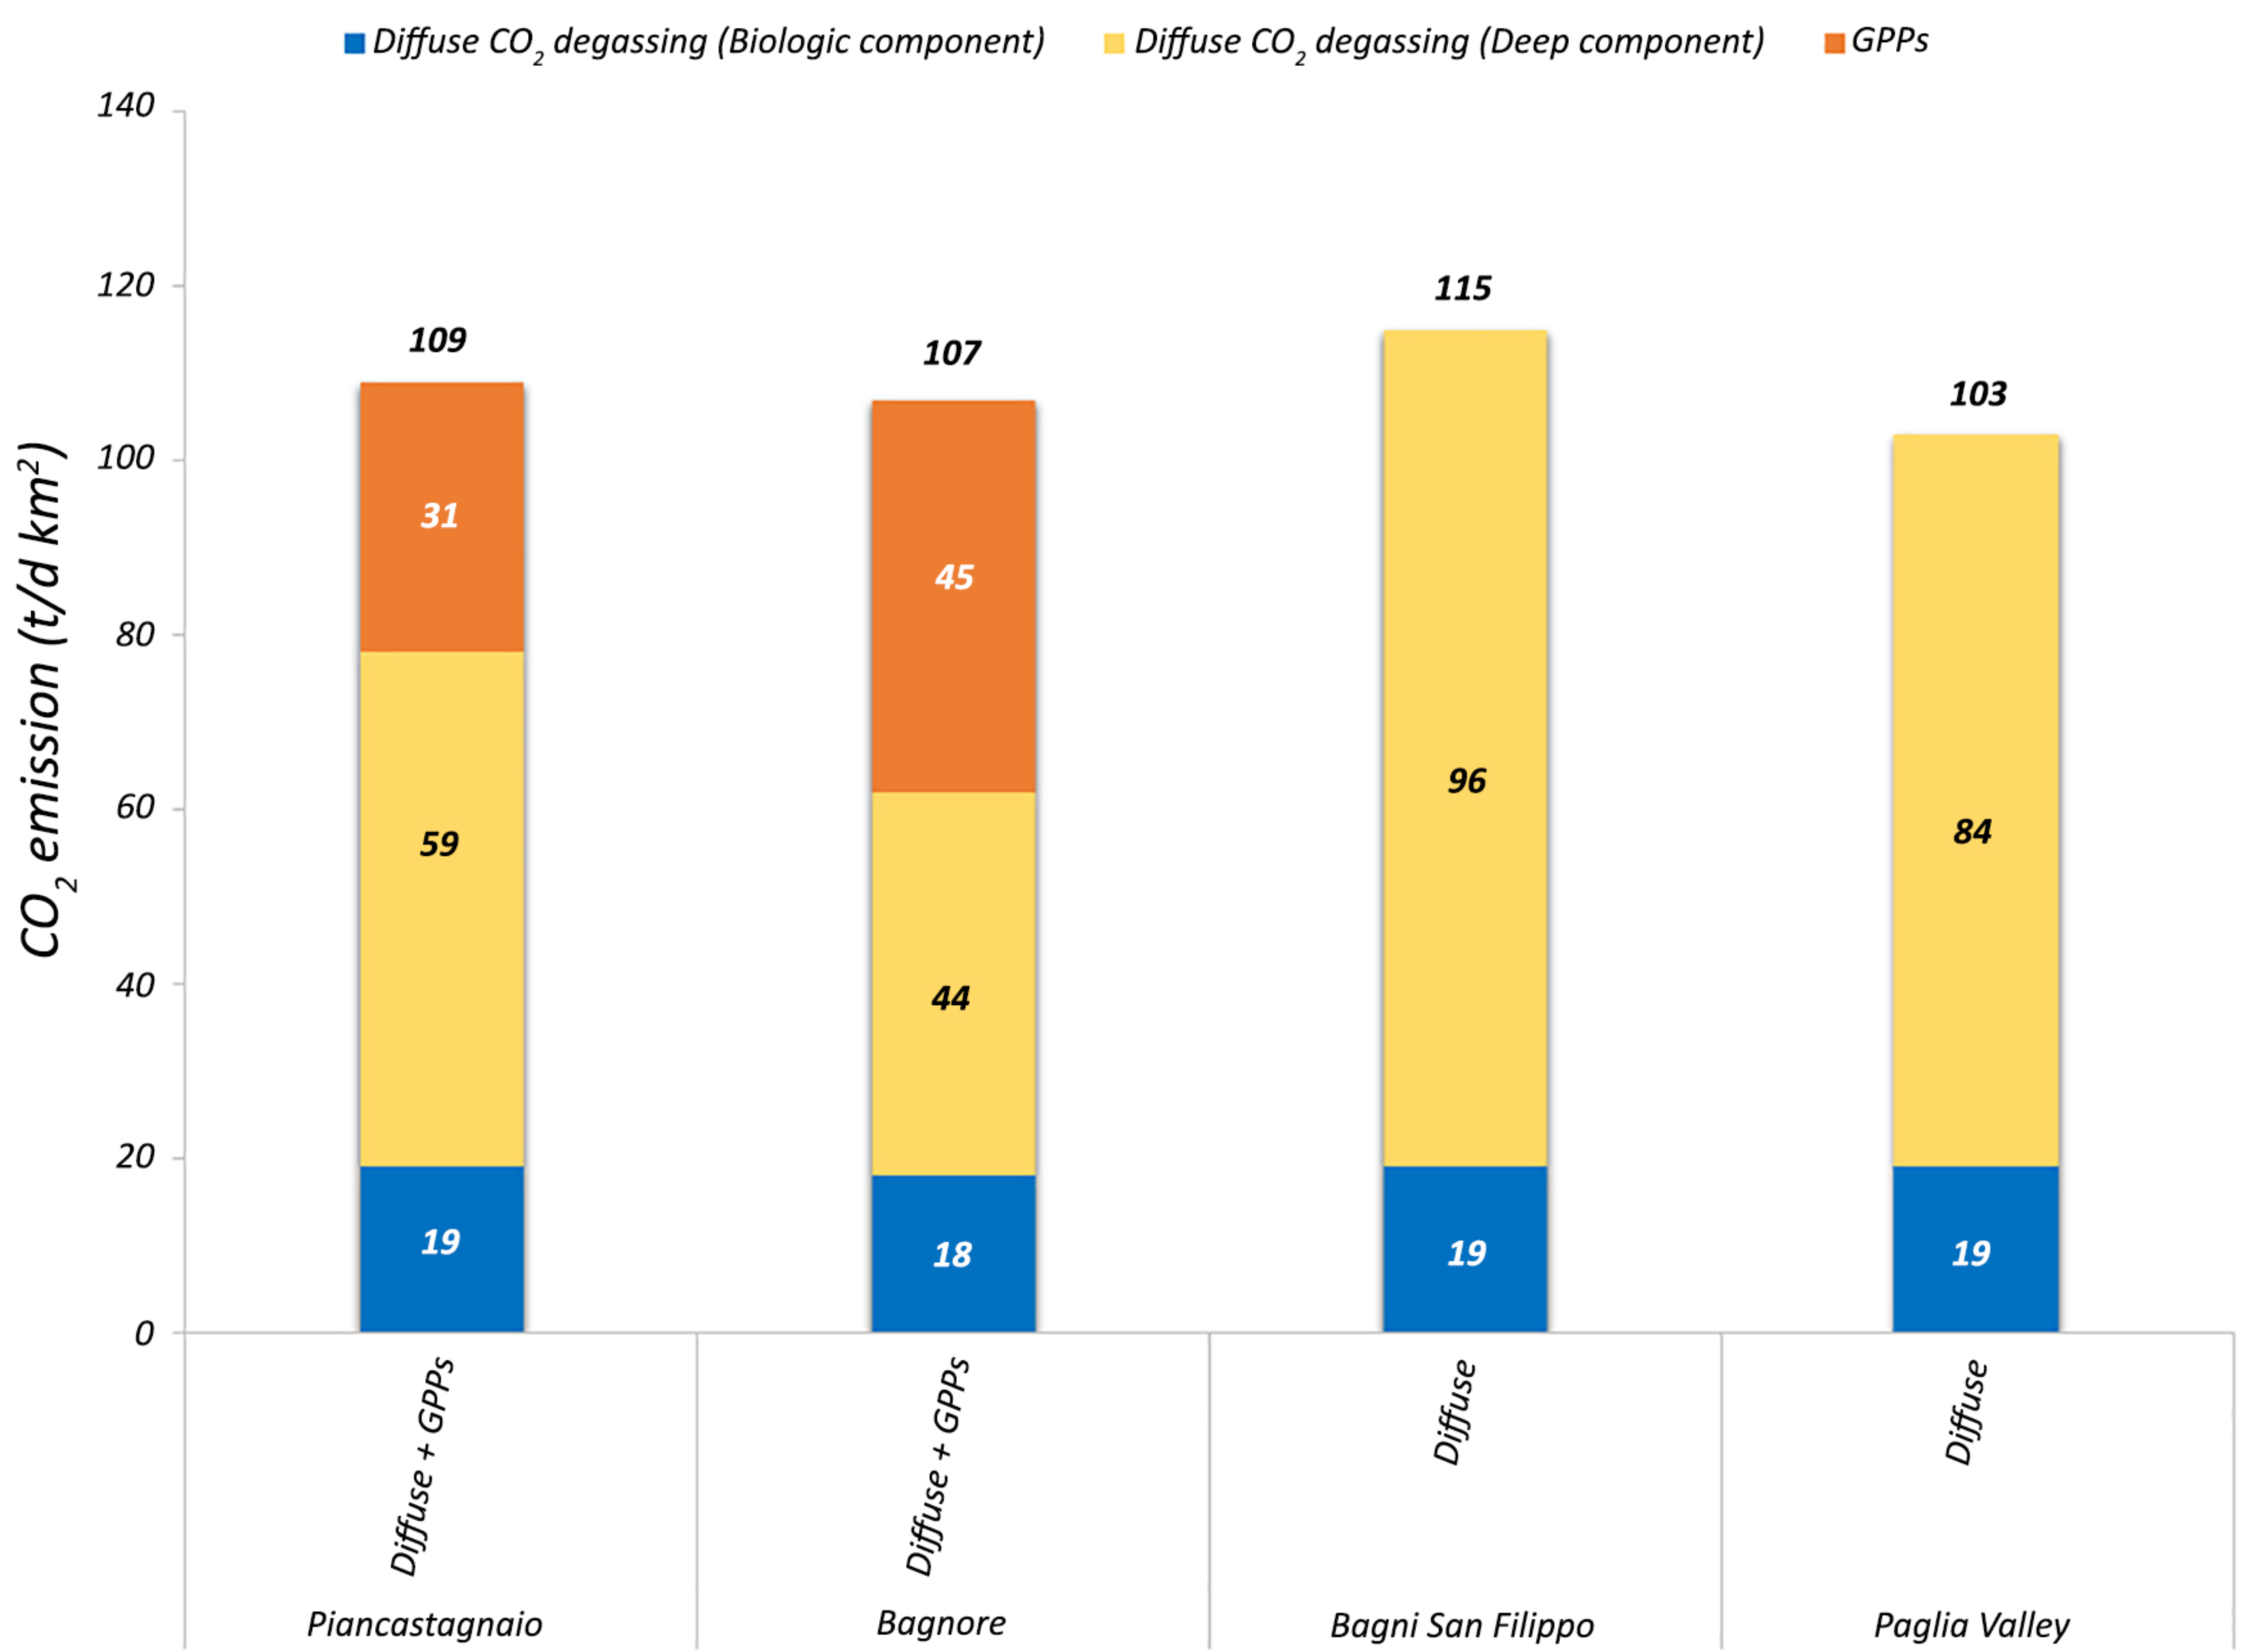
| Piancastagnaio (24.8 km2) (brownfield) | 19 | 59 | 31 | 109 |
| Bagnore (14.5 km2) (brownfield) | 18 | 44 | 45 | 107 |
| Bagni San Filippo (12.3 km2) (greenfield) | 19 | 96 | - | 115 |
| Paglia Valley (7.13 km2) (greenfield) | 19 | 84 | - | 103 |
Publisher’s Note: MDPI stays neutral with regard to jurisdictional claims in published maps and institutional affiliations. |
© 2021 by the authors. Licensee MDPI, Basel, Switzerland. This article is an open access article distributed under the terms and conditions of the Creative Commons Attribution (CC BY) license (https://creativecommons.org/licenses/by/4.0/).
Share and Cite
Sbrana, A.; Lenzi, A.; Paci, M.; Gambini, R.; Sbrana, M.; Ciani, V.; Marianelli, P. Analysis of Natural and Power Plant CO2 Emissions in the Mount Amiata (Italy) Volcanic–Geothermal Area Reveals Sustainable Electricity Production at Zero Emissions. Energies 2021, 14, 4692. https://doi.org/10.3390/en14154692
Sbrana A, Lenzi A, Paci M, Gambini R, Sbrana M, Ciani V, Marianelli P. Analysis of Natural and Power Plant CO2 Emissions in the Mount Amiata (Italy) Volcanic–Geothermal Area Reveals Sustainable Electricity Production at Zero Emissions. Energies. 2021; 14(15):4692. https://doi.org/10.3390/en14154692
Chicago/Turabian StyleSbrana, Alessandro, Alessandro Lenzi, Marco Paci, Roberto Gambini, Michele Sbrana, Valentina Ciani, and Paola Marianelli. 2021. "Analysis of Natural and Power Plant CO2 Emissions in the Mount Amiata (Italy) Volcanic–Geothermal Area Reveals Sustainable Electricity Production at Zero Emissions" Energies 14, no. 15: 4692. https://doi.org/10.3390/en14154692