Article

Nexus between Economic Policy Uncertainty and Renewable Energy Consumption in BRIC Nations: The Mediating Role of Foreign Direct Investment and Financial Development

1
School of Management, China University of Mining and Technology-Beijing, Beijing 100083, China
2
School of Business and Economics, United International University, Dhaka 1212, Bangladesh
*
Author to whom correspondence should be addressed.
Energies 2021, 14(15), 4687; https://doi.org/10.3390/en14154687
Submission received: 14 July 2021 / Revised: 24 July 2021 / Accepted: 26 July 2021 / Published: 2 August 2021

Abstract

:
In recent literature, the impact of economic policy uncertainty (EPU) on macro aspects have been investigated, but the aspect of energy, precisely renewable energy still to explore. The motivation of the study is to produce fresh evidence regarding the nexus between EPU and renewable energy consumption (REC) with the mediating role of forcing direct investment (FDI) and financial development (FD) in BRIC nations for the period 1997q1–2018q4. The study applied unit root tests following Ng-Perron and Zivot and Andrews for detecting variable’s stationary properties. The long-run cointegration was evaluated by implementing Bayer, Hanck combined the cointegration test, Bound testing approach, and tBDM test. Both linear and non-linear ARDL were implemented to evaluate long-run and short-run shocks, and directional causality was assessed through a non-granger causality test. Furthermore, the study implemented robustness by implementing fully-modified OLS, dynamic OLS, and canonical cointegrating regression (CCR). Unit root test established the variables are stationary after the first difference; moreover, the Bayer and Hanck cointegration test confirmed the long-run association between EPU, FD, FD, and REC in BRIC nations. Accruing to ARDL estimation, adverse effects running from EPU to REC both in the long run and short run. Furthermore, the positive statistically significant linkage revealed for FDI and FD to REC implies that clean energy integration could be augmented with continual inflows of FDI and development of the financial sector. Model estimation with asymmetric assumption, the study documented asymmetric effects running from EPU, FDI, and FD to renewable energy consumption, especially in the long run. Finally, the directional causality revealed unidirectional causality between REC and EPU, whereas the feedback hypothesis was disclosed for FDI and REC] and FD and REC. Study findings postulated that the role of foreign direct investment and financial development is critically significant because technological advancement and capital investment augment clean energy integration through the application of renewable energy.

1. Introduction

The transition from conventional energy consumption to renewable energy at the aggregate level has been considered a strategic decision in the process of greenhouse gas (GHG, hereafter) emission [1]. The output from investment in research and development, i.e., the effects on macro economy positively guided by RE integration in economic activities [2]; in addition, the literature suggests that RE assists in thriving the aggregate output with minimal environmental cost [3]. The growing damage of environmental degradation, with a heavy application of non-renewable energy, intensifies the concern of future consequences for climate change, especially for achieving sustainable development [4]. Thus, protecting the environment and eliminating the impact of climate change the normal course of humanity. Countries have constantly invested in energy diversification by moving to RE application instead of orthodox energy [5]. The recent literature has produced a plethora of empirical studies pertinent to renewable energy and, considering the motivation of respective studies, and we sub-grouped studies into two directions. First, the role of renewable energy integration in the economy, and the benefits for an economy, have been promoting green energy integration, such as economic growth acceleration, environmental protection cost reduction, financial development, agro-productivity, induced foreign investors. The second line of empirical findings explore the key determents for renewable energy integration and studies reveal several factors, including technological innovation, public debt, government expenditure, environmental policies, and financial integration.
However, the effects of policy uncertainties on energy transformation, namely, clean energy integration, have yet to be empirically investigated. The effects of economic policy uncertainty (EPU, hereafter) have been extensively investigated, focusing on diverse key macro and micro features of the economy, such as economic growth [6], financial development [7], foreign direct investment, trade openness [8], and oil price shocks [9,10]. However, the impact of EPU on environmental and climate change aspects has been yet to be investigated in empirical literature extensively. The demand and use of renewable energy (RE, hereafter) consumption in the aggregate domestic production process is unnecessary, but an imperative issue due to environmental consequences, cost of production, and, most importantly, future economic sustainability [11]. Intense use of RE, primarily guided by the threat of global warming associated with greenhouse gas emission, articulately supplants carbon dioxide injection to the economy [12].
The motivation of this study is to gauge the nexus between economic policy uncertainty and renewable energy consumption in BRIC countries for the period from 1997q1 to 2018q4 with the moderating effects of foreign direct investment and financial development. The study applied several econometrical tools, such as stationary properties, that were evaluated by implementing Ng and Perron [13] and Zivot and Andrews [14] one structural break unit root tests, along with the conventional test of stationary, namely, the ADF test [15], P-P test [16], GS-ADF test [17], and KPSS test [18]. The long-run cointegration between economic policy uncertainty, foreign direct investment, financial development, and renewable energy consumption was documented by employing the Bayer and Hanck [19] combined cointegration test. The autoregressive distributed lagged (ARDL) test was implemented for detecting the magnitudes of EPU, FDI and FD on REC both in the long-run and short-run by following Pesaran, et al. [20], moreover, the asymmetric effects of EPU, FDI, and FD on renewable energy consumption evaluated through non-linear framework offered by Shin, et al. [21]. Finally the directional association in empirical assessment, study considered non-granger causality test which was familiarized by Toda and Phillips [22].
The present study contributes to the existing literature in the following manners: First, the nexus between economic policy uncertainty and energy consumption has been extensively investigated in literature [12,23,24,25]. Existing literature suggests that uncertainties have two dimensions, i.e., geo-political risk and economic policy uncertainty (EPU), which critically induces energy consumption and investment in energy diversifications. More precisely, geo-political risk deals with international energy supply, energy prices, and territorial issues, while EPU deals with fundamental macro behavior, including monetary and fiscal policies, energy policies, international trade, and so on. However, the role of EPU on renewable energy is yet to be unleashed in an extensive name even though, in recent periods, researchers have invested time and efforts in detecting the positive association between EPU and renewable energy consumption in the economy.
Second, the role of financial development in energy development has been extensively investigated, see for instance Salim, et al. [26], Wang and Jiayu [27] Polat [28], and documented both positive and negative associations between them. However, the relationship between financial development and renewable energy consumption has yet to be extensively investigated, especially considering BRIC nations. Nonetheless, in the recent period, a few researchers, for instance, Anton and Afloarei Nucu [29], Burakov and Freidin [30], have tried to explore the nexus between FD and REC by taking a panel dataset to see. The contribution of the study is the contest of selecting an appropriate measurement of financial development, implying that, as a measurement of financial development, several proxies have been revealed in empirical studies, and, most importantly, the large number of researchers rely on a single indicator, namely, domestic credit to private section (DCP) [31]. However, very few studies considered the financial development index constructed by taking more than one proxy variable by implementing principal component analysis (PCA). Therefore, this study has extended the financial development proxy index with four proxy measures that are extensively considered by researchers in several occasions. The construction of the FDI index with more proxies will result in capturing the linkage and magnitudes in an efficient manner, and this, moreover, assists in understanding the true relationship with renewable energy output growth.
Third, according to existing literature, the role of foreign direct investment has been extensively appreciated for technological advancement and promotion of energy efficiency in the economy. Inflows of FDI bring foreign ownership in industrial development with higher energy demand. Therefore, the use of conventional sources of energy, namely, fossil fuels, has been intensified. Over the past decade, the adverse environmental consequences and environmental protection costs have been inducing the economy toward clean energy integration that applies renewable energy for industrial output. In the recent period, a significant amount of research has examined the impact of renewable energy impact on FDI [28,32], but the role of FDI in accelerating renewable energy growth is yet to be examined extensively. This study has extended the existing belief that is FDI brings energy efficiency with technological progress, implying that the role of FDI in augmenting renewable energy consumption in BRIC nations.
Study findings document long-run associations between economic policy uncertainty, foreign direct investment, financial development, and renewable energy consumption in BRIC nations, according to Bayer and Hanck [19] combined cointegration test. Empirical model estimation with ARDL [20] reveals an adverse statistically significant association between EPU and renewable energy consumption and positive statistically significant effects running from FDI and financial development to renewable energy consumption, especially in the long run. According to asymmetry assessment of EPU, FDI, and FD on REC following Shin, Yu and Greenwood-Nimmo [21], the study disclosed asymmetric effects running from explanatory variables to renewable energy consumption both in the long-run and short-run. The rest of the article, apart from the introduction in Section 1, is as follows. Section 2 deals with the literature survey and conceptual framework of the study. The data, variables definition, and econometrical methodology are explained in Section 3. Empirical model estimation and interpretation report in Section 4. Finally, the discussion and conclusion display in Section 5.

2. Literature Review

2.1. Effects of Economic Policy Uncertainty

Energy transition has emerged as the prime concern for global leaders for the adverse consequences of fossil fuel use in the economic output. Climate change and environmental deprivation are the ultimate results of the heavy reliance on conventional energy. Thus, energy transition from conventional to RE is imperative due to the reduction in GHS. Energy diversification, i.e., investment in renewable energy sources, can assist in achieving environmental sustainability through limiting GHG emissions [33]. Investment in energy diversification immensely influences country specific actors, including government tax subsidies and global phenomena [2]. However, moving from non-renewable energy to sustainable sources means substantial investments in RD and aware government policies and, most importantly, encourage foreign investment [3]. Investment in energy diversification through RD is the only long-term response to the global energy crisis, and the reduction in non-renewable energy by replacing renewable energy sources may be crucial to overall economic development as it supports the exploration of renewable energy resources [34].
The nexus between economic policy uncertainty and energy consumption has been extensively investigated in literature [12,23,24,25]. Existing literature suggests that uncertainties have two dimensions, i.e., geo-political risk and economic policy uncertainty (EPU), which critically induces the energy consumption and investment in energy diversifications. More precisely, geo-political risk deals with international energy supply, energy prices, and territorial issues, while EPU deals with fundamental macro behavior, including monetary and fiscal policies, energy policies, international trade, and so on. However, the role of EPU on renewable energy is yet to be unleashed in an extensive name even though, in recent periods, researchers have invested time and efforts in detecting the positive association between EPU and renewable energy consumption in the economy.
In a study, Liu, et al. [35] explores the impact of economic policy uncertainty on firms investing in the energy sector by taking a panel of 168 energy investment decisions which comprised of 52 firms from fossil energy investment and 112 firms representing renewable energy investment in China for the period 2007q1–2012q4. Empirical estimation using panel regression documented that EPU diminishes traditional energy enterprise investment; however, renewable energy enterprise investment is not affected. Furthermore, the study established that EPU has a greater effect on discouraging coal and petroleum companies from investing, whereas it significantly supports renewable energy investments.
Sohail, et al. [36] investigated the monetary policy impact on renewable and non-renewable energy consumption in the US economy. The study documents that volatility in monetary policy adversely affects the consumption of RE. Furthermore, the asymmetric association between RE consumption and monetary policy was established. The higher degree of EPU incurred finance frictions, causing the cost of energy financing in the economy [37]. Investment in the RE sector is adversely influenced by policy uncertainties and tax subsidy, feed-in-tariffs, and policy assistance [38].
Policy makers in emerging economies persistently seek advantageous strategical policies to attract inflows of FDI in the economy. In emerging and developing economies, inflows of FDI are considered as an alternative source of external financing and domestic capital accumulation [39]. EPU produces disadvantageous circumstances in the economy, which is characterized by lower investment [40], lower aggregate production [41], and decreased stock level [42]. The impact of EPU on domestic macro fundaments has been extensively investigated in recent time; however, the effects on cross-broader capital flow fluctuation due to EPU has yet to be explored extensively. Gulen and Ion [40] advocated that with the higher degree of EPU, the benefits of waiting for EPU decrease is less costly to divest investment and move to other countries. For foreign investment, whether short-term or long-term currency risk and regulation pose specific difficulties, long-currency exposure is a problem.
Consequently, the costs of waiting through a time of rising EPU might be deemed appropriate for investors already interested in a country; instead, countries that, already having increased FDI, lower their levels may see an outflow of it. The existing literature suggests host economy macro determinants, including economic growth [43], trade openness [44], the exchange rate [45], institutional quality [46], and financial development [47], are critically important for inflows FDI in the economy. The factors mentioned above have an adverse association with EPU [6,48,49]. Therefore, it is assumable that the availability of the possible nexus between EPU and inflows of FDI. Using a cointegration approach for heterogeneous panels, Albulescu and Ionescu [50] uncovered long-run cointegration between foreign direct investment, monetary uncertainty, and bank stability. The FMOLS and DOLS estimators revealed that macroeconomic circumstances influence FDI inflows. The study suggested that the inflow of FDIs in EU nations is adversely affected by the money market uncertainty, but financial efficiency and sustainable business environment have been inducing foreign investors for channelizing funds for long-run investment.
Policy uncertainty and FDI inflows attract policymakers and researchers due to the pivotal role of inflows of FDI in domestic augmentation, especially in emerging and developing countries. Arbatli [39] investigated economic policies and political stability as key factors for FDI decision in emerging economies. The study established tax incentives for foreign investors, reducing trade barriers and stability in exchange rate play a critical role in the mind of foreign investors with a positive note. At the same time, political instability and domestic conflict play an inhibitor role in growing FDI inflows in the economy. Chen and Funke [51] reveal that domestic political uncertainties discourage foreign investors from mobilizing economic resources in those economies that have been undoing the unstable state of the political situation. A firm’s investment primarily relies on value creation proposition availability in the host economy [52]. Further evidence is available in the study of Choi, et al. [53]. They postulated that a higher degree of policy uncertainty in the host country robustly reduces FDI inflows.
Julio and Yook [54] showed that policy uncertainty had a detrimental effect on FDI flows from US parent companies to their affiliates in 43 countries. This is particularly true around the time of elections in both the destination and source nations. The findings indicate that economic actors delay private investment overseas until some degree of uncertainty around election outcomes is addressed. The magnitudes of the reductions in FDI flows are considerably greater than the impacts of policy uncertainty on domestic investment, indicating that foreign capital flows are more susceptible to policy uncertainty [55]. A similar line of results was found in the study of Chen, et al. [56]. Study findings established that policy uncertainty induced by national elections has a substantial negative impact on FDI, dropping during election years, and then rebounding. In terms of institutional function, it was demonstrated and indicated that FDI is more impacted in nations with a lesser degree of democracy and a president chosen by the assembly.
In another study, White III, et al. [57] advocated that FDI attraction will decline in relatively uncertain legal environments in the context of Southeast Asia. However, beyond a certain point, increases in legal system uncertainty (where legal system uncertainty is very high) will result in greater FDI attraction. The study also exposed that government intervention in economic activities will positively moderate the relationship between legal system uncertainty and FDI attraction. These curvilinear (and interactive) effects have greater explanatory power than a linear (main effects) model. Asamoah, et al. [58] reveal that the quality institutions positively associate with FDI flow by reducing the negative effect of economic uncertainty on FDI. However, the host economy possesses weak institutional farm work, implying that FDI flow to the continent will be hampered when economic uncertainty increases [59]. Thus, countries with a lower degree of institutional quality need to work on economic stability and maintaining efficient institutions [60].
Nguyen, et al. [61] examined the relationship between economic policy uncertainty, firm-level FDI, and firm hedging behavior—by taking on a newspaper-based uncertainty index. The study documented long-run cointegration between EPU and FDI in terms of EPU elasticity on FDI, which was revealed negative statistically significant, indicating that economic unrest demotivated foreign investors for capital participation in the economy. Thus, firms boost their FDI in nations with a low EPU compared to their own country. In addition, firms increase their reliance on derivatives in reaction to a rise in EPU. Another study conducted by Gauvin, et al. [62] established that depending on whether changes in policy uncertainty come from the United States or the European Union, portfolio equity flows would exhibit a radically different response (EU). Additionally, increasing EU policy uncertainty results in portfolio stock inflows in low-sovereign-default-risk nations regardless of the global risk level.

2.2. Foreign Direct Investment and Renewable Energy Consumption

According to the neoclassical model, increased FDI inflows would raise the expenditure rate and per capita income, while holding technical innovation and labor growth [63]. The modern development theories, on the other hand, also advocate technical transition and FDI inflow. The explanation for treating technological transition and FDI inflows as endogenous is that these two elements have long-run effects on the host country’s economy through “spill over” effects. In theory, technical spillover and innovation will stimulate global development by providing the “know-how” those emerging economies might not have had otherwise. According to the industrial flight theory, global buyers are more likely to spend cheap labor and manufacturing costs. Environmental requirements are now being compromised to achieve low manufacturing costs, destroying host country infrastructure and the atmosphere [64]. The new trade theory postulates that domestic firms exposed to foreign compaction face difficulties in managing energy efficiency, suggesting the foreign competition in any industry increase the degree of energy efficiency and induces domestic firms to uphold energy efficiency level, as well as the higher level of environmental standard [65,66,67]. FDI inflows have been augmented the degree of energy efficiency through the use of clean energy from renewable energy success, replication of energy-saving practices that are bringing from the home country to the host economy. This results in production cost reduction, along with competitive advantages.
Investment in FDI is important for economic growth in developed countries. Additionally, FDI is a source of renewable energy, technology transfer, and energy conservation, apart from its work as a driver of overall production. Furthermore, FDI is a flow historically correlated with the transition of information, technologies, and management processes and structures from the home countries of multinational corporations (MNEs) to their host countries. It is argued in the literature that the better practices and superior knowledge can assist in enjoying competitive privilege, in terms of higher productivity and environmental spillover effects [68]. Renewable energy (RE) has seen a significant rise in foreign direct investment (FDI) during the past several years, contributing to the spread of RE throughout the world. In a study Wall, et al. [69] investigated the role of policy tools in attracting FDI into renewable energy sectors, such as solar, wind, and biomass with a panel of 137 OECD and non-OECD nations. Study findings documented that feed-in tariffs exposed the most effective policy tool for attracting FDI to the renewable energy industry. Moreover, fiscal measures (FM), including tax incentives, have a substantial and beneficial effect on the renewable energy projects of foreign investors, especially in solar energy. Carbon pricing mechanisms, such as carbon taxes and emissions trading, have been shown to attract foreign direct investment (FDI) in OECD and non-OECD nations. Conversely, foreign private investors were less interested in public investments, possibly because public finances are less reliable in the long term. FDI is a source of funding for companies for energy-saving innovation.
No convincing data exist on the effect of aggregate FDI on energy usage. Regarding the nexus between FDI and RE consumption, in existing literature, there is a non-consensus and there is yet to be established evidence explored by researchers. The first line of thought explains the positive association, namely, inflows of FDI increase the integration of RE in aggregate output level determination, see, for instance, [3,63,70,71]. The augmentation of renewable energy consumption intensifies with the technological diffusion in the economy [72]. FDI primarily comes from places where industry tends to meet stringent environmental requirements [73]. These companies are largely engaged in using renewable and productive energy in their manufacturing, or are affected by such consumption [74]. MNCs will, thus, drive energy efficiency improvements in the host economy, as the domestic industry can copy energy-saving output from their home countries which foreign investments pass. In this sense, FDI would boost local environmental efficiency and increase local environmental norms by transferring cleaner technologies and best management practices, leading to decreased non-renewable energy consumption [75]. An increase in foreign direct investment is related to higher renewable energy integration [76]. Moreover, energy efficiency with the green capital spillover effects inflows FDI for promoting clean energy in the country’s aggregate energy consumption [65]. However, the adverse association between FDI and renewable energy consumption is documented in the literature [27,32].

2.3. Financial Development and Renewable Energy Consumption

Renewable energy has the potential to be a useful instrument in the pursuit of energy diversification through reduced reliance on fossil fuel supplies. Furthermore, the generation of green energy has the potential to avoid future environmental damage. Nonetheless, making the shift from fossil-fuel-based energy to renewable energy generation may be difficult because of a higher amount of cost associated with implementing renewable energy, which is one of the most significant obstacles that have to be overcome. When compared to fossil-fuel-based energy investments, there are several financial hurdles to overcome, which include greater infrastructure, start-up, and operational expenses, among other things. As a result, it is critical to have a stable financial system that can efficiently handle price discovery and financing, market liquidity, and risk management in this environment. Capital allocation is facilitated by well functioned financial markets in developing nations. Moreover, a financially developed system promotes investment in progressive sectors, whereas a financially undeveloped system reduces investment in declining ones [77]. Therefore, in an environment where renewable energy investments are highly encouraged, the role of financial development can be substantial.
In a study, Burakov and Freidin [30] investigated the impact of financial development and economic growth on renewable energy consumption in Russia. For the period 1990–2014 by employing the VECM approach. The results of the granger causality test detected unidirectional causality running from financial development to renewable energy consumption in Russia. Further evidence was observed in the study Eren, et al. [78] for India. Study findings exposed that financial expansion and economic progress accelerated the propensity towards shifting renewable energy consumption. Furthermore, directional causality assessment is a unidirectional causality running from financial development to renewable energy consumption.
Anton and Afloarei Nucu [29] investigated the impact of financial development on renewable energy consumption using panel data of 28 countries from the EU over the period 1990–2015 by employing fixed effects OLS estimation. The study documented the positive association between financial development and renewable energy consumption. It refers to financial development proxies’ respective elasticities on renewable energy consumption, all the proxies except stock market development have exposed statistically insignificant linkage with renewable energy consumption in EU nations. Mukhtarov, et al. [79] gauged the effects of financial sector development on renewable energy consumption in Azerbaijan from 1993 to 2015 by implementing autoregressive distributed lagged (ARDL) tests. The study findings reveal positive statistically significant effects running from financial sector development and economic growth to renewable energy consumption in the long-run.
Financial development has been recognized as a major factor affecting energy consumption (Raza, et al. [80,81]). A country decides to expand its financial institution operations, including banking, foreign direct investment, and the stock market [82]. Financial development occurs when financial institutions provide high-yield loans at low financing costs to their clients, improves transparency between lenders and borrowers, and lowers financial risk [79]. Financial development promotes financial activity, raises energy consumption, and the relationship between the two impacts of energy and finance policy [83]. Numerous studies show that financial growth affects the amount of energy consumption; nevertheless, the magnitude of the effect varies, and two distinct schools of thought exist about it [84]. According to Sadorsky [85], financial growth may impact energy consumption through three channels: direct effect, business effect, and the wealth effect. The direct impact refers to consumers who, as a result of effective financial intermediation, may readily access resources and purchase durable goods, resulting in a rise in energy consumption. The business impact is driven by a growing trend in financial development, which provides businesses with more access to financial resources. Financial development allows businesses to access less expensive financial resources to expand their operations or start new ventures, thus increasing energy consumption. The wealth impact is a result of businesses and people placing their confidence in the developed stock market.

2.4. Motivation and Proposed Hypothesis of the Study

As an alternative energy source, several researchers have invested their time and efforts to explore the key determinants of renewable energy integration and development in the economy in the empirical literature. Moreover, the impact of renewable energy development has also been investigated especially focusing on environmental sustainability. The prime focus of the study is to gauge the effects of economic policy uncertainty, FDI and financial development on renewable energy consumption in BRIC nations. For testing the possible causality in empirical assessment, the following hypothesis is to be tested accordingly (see, Figure 1).

3. Data and Methodology of the Study

3.1. Empirical Model

This study focused on evaluating the nexus between renewable energy consumption, economic policy uncertainty, foreign direct investment, and financial development in BRIC (Brazil, Russia, India, and China) for the period spanning between 1997q1 and 2018q4. This study is intended to explore the fresh evidence regarding the role of EPU in shaping the renewable energy demand through the channel of augmenting foreign direct investments in the economy. All the pertinent data were extracted from world development indicators published by the World Bank [86] except the economic policy uncertainty index extracted from the Economic Policy Uncertainty Index [87]. The descriptive statistics of research variables are reported in Table 1. The relationship between RE, EPU, FDI, and FD can be displayed in the following ways:
R E C E P U ,   F D I ,   F D   1
In order to smooth operation implementation, we transform variables into the natural log and the following linear regression model formulated for further assessment:
R E C t = α t + β t E P U t + γ t F D I t + δ t F D t + φ t   2
Although REC stands for renewable energy consumption, EPU for economic policy uncertainty, FDI denotes foreign direct investment and FD for financial development. The coefficient of α t explain the intercept in the equation and β t ,   γ t and δ t specify the magnitudes of explanatory variables in the equation.
As a dependent variable, Renewable energy is measured by the percentage of total final energy consumption (% of total energy consumption) following existing literature sees Qamruzzaman and Jianguo [3]; Adedoyin, Bekun, and Alola [2].
Economic policy uncertainty: The study considered newspaper–based economic policy uncertainty index as a widely proxy for EPU in literature, see Jia, et al. [88], Xu, et al. [89], Yu, et al. [90], and Appiah–Otoo [91]. It is an unpredictable economic environment created by choices made by the government in the areas of regulatory, monetary, and fascial policy management. These decisions affect the economic repercussions and the environment in which economic interactions occur. Economic actors, especially businesses, modify their economic decisions as a result of increased policy uncertainty.
FDI_inflows: The motivation for the inclusion of FDI_inflows in the empirical estimation to see its share on renewable energy consumption. Depending upon the sign of coefficients that is positive and negative, the association can be explained. If the coefficient of β > 0, indicating the positive tie with the RE consumption. This may indicate that increased FDI inflows contribute to improving the share of renewable energy by promoting sustainable energy development and use. If so, our findings are better described in the principle of technology diffusion. On the other hand, if the coefficient of β < 0, that is a negative association. The finding suggests that PHH is the prevailing argument since it maintains that FDI inflows are allocated to polluted sectors in low-environmental countries [92]. To account for skewness in the variable distribution, we take the logarithm of FDI inflows (ln_FDI_inflows).
Financial_development: The study relied on financial development indexed by taking into account four widely used proxies, such as broad money to GDP, DCF, DCF, and DCB rather than a single proxy. The motivation for financial development index construction is to capture aggregated effects on renewable energy growth. Study employer principal component analysis for developing financial development index. The variables definition and data sources display in Table 2.

3.2. Economical Methodology

Examining the nexus between EPU, FDI, FD, and REC, the study has executed several econometrical tools. For establishing variables stationary properties, the study applies several stationary tests, such as ADF: Dickey and Fuller [15]; P-P: Phillips and Perron [16]; DF–GLS: and KPSS: Kwiatkowski, Phillips, Schmidt, and Shin [18]. The study implements advanced unit-roots following Ng and Perron [13] and Zivot and Andrews [14] with stricture break in series. The long-run cointegration between economic policy uncertainty, FDI, financial development, and renewable energy consumption is evaluated by implementing a combined cointegration test following Bayer and Hanck [19]. The elasticities of non-linear effects, i.e., positive and negative shocks of EPU on renewable energy consumption evaluate by applying a non-linear autoregressive distributed lagged test familiarize by Shin, Yu, and Greenwood-Nimmo [21]. Finally, directional causal relationship investigates with symmetric and asymmetric effects EPU on renewable energy consumption by following non-granger causality framework introduce by Toda and Yamamoto [93].

3.2.1. Bayer and Hanck Cointegration Test

Recently, detecting the long-run association among variables, research has been extensively applying the newly introduce cointegration test commonly known as combine cointegration, familiarized by Bayer and Hanck [19] over conventional cointegration tests, such as Engle and Granger [94], Johansen [95], and Banerjee, et al. [96]. Bayer and Hanck [19] offered a cointegration test with a combination existing test of cointegration test with joint test statistics. The advantage of the combined cointegration test is consistency and reliability in estimating the tested coefficient, implying that aggregation of several cointegration tests eliminates the inherent limitation in conventional testing procedures that are short and limited. Following Bayer and Hanck [19], the combination of the computed significance level (p-value) of the individual cointegration test in this article is in Fisher’s formula as follows:
EG − JOH = −2 [ln(PEG) + (PJOH)]
EG − JOH − BO − BDM = −2 [ln (PEG) + (PJOH) + (PBO) + (PBDM)]
The possible p-values of several individual cointegration tests to be extracted from Engle and Granger [94], Johansen [97], Peter Boswijk [98], and Banerjee, Dolado, and Mestre [96] PEG, PJOH, PBO, and PBDM, respectively. To get evidence regarding the long-run association, the calculated F-stat has to grater that the critical value proposed by Bayer and Hanck [19] that is the rejection of null hypothesis “no cointegration”.

3.2.2. Autoregressive Distributed Lagged (ARDL)

Investigation of long-run association in an empirical study with the test of cointegration offered by Johansen [95], Johansen-Juselius [99] has certain limitations, thus producing spurious output. Overcoming the implied shortcoming, the OLS-based cointegration test has introduced by Pesaran, et al. [20]. Pesaran, Shin, and Smith [20] advocated that the OLS-based cointegration test can perform a model estimation with variables in different order of integration. Additionally, the short-run adjustment speed towards long-run equilibrium also originates using the linear transformation [100]. A simplified ARDL model, following Xu, Qamruzzaman, and Adow [89], for research variables can be expressed as:
Δ R E t = 1 + γ 1 R E t 1 + γ 2 E P U t 1 + γ 3 F D I t 1 + + γ 4 F D t 1 + θ 1 i = 1 n Δ R E + θ 2 i = 1 n Δ F D I + θ 3 i = 1 n Δ F D + ε 1 t
where γ 1 ,   γ 2 ,   γ 3 represents the long-run magnitudes running from EPU, FDI, and FD to REC, and the short-run elasticity can be detected from the coefficients of θ 1 , θ 2 , θ 3 , and the error correction terms denoted by ε 1 t .
The nexus between EPU, FDI, FD, and REC can be represented for empirical assessment following the framework proposed by Pesaran, Shin, and Smith [20]. The following equation is to be performed to discover the coefficient of independent variables on REC both in the long-run and short-run.
Δ R E t = α 0 + β i R E t 1 + β 2 E P U t 1 + β 3 F D I t 1 + β 4 F D t 1 + + j = 1 J λ 0 Δ R E t j 0 + j = 1 K λ 1 Δ E P U t j + j = 0 L λ 2 Δ F D I t j + j = 0 P λ 3 Δ F D t j + + ε t
where α is the constant term in the equation, the elasticities in the long-run displayed by β 1   β 4 ,   λ 0 λ 3 explained the short-run magnitudes in the equation, ε t for the error correction term, and the optimal lag for the empirical study determined by following lag length criteria following the Akaike information criterion (AIC), which is represented by J, K, L, and P, respectively.
For long-run cointegration, Equation (6) has to be performed with ordinary least square and performed with a standard wild test for detecting the long-run cointegration between EPU, FDI, FD, and REC with the null hypothesis of no-cointegration and alternative hypothesis of cointegration. The study performed three tests for exploring test statistics, such as F-test, following Pesaran, Shin, and Smith [20], joint probability test, and the tBDM-test following Banerjee, Dolado, and Mestre [96]. The long run has to be confirmed, only if the test statistics are higher than the critical value at a 1% level of significance, extracted from critical value offered by Pesaran, Shin, and Smith [20].

3.2.3. Non-Linear Autoregressive Distributed Lagged (NARDL)

The study considered a non-linear framework is communally known as NARDL, which was initiated by Shin, Yu, and Greenwood-Nimmo [21] for detecting the asymmetric effects of EPU, FDI, and FD on renewable energy consumption, and the study generalizes the following asymmetric long-run regression.
F I t = ( β + E P U 1 , t + + β E P U 1 , t ) + ( γ + F D I 1 , t + + γ F D I 1 , t ) + ( µ + F D 1 , t + + µ F D 1 , t ) + ε t
where β + ,   β , γ + ,   γ   and   δ i associated with long-run pavements. The coefficient of β +   and   β specifies the effect of positive and negative shocks in EPU and γ +   and   γ denotes the asymmetric effects of FDI on RE. Furthermore, the coefficients of δ i measures the effects of control variables in the equation.
In the empirical literature, NARDL has been extensively applied for exploring both long-run and short-run asymmetric coefficients in their respective studies see for example [101,102,103,104]. The positive and negative shocks of EPU, FDI, and FD are to be derived by executing the following Equations (8)–(10),
P O S E P U 1 , t = k = 1 t l n E P U k + = K = 1 T M A X Δ l n E P U k , 0 N E G E P U t = k = 1 t l n E P U k = K = 1 T M I N Δ l n E P U k , 0
P O S F D I 1 , t = k = 1 t l n F D I k + = K = 1 T M A X Δ l n F D I k , 0 N E G F D I t = k = 1 t l n F D I k = K = 1 T M I N Δ l n F D I k , 0
P O S F D 1 , t = k = 1 t l n F D k + = K = 1 T M A X Δ l n F D k , 0 N E G F D t = k = 1 t l n F D k = K = 1 T M I N Δ l n F D k , 0
Shin, Yu, and Greenwood-Nimmo [21] show that the linear model (9) can transform into non-linear ARDL by incorporating EPU decomposition in the following Equation (11).
Δ R E C t = U t 1 + ( β + E P U 1 , t 1 + + β E P U 1 , t 1 ) + ( γ + F D I 1 , t 1 + + γ F D I 1 , t 1 ) + ( δ + F D 1 , t 1 + + δ F D 1 , t 1 ) + j = 1 m 1 λ j Δ R E C t j 0 + j = 1 n 1 ( π + Δ E P U 1 , t 1 + + π Δ E P U 1 , t 1 ) + + j = 0 m 1 ( β + Δ F D I 1 , t 1 + + β Δ F D I 1 , t 1 ) + j = 0 m 1 ( µ + Δ F D 1 , t 1 + + µ Δ F D 1 , t 1 ) + ε t
Equation (11) can transform in the following manner,
Δ REC t = e t 1 + j = 1 m 1 λ j Δ R E C t j 0 + j = 1 n 1 ( π + Δ E P U 1 , t 1 + + π Δ E P U 1 , t 1 ) + + j = 0 m 1 ( β + Δ F D I 1 , t 1 + + β Δ F D I 1 , t 1 ) + j = 0 m 1 ( µ + Δ F D 1 , t 1 + + µ Δ F D 1 , t 1 ) + ε t
where e t 1 = REC t 1 ( δ + E P U 1 , t 1 + δ E P U 1 , t 1 ) θ i n f t 1 ϑ Y t 1 τ f d t 1 is the nonlinear error correction term with δ + = π + ; δ = π ; γ + = β + ; γ = β :   ρ + = µ + ; ρ = µ are the long-run parameters. = j 1 m φ j 1 , λ j = i = j + 1 m φ i for j = 1…, m. δ + = j = 0 p δ j + ;   δ = j = 0 q δ j . The short-run adjustments of positive and negative shocks in EPU can detect by π + ;   π . To gauge the asymmetric relationship between EPU and financial innovation, the following NARDL Equation (13) applies:
Δ FI t = α + FI t 1 + β + E P U 1 , t 1 + + β E P U 1 , t 1 + β i n f t 1 + β Y t 1 + β f d t 1 + j = 1 m 1 λ j Δ F I t j 0 + j = 0 m 2 ( π + E P U 1 , t 1 + ) + j = 0 m 3 π E U P 1 , t 1 + + j = 0 m 6 λ 4 Δ f d t j + j = 0 m 7 λ 5 Δ y t j + ε t
For asymmetric cointegration, the Equation (13) to be performed with ordinary least square and performed standard wild test for detecting the long-run cointegration between EPU, FDI, FD, and REC with the null hypothesis of no–cointegration and alternative hypothesis of cointegration. The study performed three tests for exploring test statistics, such as F-test following Pesaran, Shin, and Smith [20], joint probability test and the tBDM-test following Banerjee, Dolado, and Mestre [96]. the long run to be confirmed only if the test statistics are higher than the critical value at a 1% level of significance, extracted from critical value offered by Pesaran, Shin, and Smith [20].

3.2.4. Toda Yamamoto Causality Test

For directional causality between EPU, FDI, FD and renewable energy consumption to be gauged by implementing the causality framework offered by Toda and Yamamoto [93], commonly known as the non-granger causality test. The proposed test was performed under a VAR environment at a level with maximum lag consideration. The following causal equations are to be performed to establish the directional association, where every variable is considered a dependent variable in the respective equation.
R E C t = α 0 + i = 1 Y β 1 i R C E t i + j = Y + 1 d m a x β 2 j R E C t j + i = 1 Y γ 1 i E P U t i + j = Y + 1 d m a x γ 1 j E P U t j + i = 1 Y φ 1 i F D I t i + j = Y + 1 d m a x φ 1 j F D I t j + i = 1 Y δ 1 i F D v o l t i + j = Y + 1 d m a x δ 2 j F D v o l t j + + ε 1 t   14
E P U t = α 0 + i = 1 Y β 1 i E P U t i + j = Y + 1 d m a x β 2 j E P U t j + i = 1 Y γ 1 i R E C t i + j = Y + 1 d m a x γ 1 j R E C t j + i = 1 Y φ 1 i F D I t i + j = Y + 1 d m a x φ 1 j F D I t j + i = 1 k δ 1 i F D v o l t i + j = Y + 1 d m a x δ 2 j F D v o l t j + ε 1 t
F D I t = α 0 + i = 1 Y β 1 i F D I t i + j = Y + 1 d m a x β 2 j F D I t j + i = 1 Y γ 1 i R E C t i + j = Y + 1 d m a x γ 1 j R E C t j + i = 1 Y φ 1 i F D I t i + j = Y + 1 d m a x φ 1 j F D I t j + i = 1 Y δ 1 i F D v o l t i + j = Y + 1 d m a x δ 2 j F D v o l t j + ε 1 t
F D t = α 0 + i = 1 Y β 1 i F D t i + j = Y + 1 d m a x β 2 j F D t j + i = 1 Y γ 1 i R E C t i + j = Y + 1 d m a x γ 1 j R E C t j + i = 1 Y φ 1 i E P U t i + j = Y + 1 d m a x φ 1 j E P U t j + i = 1 Y δ 1 i F D I v o l t i + j = Y + 1 d m a x δ 2 j F D I v o l t j + ε 1 t

4. Model Estimation and Interpretation

An econometric model based on secondary time series data demands initial validation for appropriate model selection [105]. It is because of variables integration order immensely essential further advanced model estimation. The study performs the test of stationary following DF-GLS test [106] and Ng test (Ng and Perron) [13] along with conventional unit root tests, such as ADF [15], P-P [16], and KPSS test [18]. The results of unit root tests display in Table 3 and Table 4. Refers to unit test results display in Table 3, it is apparent that variables are integrated in mixed order, indicating that variables are stationary either at a level or after the first difference.
The result of Ng and Perron [13] unit root test display in Table 1 with four sets of output such as MZa, MZt, MSB, and MPT. According to test statistics, study documents variables are integrated in mixed order that is either at a level or after the first difference.
The unit root test with a structural break following Zivot and Andrews [14] has been initiated, and results display in Table 5. Study findings documents that the t-statistics are statistically significant at a 1% significance level, indicating stationary variables after the first difference with one structural break. Specifically, for the series of REC (2001q2 in Brazil, 2009q3 in Russia, 2002q4 in India, and 2009q4 in China), for economic policy uncertainty (2014q4 in Brazil, 2010q3 in Russia, 2003q2 in India, and 1997q4 in China), for foreign direct investment (2000q4 in Brazil, 2011q1 in Russia, 2018q1 in India, and 2001q4 in China) and financial development (2002q4 in Brazil, 1998q2 in Russia, 2002q3 in India, and 2011q2 in China).
Determination of appropriate optimal lag is critically important, especially for efficient empirical model estimation. The study implements lag length selection criteria under VAR estimation. The results of lag length criteria estimation display in Table 6. According to AIC, the VAR estimation establishes the optimal lag for further estimation is 2 for all sample countries.
For ascertaining the long-run association between EPU, RE, FDI, and FD by implementing the Bayer and Hanck [19] combined cointegration. The cointegration test results are displayed in Table 7. The F- of cointegrated equations are higher than the critical values at a 1% significance level. These findings suggest the rejection of the null hypothesis of “no-cointegration” and establish the long-run association between RE, EPU, FDI, and FD. The study documents several cointegrated equations, most importantly the cointegration equation with renewable energy consumption as a dependent variable in all countries’ concerns.
The results of nexus between EPU and RE consumption in BRIC nations display in Table 8, including long-run cointegration in Panel A, long-run coefficients in Panel B, the short-run coefficient in Panel C, and residual diagnostic test in Panel D, respectively.
Panel A in Table 8 reports the result of long-run cointegration, and the study performed standard Wald test for Fpass following Pesaran, Shin, and Smith [20], Wpass for joint probability test and tBDM test following Banerjee, Dolado, and Mestre [96]. The test statistics of all three estimations exposed statistically significant at a 1% significance level, implying the rejection of the null hypothesis. The study establishes long-run cointegration between RE, EPU, and foreign direct investment in BRIC nations. Once the long-run association ascertains, we move to investigate the magnitudes of EPU and FDI on RE consumption in BRIC nations during studied period.
Long-run coefficients display in Panel B of Table 8. For the impact of EPU on RE consumption, the study establishes negative, statistically adverse impacts running from EPU to RE consumption in Brazil (a coefficient of −0.168), in Russia (a coefficient of −0.170), in India (a coefficient of −0.131) and China (a coefficient of −0.181), which is aligned with the existing literature, see Sohail, Xiuyuan, Usman, Majeed, and Ullah [36]. The study findings suggest that achieving stability in EPU, countries can assist in thriving the present pattern of RE consumption in the economy. More precisely, a 10% stability, if achievable by BRIC nations, in EPU can have positive growth in RE consumption in the economic activities over the present state by 1.68% in Brazil, by 1.7% in Russia, by 1.13% in India, and by 1.81% in China. Among BRIC nations, the Chinese economy exhibits more inclination in absorbing the benefits in RE consumption. Refers to FDI impacts on REC, the study documents positive statistically significant connection in Russia (a coefficient of 0.198) and in India (a coefficient of 0.065), which is supported by exiting literature, such as Qamruzzaman and Jianguo [3], Rezagholizadeh, Aghaei, and Dehghan [70], Khandker, Amin, and Khan [63]. Renewable energy consumption, especially in developing becomes costly due to a higher degree of capital investment; therefore, the recipients of FDI create an opportunity for the economy with energy investment. FDI investment in renewable energy intensifies the energy output in the economy and assists in the energy transition from fossil to renewable energy [107]. In a study, Doytch and Narayan [65] document the halo effects of FDI on energy consumption in the economy, implying that FDI enhances the environmental economy by transforming into a green energy-based economy with capital assistance in renewable energy production. In addition, the study reveals adverse associations in Brazil (a coefficient of −0.173) and China’s coefficient (a coefficient of −0.055). It is in line with existing studies by Lee [108], Pao and Tsai [109].
The impact of financial development on REC, study documents positive association in Brazil (a coefficient of 0.134), in Russia (a coefficient of 0.049), and in India (a coefficient of 0.071) and in China (a coefficient of 0.049), indicating the financial expansion enhances the green energy consumption through investing in the energy sector, especially for the production of renewable energy. Study findings are in line with Eren, Taspinar, and Gokmenoglu [78], Naqvi, et al. [110], Mukhtarov, Humbatova, Hajiyev, and Aliyev [79]. More specifically, a 10% growth in financial development can result in Brazil’s renewable energy consumption by 1.34%, in Russia by 0.49%, in India by 0.71%, and in China by 0.49%, respectively. A strong and established financial system encourages more financing for the renewable energy sector at reduced prices, resulting in increased investment, which increases energy demand. In the long term, well–functioned capital markets provide valuable assistance for companies seeking to reduce liquidity risk and obtain the money necessary to develop energy-efficient technology [111]. Additionally, financial development may enable the transfer of money away from inefficient conventional energy sources and renewable energy development [112].
For the short-run (see, panel–C, Table 8. The coefficients of error correction terms are negative and statistically significant at a 1% level of significance, suggesting the long-run disequilibrium due to prior period shocks in explanatory variables can be adjusted with the speed of 37.1% in Brazil, by 55.1% in Russia, by 25.2% in India and by 4.36% in China, respectively. Refers to EPU impacts on REC, the study discloses negative and statistically significant linkage, but in terms of elasticity of EPU, the magnitudes are minimal compared to long-run estimation. The inflows of FDI expose positive and statistically significant with REC in Brazil and Russia, while adverse association in India and China. Financial development establishes a positive linkage with REC in BRIC countries.
Finally, the empirical model passes with several residual diagnostic tests. The study confirms that the empirical models are free from serial correlation, residuals are normally distributed, and no problem with heteroskadacity. Moreover, the RESET test ascertains efficient estimation for output.
Next, the asymmetric effects of economic policy uncertainty, foreign direct investment, and financial development were evaluated by implementing the asymmetric ARDL equation (see Equation (10)). The results of asymmetric estimation display in symmetric shocks in financial development unveil a positive statistically significant linkage with REC. A 10% development in the financial sector results in increasing REC in Brazil by 0.034%, in Russia by 0.022%, in India by 0.75%, and in China by 0.01%. Meanwhile, a 10% degradation in financial development can decrease the propensity of REC by 0.071% in Brazil, by 0.015% in Russia, by 0.002% in India, and by 0.073% in China. Study findings suggest that even though the magnitude of asymmetric shocks in FD on REC is minimal, the association indicates.
Panel C of Table 9 reports the standard Wald test for both long-run and short-run symmetry. It is apparent from the test statistics that all the test statistics, i.e., WLR and WSR, are statistically significant at a 1% level of significance. These findings suggest the asymmetric effects of EPU, FID, and FD on REC both in the long-run and short-run. Furthermore, residual diagnostic tests confirm the empirical model’s internal consistency and efficiency to reach the optimum empirical outcome with no issues in the spurious outcome with four panels of output, which includes long-run asymmetric cointegration in Panel A, long-run asymmetric coefficients in Panel B, short-run asymmetric coefficients in Panel C and residual diagnostic tests in Panel D, respectively.
The study implements Fpass following Pesaran, Shin, and Smith [20], the joint probability test Wpass and tBDM following, for detecting asymmetric long-run cointegration between renewable energy consumption, economic policy uncertainty, foreign direct investment, and financial development in BRIC nations. It is apparent from the test statistics that there is the rejection of null hypothesis for “no cointegration” since all the test statistics are statistically significant at a 1% level, irrespective of sample countries selection. These findings are suggesting asymmetric effects can be observed from EPU, FDI, and FD on REC in BRIC nations. Once the asymmetric cointegration is established, the study moves to evaluate the asymmetric shocks that are positive and negative shocks of explanatory variables on REC.
The long-run asymmetric coefficients are displayed in Panel B. The study documents negative statistically significant linkage between EPU and REC, indicating economic uncertainties create discomfort for renewable energy consumption in the eco. Alternatively, economic uncertainty reduction plays a positive role in energy transformation from fossil to renewable energy. More specifically, a 10% positive variation in EPU can result in REC reduction by 1.68% in Brazil, by 2.11% in Russia, by 1.21 in India, and by 0.021% in China, respectively. Although a 10% reduction in EPU can augment REC in Brazil by 2.01%, in Russia by 0.60%, in India by 1.09%, and in China by 1.14%, respectively. Study findings suggest that energy transformation from fossil to renewable energy, economic stability is critically important due to steady economic progress and effective economic and fiscal policy implementation allows green energy investment, thus eventually intensifying the state of renewable energy demand. Considering the asymmetric effects of foreign direct investment and renewable energy consumption, the study discloses a positive statistically significant tie. More specifically, a 10% positive shock in FDI can result in increasing the REC in Brazil by 6.70%, in Russia by 1.34%, in India by 2.49%, and in China by 2.76%, whereas a 10% negative shock in FDI can play a detrimental role and decrease the present state of REC in Brazil by 3.28%, in Russia by 0.52%, in India by 2.61%, and in China by 3.41%, respectively. Study findings suggest that positive shocks in FDIs can positively influence renewable energy consumption, indicating that the availability of advanced technological assistance in the economy increases the production of green energy. This refers to asymmetric effects of financial development on REC; the study documents the asymmetric shock that is positive and negative variations in FD positively interconnected with REC in BRIC nations. More precisely, a 10% enhancement in the process of financial development results in increasing the consumption REC in Brazil by 3.59%, in Russia by 0.23%, in India by 0.57%, and in China by 1.82%.
On the other hand, a similar rate of adverse shocks in FD (FD) can produce a disadvantageous situation in accelerating the REC in Brazil by 5.10%, in Russia by 4.41%, in India by 1.55%, and in China by 8.08%. It is evident from asymmetric magnitudes that negative shocks in financial development are more significant than improvements in financial development. The study suggests that expansionary policies for financial sector growth can increase green energy investment, but constricting financial policies are more critical for renewable energy output because of limited investment in the energy sector, particularly the renewable energy sector.
For the short-run, the coefficient of error correction terms (ζ) is negative statistically significant at a 1% level of significance, implying the speed of long-run disequilibrium correction due to short-run shocks in explanatory variables. This refers to the asymmetric shocks of EPU on REC, the study documents a negative statistically significant association that is economic stability can boost the renewable energy demand and expand the use of green energy sources. However, concerning asymmetric elasticity on REC are minimal in comparison with long-run coefficients. For inflows of FDI and REC, the study reveals statistically insignificant impacts running from asymmetric shocks except for positive shocks in Brazil exposed to negative statistically significant linkage (a coefficient of −0.022). The asymmetric shocks in financial development unveil a positive statistically significant linkage with REC. A 10% development in the financial sector results in increasing REC in Brazil by 0.034%, in Russia by 0.022%, in India by 0.75%, and in China by 0.01%. Meanwhile, a 10% degradation in financial development can decrease the propensity of REC by 0.071% in Brazil, by 0.015% in Russia, by 0.002% in India, and by 0.073% in China. Study findings suggest that even though the magnitude of asymmetric shocks in FD on REC is minimal, the association indicates.
Panel C of Table 9 reports the standard Wald test for both long-run and short-run symmetry. It is apparent from the test statistics that all the test statistics, i.e., WLR and WSR, are statistically significant at a 1% level of significance. These findings suggest the asymmetric effects of EPU, FID, and FD on REC both in the long-run and short-run. Furthermore, residual diagnostic tests confirm the empirical model’s internal consistency and efficiency to reach the optimum empirical outcome with no issues in the spurious outcome.
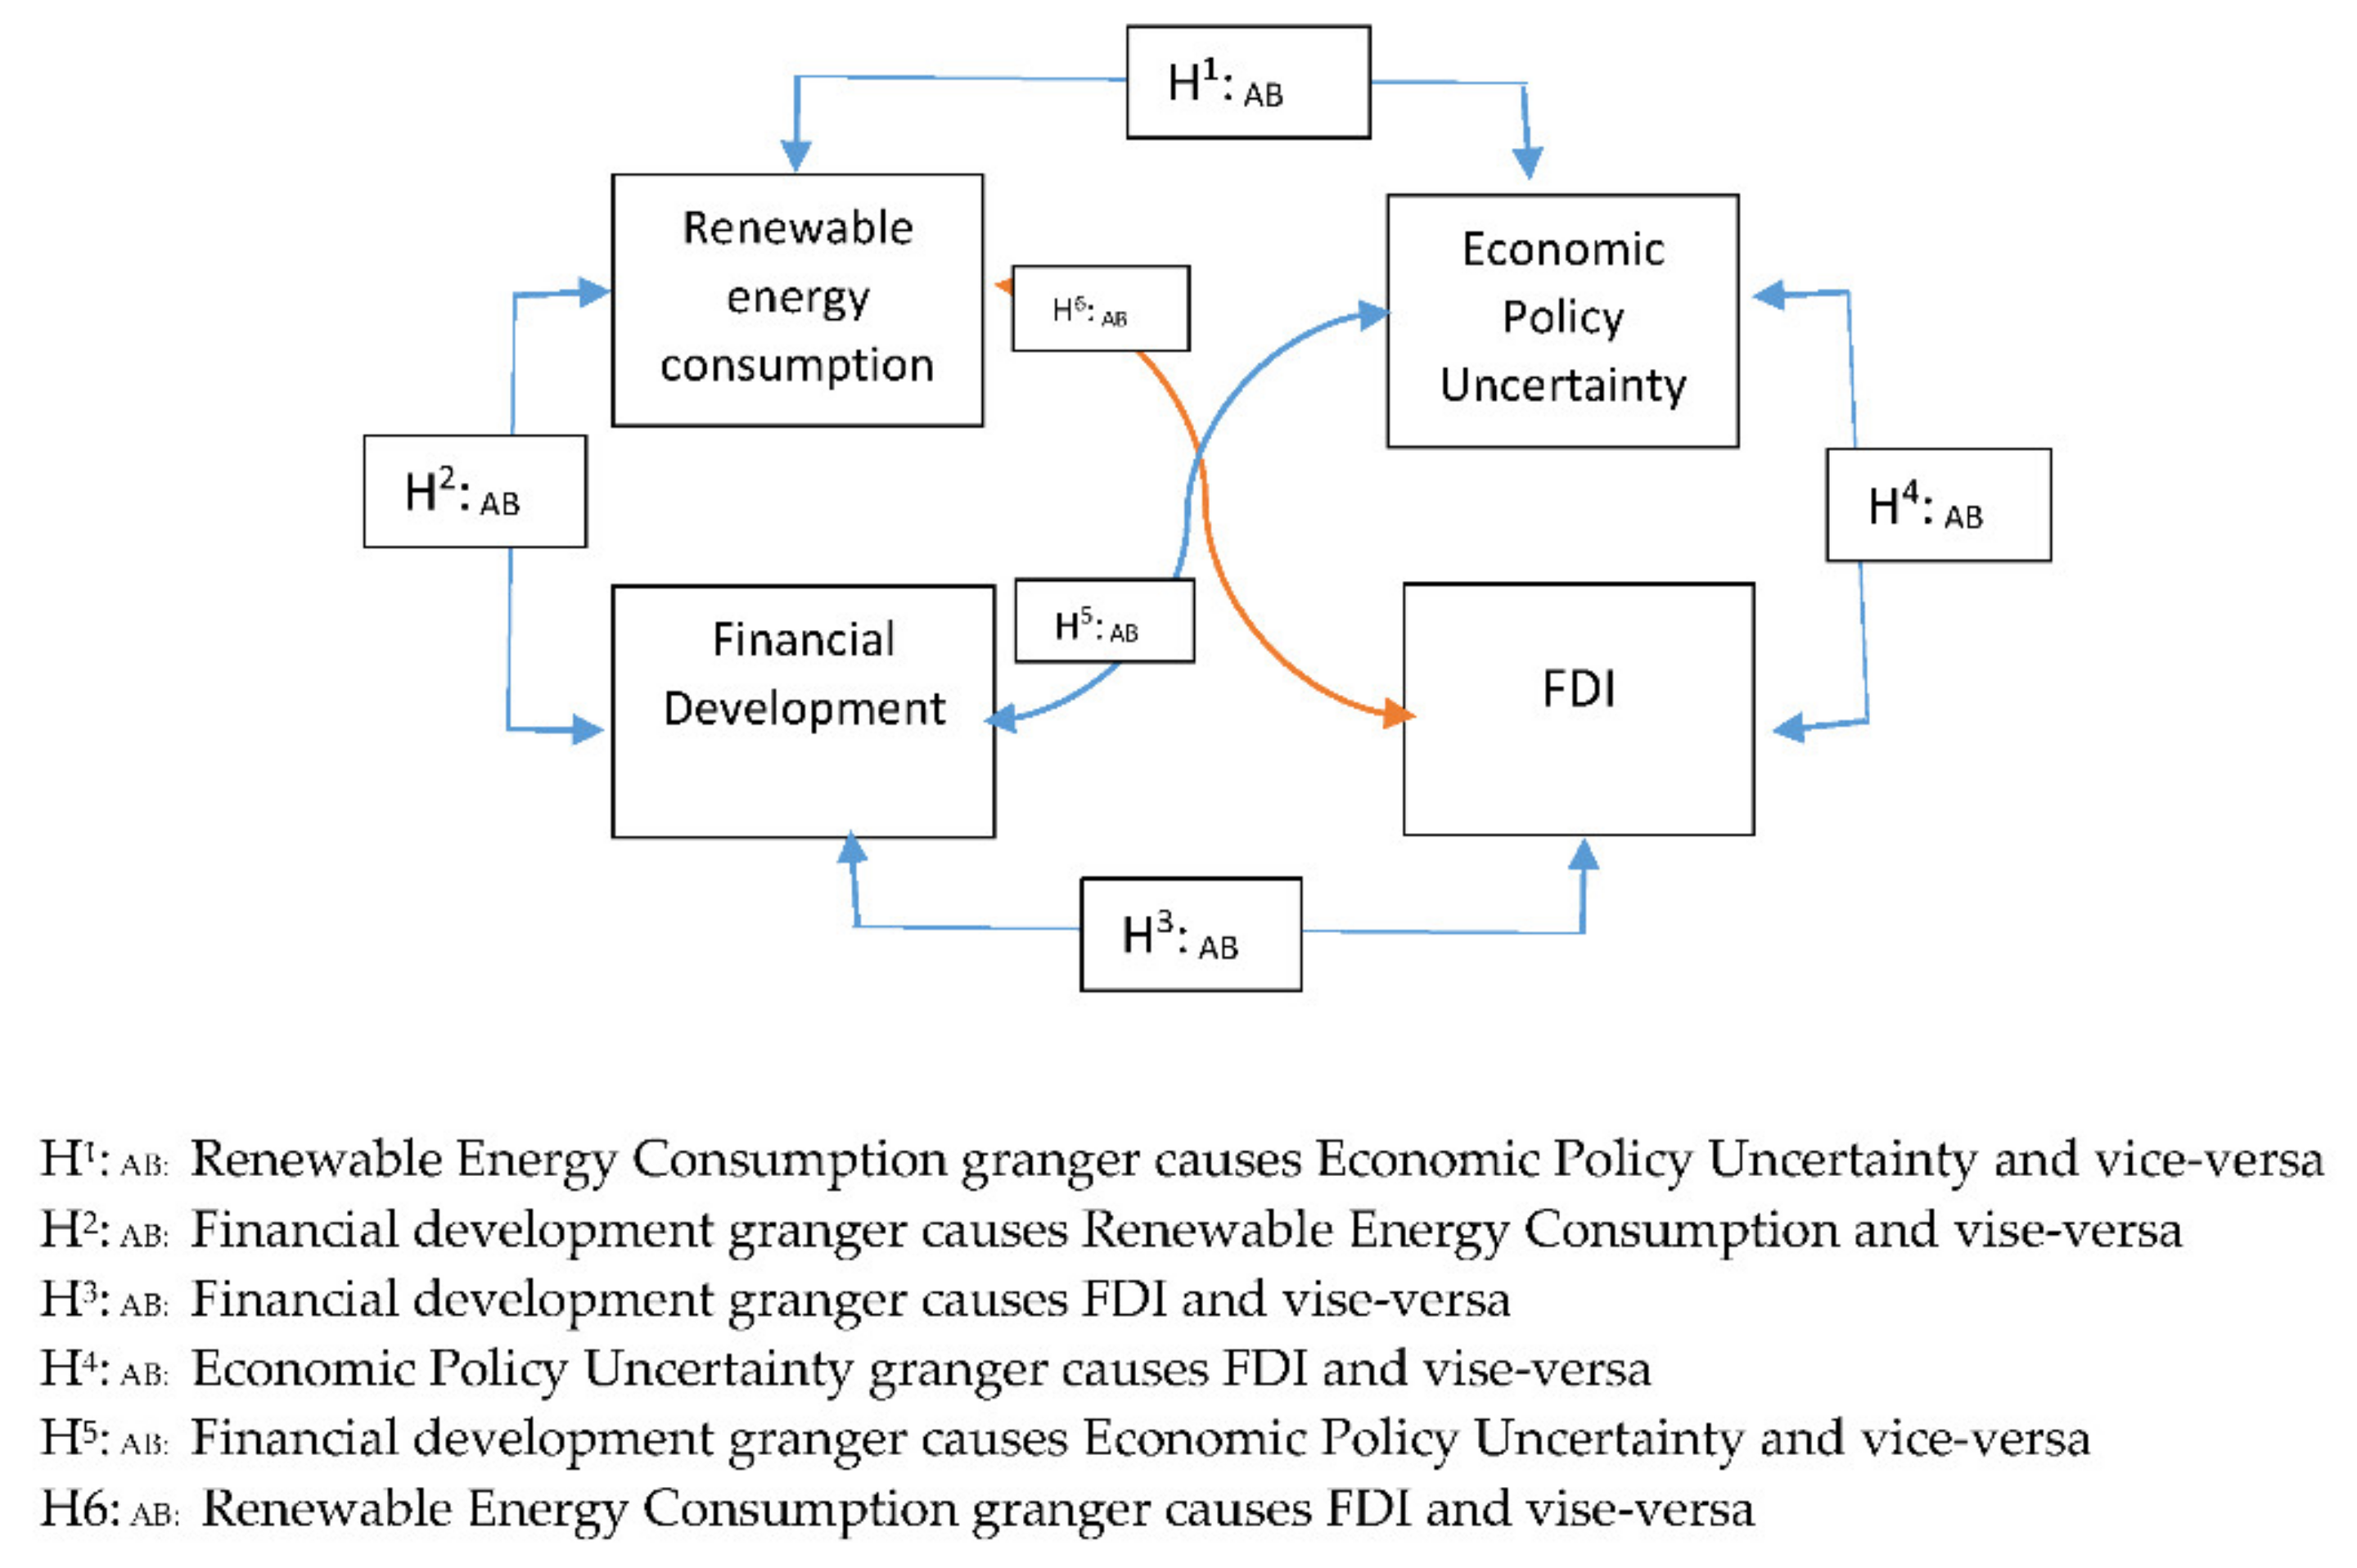
The following section deals with detecting a directional association between REC, FDI, FD, and EPU through implementing a non-granger causality equation by following Toda and Phillips [22]. Causality results are displayed in the Table 10 with four panels such as Panel A for Brazil, Panel B for Russia, Panel C for India, and Panel D for China. This refers to causal effects between EPU and REC, the study documents unidirectional causal effects from economic policy uncertainty to renewable energy consumption (EPU→REC) in BRIC nations. On the other hand, regarding causality between FDI and REC, the study disclosed bidirectional causality (FDI↔REC) in Russia and India and unidirectional causality (FDI→REC) in Brazil and China, which is in line with Eren, Taspinar, and Gokmenoglu [78]. For directional causality effects between financial development and renewable energy consumption, the study unveils bidirectional causality (FD↔REC) in Brazil and unidirectional causality (FD→REC) in Russia, India, China, respectively.
To ascertain the long-run impact of economic policy uncertainty, foreign direct investment, financial development, and renewable energy consumption in BRIC nations. The study further implements fully-modified OLS introduced by Phillips and Hansen [113] and dynamic OLS and canonical cointegrating regression (CCR), familiarized by Stock and Watson [114] and results display at Table 11. Study findings reveal the expected sign for each explanatory variable in explaining the association to renewable energy consumption. More precisely, the elasticity of EPU exposes negative association, and FDI inflows and FD positively assist in improving the application of renewable energy in the economy.

5. Discussion

The role of green energy integration and application is critically important for establishing an environmental quality, and, therefore, reliance on renewable energy and their integration as an alternative to fossil energy has been extensively considered. The growth of renewable energy and its integration has been investigated by considering various macro-fundamentals and exploring their role in developing renewable energy output and its demand. This study focused on assessing the impact of economic policy uncertainty on renewable energy consumption in BRIC nations with the mediating role of inflows of foreign direct investment and financial development. The long-run cointegration tests, such as Bayer and Hanck [19], combined the cointegration test, Fpass, following Pesaran Pesaran, Shin, and Smith [20], joint probability test, and tBDM test, following Banerjee, Dolado, and Mestre [96]. The study findings confirmed the long-run association between EPU, FDI, FD, and REC, indicating the co-movement due to variability in any regression. Furthermore, the ultimate effects in REC will have experienced variations as the results of changes happened in EPU, FDI, and FD in BRIC nations. Now, the study moves on gauging the magnitudes of EPU, FDI, and FD on REC through implementing ARDL bound testing. The asymmetric effects of EPU, FDI, and FD on renewable energy consumption were investigated by implementing nonlinear ARDL following Shin, Yu, and Greenwood-Nimmo [21], and, finally, the directional causalities were evaluated through implementing the non-granger causality test, following Toda and Phillips [22], under VAR environment. The Kay study findings of the study are as follows:
First, EPU impact on renewable energy consumption. Refers to ARDL estimation, it is apparent that adverse statistically significant effects are running from EPU to REC, indicating that economic instability and adverse shocks create tension in implementing green energy policies, which result in decreasing the renewable energy output and the integration process. In a study, Burns [115] documents with sector-level data that EPU discourages investment in renewable energy sectors, such as the wind and solar energy sector. This refers to asymmetric elasticity of economic policy uncertainty on renewable energy consumption. The study reveals that the test statistics of the standard Wald test are statistically significant, both in the long-run and short-run, suggesting that the asymmetric effects running from EPU to REC both in the long-run and short-run. In the long run, according to the asymmetric coefficients that are the positive and negative shocks of EPU was exposed negative statistically significant linkage with REC in BRIC nations. Study findings explained that reducing EPU through innovation and effective policy implementation could open an avenue for renewable energy integration in economic activities and eventually accelerates renewable energy output. Uncertainties, according to Balcilar, et al. [116], impact renewable energy growth can be observed; first, the macroeconomic effect on the economy makes it difficult for RE growth because of the lack of available investment and cheap energy sources. It is because, in the initial period, the renewable energy sector requires substantial capital investment. The second effect of uncertainty is that it makes politicians more hesitant to implement renewable energy legislation because the actions of consumers and producers, who remain cautious, may not make the switch to renewables.
The effects of FDI inflows on REC reveals a positive statistically significant impact, especially in the long run, according to ARDL estimation. It is in line with Lau, et al. [117], Omri and Kahouli [118]. Energy diversification transitioning from fossil energy to renewable energy reliance is one of the critical aspects of foreign investment presence in the economy; moreover, technological progress and energy-efficient production processes act as motivational factors in the energy selection process to encourage renewable energy growth [119]. This refers to asymmetric shocks of FDI on renewable energy consumption, according to NARDL estimation, the asymmetric shocks in FDI are positive statistically linked with REC in BRIC nations, which is aligned with Qamruzzaman and Jianguo [3]. Foreign direct investment and equity investment positively impacted the economy’s aggregated output through industrialization and infrastructure development. It has long been assumed that foreign direct investment (FDI) is linked to transferring knowledge, managerial experience, and technological innovation from home nations to host countries [109]. In addition to scale impacts, foreign direct investment (FDI) may have various effects on the economy, including technique effects and composition effects. The impact of the foreign direct investment may be seen by reducing the size of one sector while increasing the size of another; for example, the FDI-led service industry uses less energy than the FDI-led manufacturing industry [83].
Financial development positively entices the growth of renewable energy consumption in BRIC nations, especially in the long run, which is align existing literature see, for instance, Shahbaz, et al. [120]; Alsaleh and Abdul-Rahim [121], Liu, et al. [122], and Burakov and Freidin [30]. Renewable energy has the potential to be a useful instrument in the pursuit of energy diversification through reduced reliance on fossil fuel supplies. Furthermore, the generation of green energy has the potential to avoid future environmental damage. Nonetheless, making the shift from fossil-fuel-based energy to renewable energy generation may be difficult because of the higher cost associated with implementing renewable energy, which is one of the most significant obstacles that have to be overcome. Compared to fossil-fuel-based energy investments, there are many financial hurdles to overcome, including greater infrastructure, start-up, and operational expenses, among other things. As a result, it is critical to have a stable financial system that can efficiently handle price discovery and financing, market liquidity, and risk management. The financial environment enables families, legal organizations, and people to readily get cash (and credit) from financial institutions, thus expanding their consumption and production capacity. These conditions and scenarios contribute to an increase in energy usage. The beneficial effect of financial growth on energy demand is critical for implementing suitable energy policies that include alternative energy sources. If financial development results in a reduction in fossil fuel energy consumption, it may be inferred that these phenomena, as well as an increase in the use of efficient and environmentally friendly energy sources (RES), is accomplished via financial development. Energy-finance nexus theorists propose that financial growth leads to increased energy use in the economy in three distinct ways. First, direct effects, such as increased purchasing power and additional financing from banks result in increased demand for energy consumption [3]. Second, indirect effects, such as increased purchasing power and the availability of additional financing from banks result in increased demand for energy consumption. Second, the commercial impacts of free access to financial possibilities reduce borrowing costs and enable companies to expand their existing company operations and operations. As a result, the growth of the business process produces an increase in the need for electricity. Third, wealth effects are concerned with the development of the stock market and the confidence in economic growth, which have a positive spillover impact on actual economic activity and a rise in energy consumption [30]. Increased energy efficiency in the economy may be encouraged by the impacts of efficient and developed financial sectors, which can be achieved by developing better financial instruments to increase and use renewable energy. Furthermore, Tamazian, et al. [123] advocate that financial development fosters efficiency in financial services and institutional effectiveness, which stimulates technical innovation and the use of new technology in services, resulting in a decrease in electricity consumption.

6. Conclusions

Green technology and a clean environment have been the critical discussant facts on numerous occasions and encourage nations to transform the reliance on fossil fuel to renewable energy in the aggregate production process. The motivation of this study is to gauge the nexus between economic policy uncertainty and renewable energy consumption in BRIC countries for the period from 1997q1 to 2018q4 with the moderating effects of foreign direct investment and financial development. The study applied several econometrical tools, such as stationary properties, evaluated by implementing Ng and Perron [13] and Zivot and Andrews [14], one structural break unit root test along with the conventional test of stationary, namely, the ADF test [15], P-P test [16], GS-ADF test [17], and KPSS test [18]. The long-run cointegration between economic policy uncertainty, foreign direct investment, financial development, and renewable energy consumption was documented by employing the Bayer and Hanck [19] combined cointegration test. Autoregressive distributed lagged (ARDL) test was implemented for detecting the magnitudes of EPU, FDI, and FD on REC both in the long-run and short-run by following Pesaran, Shin, and Smith [20], moreover, the asymmetric effects of EPU, FDI, and FD on renewable energy consumption evaluated through non-linear framework offered by Shin, Yu, and Greenwood-Nimmo [21]. Finally the directional association in empirical assessment, study considered non-granger causality test which was familiarized by Toda and Phillips [22]. The key findings are as follows:
First, the stationary test documented that all the variables are stationary after the first difference and neither exposed stationary after 2nd difference. The test statistics of the combined cointegration test established a long-run association between EPU, FDI, FD, and REC in BRIC nations. Second, empirical model estimation with ARDL reveals negative statistically significant effects running from EPU to REC in all nations, whereas financial development and FDI play an augmenting role in thriving REC, especially in the long run. Third, the asymmetric assessment of EPU, FDI, and FD on REC has documented asymmetric effects running from independent variables to REC both in the long- and short-run. Fourth, the results of directional causality disclosed unidirectional causality running from EPU, FDI, and FD to renewable energy consumption. The study suggested that the progress towards a green economy with clean energy integration requires economic stability. Furthermore, the continual inflows of FDI and financial development can accelerate the present state of renewable energy integration in the aggregate production process in BRIC nations.
However, this empirical study is not out of limitation because the study only considered four variables; therefore, additional variables, such as trade openness, inflation, domestic capital formation, and government expenditure can have great scope for information diversification and might reveal different outcomes. Thus, it is suggested that future studies focusing on the nexus between EPU and REC might consider the variables mentioned above and examine their relationship.

Author Contributions

All authors contributed equally to all aspects of the research reported in this paper. All authors have read and agreed to the published version of the manuscript.

Funding

This article was supported by The National Social Science Fund of China “Research on the Optimization Path and Welfare Effect of China’s Import Structure Upgrading under the Background of High-Quality Development” (19CJL046); and Special Funds for Basic Scientific Research in Central Universities “Research on welfare effect and optimization path of energy digital economy construction” (800015A367).

Institutional Review Board Statement

Not applicable.

Informed Consent Statement

Not applicable.

Data Availability Statement

All the data are publically avabilable at world development indicators and Economic policy Uncertainty Indexed.

Acknowledgments

We would like to express our heartfelt gratitude and thankfulness to three esteemed reviewers for their constructive suggestions and appreciation. During the revision process, their suggestion immensely assists in enhancing the quality of the manuscript. Moreover, we expressed our deep gratitude to the editor-in-chief and assistant editor for their kindness and support.

Conflicts of Interest

The authors declare no conflict of interest.

References

  1. Mohsin, M.; Kamran, H.W.; Nawaz, M.A.; Hussain, M.S.; Dahri, A.S. Assessing the impact of transition from nonrenewable to renewable energy consumption on economic growth-environmental nexus from developing Asian economies. J. Environ. Manag. 2021, 284, 111999. [Google Scholar] [CrossRef]
  2. Adedoyin, F.F.; Bekun, F.V.; Alola, A.A. Growth impact of transition from non-renewable to renewable energy in the EU: The role of research and development expenditure. Renew. Energy 2020, 159, 1139–1145. [Google Scholar] [CrossRef]
  3. Qamruzzaman, M.; Jianguo, W. The asymmetric relationship between financial development, trade openness, foreign capital flows, and renewable energy consumption: Fresh evidence from panel NARDL investigation. Renew. Energy 2020, 159, 827–842. [Google Scholar] [CrossRef]
  4. Wang, J.; Dong, K. What drives environmental degradation? Evidence from 14 Sub-Saharan African countries. Sci. Total Environ. 2019, 656, 165–173. [Google Scholar] [CrossRef] [PubMed]
  5. Celık, S. The more contagion effect on emerging markets: The evidence of DCC-GARCH model. Econ. Model. 2012, 29, 1946–1959. [Google Scholar] [CrossRef]
  6. Bhagat, S.; Ghosh, P.; Rangan, S.P. Economic Policy Uncertainty and Economic Growth in India; Indian Institute of Management Bangalore: Bengaluru, India, 2013. [Google Scholar]
  7. Nyawo, S.T.; Van Wyk, R.B. The impact of policy uncertainty on macro-economy of developed and developing countries. J. Econ. Behav. Stud. 2018, 10, 33–41. [Google Scholar] [CrossRef]
  8. Dhannur, V.; John, A.R. A BVAR Approach to the Impact of Policy Uncertainty on International Trade and Investment. Indian Econ. J. 2018, 66, 312–325. [Google Scholar] [CrossRef]
  9. Antonakakis, N.; Chatziantoniou, I.; Filis, G. Dynamic spillovers of oil price shocks and economic policy uncertainty. Energy Econ. 2014, 44, 433–447. [Google Scholar] [CrossRef] [Green Version]
  10. Chen, X.; Sun, X.; Li, J. How does economic policy uncertainty react to oil price shocks? A multi-scale perspective. Appl. Econ. Lett. 2019, 27, 188–193. [Google Scholar] [CrossRef]
  11. Contreras, G.; Platania, F. Economic and policy uncertainty in climate change mitigation: The London Smart City case scenario. Technol. Forecast. Soc. Chang. 2019, 142, 384–393. [Google Scholar] [CrossRef]
  12. Adams, S.; Adedoyin, F.; Olaniran, E.; Bekun, F.V. Energy consumption, economic policy uncertainty and carbon emissions; causality evidence from resource rich economies. Econ. Anal. Policy 2020, 68, 179–190. [Google Scholar] [CrossRef]
  13. Ng, S.; Perron, P. LAG Length Selection and the Construction of Unit Root Tests with Good Size and Power. Economy 2001, 69, 1519–1554. [Google Scholar] [CrossRef] [Green Version]
  14. Zivot, E.; Andrews, D.W.K. Further Evidence on the Great Crash, the Oil-Price Shock, and the Unit-Root Hypothesis. J. Bus. Econ. Stat. 2002, 20, 25–44. [Google Scholar] [CrossRef]
  15. Dickey, D.A.; Fuller, W.A. Distribution of the Estimators for Autoregressive Time Series with a Unit Root. J. Am. Stat. Assoc. 1979, 74, 427–431. [Google Scholar] [CrossRef]
  16. Phillips, P.C.; Perron, P. Testing for a unit root in time series regression. Biometrika 1988, 75, 335–346. [Google Scholar] [CrossRef]
  17. Said, S.E.; Dickey, D.A. Testing for Unit Roots in Autoregressive-Moving Average Models of Unknown Order. Biometrika 1984, 71, 599–607. [Google Scholar] [CrossRef]
  18. Kwiatkowski, D.; Phillips, P.C.; Schmidt, P.; Shin, Y. Testing the null hypothesis of stationarity against the alternative of a unit root: How sure are we that economic time series have a unit root? J. Econ. 1992, 54, 159–178. [Google Scholar] [CrossRef]
  19. Bayer, C.; Hanck, C. Combining non-cointegration tests. J. Time Ser. Anal. 2013, 34, 83–95. [Google Scholar] [CrossRef]
  20. Pesaran, M.H.; Shin, Y.; Smithc, R.J. Bounds testing approaches to the analysis of level relationships. J. Appl. Econ. 2001, 16, 289–326. [Google Scholar] [CrossRef]
  21. Shin, Y.; Yu, B.; Greenwood-Nimmo, M. Modelling Asymmetric Cointegration and Dynamic Multipliers in a Nonlinear ARDL Framework. In Festschrift in Honor of Peter Schmidt; Springer Science and Business Media: Berlin/Heidelberg, Germany, 2014; pp. 281–314. [Google Scholar]
  22. Toda, H.Y.; Phillips, P.C.B. Vector Autoregressions and Causality. Econometrika 1993, 61, 1367. [Google Scholar] [CrossRef]
  23. Adedoyin, F.F.; Zakari, A. Energy consumption, economic expansion, and CO2 emission in the UK: The role of economic policy uncertainty. Sci. Total Environ. 2020, 738, 140014. [Google Scholar] [CrossRef]
  24. Pirgaip, B.; Dinçergök, B. Economic policy uncertainty, energy consumption and carbon emissions in G7 countries: Evidence from a panel Granger causality analysis. Environ. Sci. Pollut. Res. 2020, 27, 30050–30066. [Google Scholar] [CrossRef]
  25. Adedoyin, F.F.; Nathaniel, S.; Adeleye, N. An investigation into the anthropogenic nexus among consumption of energy, tourism, and economic growth: Do economic policy uncertainties matter? Environ. Sci. Pollut. Res. 2021, 28, 2835–2847. [Google Scholar] [CrossRef]
  26. Salim, R.; Yao, Y.; Chen, G.; Zhang, L. Can foreign direct investment harness energy consumption in China? A time series investigation. Energy Econ. 2017, 66, 43–53. [Google Scholar] [CrossRef]
  27. Wang, C.; Jiayu, C. Analyzing on the Impact Mechanism of Foreign Direct Investment (FDI) to Energy Consumption. Energy Procedia 2019, 159, 515–520. [Google Scholar] [CrossRef]
  28. Polat, B. The Influence of FDI on Energy Consumption in Developing and Developed Countries: A Dynamic Panel Data Approach. J. Yasar Univ. 2018, 13, 49. [Google Scholar]
  29. Anton, S.G.; Nucu, A.E.A. The effect of financial development on renewable energy consumption. A panel data approach. Renew. Energy 2020, 147, 330–338. [Google Scholar] [CrossRef]
  30. Burakov, D.; Freidin, M. Financial development, economic growth and renewable energy consumption in Russia: A vector error correction approach. Int. J. Energy Econ. Policy 2017, 7, 39–47. [Google Scholar]
  31. Qamruzzaman, M. Nexus between environmental quality, institutional quality and trade openness through the channel of FDI: An application of common correlated effects estimation (CCEE), NARDL, and asymmetry causality. Environ. Sci. Pollut. Res. 2021, 1–24. [Google Scholar] [CrossRef]
  32. Marton, C.; Hagert, M. The Effects of FDI on Renewable Energy Consumption. Ph.D. Thesis, LUND University, Lund, Sweden, 2017. [Google Scholar]
  33. Acheampong, A.O.; Adams, S.; Boateng, E. Do globalization and renewable energy contribute to carbon emissions mitigation in Sub-Saharan Africa? Sci. Total Environ. 2019, 677, 436–446. [Google Scholar] [CrossRef]
  34. Shahbaz, M.; Loganathan, N.; Zeshan, M.; Zaman, K. Does renewable energy consumption add in economic growth? An application of auto-regressive distributed lag model in Pakistan. Renew. Sustain. Energy Rev. 2015, 44, 576–585. [Google Scholar] [CrossRef]
  35. Liu, R.; He, L.; Liang, X.; Yang, X.; Xia, Y. Is there any difference in the impact of economic policy uncertainty on the investment of traditional and renewable energy enterprises?—A comparative study based on regulatory effects. J. Clean. Prod. 2020, 255, 120102. [Google Scholar] [CrossRef]
  36. Sohail, M.T.; Xiuyuan, Y.; Usman, A.; Majeed, M.T.; Ullah, S. Renewable energy and non-renewable energy consumption: Assessing the asymmetric role of monetary policy uncertainty in energy consumption. Environ. Sci. Pollut. Res. 2021, 28, 31575–31584. [Google Scholar] [CrossRef] [PubMed]
  37. Pástor, Ľ.; Veronesi, P. Political uncertainty and risk premia. J. Financ. Econ. 2013, 110, 520–545. [Google Scholar] [CrossRef] [Green Version]
  38. Reuter, W.H.; Szolgayová, J.; Fuss, S.; Obersteiner, M. Renewable energy investment: Policy and market impacts. Appl. Energy 2012, 97, 249–254. [Google Scholar] [CrossRef]
  39. Arbatli, E. Economic Policies and FDI Inflows to Emerging Market Economies. IMF Work. Pap. 2011, 11, 1–25. [Google Scholar] [CrossRef] [Green Version]
  40. Gulen, H.; Ion, M. Policy Uncertainty and Corporate Investment. Rev. Financ. Stud. 2015, 29, 523–564. [Google Scholar] [CrossRef]
  41. Karnizova, L.; Li, J.C. Economic policy uncertainty, financial markets and probability of US recessions. Econ. Lett. 2014, 125, 261–265. [Google Scholar] [CrossRef] [Green Version]
  42. Pástor, L.; Veronesi, P. Uncertainty about Government Policy and Stock Prices. J. Financ. 2012, 67, 1219–1264. [Google Scholar] [CrossRef]
  43. Türkcan, B.; Duman, A.; Yetkiner, I.H. How does FDI and economic growth affect each other? The OECD case. In Proceedings of the International Conference on Emerging Economic Issues Iin a Globalizing World, Izmir, Turkey, 4–5 March 2008; pp. 21–40. [Google Scholar]
  44. Nasir, A. Market size, exchange rate and trade as a determinant of FDI the case of Malaysia. Am. J. Bus. Soc. 2016, 1, 227–232. [Google Scholar]
  45. Russ, K.N. The endogeneity of the exchange rate as a determinant of FDI: A model of entry and multinational firms. J. Int. Econ. 2007, 71, 344–372. [Google Scholar] [CrossRef]
  46. Masron, T.A.; Abdullah, H. Institutional quality as a determinant for FDI inflows: Evidence from ASEAN. World J. Manag. 2010, 2, 115–128. [Google Scholar]
  47. Vijayakumar, N.; Sridharan, P.; Rao, K.C.S. Determinants of FDI in BRICS Countries: A panel analysis. Int. J. Bus. Sci. Appl. Manag. 2010, 5, 1–13. [Google Scholar]
  48. Hellwig, T. Economic openness, policy uncertainty, and the dynamics of government support. Elect. Stud. 2007, 26, 772–786. [Google Scholar] [CrossRef]
  49. Abid, A. Economic policy uncertainty and exchange rates in emerging markets: Short and long runs evidence. Financ. Res. Lett. 2020, 37, 101378. [Google Scholar] [CrossRef]
  50. Albulescu, C.; Ionescu, A.M. The long-run impact of monetary policy uncertainty and banking stability on inward FDI in EU countries. Res. Int. Bus. Financ. 2018, 45, 72–81. [Google Scholar] [CrossRef]
  51. Chen, Y.-F.; Funke, M. Option Value, Policy Uncertainty, and the Foreign Direct Investment Decision. Policy Uncertainty, and the Foreign Direct Investment Decision 2003. Available online: http://repec.org/mmfc03/Chen.pdf (accessed on 26 July 2021).
  52. Kinda, T. Investment Climate and FDI in Developing Countries: Firm-Level Evidence. World Dev. 2010, 38, 498–513. [Google Scholar] [CrossRef]
  53. Choi, S.; Furceri, D.; Yoon, C. Policy Uncertainty and FDI Flows: The Role of Institutional Quality and Financial Development. In Working Papers; Yonsei Economics Research Institute: Seoul, Korea, 2019. [Google Scholar]
  54. Julio, B.; Yook, Y. Policy uncertainty, irreversibility, and cross-border flows of capital. J. Int. Econ. 2016, 103, 13–26. [Google Scholar] [CrossRef] [Green Version]
  55. Stoddard, O.; Noy, I. Fire-sale FDI? The Impact of Financial Crises on Foreign Direct Investment. Rev. Dev. Econ. 2015, 19, 387–399. [Google Scholar] [CrossRef] [Green Version]
  56. Chen, K.; Nie, H.; Ge, Z. Policy uncertainty and FDI: Evidence from national elections. J. Int. Trade Econ. Dev. 2018, 28, 419–428. [Google Scholar] [CrossRef]
  57. Iii, G.O.W.; Chizema, A.; Canabal, A.; Perry, M.J. Legal system uncertainty and FDI attraction in Southeast Asia. Int. J. Emerg. Mark. 2015, 10, 572–597. [Google Scholar] [CrossRef]
  58. Asamoah, M.E.; Adjasi, C.K.; Alhassan, A.L. Macroeconomic uncertainty, foreign direct investment and institutional quality: Evidence from Sub-Saharan Africa. Econ. Syst. 2016, 40, 612–621. [Google Scholar] [CrossRef]
  59. Aziz, O. Institutional quality and FDI inflows in Arab economies. Financ. Res. Lett. 2018, 25, 111–123. [Google Scholar] [CrossRef]
  60. Buchanan, B.G.; Le, Q.V.; Rishi, M. Foreign direct investment and institutional quality: Some empirical evidence. Int. Rev. Financ. Anal. 2012, 21, 81–89. [Google Scholar] [CrossRef]
  61. Nguyen, Q.; Kim, T.; Papanastassiou, M. Policy uncertainty, derivatives use, and firm-level FDI. J. Int. Bus. Stud. 2017, 49, 96–126. [Google Scholar] [CrossRef] [Green Version]
  62. Gauvin, L.; McLoughlin, C.; Reinhardt, D. Policy Uncertainty Spillovers to Emerging Markets—Evidence from Capital Flows. 2014. Available online: https://publications.banque-france.fr/sites/default/files/medias/documents/working-paper_435_2013.pdf (accessed on 26 July 2021).
  63. Khandker, L.L.; Amin, S.B.; Khan, F. Renewable energy consumption and foreign direct investment: Reports from Bangladesh. J. Account. 2018, 8, 72–87. [Google Scholar]
  64. Asghari, M. Does FDI Promote MENA Region’s Environment Quality? Pollution Halo or Pollution Haven Hypothesis. Int. J. Sci. Res. Environ. Sci. 2013, 1, 92–100. [Google Scholar] [CrossRef]
  65. Doytch, N.; Narayan, S. Does FDI influence renewable energy consumption? An analysis of sectoral FDI impact on renewable and non-renewable industrial energy consumption. Energy Econ. 2016, 54, 291–301. [Google Scholar] [CrossRef]
  66. Amri, F. The relationship amongst energy consumption, foreign direct investment and output in developed and developing Countries. Renew. Sustain. Energy Rev. 2016, 64, 694–702. [Google Scholar] [CrossRef]
  67. Alvarado, R.; Deng, Q.; Tillaguango, B.; Méndez, P.; Bravo, D.; Chamba, J.; Alvarado-Lopez, M.; Ahmad, M. Do economic development and human capital decrease non-renewable energy consumption? Evidence for OECD countries. Energy 2021, 215, 119147. [Google Scholar] [CrossRef]
  68. Doytch, N.; Uctum, M. Does the worldwide shift of FDI from manufacturing to services accelerate economic growth? A GMM estimation study. J. Int. Money Financ. 2011, 30, 410–427. [Google Scholar] [CrossRef]
  69. Wall, R.; Grafakos, S.; Gianoli, A.; Stavropoulos, S. Which policy instruments attract foreign direct investments in renewable energy? Clim. Policy 2018, 19, 59–72. [Google Scholar] [CrossRef]
  70. Rezagholizadeh, M.; Aghaei, M.; Dehghan, O. Foreign direct investment, stock market development, and renewable energy consumption: Case study of Iran. J. Renew. Energy Environ. 2020, 7, 8–18. [Google Scholar]
  71. Fan, W.; Hao, Y. An empirical research on the relationship amongst renewable energy consumption, economic growth and foreign direct investment in China. Renew. Energy 2020, 146, 598–609. [Google Scholar] [CrossRef]
  72. Ferrier, G.; Reyes, J.A.; Zhu, Z. Technology Diffusion on the International Trade Network. J. Public Econ. Theory 2016, 18, 291–312. [Google Scholar] [CrossRef]
  73. Neumayer, E. Greening Trade and Investment: Environmental Protection without Protectionism; Earthscan: London, UK, 2001. [Google Scholar]
  74. Stalley, P. Foreign Firms, Investment, and Environmental Regulation in the People’s Republic of China; Stanford University Press: Palo Alto, CA, USA, 2020. [Google Scholar]
  75. Mabey, N.; McNally, R. Foreign Direct Investment and the Environment: From Pollution Havens to Sustainable Development; World Wide Fund for Nature United Kingdom, Surrey: London, UK, 1999. [Google Scholar]
  76. Ergun, S.J.; Owusu, P.A.; Rivas, M.F. Determinants of renewable energy consumption in Africa. Environ. Sci. Pollut. Res. 2019, 26, 15390–15405. [Google Scholar] [CrossRef] [PubMed]
  77. Wurgler, J. Financial markets and the allocation of capital. J. Financ. Econ. 2000, 58, 187–214. [Google Scholar] [CrossRef] [Green Version]
  78. Eren, B.M.; Taspinar, N.; Gokmenoglu, K.K. The impact of financial development and economic growth on renewable energy consumption: Empirical analysis of India. Sci. Total Environ. 2019, 663, 189–197. [Google Scholar] [CrossRef]
  79. Mukhtarov, S.; Humbatova, S.; Hajiyev, N.G.-O.; Aliyev, S. The Financial Development-Renewable Energy Consumption Nexus in the Case of Azerbaijan. Energies 2020, 13, 6265. [Google Scholar] [CrossRef]
  80. Raza, S.A.; Shah, N.; Qureshi, M.A.; Qaiser, S.; Ali, R.; Ahmed, F. Non-linear threshold effect of financial development on renewable energy consumption: Evidence from panel smooth transition regression approach. Environ. Sci. Pollut. Res. 2020, 27, 32034–32047. [Google Scholar] [CrossRef] [PubMed]
  81. Raza, S.A.; Shah, N. Testing environmental Kuznets curve hypothesis in G7 countries: The role of renewable energy consumption and trade. Environ. Sci. Pollut. Res. 2018, 25, 26965–26977. [Google Scholar] [CrossRef]
  82. Zafar, M.W.; Shahbaz, M.; Hou, F.; Sinha, A. From nonrenewable to renewable energy and its impact on economic growth: The role of research & development expenditures in Asia-Pacific Economic Cooperation countries. J. Clean. Prod. 2019, 212, 1166–1178. [Google Scholar] [CrossRef]
  83. Sadorsky, P. Financial development and energy consumption in Central and Eastern European frontier economies. Energy Policy 2011, 39, 999–1006. [Google Scholar] [CrossRef]
  84. Saud, S.; Chen, S.; Danish; Haseeb, A. Impact of financial development and economic growth on environmental quality: An empirical analysis from Belt and Road Initiative (BRI) countries. Environ. Sci. Pollut. Res. 2019, 26, 2253–2269. [Google Scholar] [CrossRef] [PubMed]
  85. Sadorsky, P. The impact of financial development on energy consumption in emerging economies. Energy Policy 2010, 38, 2528–2535. [Google Scholar] [CrossRef]
  86. World Bank. World Development Indicators. Available online: http://data.worldbank.org/data-catalog/worlddevelopment-indicators (accessed on 15 May 2021).
  87. Economic Policy Uncertainty Index. Economic Policy Uncertainty Index. Available online: www.policyuncertainty.com/all_country_data.html (accessed on 1 February 2021).
  88. Jia, Z.; Mehta, A.M.; Qamruzzaman, M.; Ali, M. Economic Policy Uncertainty and Financial Innovation: Is There Any Affiliation? Front. Psychol. 2021, 12, 1781. [Google Scholar] [CrossRef]
  89. Xu, S.; Qamruzzaman, M.; Adow, A. Is Financial Innovation Bestowed or a Curse for Economic Sustainably: The Mediating Role of Economic Policy Uncertainty. Sustainability 2021, 13, 2391. [Google Scholar] [CrossRef]
  90. Yu, J.; Shi, X.; Guo, D.; Yang, L. Economic policy uncertainty (EPU) and firm carbon emissions: Evidence using a China provincial EPU index. Energy Econ. 2021, 94, 105071. [Google Scholar] [CrossRef]
  91. Appiah-Otoo, I. Impact of Economic Policy Uncertainty on Renewable Energy Growth. Energy Res. Lett. 2021, 2, 19444. [Google Scholar] [CrossRef]
  92. Hoffmann, R.; Lee, C.G.; Ramasamy, B.; Yeung, M. FDI and pollution: A granger causality test using panel data. J. Int. Dev. 2005, 17, 311–317. [Google Scholar] [CrossRef]
  93. Toda, H.Y.; Yamamoto, T. Statistical inference in vector autoregressions with possibly integrated processes. J. Econom. 1995, 66, 225–250. [Google Scholar] [CrossRef]
  94. Engle, R.F.; Granger, C.W.J. Co-Integration and Error Correction: Representation, Estimation, and Testing. Economy 1987, 55, 251. [Google Scholar] [CrossRef]
  95. Johansen, S. Estimation and Hypothesis Testing of Cointegration Vectors in Gaussian Vector Autoregressive Models. Econometrica 1991, 59, 1551–1580. [Google Scholar] [CrossRef]
  96. Banerjee, A.; Dolado, J.J.; Mestre, R. Error-correction Mechanism Tests for Cointegration in a Single-equation Framework. J. Time Ser. Anal. 1998, 19, 267–283. [Google Scholar] [CrossRef] [Green Version]
  97. Johansen, S. Likelihood-Based Inference in Cointegrated Vector Autoregressive Models; Oxford University Press: Oxford, UK, 1995. [Google Scholar]
  98. Boswijk, H.P. Testing for an unstable root in conditional and structural error correction models. J. Econ. 1994, 63, 37–60. [Google Scholar] [CrossRef]
  99. Johansen-Juselius. Maximum Likelihood Estimation and Inference on Cointegration—With Applications to the Demand for Money. Oxf. Bull. Econ. Stat. 1990, 51, 169–210. [Google Scholar]
  100. Hall, A.; Banerjee, A.; Dolado, J.J.; Galbraith, J.W. Co-Integration, Error Correction, and the Econometric Analysis of Non- Stationary Data. Econ. J. 1996, 106, 1813. [Google Scholar] [CrossRef]
  101. Qamruzzaman, M.; Jianguo, W. Does Foreign Direct Investment, Financial Innovation, and Trade Openness Coexist in the Development Process: Evidence from Selected Asian and African Countries? Br. J. Econ. Financ. Manag. Sci. 2018, 16, 73–94. [Google Scholar]
  102. Qamruzzaman, M.; Jianguo, W. Nexus between financial innovation and economic growth in South Asia: Evidence from ARDL and nonlinear ARDL approaches. Financ. Innov. 2018, 4, 20. [Google Scholar] [CrossRef]
  103. Qamruzzaman, M.; Jianguo, W. Investigation of the asymmetric relationship between financial innovation, banking sector development, and economic growth. Quant. Financ. Econ. 2018, 2, 952–980. [Google Scholar] [CrossRef]
  104. Ali, U.; Shan, W.; Wang, J.-J.; Amin, A. Outward Foreign Direct Investment and Economic Growth in China: Evidence from Asymmetric Ardl Approach. J. Bus. Econ. Manag. 2018, 19, 706–721. [Google Scholar] [CrossRef] [Green Version]
  105. Qamruzzaman, M.; Mehta, A.M.; Khalid, R.; Serfraz, A.; Saleem, H. Symmetric and Asymmetric Effects of Financial Innovation and FDI on Exchange Rate Volatility: Evidence from South Asian Countries. J. Asian Financ. Econ. Bus. 2021, 8, 23–36. [Google Scholar]
  106. Elliott, G.; Rothenberg, T.J.; Stock, J.H. Efficient Tests for an Autoregressive Unit Root. Econ. 1996, 64, 813. [Google Scholar] [CrossRef] [Green Version]
  107. Costantini, V.; Martini, C. The causality between energy consumption and economic growth: A multi-sectoral analysis using non-stationary cointegrated panel data. Energy Econ. 2010, 32, 591–603. [Google Scholar] [CrossRef] [Green Version]
  108. Lee, J.W. The contribution of foreign direct investment to clean energy use, carbon emissions and economic growth. Energy Policy 2013, 55, 483–489. [Google Scholar] [CrossRef]
  109. Pao, H.-T.; Tsai, C.-M. Modeling and forecasting the CO2 emissions, energy consumption, and economic growth in Brazil. Energy 2011, 36, 2450–2458. [Google Scholar] [CrossRef]
  110. Naqvi, S.A.A.; Shah, S.A.R.; Mehdi, M.A. Revealing empirical association among ecological footprints, renewable energy consumption, real income, and financial development: A global perspective. Environ. Sci. Pollut. Res. 2020, 27, 42830–42849. [Google Scholar] [CrossRef] [PubMed]
  111. Shahbaz, M.; Van Hoang, T.H.; Mahalik, M.K.; Roubaud, D. Energy consumption, financial development and economic growth in India: New evidence from a nonlinear and asymmetric analysis. Energy Econ. 2017, 63, 199–212. [Google Scholar] [CrossRef] [Green Version]
  112. Wang, Q.; Wang, L. Renewable energy consumption and economic growth in OECD countries: A nonlinear panel data analysis. Energy 2020, 207, 118200. [Google Scholar] [CrossRef]
  113. Phillips, P.C.B.; Hansen, B.E. Statistical Inference in Instrumental Variables Regression with I(1) Processes. Rev. Econ. Stud. 1990, 57, 99–125. [Google Scholar] [CrossRef]
  114. Stock, J.H.; Watson, M.W. A simple estimator of cointegrating vectors in higher order integrated systems. Econom. J. Econom. Soc. 1993, 61, 783–820. [Google Scholar] [CrossRef]
  115. Burns, K. Economic Policy Uncertainty and Renewable Energy Investment: A Country Level Analysis. In Proceedings of the Energy in Transition, 7th IAEE Asian Conference, Auckland, New Zealand, 12–15 February 2020. [Google Scholar]
  116. Balcilar, M.; Roubaud, D.; Shahbaz, M. The Impact of Energy Market Uncertainty Shocks on Energy Transition in Europe. Energy J. 2019, 40, 40. [Google Scholar] [CrossRef]
  117. Lau, L.-S.; Yii, K.-J.; Lee, C.-Y.; Chong, Y.-L.; Lee, E.-H. Investigating the determinants of renewable energy consumption in Malaysia: An ARDL approach. Int. J. Bus. Soc. 2018, 19, 886–903. [Google Scholar]
  118. Omri, A.; Kahouli, B. The nexus among foreign investment, domestic capital and economic growth: Empirical evidence from the MENA region. Res. Econ. 2014, 68, 257–263. [Google Scholar] [CrossRef] [Green Version]
  119. Ben Mbarek, M.; Saidi, K.; Amamri, M. The relationship between pollutant emissions, renewable energy, nuclear energy and GDP: Empirical evidence from 18 developed and developing countries. Int. J. Sustain. Energy 2017, 37, 597–615. [Google Scholar] [CrossRef]
  120. Shahbaz, M.; Topcu, B.A.; Sarıgül, S.S.; Vo, X.V. The effect of financial development on renewable energy demand: The case of developing countries. Renew. Energy 2021, 178, 1370–1380. [Google Scholar] [CrossRef]
  121. Alsaleh, M.; Abdul-Rahim, A.S. Financial Development and Bioenergy Consumption in the EU28 Region: Evidence from Panel Auto-Regressive Distributed Lag Bound Approach. Resources 2019, 8, 44. [Google Scholar] [CrossRef] [Green Version]
  122. Liu, J.-L.; Ma, C.-Q.; Ren, Y.-S.; Zhao, X.-W. Do Real Output and Renewable Energy Consumption Affect CO2 Emissions? Evidence for Selected BRICS Countries. Energies 2020, 13, 960. [Google Scholar] [CrossRef] [Green Version]
  123. Tamazian, A.; Chousa, J.P.; Vadlamannati, K.C. Does higher economic and financial development lead to environmental degradation: Evidence from BRIC countries. Energy Policy 2009, 37, 246–253. [Google Scholar] [CrossRef]
Figure 1. Conceptual Hypothesized model.
Energies 14 04687 g001
Table 1. Descriptive statistics.
V MeanMaxMinimumStd. Dev.SkewnessKurtosisJarque–Bera
Renewable energy consumptionB3.79773.85893.72510.0404−0.10652.022310.8343
R1.25331.34041.17170.04590.13172.318910.4444
I3.80873.96483.58410.126−0.38591.797711.9562
C2.91553.41792.45920.35150.15021.585911.9158
Economic Policy UncertaintyB4.71855.84783.27090.4938−0.73145.79778.3066
R4.6925.60333.03550.6004−0.79683.988112.9302
I4.40335.22282.92740.4962−0.82924.58885.0552
C4.65135.95693.41030.62170.24172.640510.3326
Foreign Direct InvestmentB1.16231.61620.55030.3159−0.79192.643712.1961
R0.6391.5046−0.64210.5671−0.422.545810.76
I0.28271.2866−0.74940.5222−0.23092.252910.7393
C1.14781.55290.29940.358−1.05563.12747.1007
Financial development 1B3.74084.193.32090.33580.11261.311512.418
R3.47174.00422.82360.4603−0.35281.488412.319
I3.70063.95863.15930.2843−0.79172.057531.2541
C4.80815.06144.57180.1460.40432.104110.335
Financial development 2B2.89263.04032.67850.1057−0.36642.3175.8362
R2.9793.10412.66620.1152−0.99213.558632.541
I3.4053.57833.23270.10430.01461.829811.3129
C3.66273.79593.4340.1186−0.59091.97212.249
Financial development 3B3.20623.39042.79960.1649−1.3694.24257.5345
R3.97284.23973.83480.12550.7392.492922.0347
I3.65554.02163.11880.2904−0.55421.98722.1609
C3.81144.16633.47890.21410.18111.834511.3654
Financial development 4B0.76532.0186−1.08440.905−0.58312.293511.5494
R1.2092.3025−1.64140.9852−1.35744.51898.0649
I1.82982.17991.12710.3056−0.81392.476422.8025
C2.18232.65541.90970.20240.59332.712111.3666
1 for domestic credit to private sector by bank, 2 domestic credit to private sector by financial institution, 3 Broad money as a % GDP, 4 Claims on private sectors.
Table 2. Summary of data for empirical assessment.
VariablesDefinitionSourcesUnits
Renewable energyRenewable energy as a share of total energy consumptionWB%
Economic Policy UncertaintyEconomic Policy Uncertainty Index [87]
ln_FDI_inflowThe logarithm of net FDI inflows in the current USDWBCurrent USD
FD_indexComposite financial development index constructed through PCA
M2/GDPBRM Broad money: This is the ratio of broad money (currency plus demand deposits and quasi–money) to gross domestic productWB
DCPClaims on private sectors: It includes gross credit from the financial system to the private sector.WB
DCBDomestic credit provided by the banking sector as a percentage of GDPWB
DCFDomestic credit provided by the financial sector as a percentage of GDPWB
Table 3. Results of first–generation unit root test.
ADFGF–DLSPPKPSSADFGF–DLSPPKPSS
For BrazilFor India
EPU−1.262−1.655−1.6920.8000 ***−0.701−2.682 ***−2.6 ***0.7950 ***
RE−0.514−2.276−2.989 ***0.6820 ***−0.964−1.971−2.1140.9480 ***
FDI−0.546−1.32−1.7540.9060 ***−2.167−1.392−2.4550.7580 ***
FD−1.829−1.68−1.690.7030 ***−2.564 **−1.744−0.4020.8470 ***
EPU−6.312 ***−2.492 **−5.094 ***0.1130−7.338 ***−4.033 ***−5.441 ***0.1670
∆RE−7.113 ***−4.17 ***−3.023 ***0.0940−6.042 ***−2.54 ***−3.132 ***0.0820
FDI−5.608 ***−4.659 ***−4.796 ***0.1090−5.483 ***−4.188 ***−5.824 ***0.1380
∆FD−5.369 ***−2.53 ***−4.026 ***0.1470−7.806 ***−3.181 ***−4.233 ***0.1730
For RussiaFor China
EPU−1.689−2.483 **−0.4830.7800 ***−0.136−2.351−0.2110.7020 ***
RE−2.283−2.729−1.2550.9470 ***−2.13−0.108−2.969 ***0.6950 ***
FDI−0.473−2.246−0.5230.7010 ***−1.905−0.975−0.70.7950 ***
FD−1.993−1.705−2.3510.6780 ***−1.036−1.908−1.6550.7460 ***
EPU−4.62 ***−4.392 ***−3.26 ***0.0930−5.9 ***−2.567 **−4.675 ***0.1140
∆RE−4.251 ***−2.877 ***−3.995 ***0.1560−7.678 ***−2.925 ***−5.745 ***0.0850
FDI−6.028 ***−4.937 ***−3.895 ***0.1780−7.035 ***−3.818 ***−5.534 ***0.0880
∆FD−6.938 ***−2.994 ***−5.901 ***0.0990−4.059 ***−3.244 ***−5.538 ***0.1500
Note: the superscript ***/**/* denotes the level of significant at a 1%, 5% and 10% level of significance.
Table 4. Results of Ng–Perron unit root test.
MZaMZtMSBMPTMZaMZtMSBMPT
EPU−7.130−1.855 *0.260 *3.550−3.255−1.0770.3317.289
EPU−8.533 **−2.062 **0.242 *2.883 **−9.356 **−2.119 ***0.226 **2.783 **
REC−3.402−1.2080.3557.130−2.197−0.8970.4089.962
∆REC−8.720 **−2.075 **0.238*2.857 **−6.537 *−1.807 *0.271 *3.752 *
FD−0.279−0.2090.74832.012−7.641 *−1.951 *0.255 **3.219 *
∆FD−4.332−1.4240.3295.721−7.089 *−6.132 ***0.080 ***0.474 ***
FDI−8.053 **−1.956*0.243 *3.224 *−3.327−1.2480.3757.321
FDI−9.800 **−2.201 **0.225 **2.547 **−8.893 **−2.081 **0.234*2.858 **
EPU−9.621 *−2.187 **0.227 **2.570 **−0.881−0.2860.32510.613
EPU−8.483 *−2.054 **0.242 *0.908 ***−10.105 **−2.215 **0.219 **2.547 **
REC−3.276−1.1790.3607.3600.4490.2250.50020.473
∆REC−3.276−1.2550.3831.447 **−10.027 **−2.239 **0.223 **2.444 **
FD−4.076−1.3870.3406.0490.4220.1480.35013.387
∆FD−10.193 **−2.246 **0.220 **0.447 ***−9.966 **−2.069 ***0.208 **3.055 **
FDI−2.151−1.0170.47311.216−1.586−0.7540.47512.956
FDI−10.300 **−2.217 **0.215 **1.574 ***−8.349 **−2.043 ***0.245 *2.935 **
Note: the superscript ***/**/* denotes the level of significant at a 1%, 5% and 10% level of significance.
Table 5. Results of Zivot and Andrews (2002) unit root test with one structural break.
At LevelAfter 1st DifferenceAt LevelAfter 1st Difference
T–StatisticTime BreakT–StatisticTime BreakT–StatisticTime BreakT–StatisticTime Break
Panel–A: for brazilPanel–B: for Russia
REC−2.9782003q2−7.039 ***2001q2−2.7632009q1−6.9822009q3
EPU−2.0291997q4−7.28 ***2014q4−3.0572001q3−7.7582010q3
FDI−2.3662008q4−6.838 ***2000q4−2.7312005q2−5.8542011q1
FD−2.2612016q4−7.484 ***2002q4−2.61997q2−5.2911998q2
Panel–C: for IndiaPanel–D: for china
REC−2.5152017q1−8.097 ***2002q4−1.9862007q2−6.21 ***2008q4
EPU−2.9012012q2−6.55 ***2003q2−2.872011q4−6.465 ***1997q4
FDI−2.0461997q3−5.893 ***2018q1−1.932012q1−5.951 ***2001q4
FD−3.0732012q2−8.902 ***2002q3−2.7522008q1−7.27 ***2011q2
Note that the subscript *** explains the level of significance at 1%.
Table 6. Results of lag length criteria under VAR.
LagLogLLRFPEAICSCHQ
019.60409NA2.47e−06−1.560409−1.361263−1.521534
186.95966101.03341.52e−08−6.695966−5.700234−6.501589
2116.343332.322005.03e−09−8.034330 ***−6.242012−7.684450
3158.416629.45133 ***7.65 × 10⁻¹⁰ ***−4.64166−8.052759 ***−10.13628 ***
05.866517NA9.75 × 10−6−0.1866520.012495−0.147776
151.4282168.34254 ***5.30 × 10⁻⁷−3.142821−2.147089 ***−2.948444
274.1318324.973993.42 × 10−7 ***−3.813183 ***−2.020865−3.463304
392.8423913.097395.39 × 10−7−2.084239−1.495335−3.578858 ***
016.31965NA3.43 × 10−6−1.231965−1.032819−1.193090
168.9345978.92240 ***9.20 × 10⁻⁸ ***−4.893459−3.897726 ***−4.699081 ***
286.1611118.949181.03 × 10−7−5.016111 ***−3.223793−4.666232
3101.727910.896742.22 × 10−7−4.972788−2.383884−4.467406
08.589904NA7.43 × 10−6−0.458990−0.259844−0.420115
159.1271175.80582 ***2.45 × 10⁻⁷ ***−3.912711−2.916979 ***−3.718334 ***
275.7258018.258552.92 × 10−7−3.972580 ***−2.180262−3.622701
385.571486.8919751.12 × 10−6−3.357148−0.768244−2.851766
Note that the subscript *** explains the level of significance at 1%.
Table 7. Result of Bayer and Hanck combined cointegration test.
ModelEG–JOHEG–JOH–BO–BDMEG–JOHEG–JOH–BO–BDM
Panel–A: for BrazilPanel–B: for Russia
F R E R E | E P U , F D I , F D 21.05756.827 ***18.33636.479 ***
F E P U ( E P U | R E , F D I , F D ) 16.75545.485 ***13.46762.81
F F D I ( F D I | R E , E P U , F D ) 16.08171.951 ***14.65847.493
F F D ( F D I | R E , E P U , F D ) 16.24563.328 ***15.47259.863
Panel–C: for IndiaPanel–D: for China
F R E R E | E P U , F D I , F D 18.55767.822 ***21.73239.752 ***
F E P U ( E P U | R E , F D I , F D ) 12.96539.53814.84571.921
F F D I ( F D I | R E , E P U , F D ) 13.16552.30914.97947.959
F F D ( F D I | R E , E P U , F D ) 15.99864.011 ***14.57766.821
Note that the subscript *** explains the level of significance at 1%.
Table 8. Results of ARDL estimation for renewable energy.
(1)(2)(3)(4)
Panel–A: Long-run cointegration.
Fpass56.351 ***12.932 ***24.649 ***7.140 ***
Wpass15.845 ***27.945 ***22.411 ***16.994 ***
tBDM−2.094 ***−10.830 ***−4.708 **−5.441 ***
Panel–B: Long run Coefficients
EPU−0.168 **−0.170 ***−0.131 ***−0.181 ***
FDI−0.173 ***0.198 ***0.065 ***−0.055 ***
FD0.134 ***0.049 ***0.071 ***0.049 ***
Panel–C: Short-run coefficients
C−0.233 ***7.881 ***5.190 ***8.666 ***
@TREND−0.031 ***0.076 **0.040 *−0.034 **
D(EPU)−0.014−0.028 **−0.016 **−0.011 **
D(FDI)0.002 **0.015 ***−0.007 **−0.045 ***
D(FD)0.0044 **0.0047 *0.0012 **0.0020 ***
CointEq(−1) *−0.371 ***−0.551 ***−0.252 ***−0.436 ***
Panel–D: Residual test
x A u t o 2 0.5150.1800.3380.333
x H e t 2 0.8420.7450.4610.186
x N o r 2 0.1620.8990.6470.410
x R E S E T 2 0.8450.4110.2840.224
Note: the superscript */**/*** specify the level of significant at a 10%/5%/ and 1%, respectively.
Table 9. Results of asymmetric effects of EPU, FDI, and FD on REC.
IndiaPakistan
[7][8][9][10]
Panel–A: long-run asymmetry cointegration
Fpss11.26410.358.76211.034
Wpss11.51512.51912.03112.221
tBDM−9.244−17.305−17.391−16.929
Panel–B: Long-run asymmetric coefficients
EPU+−0.168 ***−0.211 ***−0.121 ***−0.021 ***
EPU−0.201 ***−0.060 **−0.109 ***0.114 ***
FDI+0.670 ***0.134 ***0.249 ***0.276 ***
FDI0.328 ***0.052 ***0.261 **0.341 **
FD0.359 **0.023 ***0.057 ***0.182 ***
FD0.510 **0.441 *0.155 **0.808 ***
Panel–B: short-run asymmetric cointegration
ζ−0.237 ***−0.556 ***−0.441 ***−0.512 ***
EPU+−0.009 ***−0.009 ***−0.007 **0.012 ***
EPU−0.061 ***−0.056 **−0.001 ***−0.013 **
FDI+−0.022 **0.032−0.0640.888
FDI0.00740.0490.040−0.205
∆FD0.0034 ***0.0022 ***0.075 **0.001 **
∆FD0.0071 *0.00150.0002 *0.0073 *
Panel–D: Long-run and short-run symmetry test and residual test
W L R E P U 9.708 ***12.817 ***10.212 ***6.919 ***
W L R F D I 12.009 ***6.706 ***11.494 ***12.057 ***
W S R E P U 8.333 ***7.492 ***7.171 ***12.458 ***
W S R F D I 12.944 ***8.322 ***11.337 ***7.571 ***
x A u t o 2 0.6990.2150.5890.494
x H e t 2 0.4010.3470.9070.023
x N o r 2 0.9140.5250.2120.764
x R E S E T 2 0.3160.6580.4270.285
CUSUMSSSS
CUSUM of squareSSSS
Note: the superscript */**/*** specifiy the level of significant at a 10%/5%/ and 1%, respectively.
Table 10. Results of toda–Yamamoto causality test (dmax = 2).
RECEPUFDIFDCausality Remarks
Panel–A: for Brail
REC4.58 **7.40 ***5.02 **EPU→REC; FDI↔REC; FD↔REC; FD→FDI
EPU2.494.33 **1.33
FDI9.07 ***2.062.17
FD9.31 ***1.905.50 ***
Panel–B: for Russia
REC11.94 ***1.4111.13 ***EPU→REC; FD→REC; EPU→FDI; FD→FDI;
EPU2.842.502.65
FDI12.83 ***1.996.64 ***
FD1.812.412.74
Panel–C: for India
REC6.28 ***4.93 ***12.16EPU→REC; FDI↔REC; FD→REC; FD→FDI
EPU5.75 ***3.97 *1.06
FDI4.23 **8.95 ***4.27 **
FD1.431.461.04
Panel–D: for China
REC4.310 **4.182 **9.796 ***EPU→REC; FDI→REC; FD→REC; FD→FDI; EPU→FD
EPU2.6560.5521.150
FDI0.7431.3074.107 **
FD0.00810.034 ***0.120
Note: the superscript */ **/ *** specifiy the level of significant at a 10%/5%/ and 1%, respectively.
Table 11. Robustness test.
Fully-Modified OLSDynamic OLSCorneal
RegressorsCo-EfficientErrorStatisticCoefficientErrorStatisticCoefficientErrorStatistic
Panel–A: for Brazil
EPU−0.30150.0355−8.4929−0.74820.0335−22.3343−0.55990.0311−18.0032
FDI0.41040.04738.67650.63530.07648.31540.40420.06076.6589
FD0.35230.04447.93460.44140.05637.84010.64140.057711.1161
R2 0.9962 0.9863 0.9917
Adj.R2 0.977 0.9784 0.976
Panel–B: for Russia
EPU0.7490.05513.61810.5820.052111.17080.29620.06614.4810
FDI0.51040.07516.79620.73030.053513.65040.53430.05839.1646
FD0.40240.04768.45370.75310.075310.00130.74310.039119.0051
R2 0.9826 0.9808 0.9926
Adj.R2 0.9767 0.9798 0.9812
Panel–C: for India
EPU0.7810.072910.71330.34690.06225.57710.63320.06839.2708
FDI0.42680.041510.28430.6230.07298.54590.60070.053811.1654
FD0.64540.059610.82880.72920.067210.85110.54180.05839.2933
R2 0.9884 0.9776 0.983
Adj.R2 0.9777 0.9796 0.9776
Panel–D for China
EPU−0.45320.0671−6.7540−0.3890.0751−5.1797−0.44940.0742−6.0566
FDI0.50260.07286.90380.36210.03829.47900.3140.04756.6105
FD0.5130.07916.485410.33740.07274.64090.59970.07028.5427
R2 0.9785 0.9832 0.9859
Adj.R2 0.9763 0.9762 0.9802
Publisher’s Note: MDPI stays neutral with regard to jurisdictional claims in published maps and institutional affiliations.

