Article

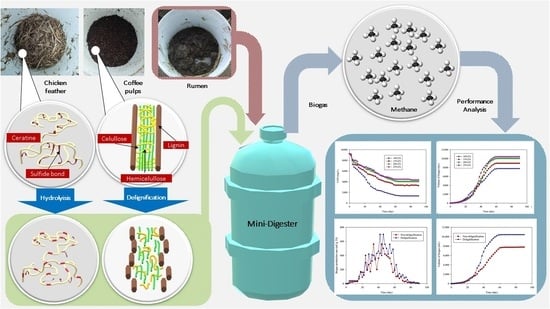
Biogas Production from Coffee Pulp and Chicken Feathers Using Liquid- and Solid-State Anaerobic Digestions

Department of Chemical Engineering, Faculty of Engineering, Universitas Diponegoro, Semarang 50239, Indonesia
*
Author to whom correspondence should be addressed.
Energies 2021, 14(15), 4664; https://doi.org/10.3390/en14154664
Submission received: 29 June 2021 / Revised: 24 July 2021 / Accepted: 28 July 2021 / Published: 1 August 2021
(This article belongs to the Collection Feature Papers in Bio-Energy)

Abstract

:
Agricultural waste, particularly lignocellulose, has been used in the second generation of biogas. Coffee pulp and chicken feathers can be developed as biogas raw materials because of their suitability as a biogas substrate. This study investigates the effect of the percentage of total solids (TS), carbon to nitrogen ratio (C/N, g/g), and delignification pretreatment on biogas production from coffee pulp and chicken feathers, and aims to compose kinetics using the modified Gompertz model. The results show that adjusting the percentage of TS at low-level speeds up the degradation process, which increases chemical oxygen demand (COD) reduction and biogas production. COD reduction and biogas production increase optimally at the 25 (g/g) C/N ratio. Pretreatment delignification aids microorganisms in substrate decomposition, resulting in faster COD reduction and biogas conversion. The 25% TS and 25 (g/g) C/N ratio with the delignification process achieved the best biogas production, with biogas production of 10,438.04 mL. The Gompertz method shows that the difference in TS percentage can influence biogas production. Moreover, the method shows that biogas production is higher with the delignification process than without it.

Graphical Abstract

1. Introduction

Energy sustainability is one of the significant issues in this era. Based on the British Petroleum (BP) Statistical Review of World Energy, global energy needs are linear with the number of births, which means that energy consumption increases every year because of the world population growth [1]. Global energy development is in the process of transitioning into renewable energy [2]. Renewable energy is produced from biomass, water, photovoltaic solar, and geothermal sources [3], including biogas. Biogas mainly contains methane and carbon dioxide, hydrogen, hydrogen sulfide, nitrogen, and oxygen in minor quantities [4]. Biogas is produced from farm waste, such as cow manure [5], cabbage waste, chicken feces [6]. Another potential waste raw material for biogas production is food industry waste [7].
Coffee is one of the largest commodities in world trade after crude oil. Coffee pulp waste has a good fiber and protein content of 17% and 10.4%, respectively, and is processed for another purpose [8]. Chicken feathers are another potential protein source because they contain 85–95% of protein [9]. Ruminants cannot digest undegradable protein of 53.6–87.9% from chicken feathers. Anaerobic digestion is a biochemical decomposition process using anaerobic microorganisms in an anaerobic condition, which means no oxygen is needed. Anaerobic digestion is divided into two major types: liquid-state anaerobic digestion (LS-AD) and solid-state anaerobic digestion (SS-AD). Both methods demonstrate a good result in biogas formation. In previous research by Manan and Webb, the water content in SS-AD was in the range of 12–70%, whereas LS-AD is different and needs more water content. Further, LS-AD can be an excellent alternative to the biogas production process, providing almost the same quality [10].
Some variables that can impact the biogas production rate are feedstock to inoculum ratio (F/I), pH, C/N ratio, pretreatment, and temperature. The ratio of feedstock to inoculum determines the biogas production rate [11]. The optimum pH range for producing biogas is 6–7, at which microorganisms can produce biogas better than without prior feedstock pH adjustment. C/N ratios also affect biogas production. The optimum ratio of C/N in biogas is 25–30 (g/g) [12]. Temperatures in the range of 32–37 °C would be ideal for the starter. This range of microorganism activity for substrate digestion is optimum [13]. Lignin is a complex compound found in biomass that is difficult for microorganisms to degrade anaerobically [14]. Thus, microorganisms require considerable time to convert this substrate into biogas [15]. According to previous research, the delignification or modification helps to break down lignin or substrate by acid or base, allowing the substrate to decompose easily [16,17]; however, if the amount of acid or base concentration is small, the results will not differ significantly [18,19].
Several previous studies have combined two substrates (co-digestion) to obtain a C/N ratio expected to increase biogas production [4,12]. This study offers something new by combining coffee pulp with chicken feather,. Simultaneous pretreatment for both substrates is a technical breakthrough that increases the efficiency of pretreatment time compared to when treated separately. The high nitrogen content of chicken feathers helps the substrate to achieve the required C/N ratio so that the two raw materials (coffee pulp and chicken feather) are synergistic.
This study aims to examine the effect of total solid (TS) percentage, C/N ratio, and delignification pretreatment on the formation of biogas from coffee pulp and chicken feathers, and to fit the model with the modified Gompertz method.

2. Materials and Methods

2.1. Materials and Tools

The main materials used in this study were cow manure from the Laboratory of Animal Science Faculty, Universitas Diponegoro; chicken feathers from Muryadi chicken slaughtering house, Banyumanik Semarang City; and coffee pulps from Posong coffee plantation, Temanggung. Other chemicals used for the analysis were KMnO4, H2SO4, urea, NaOH, aquadest, and oxalic acid (pro-analysis grade) provided by Merck KGaA, Darmstadt, Germany.
Tools needed in this research were digester 1 L (digester fabricated in the internal workshop of the chemical engineering department of Universitas Diponegoro), stirrer, beaker glass, Erlenmeyer flask, pipe, measure glass, pipette, water displacement apparatus, pH meter, heater, burette, and stative. The scheme of this research is shown in Figure 1, consisting of 5 stages, namely mixing, pretreatment, neutralization, fermentation, and performance analysis.

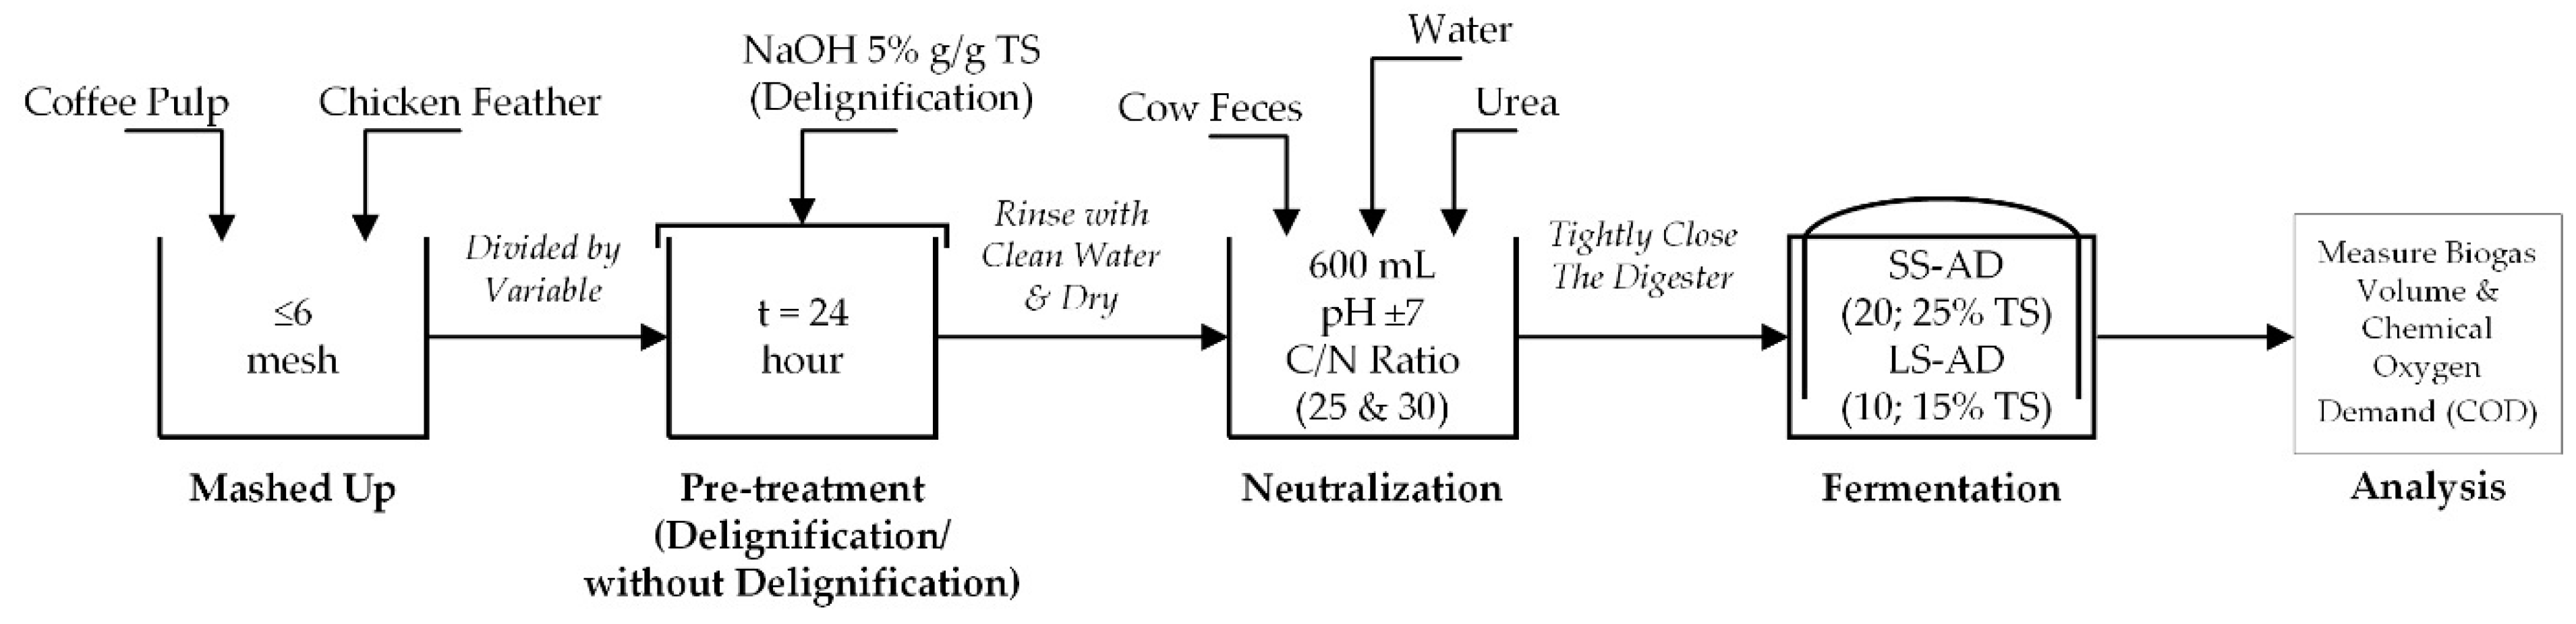
2.2. Raw Material Preparation

Chicken feathers and coffee pulps were cut into small pieces (±1 mm). For delignification process, NaOH solution 5% TS (g/g) was added to chicken feathers and coffee pulps (both have a ratio of 1:2) then soaked for 1 day. The NaOH solution got separated from chicken feathers and coffee pulps after a day. Both solids (treated chicken feathers and coffee pulps) were rinsed with clean water after previously drained, followed by drying at room temperature (±30 °C) for 3 h. After that, 600 mL water was added to solid, the substrate solution was neutralized to pH ±7 using H2SO4, and urea was added to each of the substrate solution as a micronutrient to achieve the desired C/N ratio on digester. Then, rumen was added to the solid by a ratio of 1:2, and then tightly closed the digester for the fermentation process at room temperature (±30 °C). Table 1 shows the variable design.

2.3. Nitrogen Content

Initial nitrogen content was tested by the Kjeldahl method [20,21]. One g of the smoothed and oven-dried sample was weighed and then put into a Kjeldahl flask. Next, 14 g of anhydride Na2SO4, 1.6 g of CuSO4·5H2O, and 25 mL of concentrated H2SO4 were added, and digested until the solution became clear. The flask was cooled and enough distilled water was added before being put into the distillation flask. Then, 4 g of Zn powder and 100 mL of 5 N NaOH were added, and distillation occurred for 30–45 min. The distillate formed was flowed into an Erlenmeyer containing 150 mL of saturated boric acid which was dripped with MO 3 drops. The volume of distillate and boric acid in Erlenmeyer (V solution) was measured and the volume of distillate (V2), as much as 10 mL, was taken before it was titrated with 0.02 N HCl titrant to obtain V1. The nitrogen content is determined by the following Equation (1):
%   nitrogen = ( V 1 · N ) HCl   ×   AR   nitrogen   ×   V   solution V 2 ×   g   dry   sample   × 1000 × 100 %

2.4. Carbon Content

The initial carbon content was determined by the Walkely and Black method [22] weighing 1 g in a 100 mL Erlenmeyer. Then, 10 mL of K2Cr2O7 1 N was added to the sample. Next, 20 mL of concentrated H2SO4 was added, and the sample was let to stand for 30 min while occasionally shaken. The solution was then added with 100 mL of distilled water, 5 mL of H3PO4, and 1 mL of diphenylamine indicator. The sample was titrated with 1 N FeSO4 solution until the color changed to green. Organic C content is calculated by Equation (2):
C organic = ( V · N ) K 2 Cr 2 O 7 × ( V · N ) FeSO 4 × 0.33 g   dry   sample   × 0.77 × 100 %

2.5. Biogas Production Process

Biogas production and chemical oxygen demand (COD) of each digester were then determined every two days for 90 days. A liter measure glass was filled with water for biogas production. After inserting the digester’s pipe into the flip-down measure glass, the digester’s valves were opened, and the water scale reduction due to this process was calculated. The difference between calculations before and after biogas represented the volume of biogas produced. The PerkinElmer Auto system XL Gas chromatography was used to determine the methane content in the biogas produced.

2.6. COD Analysis

COD analysis with permanganometry was carried out (based on SNI Method 06-4571-1998) and the first standardization of KMnO4 by taking 10 mL of 0.01 N H2C2O4 solution 5 mL of 4 N H2SO4 solution into an Erlenmeyer flask. The Erlenmeyer flask containing the solution was heated to 70–80 °C. The mixture was titrated with KMnO4 until the titration endpoint occurred (wine red color becomes unchanged). As for COD analysis, 1 mL sample was taken from the digester to be analyzed and then diluted to 10 mL on the Erlenmeyer flask. Next, 5 mL of 4 N H2SO4 and the standardized KMnO4 solution were added, and then the mixture was heated for about 10 min. Then, 5 mL H2C2O4 0.01 N was added and then heated to 70–80 °C. The solution is titrated using standardized KMnO4 until the titration endpoint occurs. COD is calculated by Equation (3):
COD   Mn   ( ppm ) = { ( a + b ) N   KMnO 4 ( N ·   V )   Na 2 C 2 O 4 } } × 8000
where, a: volume of KMnO4 (standardized); b: volume of KMnO4 (COD analysis)

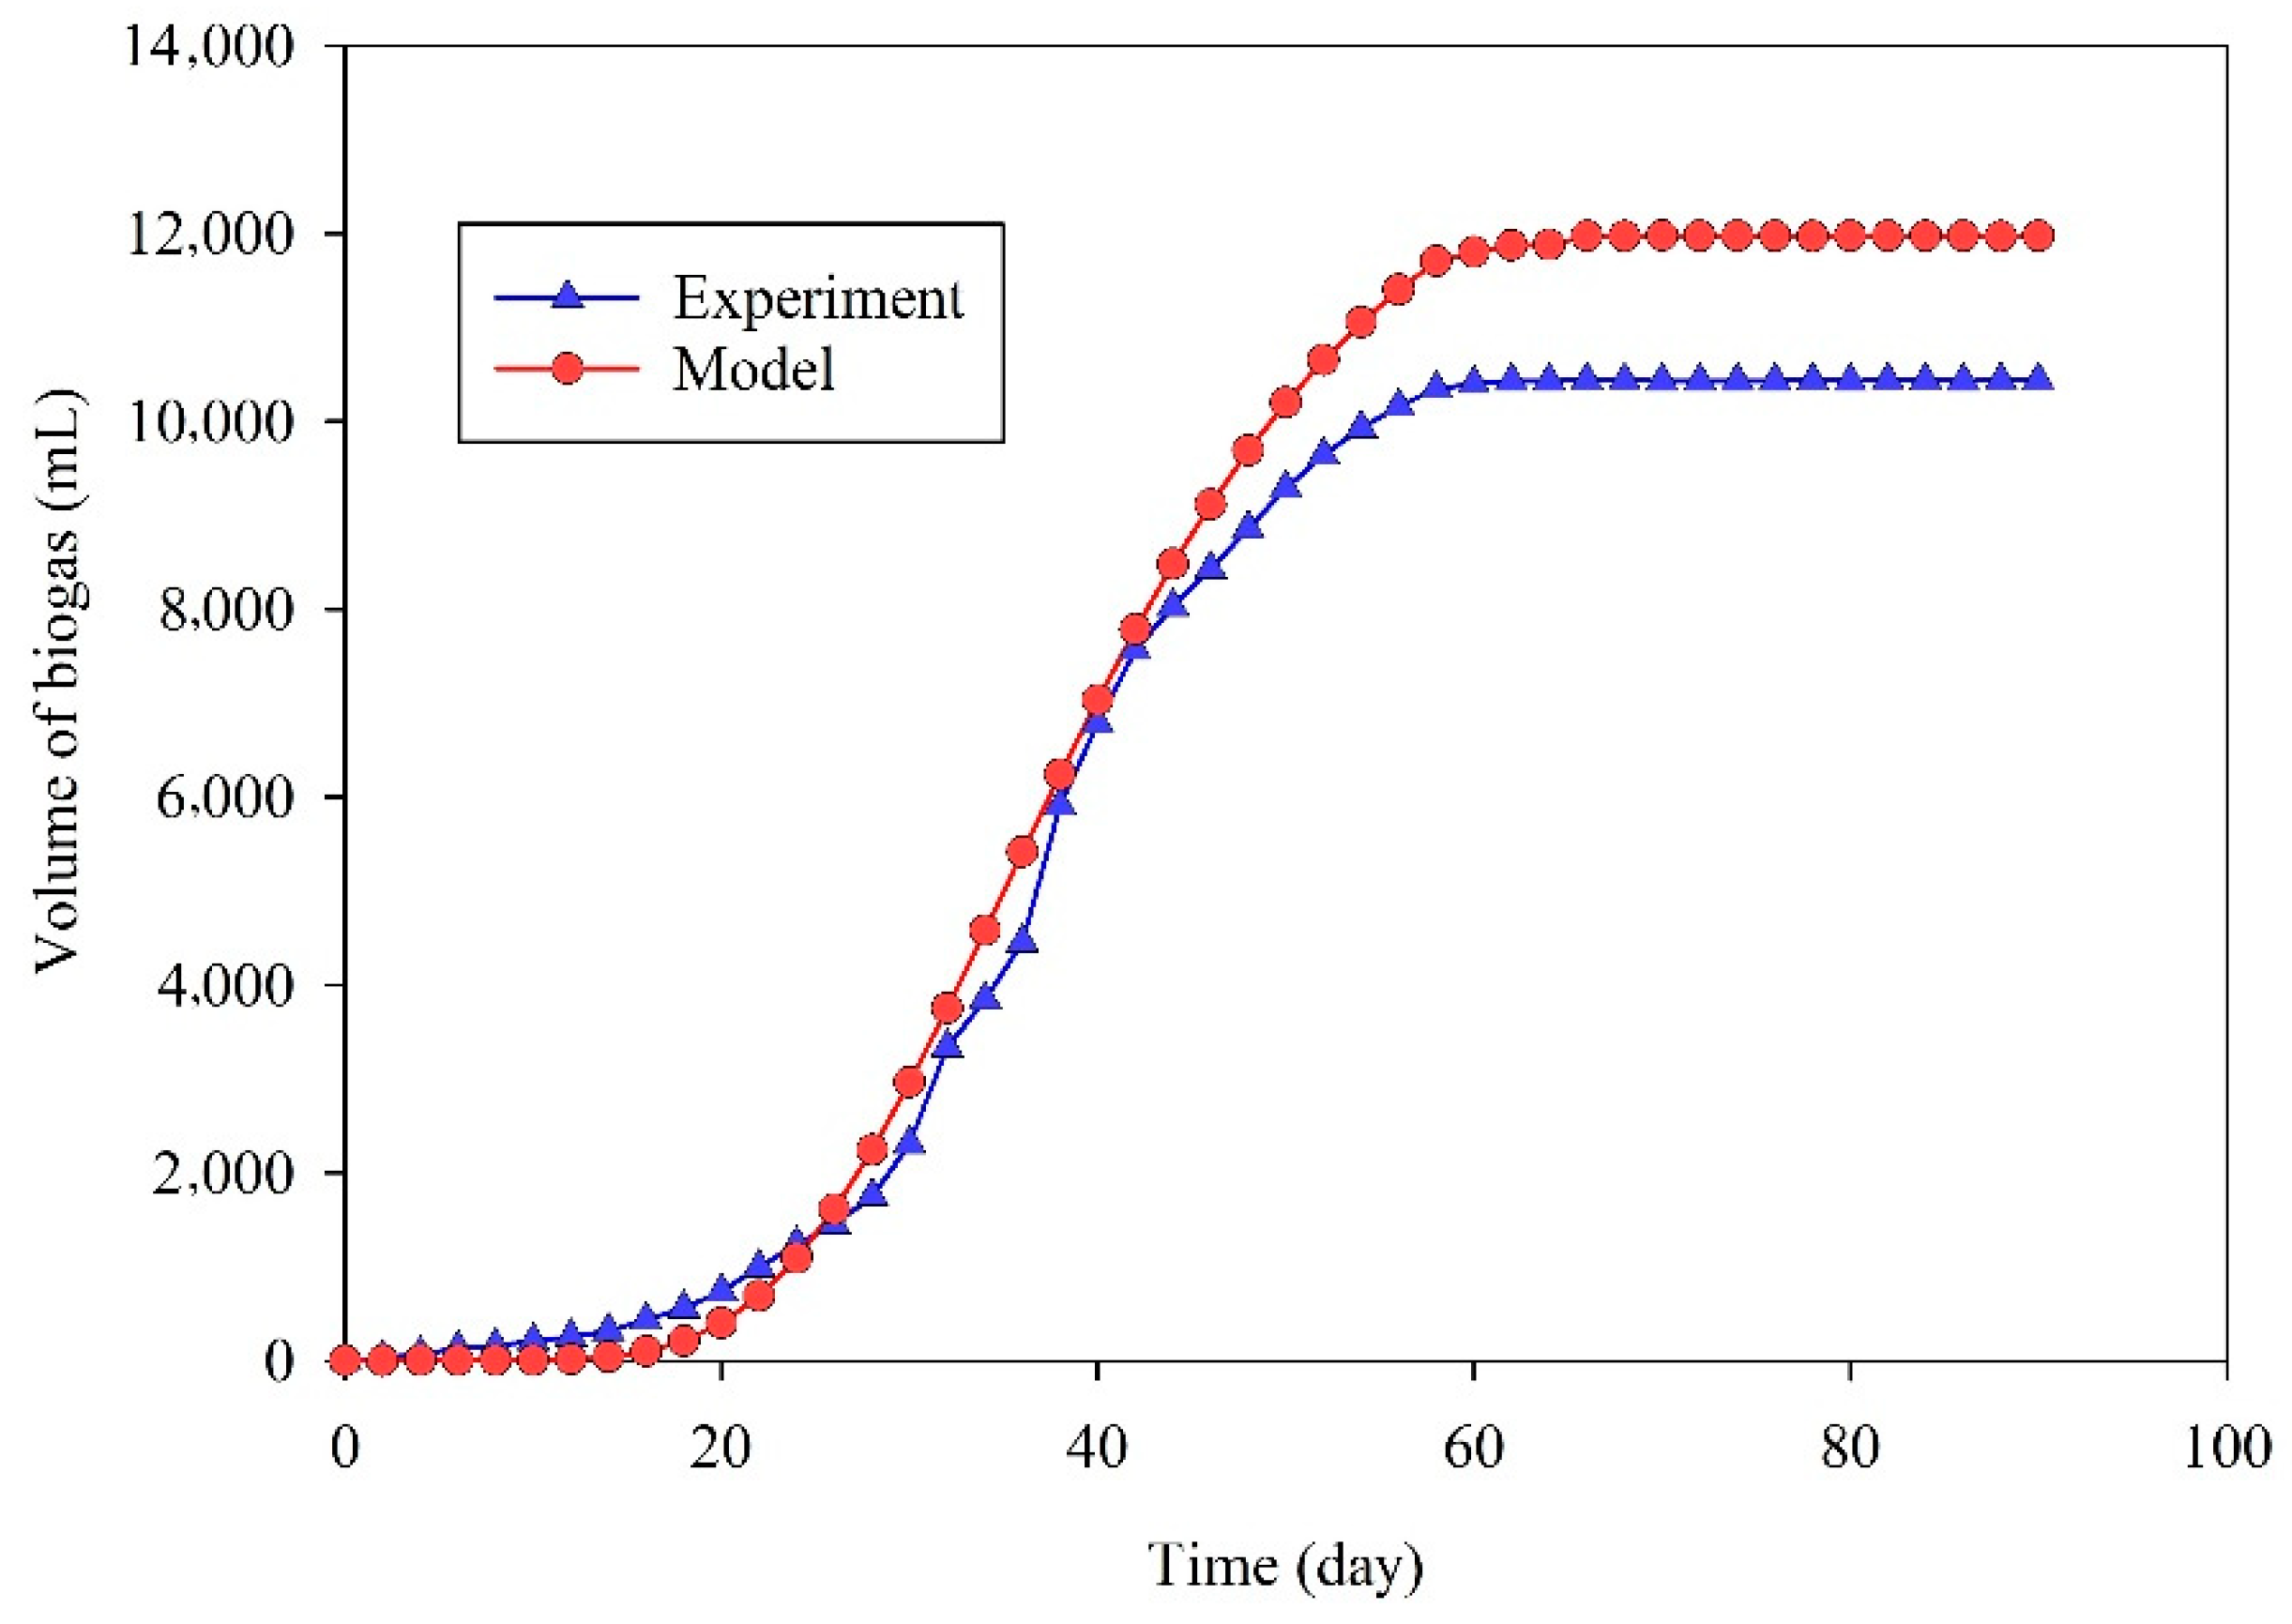
2.7. Kinetics of Biogas Production Using The Gompertz Model

The Gompertz equation is commonly used as an approximation model for biogas production in batch systems. By assuming the biogas production rate in batch conditions correspond to the specific growth rate of methanogenic bacteria in the biodigester, the biogas production rate can be predicted [23].
y   ( t ) = ym · exp   { exp   [ U · e ym ( λ   t ) + 1 ] }
where,
  • y(t): The cumulative biogas yield at a digestion time t days (mL/g·TS)
  • ym: The biogas production potential (mL/g·TS·day)
  • U: The maximum biogas production rate (mL/g·TS·day)
  • λ: Lag phase period or minimum time to produce biogas (days)
  • t: Cumulative time for biogas production (days)
  • e: Mathematical constant (2.718282)
The kinetic constant of ym, λ, and U was determined using non-linear regression with the help of polymath software.

2.8. Statistical Analysis

All data in this study were carried out in triplicate for each condition. Statistical significance was accepted when the p-value was lower than 0.05, which was performed using Microsoft Excel 2016 software.

3. Results and Discussion

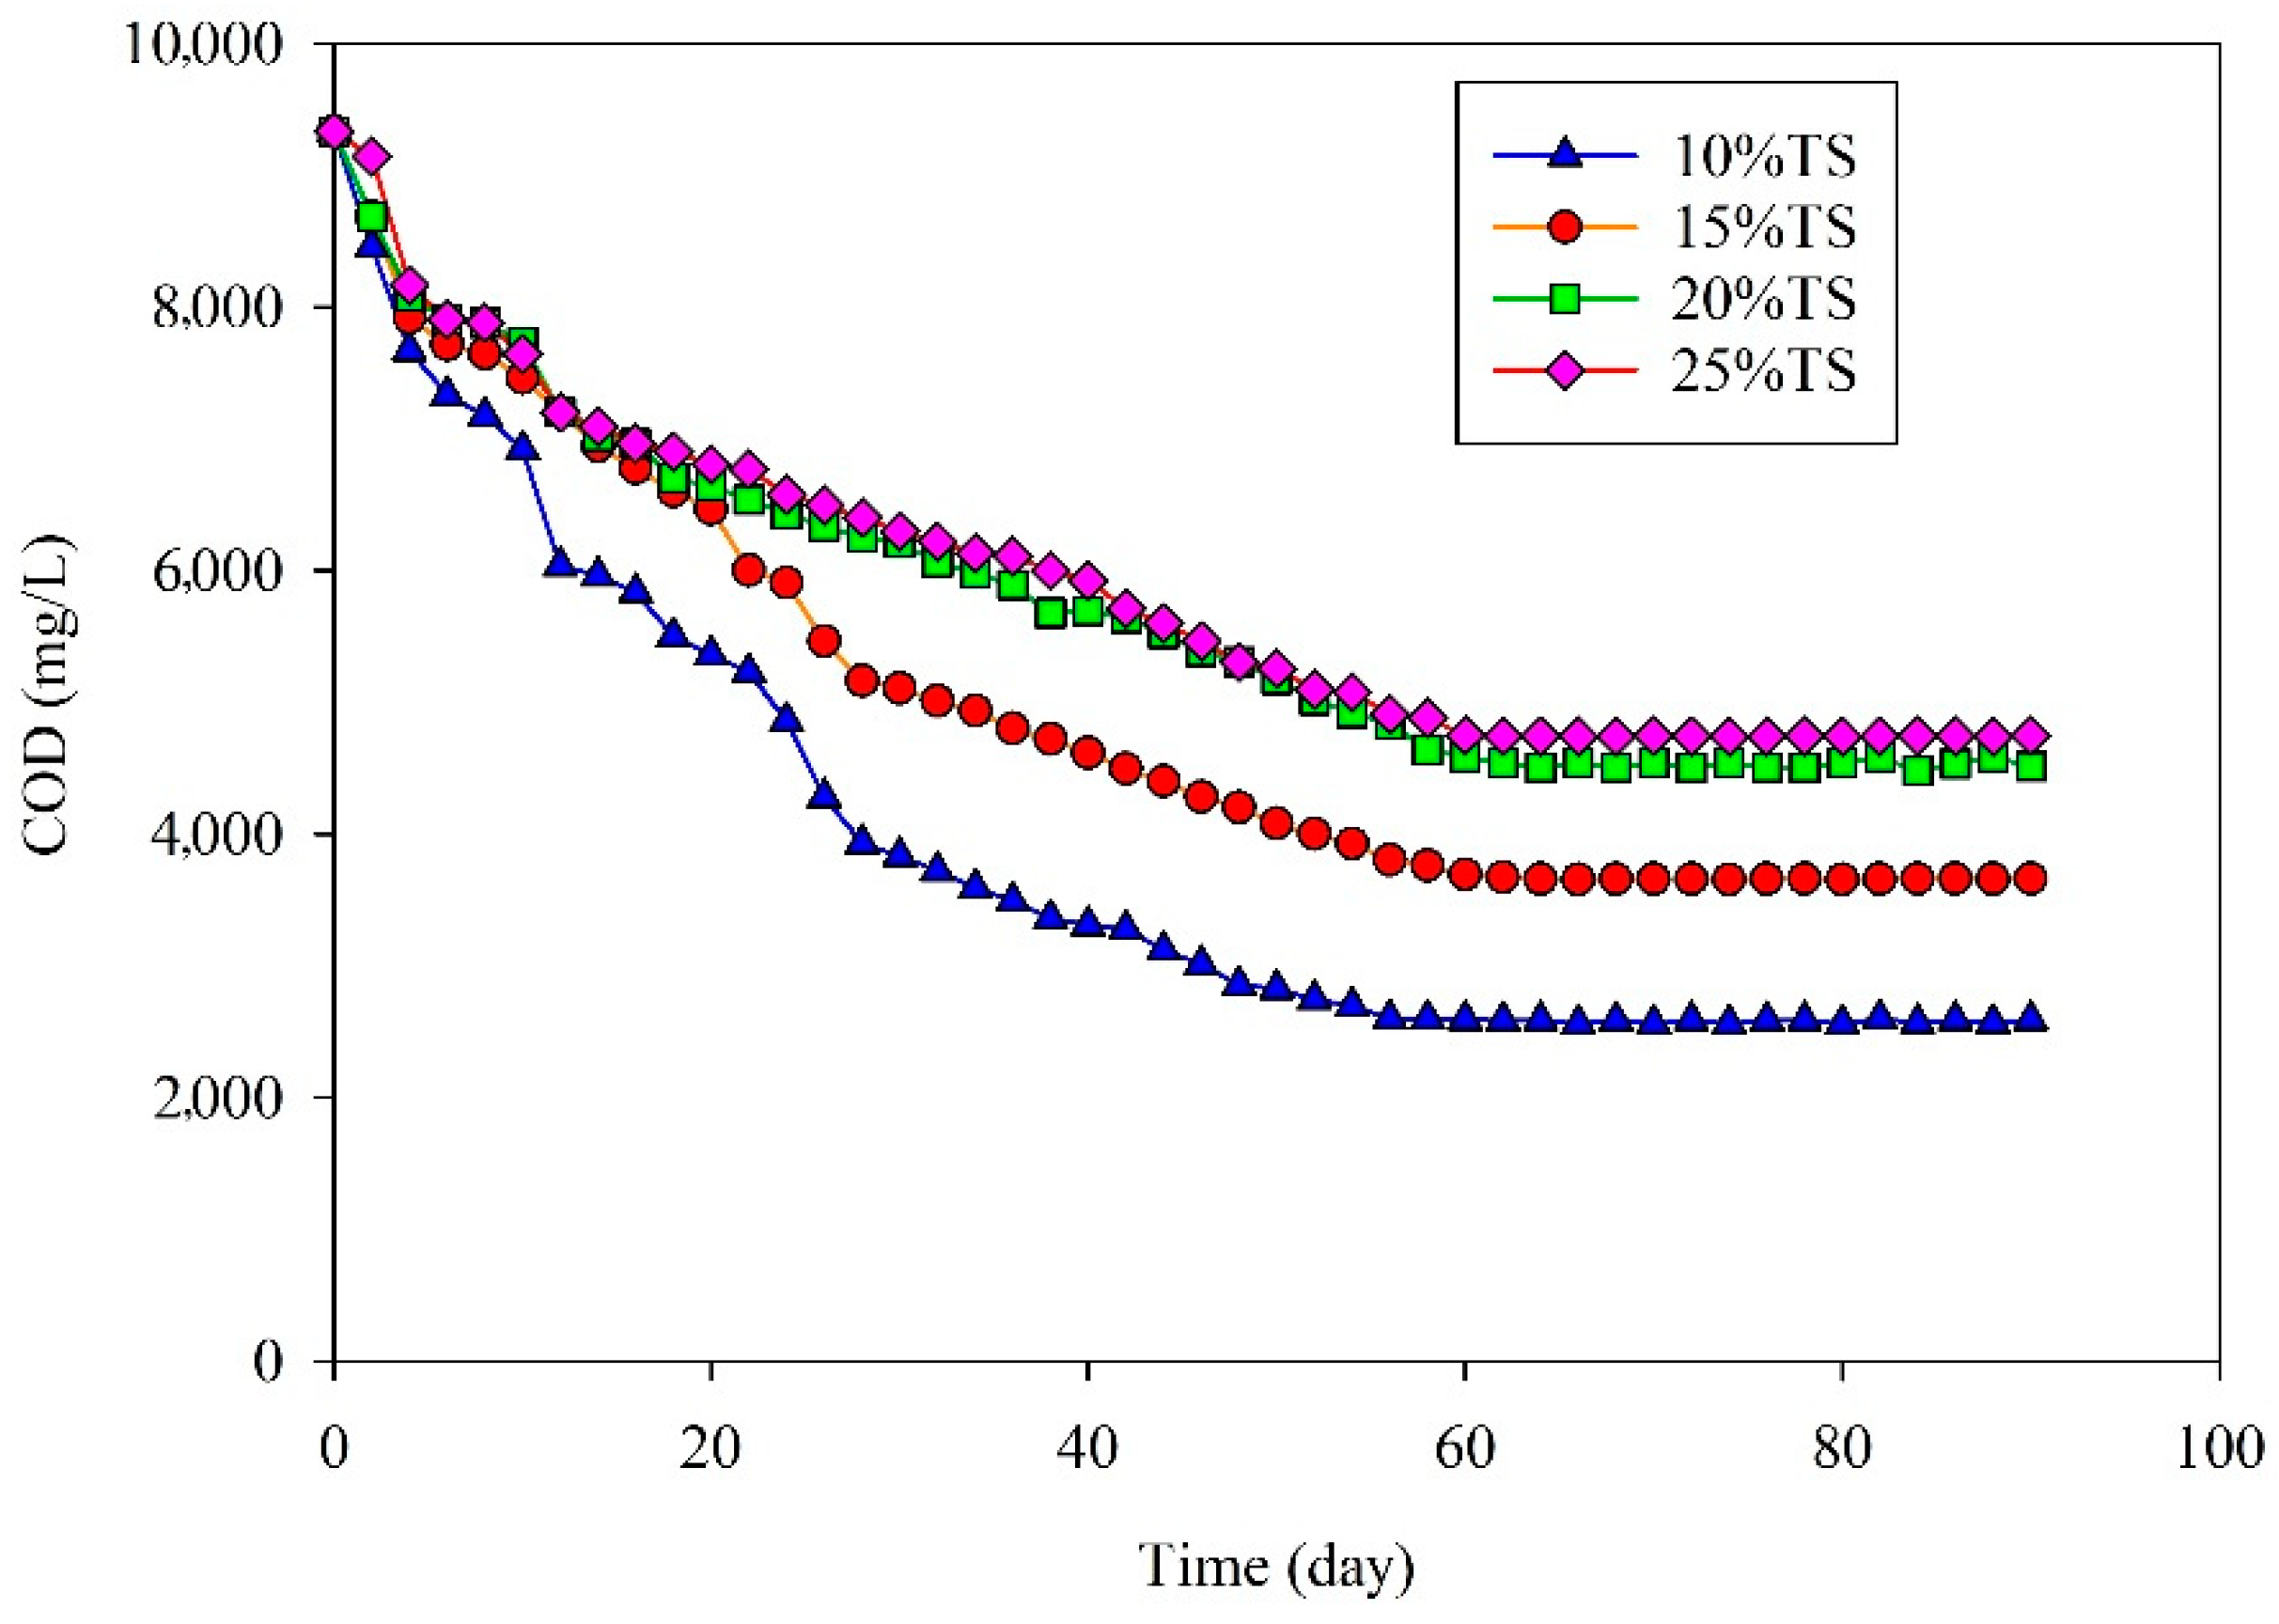
3.1. Effect of Different TS Percentages on COD Reduction and Biogas Production

3.1.1. COD Reduction

Figure 2 and Figure 3 show that the COD decreased every two days for each run. In the initial stage, the COD concentration decreased significantly around the 6th day; this decrease then declined over the following days. Decreased COD levels during biogas production reveal a difference in microorganism activity when degrading organic matter and converting it into biogas [24,25]. The decrease in COD indicates the degradation of dissolved organic matter in the liquid phase. Degradation of organic matter indicates that there is a molecular change in the substrate [26,27]. Microorganisms break down long chains of complex carbohydrates, proteins, and lipids into shorter parts, monomers, oligomers into glucose, glycerol, purines, and pyrimidines [28]. These monomers will then become substrates for further biogas formation reactions, acidogenesis, acetogenesis, and methanogenesis [29].
According to research conducted by Saragih et al., the solubility decreased as the percentage of TS increased, which affected the solid substrate’s mass transfer, such that the higher the solubility, the better the microbes’ ability to degrade the COD [30]. Reduced COD levels in anaerobic digestion indicate that materials other than acids can be degraded because organic acids in the liquid phase increase COD [31]. The substrate residence time also decreases the COD: the longer the substrate residence time, the lower the COD. This is caused by the long time required by microorganisms to degrade organic particles, and, as such, the lower the TS percentage, the faster the organic matter degradation process [24]. Insoluble solids in a digester cause volatile fatty acid accumulation, inhibiting methanogenesis and interfering with anaerobic digestion [25]. Budiyono et al. and Rennuit et al. explained that biogas production is negatively correlated to COD, implying that a lower COD value causes biogas production to increase [31,32]. Gao et al. demonstrated the same phenomenon, stating that an increase in COD reduction shows that more organic materials are being degraded to organic acids, converting to methane [33].

3.1.2. Biogas Production

Figure 4 and Figure 5 show that the biogas production fluctuated rather than remaining constant. The total biogas accumulation volume produced did not differ significantly in the initial stages, with the slight difference attributable to bacteria entering the lag phase. The lag phase occurs when bacteria adapt to a new environment, occurring at the beginning of a fermentation process of varying duration [34]. An earlier study by Jha et al. showed that the production volume could not distinguish the content of a substrate and liquid mixture [35], especially if a substrate is a complex [36] and difficult to break down; therefore, observing the results of the biogas accumulation is difficult [37].
According to Jha et al., adding water to biogas production has no significant impact on the production rate because the biogas production in both liquid- and solid-state conditions successfully produces other gases, such as CO2 and hydrogen mixed with CH4. Therefore, the impact of adding water to methane production cannot be ascertained [35,38,39]. Biogas production with a certain C/N ratio shows that the liquid state is more optimal than the solid-state if the substrate and digester volume are twice as large as the solid-state volume [31,40].

3.2. Effect of Different C/N Ratios on COD Reduction and Biogas Production

3.2.1. COD Reduction

The COD concentrations were lower in the C/N 25 (g/g) and solid-state compositions, as shown in Figure 6 and Figure 7. COD reduction decreased as the C/N ratios increased. Microbial growth slows down at high C/N ratios, owing to nutrient limitation (nitrogen) [41]. Dioha & Ikeme, Wang et al., and Xu et al. showed that the optimal C/N co-digestion ratio for a substrate mixture in a batch digester could be achieved in the range of 20–35 (g/g) if excess carbon source substrate or nitrogen deficiency inhibited COD reduction [42,43,44].

3.2.2. Biogas Production

Figure 8 and Figure 9 show that C/N 25 (g/g) produced more volume in both liquid and solid states than C/N 30 (g/g). Based on previous research, the determination of neither C/N 25 or C/N 30 (g/g) showed results in the form of significant differences because a condition with C/N 25 (g/g) and C/N 30 (g/g) existed where biogas-producing microorganisms worked optimally [42,45]. This phenomenon could also be seen in the decrease in COD quantum, which did not show a significant difference for C/N 25 (g/g) and C/N 30 (g/g) [46].

3.3. Effect of Pretreatment or Delignification on COD Reduction and Biogas Production

3.3.1. COD Reduction

As shown in Figure 10, the liquid- and solid-state variable research reveal the same phenomenon as the delignification process results by producing better results than the non-delignification process.
According to previous research, the delignification of NaOH helps to break down lignin, allowing the substrate to decompose easily [16,47]. The presence of insoluble lignin, which makes cellulose and hemicellulose difficult to digest, complicates the anaerobic conversion of lignocellulose to methane [48]. The purpose of pretreatment is to alter the material’s structure and composition to eliminate the bottleneck of the hydrolysis process and increase the rate of the hydrolysis enzyme and biogas yield [49]. Hydrolysis byproducts in the pretreatment stage can be toxic to enzymes and anaerobic consortia. This condition inhibits or reduces biogas production, as demonstrated in some research results, showing that COD reduction is greater in the non-delignification process [50].

3.3.2. Biogas Production

Figure 11 describes the rate of biogas production and Figure 12 illustrates the accumulation of biogas production, both of which reinforce the idea that pretreatment (delignification) has a positif effect on biogas production.
The addition of NaOH to the delignification process will speed up the decomposition of the substrate by microorganisms, thereby speeding up the substrate’s conversion to biogas [51]. Therefore, adding a sufficient amount of NaOH has a significant impact on biogas production rate [52].

3.4. Kinetics of Biogas Production Using The Gompertz Model

The Gompertz method simulations in Table 2 and Figure 13 show that the substrate with a content of 25% TS, 25 (g/g) C/N ratios, and delignification pretreatment produces the maximum biogas. The variables that influence this study implement the delignification and non-delignification processes in addition to being compared using TS percentage. With the same variable, the 25% TS, 25 (g/g) C/N ratios, and the delignification process all produce a better biogas production rate, which highlights the potential biogas that can be produced (A), i.e., 13,498.64 mL, and the rate of biogas production (U) is 419.38 mL/days; the biogas first gets produced (λ) in 23.09 days, with a resulting R2 value of 0.9961. R2 indicates how well the model fits the experimental data. In this observation, the value of R2, which is close to 1, indicates that the model is close to the experimental results [53].
This study’s modified Gompertz method can determine the estimated flow rate of biogas production [54,55]. Actual and predicted volumes were similar when viewed through the comparison graphs. This trend shows that the Gompertz method can be used in this study because the results were not significantly different from this study’s results. Furthermore, this method can determine whether research results are relevant data. The Gompertz method shows that the difference in TS percentage can influence biogas production. Moreover, the method shows that the biogas production is higher with the delignification process than without it. Besides U, the biogas production rate, the value of λ needs to be examined to determine the minimum time required for proper biogas production [56,57].

4. Conclusions

The lower the percentage of TS, the faster the organic matter degrades, the higher the COD reduction, and the faster the biogas production. COD reduction and biogas production increased optimally at 25 (g/g) C/N ratios in this study. Because of the limited nutrient content, microbial growth will be slowed at a higher C/N ratio (nitrogen). The influence of pretreatment delignification has facilitated microorganisms on substrate decomposition to alter the material’s structure and composition, and increased the rate of hydrolysis enzymes, allowing for faster COD reduction and substrate conversion into biogas. The 25% TS and 25 (g/g) C/N ratio with the delignification process achieved the best biogas production, with biogas production of 10,438.04 mL. According to the Gompertz method, the 25% TS and 25 (g/g) C/N ratios with the delignification process yield the best biogas production rate with 13,498.64-mL potential biogas that can be produced (A), a 419.38-mL/day biogas production rate (U), 23.09 days as the minimum time required to produce biogas (λ), and a resulting R2 value of 0.9961.

Author Contributions

Conceptualization, S.S. and B.J.; methodology, S.S., I.M., A.A.E.D., and B.J.; software, H.C. and I.M.; validation, S.S., B.J. and H.C.; formal analysis, S.S.; investigation, S.S., I.M. and A.A.E.D.; resources, S.S. and B.J.; data curation, S.S. and B.J.; writing-original draft preparation, S.S., I.M. and A.A.E.D.; writing-review and editing, S.S. and H.C.; visualization, S.S., I.M., A.A.E.D., and H.C.; supervision, S.S. and B.J.; project administration, S.S. and H.C.; funding acquisition, S.S. All authors have read and agreed to the published version of the manuscript.

Funding

This research was funded by the Faculty of Engineering, Universitas Diponegoro, through the Strategic Research 2020 Scheme, grant number 145/UN7.5.3.2/HK/2020.

Institutional Review Board Statement

Not applicable.

Informed Consent Statement

Not applicable.

Data Availability Statement

Data available on request from the authors.

Acknowledgments

The authors would like to thank the Faculty of Engineering, Universitas Diponegoro for the funding through the Strategic Research 2020 Scheme and the Department of Chemical Engineering, Faculty of Engineering, Universitas Diponegoro for allowing us to use their laboratory.

Conflicts of Interest

The authors declare no conflict of interest.

References

  1. Looney, B. BP Statistical Review of World Energy. BP Statistical Review, 70th ed.; London, UK, 2021; Available online: https://www.bp.com/content/dam/bp/business-sites/en/global/corporate/pdfs/energy-economics/statistical-review/bp-stats-review-2021-full-report.pdf (accessed on 28 June 2021).
  2. Adib, R. Renewables 2020 Global Status Report; Athens, Greece, 2020. Available online: https://www.ren21.net/wp-content/uploads/2019/05/gsr_2020_full_report_en.pdf (accessed on 28 June 2021).
  3. Hoogwijk, M.; Graus, W. Global Potential of Renewable Energy Sources: A Literature Assessment; Ecofys: Utrecht, The Netherlands, 2008. [Google Scholar]
  4. Sumardiono, S.; Budi Riyanta, A.; Hawali Abdul Matin, H.; Djoko Kusworo, T.; Jos, B. Budiyono Increasing biogas production from sugar cane baggase by anaerobic co-digestion with animal manure. In MATEC Web of Conferences; EDP Sciences: Les Ulis, France, 2017; Volume 101, p. 02014. [Google Scholar]
  5. Mézes, L.; Tamás, J.; Juhász, C.; Mátyás, B. Feather waste recycle for Biogas production. In Proceedings of the 2nd International Conference on Sustainable Solid Waste Management, Athen, Greece, 12–14 June 2014. [Google Scholar]
  6. Arifan, F.; Abdullah, A.; Sumardiono, S. Effect of Organic Waste Addition into Animal Manure on Biogas Production Using Anaerobic Digestion Method. Int. J. Renew. Eng. Dev. 2021, 10, 623–633. [Google Scholar] [CrossRef]
  7. Subramaniyam, R.; Vimala, R. Solid state and submerged fermentation for the production of bioactive substances: A comparative study. Int. J. Sci. Nat. 2012, 3, 480–486. [Google Scholar]
  8. Didanna, H.L. A critical review on feed value of coffee waste for livestock feeding. World J. Biol. Biol. Sci. 2014, 2, 72–86. [Google Scholar]
  9. Cheong, C.W.; Lee, Y.S.; Ahmad, S.A.; Ooi, P.T.; Phang, L.Y. Chicken feather valorization by thermal alkaline pretreatment followed by enzymatic hydrolysis for protein-rich hydrolysate production. Waste Manag. 2018, 79, 658–666. [Google Scholar] [CrossRef]
  10. Manan, M.A.; Webb, C. Design aspects of solid state fermentation as applied to microbial bioprocessing. J. Appl. Biotechnol. Bioeng. 2017, 4, 91. [Google Scholar]
  11. Dahunsi, S.O. Mechanical pretreatment of lignocelluloses for enhanced biogas production: Methane yield prediction from biomass structural components. Bioresour. Technol. 2019, 280, 18–26. [Google Scholar] [CrossRef] [Green Version]
  12. Kangle, K.M.; Kore, S.V.; Kore, V.S.; Kulkarni, G.S. Recent trends in anaerobic codigestion: A review. J. Environ. Res. Technol. 2012, 2, 210–219. [Google Scholar]
  13. Abunde Neba, F.; Asiedu, N.Y.; Addo, A.; Morken, J.; Østerhus, S.W.; Seidu, R. Simulation of two-dimensional attainable regions and its application to model digester structures for maximum stability of anaerobic treatment process. Water Res. 2019, 163, 114891. [Google Scholar] [CrossRef]
  14. Mulat, D.G.; Horn, S.J. Biogas production from lignin via anaerobic digestion. In Lignin Valorization: Emerging Approaches, 1st ed.; Royal Society of Chemistry: Chicago, IL, USA, 2018; pp. 391–412. [Google Scholar]
  15. Yu, Q.; Liu, R.; Li, K.; Ma, R. A review of crop straw pretreatment methods for biogas production by anaerobic digestion in China. Renew. Sustain. Eng. Rev. 2019, 107, 51–58. [Google Scholar] [CrossRef]
  16. Jos, B.; Hundagi, F.; Wisudawati, R.P.; Budiyono; Sumardiono, S. Study of C/N Ratio Effect on Biogas Production of Carica Solid Waste by SS-AD Method and LS-AD. In MATEC Web of Conferences; EDP Sciences: Les Ulis, France, 2018; Volume 156, p. 03055. [Google Scholar] [CrossRef] [Green Version]
  17. Sumardiono, S.; Pudjihastuti, I.; Budiyono; Hartanto, H.; Sophiana, I.C. Combination process method of lactic acid hydrolysis and hydrogen peroxide oxidation for cassava starch modification. AIP Conf. Proc. 2017, 1840, 060006. [Google Scholar] [CrossRef]
  18. Ilaboya, I.R.; Asekhame, F.F.; Ezugwu, M.O.; Erameh, A.A.; Omofuma, F.E. Studies on biogas generation from agricultural waste; analysis of the effects of alkaline on gas generation. World Appl. Sci. J. 2010, 9, 537–545. [Google Scholar]
  19. Sumardiono, S.; Pudjihastuti, I.; Jos, B.; Taufani, M.; Yahya, F. Modification of cassava starch using combination process lactic acid hydrolysis and microwave heating to increase coated peanut expansion quality. AIP Conf. Proc. 2017, 1840, 060005. [Google Scholar] [CrossRef]
  20. Rice, E.W.; Baird, R.B.; Eaton, A.D. Standard Methods for the Examination of Water and Wastewater, 23rd ed.; APHA-AWWA-WEF: Washington, DC, USA, 2017. [Google Scholar]
  21. Sumardiono, S.; Pudjihastuti, I.; Poerwoprajitno, A.R.; Suswadi, M.S. Physicochemical properties of analog rice from composite flour: Cassava, green bean and hanjeli. World Appl. Sci. J. 2014, 32, 1140–1146. [Google Scholar]
  22. Walkley, A.; Black, I.A. An Examination of The Degtjareff Method for Determining Soil Organic Matter, and A Proposed Modification of The Chromic Acid Titration Method. Soil Sci. 1934, 37, 29–38. [Google Scholar] [CrossRef]
  23. Sumardiono, S.; Adisukmo, G.; Hanif, M.; Budiyono, B.; Cahyono, H. Effects of Pretreatment and Ratio of Solid Sago Waste to Rumen on Biogas Production through Solid-State Anaerobic Digestion. Sustainability 2021, 13, 7491. [Google Scholar] [CrossRef]
  24. Saelor, S.; Kongjan, P.; O-Thong, S. Biogas Production from Anaerobic Co-digestion of Palm Oil Mill Effluent and Empty Fruit Bunches. Eng. Procedia 2017, 138, 717–722. [Google Scholar] [CrossRef]
  25. Meegoda, J.N.; Li, B.; Patel, K.; Wang, L.B. A review of the processes, parameters, and optimization of anaerobic digestion. Int. J. Environ. Res. Public Health 2018, 15, 2224. [Google Scholar] [CrossRef] [PubMed] [Green Version]
  26. Jos, B.; Farhan, H.; Ayu, N.D.; Budiyono; Sumardiono, S. Biogas Production from Palm Oil Fruit Bunch in Anaerobic Biodigester through Liquid State (LS-AD) and Solid State (SS-AD) Method. In MATEC Web of Conferences; EDP Sciences: Les Ulis, France, 2018; Volume 156, p. 03043. [Google Scholar]
  27. Prasetyo, T.; Sumardiono, S.; Aji, H.A.; Pratama, A.Y. Effect of C/N Ratio and pH on biogas production from industrial cassava starch wastewater through anaerobic process. Adv. Sci. Lett. 2017, 23, 5810–5814. [Google Scholar] [CrossRef]
  28. Mel, M.; Yong, A.S.H.; Avicenna; Ihsan, S.I.; Setyobudi, R.H. Simulation Study for Economic Analysis of Biogas Production from Agricultural Biomass. Energy Procedia 2015, 65, 204–214. [Google Scholar] [CrossRef] [Green Version]
  29. Taherzadeh, M.J.; Karimi, K. Pretreatment of Lignocellulosic Wastes to Improve Ethanol and Biogas Production: A Review. Int. J. Mol. Sci. 2008, 9, 1621–1651. [Google Scholar] [CrossRef] [Green Version]
  30. Saragih, F.N.A.; Priadi, C.R.; Adityosulindro, S.; Abdillah, A.; Islami, B.B. The effectiveness of anaerobic digestion process by thermal pre-treatment on food waste as a substrate. In IOP Conference Series: Earth and Environmental Science; Institute of Physics Publishing: Bristol, UK, 2019; Volume 251, p. 012014. [Google Scholar]
  31. Budiyono, B.; Manthia, F.; Amalin, N.; Matin, H.H.A.; Sumardiono, S. Production of Biogas from Organic Fruit Waste in Anaerobic Digester using Ruminant as the Inoculum. In MATEC Web of Conferences; EDP Sciences: Les Ulis, France, 2018; Volume 156, p. 03053. [Google Scholar]
  32. Rennuit, C.; Triolo, J.M.; Eriksen, S.; Jimenez, J.; Carrère, H.; Hafner, S.D. Comparison of pre- and inter-stage aerobic treatment of wastewater sludge: Effects on biogas production and COD removal. Bioresour. Technol. 2018, 247, 332–339. [Google Scholar] [CrossRef]
  33. Gao, S.; Hu, C.; Sun, S.; Xu, J.; Zhao, Y.; Zhang, H. Performance of piggery wastewater treatment and biogas upgrading by three microalgal cultivation technologies under different initial COD concentration. Energy 2018, 165, 360–369. [Google Scholar] [CrossRef]
  34. Ali Shah, F.; Mahmood, Q.; Maroof Shah, M.; Pervez, A.; Ahmad Asad, S. Microbial ecology of anaerobic digesters: The key players of anaerobiosis. Sci. World J. 2014, 2014, 183752. [Google Scholar] [CrossRef] [PubMed]
  35. Jha, A.K.; Li, J.; Nies, L.; Zhang, L. Research advances in dry anaerobic digestion process of solid organic wastes. Afr. J. Biotechnol. 2011, 10, 14242–14253. [Google Scholar]
  36. Tufaner, F.; Avşar, Y. Effects of co-substrate on biogas production from cattle manure: A review. Int. J. Environ. Sci. Technol. 2016, 13, 2303–2312. [Google Scholar] [CrossRef] [Green Version]
  37. Brown, D.; Li, Y. Solid state anaerobic co-digestion of yard waste and food waste for biogas production. Bioresour. Technol. 2013, 127, 275–280. [Google Scholar] [CrossRef]
  38. Bhattacharya, T.K.; Mishra, T.N. Biodegradability of dairy cattle manure under dry anaerobic fermentation process. J. Inst. Eng. Agric. Eng. Div. 2003, 84, 9–10. [Google Scholar]
  39. Fagbohungbe, M.O.; Onyeri, C.A.; Semple, K.T. Co-fermentation of whey permeates and cattle slurry using a partitioned up-flow anaerobic digestion tank. Energy 2019, 185, 567–572. [Google Scholar] [CrossRef]
  40. Xiao, Y.; Yang, H.; Yang, H.; Wang, H.; Zheng, D.; Liu, Y.; Pu, X.; Deng, L. Improved biogas production of dry anaerobic digestion of swine manure. Bioresour. Technol. 2019, 294, 122188. [Google Scholar] [CrossRef]
  41. Zeshan; Karthikeyan, O.P.; Visvanathan, C. Effect of C/N ratio and ammonia-N accumulation in a pilot-scale thermophilic dry anaerobic digester. Bioresour. Technol. 2012, 113, 294–302. [Google Scholar] [CrossRef]
  42. Dioha, I.J.; Ikeme, C.H.; Nafi’u, T.; Soba, N.I.; Yusuf, M.B.S. Effect of carbon to nitrogen ratio on biogas production. Int. Res. J. Nat. Sci. 2013, 1, 1–10. [Google Scholar]
  43. Wang, X.; Lu, X.; Li, F.; Yang, G. Effects of temperature and Carbon-Nitrogen (C/N) ratio on the performance of anaerobic co-digestion of dairy manure, chicken manure and rice straw: Focusing on ammonia inhibition. PLoS ONE 2014, 9, e97265. [Google Scholar] [CrossRef] [PubMed] [Green Version]
  44. Xu, J.; Wang, X.; Sun, S.; Zhao, Y.; Hu, C. Effects of influent C/N ratios and treatment technologies on integral biogas upgrading and pollutants removal from synthetic domestic sewage. Sci. Rep. 2017, 7, 1–13. [Google Scholar] [CrossRef] [Green Version]
  45. Kovács, E.; Wirth, R.; Maróti, G.; Bagi, Z.; Nagy, K.; Minárovits, J.; Rákhely, G.; Kovács, K.L. Augmented biogas production from protein-rich substrates and associated metagenomic changes. Bioresour. Technol. 2015, 178, 254–261. [Google Scholar] [CrossRef] [Green Version]
  46. Sukma, A.; Jos., B.; Sumardiono, S. Kinetic of biomass growth and protein formation on rice bran fermentation using Rhizopus oryzae. In MATEC Web of Conferences; EDP Sciences: Les Ulis, France, 2018; Volume 156, p. 01023. [Google Scholar]
  47. Sumardiono, S.; Mardiani, D.T. The effect of microwave power and heating time pretreatment on biogas production from fresh and dried water hyacinth (Eichhornia crassipes). AIP Conf. Proc. 2015, 1699, 050018. [Google Scholar]
  48. Weiland, P. Biogas production: Current state and perspectives. Appl. Microbiol. Biotechnol. 2010, 85, 849–860. [Google Scholar] [CrossRef]
  49. Abraham, A.; Mathew, A.K.; Park, H.; Choi, O.; Sindhu, R.; Parameswaran, B.; Pandey, A.; Park, J.H.; Sang, B.I. Pretreatment strategies for enhanced biogas production from lignocellulosic biomass. Bioresour. Technol. 2020, 301, 122725. [Google Scholar] [CrossRef]
  50. Jönsson, L.J.; Martín, C. Pretreatment of lignocellulose: Formation of inhibitory by-products and strategies for minimizing their effects. Bioresour. Technol. 2016, 199, 103–112. [Google Scholar] [CrossRef] [Green Version]
  51. Ajiboye, A.V.; Lasisi, K.H.; Babatola, J.O. Evaluation of the effect of sodium hydroxide solution on biogas yield of anaerobic digestion of poultry waste and the digestate. Int. J. Eng. Water Resour. 2018, 2, 23–31. [Google Scholar] [CrossRef]
  52. Singh, R.; Karki, A.B.; Nath Shrestha, J. Production of Biogas from Poultry Waste. J. Renew. Energy Smart Grid Technol. 2008, 3, 11–20. [Google Scholar]
  53. Wardhani, D.H.; Vázquez, J.A.; Ramdani, D.A.; Lutfiati, A.; Aryanti, N.; Cahyono, H. Enzymatic purification of glucomannan from amorphophallus oncophyllus using A-amylase. Biosci. J. 2019, 35, 277–288. [Google Scholar] [CrossRef]
  54. Ghatak, M.D.; Mahanta, P. Kinetic assessment of biogas production from lignocellulosic biomasses. Int. J. Eng. Adv. Technol. 2014, 3, 244–249. [Google Scholar]
  55. Vasmara, C.; Cianchetta, S.; Marchetti, R.; Ceotto, E.; Galletti, S. Potassium Hydroxyde Pre-Treatment Enhances Methane Yield from Giant Reed (Arundo donax L.). Energies 2021, 14, 630. [Google Scholar] [CrossRef]
  56. Budiyono, B.; Primaloka, A.D.; Ardhannari, A.; Matin, H.H.A.; Sumardiono, S. Study of Biogas Production from Cassava Industrial Waste by Anaerobic Process. In MATEC Web of Conferences; EDP Sciences: Les Ulis, France, 2018; Volume 156, p. 03052. [Google Scholar] [CrossRef] [Green Version]
  57. Gao, X.; Tang, X.; Zhao, K.; Balan, V.; Zhu, Q. Biogas Production from Anaerobic Co-Digestion of Spent Mushroom Substrate with Different Livestock Manure. Energies 2021, 14, 570. [Google Scholar] [CrossRef]
Figure 1. Scheme of the biogas production process.
Energies 14 04664 g001
Figure 2. Effect of different percentages of total solids (TS) on delignified C/N 25 (g/g) biogas chemical oxygen demand (COD).
Energies 14 04664 g002
Figure 3. Effect of different percentages of total solids (TS) on nondelignified C/N 25 (g/g) biogas chemical oxygen demand (COD).
Energies 14 04664 g003
Figure 4. Effect of different percentages of total solids (TS) on delignified C/N 25 (g/g) ratio biogas volume accumulation.
Energies 14 04664 g004
Figure 5. Effect of different percentages of total solids (TS) on nondelignified 25 (g/g) C/N ratio biogas volume accumulation.
Energies 14 04664 g005
Figure 6. Effect of different C/N ratios on the chemical oxygen demand (COD) reduction of 20% total solids (TS) biogas with delignification.
Energies 14 04664 g006
Figure 7. Effect of different C/N ratios on the chemical oxygen demand (COD) reduction of 20% total solids (TS) biogas non-delignification.
Energies 14 04664 g007
Figure 8. Effect of different C/N ratios on the accumulation of 25% total solids (TS) biogas with delignification.
Energies 14 04664 g008
Figure 9. Effect of different C/N ratios on the accumulation of 25% total solids (TS) biogas non-delignification.
Energies 14 04664 g009
Figure 10. Effect of different pretreatments on the chemical oxygen demand (COD) reduction of 25% total solids (TS) C/N 25 (g/g).
Energies 14 04664 g010
Figure 11. Effect of different pretreatments on the biogas production rate of 20% total solids (TS) C/N 25 (g/g).
Energies 14 04664 g011
Figure 12. Effect of different pretreatments on the biogas production of 20% total solids (TS) C/N 25 (g/g).
Energies 14 04664 g012
Figure 13. Comparison of actual vs. estimated volume with a content of 25% total solids (TS), 25 (g/g) C/N ratio, and delignification.
Energies 14 04664 g013
Table 1. Variable design.
No.%Total Solid (TS) *SolidChemical Pretreatment Ratio C/N (g/g)
10% **15%20%25%Coffee PulpChicken FeatherCow FecesDelignificationNon-DelignificationNaOH ***2530Urea
160 g 26.66 g13.33 g20 g v v 21.68 g
260 g 26.66 g13.33 g20 g v v7.88 g
360 g 26.66 g13.33 g20 g0.150 N 3.00 gv 21.68 g
460 g 26.66 g13.33 g20 g0.150 N 3.00 g v7.88 g
5 90 g 40.00 g20.00 g30 g v v 32.52 g
6 90 g 40.00 g20.00 g30 g v v11.82 g
7 90 g 40.00 g20.00 g30 g0.225 N 4.50 gv 32.52 g
8 90 g 40.00 g20.00 g30 g0.225 N 4.50 g v11.82 g
9 120 g 53.33 g26.66 g40 g v v 43.36 g
10 120 g 53.33 g26.66 g40 g v v15.77 g
11 120 g 53.33 g26.66 g40 g0.300 N 6.00 gv 43.36 g
12 120 g 53.33 g26.66 g40 g0.300 N 6.00 g v15.77 g
13 150 g66.66 g33.33 g50 g v v 54.20 g
14 150 g66.66 g33.33 g50 g v v19.71 g
15 150 g66.66 g33.33 g50 g0.375 N 7.50 gv 54.20 g
16 150 g66.66 g33.33 g50 g0.375 N 7.50 g v19.71 g
* Total solid: The total mixture consists of coffee pulps, chicken feathers and cow feces, ** %TS: g dry solid/600 mL water, *** NaOH: 5% TS (g/500 mL water).
Table 2. Comparison of kinetic modification using the Gompertz method.
VariableA (mL)U (mL/day)λ (day)R2
10% TS,
C/N 25 (g/g), and
Non-Delignification
7823.54300.2217.830.9689
10% TS,
C/N 30 (g/g), and
Non-Delignification
6608.13236.0719.030.9557
10% TS,
C/N 25 (g/g), and
Delignification
6448.21260.3816.820.9449
10% TS,
C/N 30 (g/g), and
Delignification
8575.42320.1718.270.9875
15% TS,
C/N 25 (g/g), and
Non-Delignification
7647.23294.7517.700.9559
15% TS,
C/N 30 (g/g), and
Non-Delignification
6696.53237.5919.540.9597
15% TS,
C/N 25 (g/g), and
Delignification
7238.49311.4020.500.9486
15% TS,
C/N 30 (g/g), and
Delignification
8967.90313.3319.480.9674
20% TS,
C/N 25 (g/g), and
Non-Delignification
7233.81256.8518.970.9640
20% TS,
C/N 30 (g/g), and
Non-Delignification
6422.22216.0619.940.9743
20% TS,
C/N 25 (g/g), and
Delignification
11,161.23367.7123.280.9941
20% TS,
C/N 30 (g/g), and
Delignification
6544.53272.0419.840.9622
25% TS,
C/N 25 (g/g), and
Non-Delignification
9640.50351.1120.380.9909
25% TS,
C/N 30 (g/g), and
Non-Delignification
10,610.15296.0724.330.9949
25% TS,
C/N 25 (g/g), and
Delignification
13,498.64419.3823.090.9961
25% TS,
C/N 30 (g/g), and
Delignification
9412.47281.0622.740.9668
TS, total solid; A, potential biogas production; U, maximum biogas production rate; λ, minimum time for biogas production; R2, the correlation coefficient.
Publisher’s Note: MDPI stays neutral with regard to jurisdictional claims in published maps and institutional affiliations.

