1. Introduction
Increasingly stringent vehicle emission regulations are putting considerable pressure on automotive engineers to generate innovative solutions to increase engine efficiency and reduce pre-catalyst engine emissions. It is well known that the primary sources of inefficiencies and pre-treatment emission production reside in the air–fuel mixing and combustion processes [
1,
2]. Reducing the uncertainty between real and approximated injected fuel temperature is fundamental for any combustion study, due to its influence on spray development and combustion characteristics [
3,
4,
5]. Increased fuel temperature causes shorter liquid and vapour penetration length [
6,
7,
8] and shorter ignition delay [
9], both parameters considerably affecting engine out emissions [
5]. The internal nozzle temperature also significantly influences the emerging jet through its relationship with the geometrically induced cavitation within the orifice channels [
10]. Higher fuel temperatures are conducive to increased CO
2 and un-burnt hydrocarbon (uHC) production, whilst decreasing NO
x emissions [
11]. Simulations by Payri et al. [
12] suggest that the temperature of the injected fuel is very similar to the temperature of the injector, and consequently, measuring the injector nozzle’s temperature could be a suitable proxy for estimating the fuel temperature.
The fuel and nozzle temperatures are also significant in regard to the transient fluid processes in the near-nozzle region, during and after the end of injection [
13]. When the inertia of the emerging jet subsides, fluid adheres and impinges onto the injector surface, creating fuel films that surround the orifices [
14]. The volume of deposited fuel is strongly dependent on the physical properties of the fuel (particularly surface tension and viscosity), which are in turn a function of the fuel temperature [
10,
15,
16]. The unavailability of high-speed fuel and nozzle temperature measurements also impedes the interpretation of phenomena such as the bubbling and evaporation of nozzle-bound films late in the cycle, which are known to be affected by the surrounding gas and surface temperatures [
17].
In addition to the effects these processes have on pre-catalyst engine pollutants [
18], fuel films contribute to the formation of detrimental injector deposits [
19,
20]. The accumulation of deposits in and around injector tips is associated with reduced engine performance and injector lifetime. This reduction in performance is known to manifest in a variety of ways, including increased acoustic and regulated emissions [
21,
22,
23]. The deposits can also reduce the hydraulic diameter of the nozzle orifices, resulting in a reduction in the quantity of injected fuel, and reduced quality and consistency of injection [
20,
23,
24], all of which cause a reduction in engine power [
25]. Several authors have found that when varying the fuel temperature, the deposit morphology significantly changed, as well as the frequency of their occurrence [
26,
27].
Numerous methods for measuring the nozzle surface and fuel temperature have been applied, yet all methods, including the thermography technique covered here, suffer from limitations. These challenges reside in the high acquisition rates required for the largely transient temperature profiles, the extreme conditions found within a reacting engine cylinder, and the complications imposed when accessing the injector nozzle surface, both optically and physically. One approach is to embed a thermocouple under the injector nozzle surface, positioning its probe as close to the orifices as possible [
17,
28,
29]. Nevertheless, the technique is considerably restricted to an acquisition rate lower than one reading per cycle [
26] due to the slow time constants of thermocouples. Furthermore, limitations arise from increased susceptibility to stress related failure after machining, which restricts the maximum injection pressure achievable or increases the risk of a catastrophic engine failure. Some institutions from the Engine Combustion Network compared thermocouple measurements in research spray vessels and found significant differences, possibly due to the probe’s position and contact [
30]. Kashdan et al. [
31] used Laser Induced Phosphorescence (LIP) to conduct crank angle resolved piston and nozzle tip temperature measurements, showing that LIP could not provide measurements during combustion due to the flame luminosity preventing the detection of phosphorescence. Furthermore, the acquisition through a photomultiplier limited the measurement to a 1 mm disc area, which was not enough to characterise the temperature profile across the nozzle surface. As a consequence of the aforementioned difficulties and limitations, the nozzle temperature is often approximated numerically [
12,
28], yet, due to the complexity of the in-cylinder environment, validation through experimental comparison remains a necessity.
Hence, the main motivation of this article is to identify an approach that can provide high-speed high spatial resolution measurements of nozzle tip temperature inside an engine under different motored and fired operating conditions. Thermography measurements were performed using a high-speed mid-wave infrared (IR) camera, in combination with a bow-ditch four-stroke optical diesel engine. A custom thermocouple instrumented injector was used to provide comparison and validation of the infrared measurements. The infrared optical configuration, after suitable calibration, offers significant advantages compared to other techniques through its high temporal and spatial resolutions [
32], combined with its non-intrusive nature and minimal requirements for modifying the surfaces. Limitations typical of infrared pyrometry techniques are identified and addressed, such as emissivity uncertainties/variations of the nozzle and films [
33], in addition to absorption effects of the in-cylinder gases [
27,
34] and optics.
This article is structured in four parts including this introduction.
Section 2 describes the optical configuration and engine test-bed,
Section 3 details the infrared calibration approach and validation, and
Section 4 discusses the effect of engine operating condition on nozzle tip temperature. A summary of the key findings is presented in conclusion.
2. Experimental Description
2.1. High-Speed Infrared Video System
The measurements were taken using a high-speed mid-wave infrared camera operating at the conditions shown in
Table 1. The infrared camera (Telops FAST M100
k) can be operated at frame rates from 116 Hz up to 120 kHz with exposures as short as 0.2 µs. All optical lenses and filters were custom-calibrated by the manufacturer from −20 °C up to 2500 °C to account for pixel by pixel non-uniformity in sensor irradiance, internal thermal conditions, and imperfections in the transmission properties of each optical component. For the reasons detailed in
Section 3.2, the calibration supplied by the manufacturer could not yield correct temperatures for this particular experiment, and a custom calibration approach had to be developed.
In this study a 50 mm lens (Janos Technology Asio) was equipped with a band-pass filter (Spectrogon BPP-3670-4020) to block wavelengths where flame emission and absorbance of water and CO
2 cannot be neglected (
Figure 1).
A natural limitation of infrared cameras and their ability to capture high temporal changes in temperature is the heat generated by the camera’s sensor, which contributes an additional noise radiation component. To avoid this, and facilitate high-speed short exposure recordings, the camera used in this research was equipped with a cryocooler to significantly improve signal to noise ratios. This noise reduction is demonstrated in the Noise Equivalent Temperature Difference (NETD), which in the case of the camera used in this study was measured as 14.2 mK.
To further increase image accuracy, a non-uniformity correction (NUC) was applied after the recordings to compensate for radiation produced from the system’s optics. This built-in correction was applied on a pixel by pixel basis, accounting for combinations of the lenses and optical filters.
2.2. Optical Engine and Fuel System
The investigation was conducted using a single-cylinder 4-stroke optical diesel engine (Ricardo Hydra) shown in
Figure 2. It was converted from a 4-cylinder production PUMA engine with a compression ratio of 16:1. The 86 mm bore and stroke direct injection (DI) engine used an external compressor for forced induction, in conjunction with critical flow venturi nozzles to maintain a constant intake air flow rate. By varying the inlet mass flow the peak motored pressure was varied between 4 MPa and 6 MPa. A heating plenum upstream of the intake manifold provided independent control of the air temperature up to 100 °C to replicate realistic peak in-cylinder temperatures. The in-cylinder air motion was controlled by a swirl valve integrated into the intake manifold that split the airflow between the two intake valves at a variable ratio. By creating a radial imbalance in the airflow entering the cylinder, the swirl could be varied between a ratio of 1.38 and 4.12 (where the ratio is described as the average rotational velocity of the charge free vortex, divided by the the charge vortex as a rigid body rotating on its own axis [
35,
36]).
Coolant was pumped around a water jacket encasing the cylinder and flowed through the head via pressurised ducts. Since the engine was never continuously fired for sustained periods, the primary purpose of the coolant system was to heat the engine. To investigate the influence of the coolant temperature on the nozzle, the temperature was varied between a low point of 60 °C and a high point of 90 °C. The crank was rotated at 1000 rpm, representative of idling conditions, using a 30 kW dynamometer. Several engine operating parameters were varied during the investigation and are given in
Table 2.
The test bed was instrumented with temperature and pressure sensors throughout the air, oil, coolant and fuel systems, as well as an optical encoder with a resolution of 0.5° Crank Angle (CA) degrees. A piezoelectric pressure sensor (Kistler 6125C) provided high-speed data acquisition of the in-cylinder pressure sampled at a rate of two readings per crank angle. The test bed and fuel injection system were controlled via a purpose-built LabVIEW interface, which also provided full low-speed and high-speed data logging.
A single component fuel (n-dodecane) was used to provide known and controlled fluid properties [
37], and a certified reference fuel (CEC RF-79-07) was used as a pure diesel without additives or biodiesel blending. Fuel delivery was performed by a diesel common rail system composed of a 2 µm filter, high-pressure pump rated at 160 MPa (Bosch CP1H), two pressure sensors (Kistler 4067E on the injector feed; Bosch 51HP02-02 on the rail) and a vacuum venturi used to achieve appropriate depression on the injector return line. During engine operation, a skip fire strategy (shown in
Table 2) was used to limit the quantity of combustion by-products produced and reduce amount of fouling on the optical surfaces.
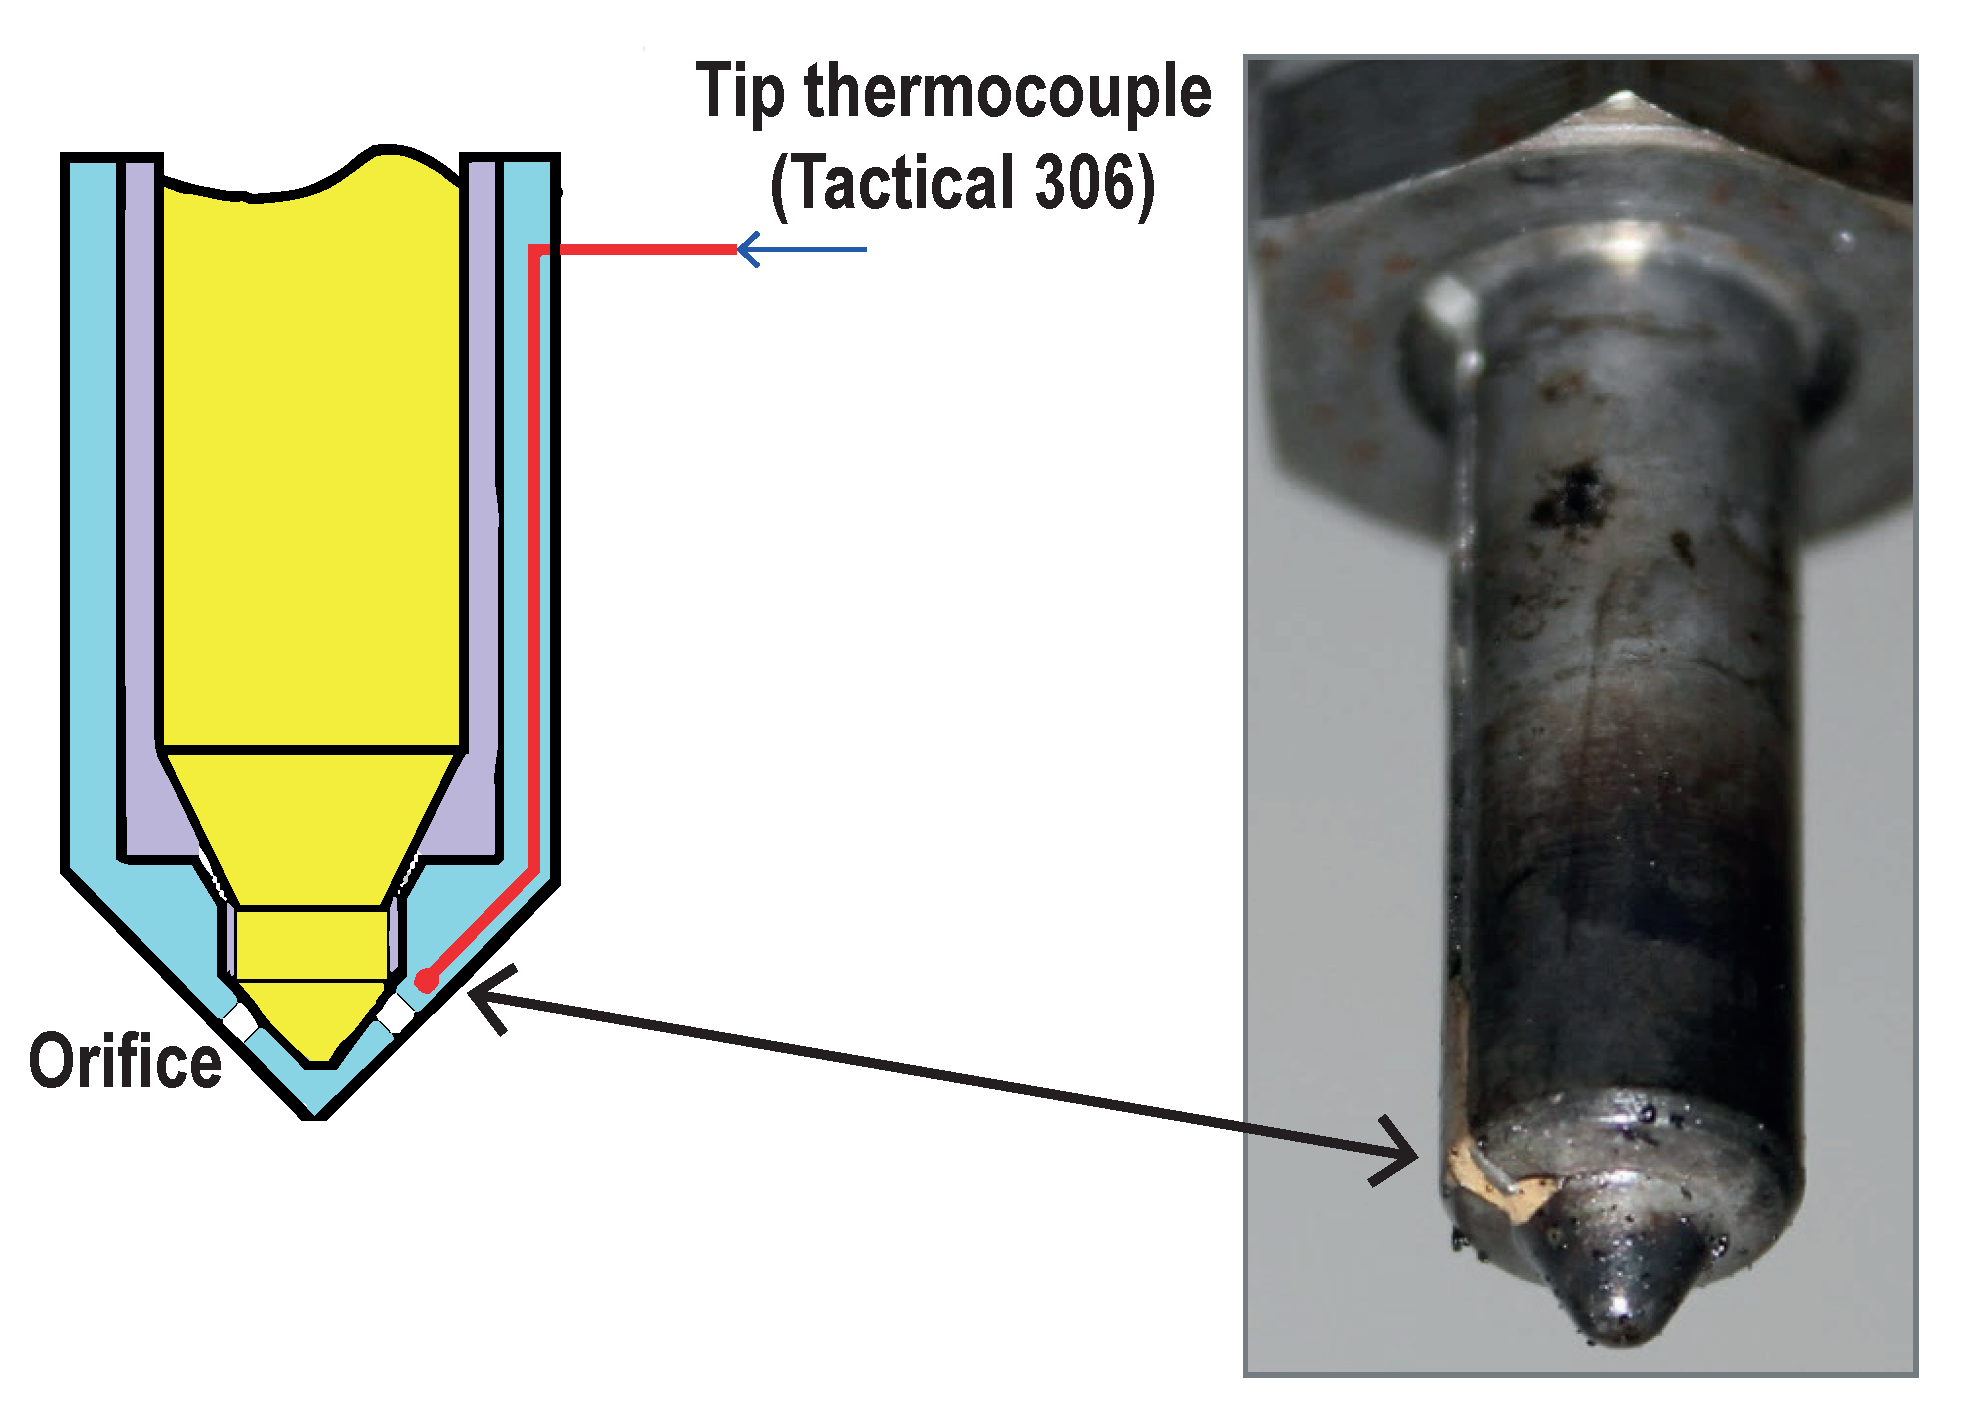
Two production injectors were utilised for the investigation, both were 7-hole Delphi DFI 1.3 injectors with VCO nozzle and 135 µm orifices. The only difference between them being that one was instrumented with a thermocouple embedded next to a nozzle orifice, as shown in
Figure 3. The thermocouple instrumented injector was used to compare time-averaged nozzle temperatures with the infrared thermography data. Machining of instrumented nozzles, required when embedding thermocouples, increases their susceptibility to failure from internal stresses. Hence, the instrumented nozzles are limited to reduced peak injection pressures, in this case, 40 MPa. Injection pressures above 40 MPa were tested using the non-instrumented production injector.
The optical engine design consisted of a sapphire bowl (68 mm diameter, 33 mm thickness) mounted onto an extended piston, permitting the placement of a stationary, silver coated mirror. The mirror was mounted at 45° to the cylinder, thereby reflecting the radiation emitted by the injector tip into the horizontal plane, subsequently captured by the infrared camera. One of the challenges posed by infrared thermography of internal engine components is the wide range of temperatures, which necessitates a wide acquisition dynamic range. To further minimise saturation at the peak cycle temperatures, and ensure sufficient radiation was acquired at the ‘cooler’ parts of the cycle, the exposure time was regularly adjusted between test-points (from 100 µs to 600 µs). The set-up enabled visualisation of the entire nozzle surface with a scale factor of 88.75 µm/pixel, which was sufficient to resolve the injector orifices and detailed structure of the nozzle tips.
3. Converting Infrared Radiation to Nozzle Surface Temperature
Infrared thermography is based on the fundamental principle that all objects emit non-visible light from the infrared spectra [
38]. According to Stefan–Boltzmann’s law, the power emitted per unit area is directly related to the temperature of the object, depending on the emissivity of the surface, with the Stefan–Boltzmann constant being the proportionality factor that relates the energy flux (heat radiation per unit area and time) to thermodynamic temperature [
38,
39]. Moreover, Planck’s law states that an object’s spectral radiance is a direct relation of power output per steradian per unit area (W/sr/m
2) [
38]. Thus, combining these laws, the temperature of a surface at a given wavelength can be derived from the spectral radiance (
L) of a body using Planck’s equation (Equation (
1)), where
h is Planck’s constant,
k is Boltzmann’s constant,
c is the speed of light,
is the wave frequency, and
T is temperature.
3.1. Accounting for Surface Emissivity and Gas Absorption
To ensure satisfactory reliability of the static calibration process, it was essential to remove any factors that varied during engine operation prior to calibration. The degree of radiation emitted from an object is a function of its emissivity and temperature. Kirschoff stated that emissivity is equal to absorptivity, which are equal to 1-reflectivity; thus, a good emitter is a poor reflector. Hence the emissivity and reflectivity of the imaged surfaces have a profound effect when converting the irradiance measured by the infrared camera (the radiometric temperature) into an actual surface temperature. As a new diesel nozzle is composed of buffed stainless steel with an emissivity of approximately 0.16 [
40], the majority of the radiation from its surface is in fact reflected from the other in-cylinder components. The reflected radiation cannot be decoupled numerically since it varies with the temperature and positions of the surrounding components; thus, the nozzle’s temperature cannot be accurately measured by thermal imaging when new.
In order to improve the emissivity of the injector nozzle, we coated it with carbonaceous soot to obtain an emissivity of approximately 0.95 [
41]. The soot was applied by rotating the nozzle at the bottom of a propane flame to produce a thin, repeatable, homogeneous and controlled coating, while still being representative of the sooted condition normally found inside diesel engines (
Figure 4). As discussed in [
37], the nozzle surface is significantly wetted by fuel during operation, which was initially expected to remove the thin soot coating. The nozzle was monitored to ascertain the impact that the surface wetting, high in-cylinder gas velocities and thermal expansion/contraction had on the coating. Despite some of the top layer being immediately removed, the surface-bound layer showed strong adhesion and did not change after prolonged operation. The nozzle sooting was also compared against sooting through repeated combustions and showed analogous behaviour in terms of the near-nozzle/surface-bound fluid dynamics.
The detected radiation is also dependent on the composition and physical properties of the gas between between the object and sensor. The majority of substances found in the in-cylinder charge have negligible infrared absorption; however, CO
2 and H
2O are significant absorbers, especially under the densities reached near Top Dead Centre (TDC). In addition to the CO
2 and H
2O entering the cylinder with the intake gas, a considerable quantity is produced through the combustion reactions. To remove the impact of their wavelength-dependent absorption on the measured irradiance, a band-pass filter was used (Spectrogon BPP-3670-4020) to limit the measurement to the range 3.67–4.02 µm (
Figure 1). This band is also far away from the flame radiant energy peaks at 4.4 µm [
34].
3.2. Camera Calibration
The radiation (within the chosen bandwidth) directed towards the camera excites electrons in the photoelectric absorbers that form the detector. An electric signal is generated and a Digital Level (DL) is obtained for the corresponding pixel, ultimately forming an image. Several post-processing techniques may then be applied to improve the accuracy of the raw signal, for instance bad pixel replacement functions [
42]. Software-based non-uniformity correction (NUC) corrected the non-uniform distribution of radiation being absorbed across the sensor due to the camera optics, which is discussed in
Section 3.3. Finally, a calibration method was implemented to convert the DL into an actual temperature (normally achieved using a blackbody) [
43].
The calibration blocks provided by the camera manufacturer are produced under near-ideal conditions with a free optical path between the camera’s sensor and a blackbody (
). In the case of the investigation presented in this study, the ideal scenario is not achievable due to the confined space and the components required to gain optical access into the engine. A silver-coated mirror and sapphire (
) piston bowl were used to gain optical access to the engine’s combustion chamber (
Figure 2). These components introduced wavelength-dependent extinction in the amount of infrared light transmitted between the region of interest and the camera’s sensor, which must be accounted for in the calibration. Further to this, as discussed in
Section 3 the injector nozzle tip was sooted to increase the emissivity and, therefore, the intensity of the emitted radiation, further increasing accuracy.
A dummy injector tip was built from a production DFI 1.3 nozzle, heated using a PID-controlled cartridge heater and instrumented with an thermocouple inside the nozzle to measuring its temperature (
Figure 5). The injector’s needle was removed and replaced with an aluminium insert protruding into the nozzle with thermal paste to increase the thermal conductivity between the heater, thermocouple and nozzle tip. A slot for the thermocouple passed through the insert, positioning the thermocouple in contact with the inner tip of the nozzle and a pocket in the insert was made to fit the heater cartridge. The components were held by a sleeve and wrapped in insulation with a Teflon ring at the nozzle base. The insulating material limited heat losses to the surrounding metal when placed inside the engine head.
To generate the in-engine temperature calibration curves (
Figure 6) the optical engine was set to heat up to its normal operating temperature, which is defined by the coolant temperature, nominally set between 85 °C and 90 °C. The purpose of heating the engine was to ensure the calibration generated would factor in the conduction and cooling effects generated by the cylinder head. These steps also ensured that any transmission losses due to hot in-cylinder gasses and imperfections in the clean optical surfaces were accounted for, as discussed previously.
Once the optical engine was thermally stable, the dummy injector nozzle shown in
Figure 5 was slowly ramped in temperature over two hours (2 K/min), reaching a stable maximum temperature of around 545 K. While the dummy nozzle was heating, the camera was continuously recording at 1 Hz with automatic exposure control to best match the sensor’s target well filling (well filling is the value given to the amount of photons stored in an individual pixel of a camera sensor, with the optimal percentage of filling for this camera being at 60%). The distance between the inner thermocouple and the outer nozzle surface was sufficiently small, and the thermal conductivity of steel sufficiently high, for the temperature difference to be consistently smaller than 1 K. These measurements were made twice, both with and without the bandpass filter.
Although the radiation emitted from the nozzle surface was homogeneous when processing the calibration video frames, a Region Of Interest (ROI) was taken, and the DL was averaged for all the pixels within that ROI (
Figure 7). The ROI, chosen to cover the surface 30° to the nozzle axis (incorporating all nozzle orifices), was applied with the assumption that the nozzle was concentric to the frame and using engineering drawings of the nozzle in conjunction with the known scale factor. The location of the ROI was plotted using data masking functions to only process the data inside the ROI. This ensured that the surface temperatures reported in this article were restricted to the nozzle tip region immediately around the nozzle orifices. This is because that region of the nozzle is the most relevant to the research on fuel sprays and deposits and also to ensure a fair comparison with the time-averaged temperatures measured by our instrumented injector (which had its thermocouple embedded within this region).
The average DL from the ROI was divided by the exposure time to obtain a normalised DL value, directly related to the radiometric temperature. The calibration ROI’s DL/µs values are plotted against their corresponding thermocouple values in
Figure 6. The relationship resembles an exponential shape, in agreement with [
44]. One limitation of our approach is the relatively low peak temperature of the calibration (545 K) when compared to combustion temperatures, which implies that the calibration needs to be extrapolated when operating under fired engine conditions. As our study was performed under idle/low load, only a small number of data points required extrapolating the calibration beyond 545 K.
3.3. Converting Infrared Videos into Crank Angle Resolved Temperatures
The data were captured using the manufacturer’s acquisition software package (Telops RevealIR) using the settings specified in
Table 1. Data were collected and analysed using the processing methodology described in
Figure 8. The video sequences were recorded in a raw video format that captured the radiance from the scene. The raw pixel data were corrected for the non-uniform distribution of radiation being absorbed by the sensor to enable accurate analysis. Once the NUC profile has been applied to the raw data, attention must be turned to the sensor exposure time applied during the sequence recording. As with other videography methods, sensor exposure time allows the regulation of number of photons that are absorbed by the sensor. Overexposed images provide little to no detail due to individual pixels being saturated. In the opposite case, underexposed images will suffer more significantly from the noise which is inherent to the sensor. This general theory can be applied to the method presented in essentially the same way, except rather than producing a bright photograph or video, the resultant temperature measurement will be clipped to the maximum DL reachable at the selected exposure time, or it will have a systematic error due to the noise of the sensor taking up a greater percentage of the DL range.
With the pixel data formatted correctly for the calibration to be applied, the data are cropped to the target area, demonstrated in
Figure 7. This ROI (defined in
Figure 6) is needed due to the location of the thermocouple embedded below the surface for which the measurements are evaluated against.
Once the data are cropped to the user-defined ROI, as shown in
Figure 8, the calibration can be applied. The calibration was developed to account for the non-ideal emissivity of the injector nozzle surface as well as the transmission losses through the optical piston and mirror shown in
Figure 2. The calibration is applied to each sequence frame by frame, with the result being temperature values for each pixel of each frame.
Depending on the frame exposure some pixels could occasionally become saturated. This was mostly apparent during combusting cycles; however, in some instances, an extended sensor exposure time could lead to pixels becoming saturated in ‘cooler’ motored test points. In either case, frames containing saturated pixels were omitted entirely from the processing to avoid erroneous results.
After the calibration was applied, each frame was taken individually and the arithmetic mean was computed with the result stored into a temperature vector. These mean temperature measurements were then plotted with respect to engine crank angle to produce crank resolved temperature plots. In order to compare the infrared-based temperatures with the instrumented injector, the ensemble-average of the infrared temperature vector was computed to produce the mean nozzle temperature of that video recording, as shown in
Figure 8. The time-averaged infrared temperature was then plotted along with the instrumented injector’s reading to evaluate the validity of the method.
3.4. Methodology Validation and Uncertainties
Figure 9 shows the temperature comparison between the thermocouple instrumented injector and time-averaged infrared video measurements, under steady state static (black dots) or motored (red dots) conditions, and clean (open symbols) or fouled optics (closed symbols). The ideal error-free correlation is shown as a solid black line, with most measurements falling below it. This bias indicates that the infrared temperature measurements underestimate the actual surface temperature measured by the thermocouple.
The consistently lower temperature measurements can be explained when comparing measurements under ideal and non-ideal conditions. The calibration was recorded during static operation of the optical engine to account for transmission and reflectivity losses from the mirror and piston optics, which were cleaned. Those ‘clean’ conditions (open circles in
Figure 9) confirm that the calibration using a dummy injector was appropriate, and yields temperatures within
K of the instrumented injector.
However, under the motored cases (red dots in
Figure 9) that followed fired test conditions the infrared temperatures were consistently lower than the thermocouple readings. This bias can be attributed to small quantities of fuel, engine oil and combustion by-products remaining on the optical surfaces, thus reducing the transmissivity of the piston bowl. Thus, optical fouling is a systematic error that will always result in an artificially lower apparent temperature. Although this error will vary depending on the severity of the fouling, which will be related to the engine’s operating conditions, in our tests this never exceeded 20 K.
Other causes of increased uncertainty are insufficient levels of well filling on the sensor, which leads to an underexposed image leading to the natural noise of the sensor to have an increased effect on the overall signal to noise ratio. This effect is discussed at greater length in
Section 3.3. From this analysis, we can conclude that the overall uncertainty of our infrared-based in-engine surface temperature measurements is asymmetric and can be estimated as
K.
Figure 10 shows the comparison of the thermocouple-based temperatures against instantaneous and video-averaged infrared-based temperatures for both motored and fired test conditions. In both cases, the two temperatures are found to agree within 4 K, thus suggesting that the implementation and calibration of the infrared thermography is satisfactory.
4. The Impact of Operating Conditions on Nozzle Tip Temperature
In order to ascertain if our calibrated high-speed thermography technique would be sensitive enough to resolve small changes in injector nozzle tip temperature, we tested this approach through small changes in engine operating conditions.
Firstly, we increased the intake air temperature by 7 K (from 318 K to 325 K) during motored operation, while ensuring all other engine parameters were unchanged.
Figure 11 shows that during the first half of the induction stroke (−360° CA to −270° CA) the nozzle temperature reduces slightly (by approximately 2 K), which is expected due to the cooler intake air. During the second half of the induction stroke (−270° CA to −180° CA) the nozzle temperature was found to recover and increase again, even though colder intake air was still being induced into the cylinder. This can be explained by the continued retraction of the piston that provides a progressively increasing in-cylinder wall surface area for heat transfer, combined with the progressive increase in flow velocity and swirl [
45], which contribute to increasing the turbulent kinetic energy of the gas.
At the beginning of the compression stroke (−180° CA aTDC) the difference in nozzle tip temperature (dT = 5.5 K) almost matches the difference in intake air temperature between the two test conditions (7 K). This indicates that the high-speed infrared thermometry is able to detect such small relative differences in operating conditions. As anticipated, increasing the intake gas temperature independently of other engine parameters yields a comparable increase in nozzle surface temperature prior to compression. During the second half of the compression stroke, the convective heat transfer at the nozzle tip increases due to both a significant temperature difference between the nozzle tip and the in-cylinder charge, and the increased flow velocity (as confirmed by PIV data for this test bed, and in the literature [
45]). The difference in temperature between the two test conditions reaches a maxima of 8.5 K shortly before TDC.
The beginning of the motored expansion stroke (0° CA to 30° CA aTDC) shows that the effect of the difference in gas intake temperature is least apparent at TDC and during the expansion stroke, where dT reaches 4 K–5 K. This is consistent with the sudden reduction in swirl and flow turbulence found shortly after reaching top dead centre [
45], which drives a reduction in convective heat transfer and reduces the temperature difference between the two test cases.
During the end of expansion and beginning of the exhaust stroke (60° CA to 210° CA aTDC), the nozzle temperature reaches a quasi-thermal equilibrium state. This can be attributed to the test conditions being motored, which results in an homogeneous in-cylinder gas temperature field once the charge has been mixed.
Increasing the intake air pressure while maintaining all other operating parameters unchanged leads to increased in-cylinder gas temperatures. To investigate if these changes could be resolved by the high-speed infrared thermography we measured the nozzle tip temperature under non-fired conditions, with peak motored ICPs of 4 MPa, 5 MPa and 6 MPa (
Figure 12). As for the intake air discussion above, disabling the fuel injection allowed us to obtain a more controlled environment for studying the sensitivity of our approach when measuring nozzle temperature, while being representative of engine overrun conditions.
The relationship between ICP and nozzle tip temperature is consistent with expectations, with surface temperatures increasing between the 4 MPa, 5 MPa and 6 MPa test cases. More interestingly, as the ICP increases the transient reversal in nozzle tip temperature at TDC becomes more abrupt. This indicates that peak temperature is retained for less time at high pressures. The impact of combustion is shown in
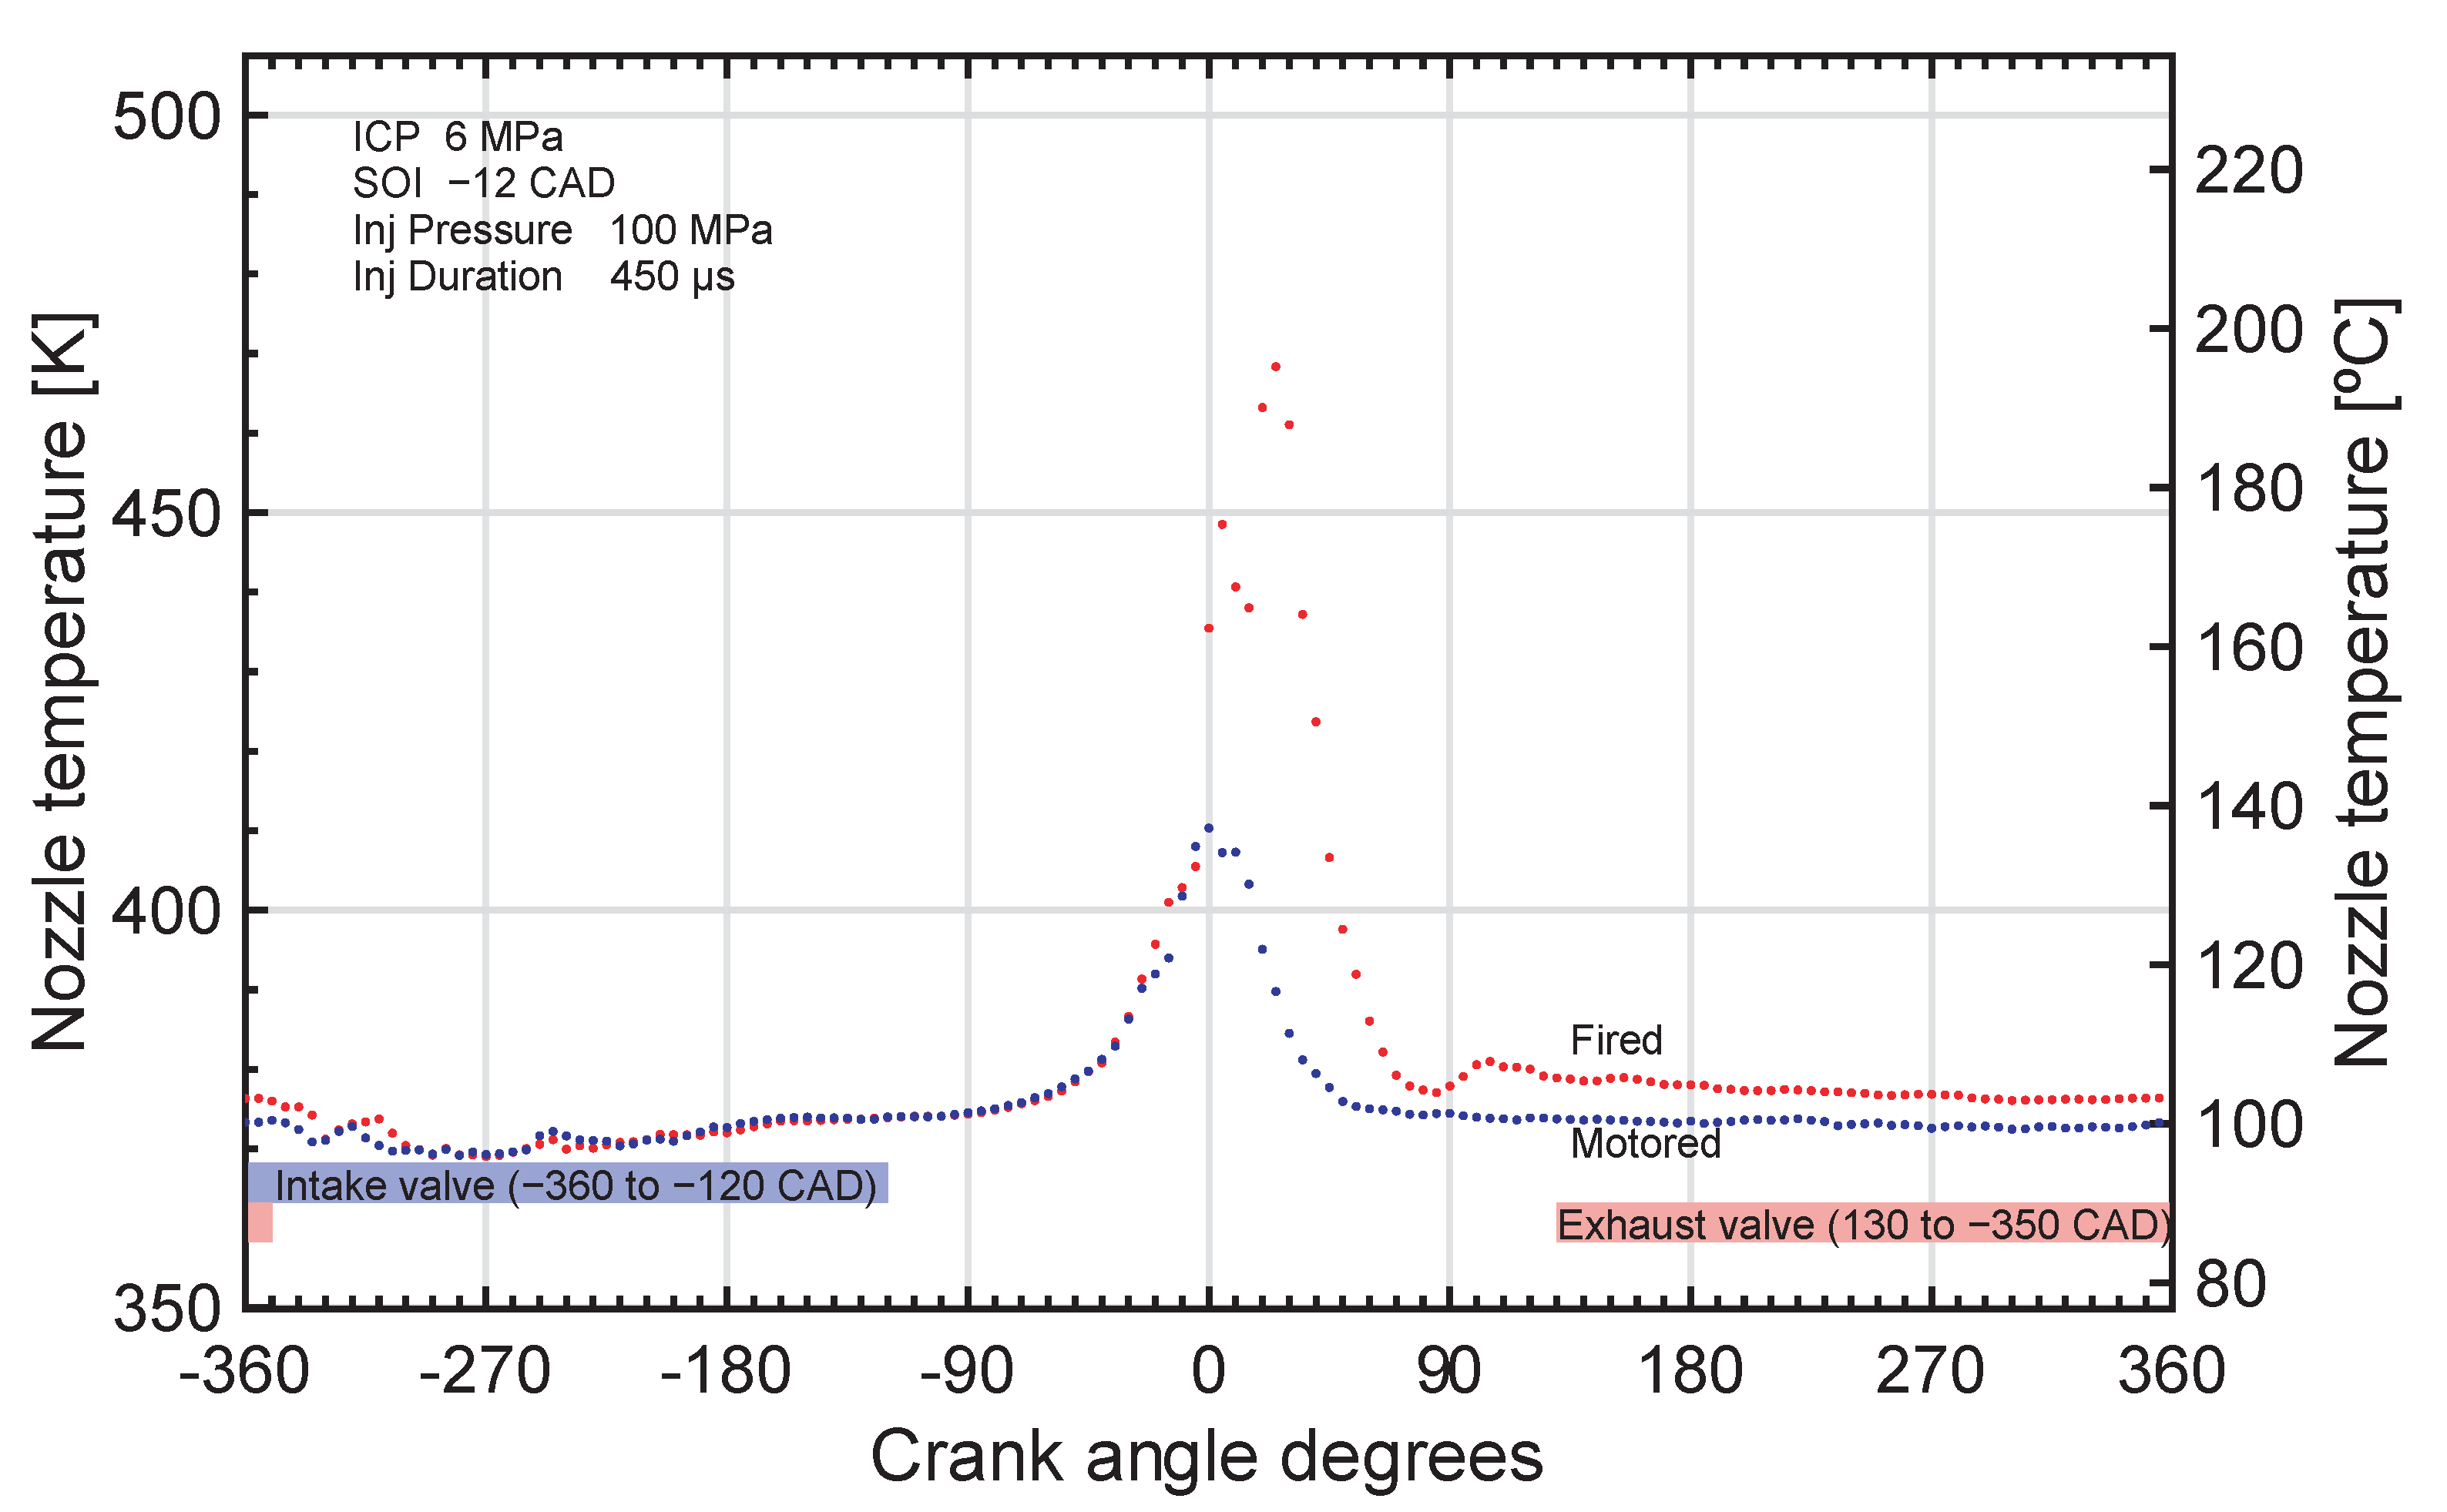
Figure 13, where the evolution of nozzle tip temperature is shown for both motored and fired cycles. When compared to motored conditions, the injection of n-dodecane and its subsequent combustion resulted in a significant increase in nozzle tip temperature, as expected. A temperature increase remains during the expansion and exhaust strokes. This temperature increase can also be seen to be carried over to the subsequent cycles in
Figure 10, where the peak motored TDC temperatures immediately following a combustion event (at 1440° CA on
Figure 10) is 15 K higher than the prior motored cycle (0° CA on
Figure 10).
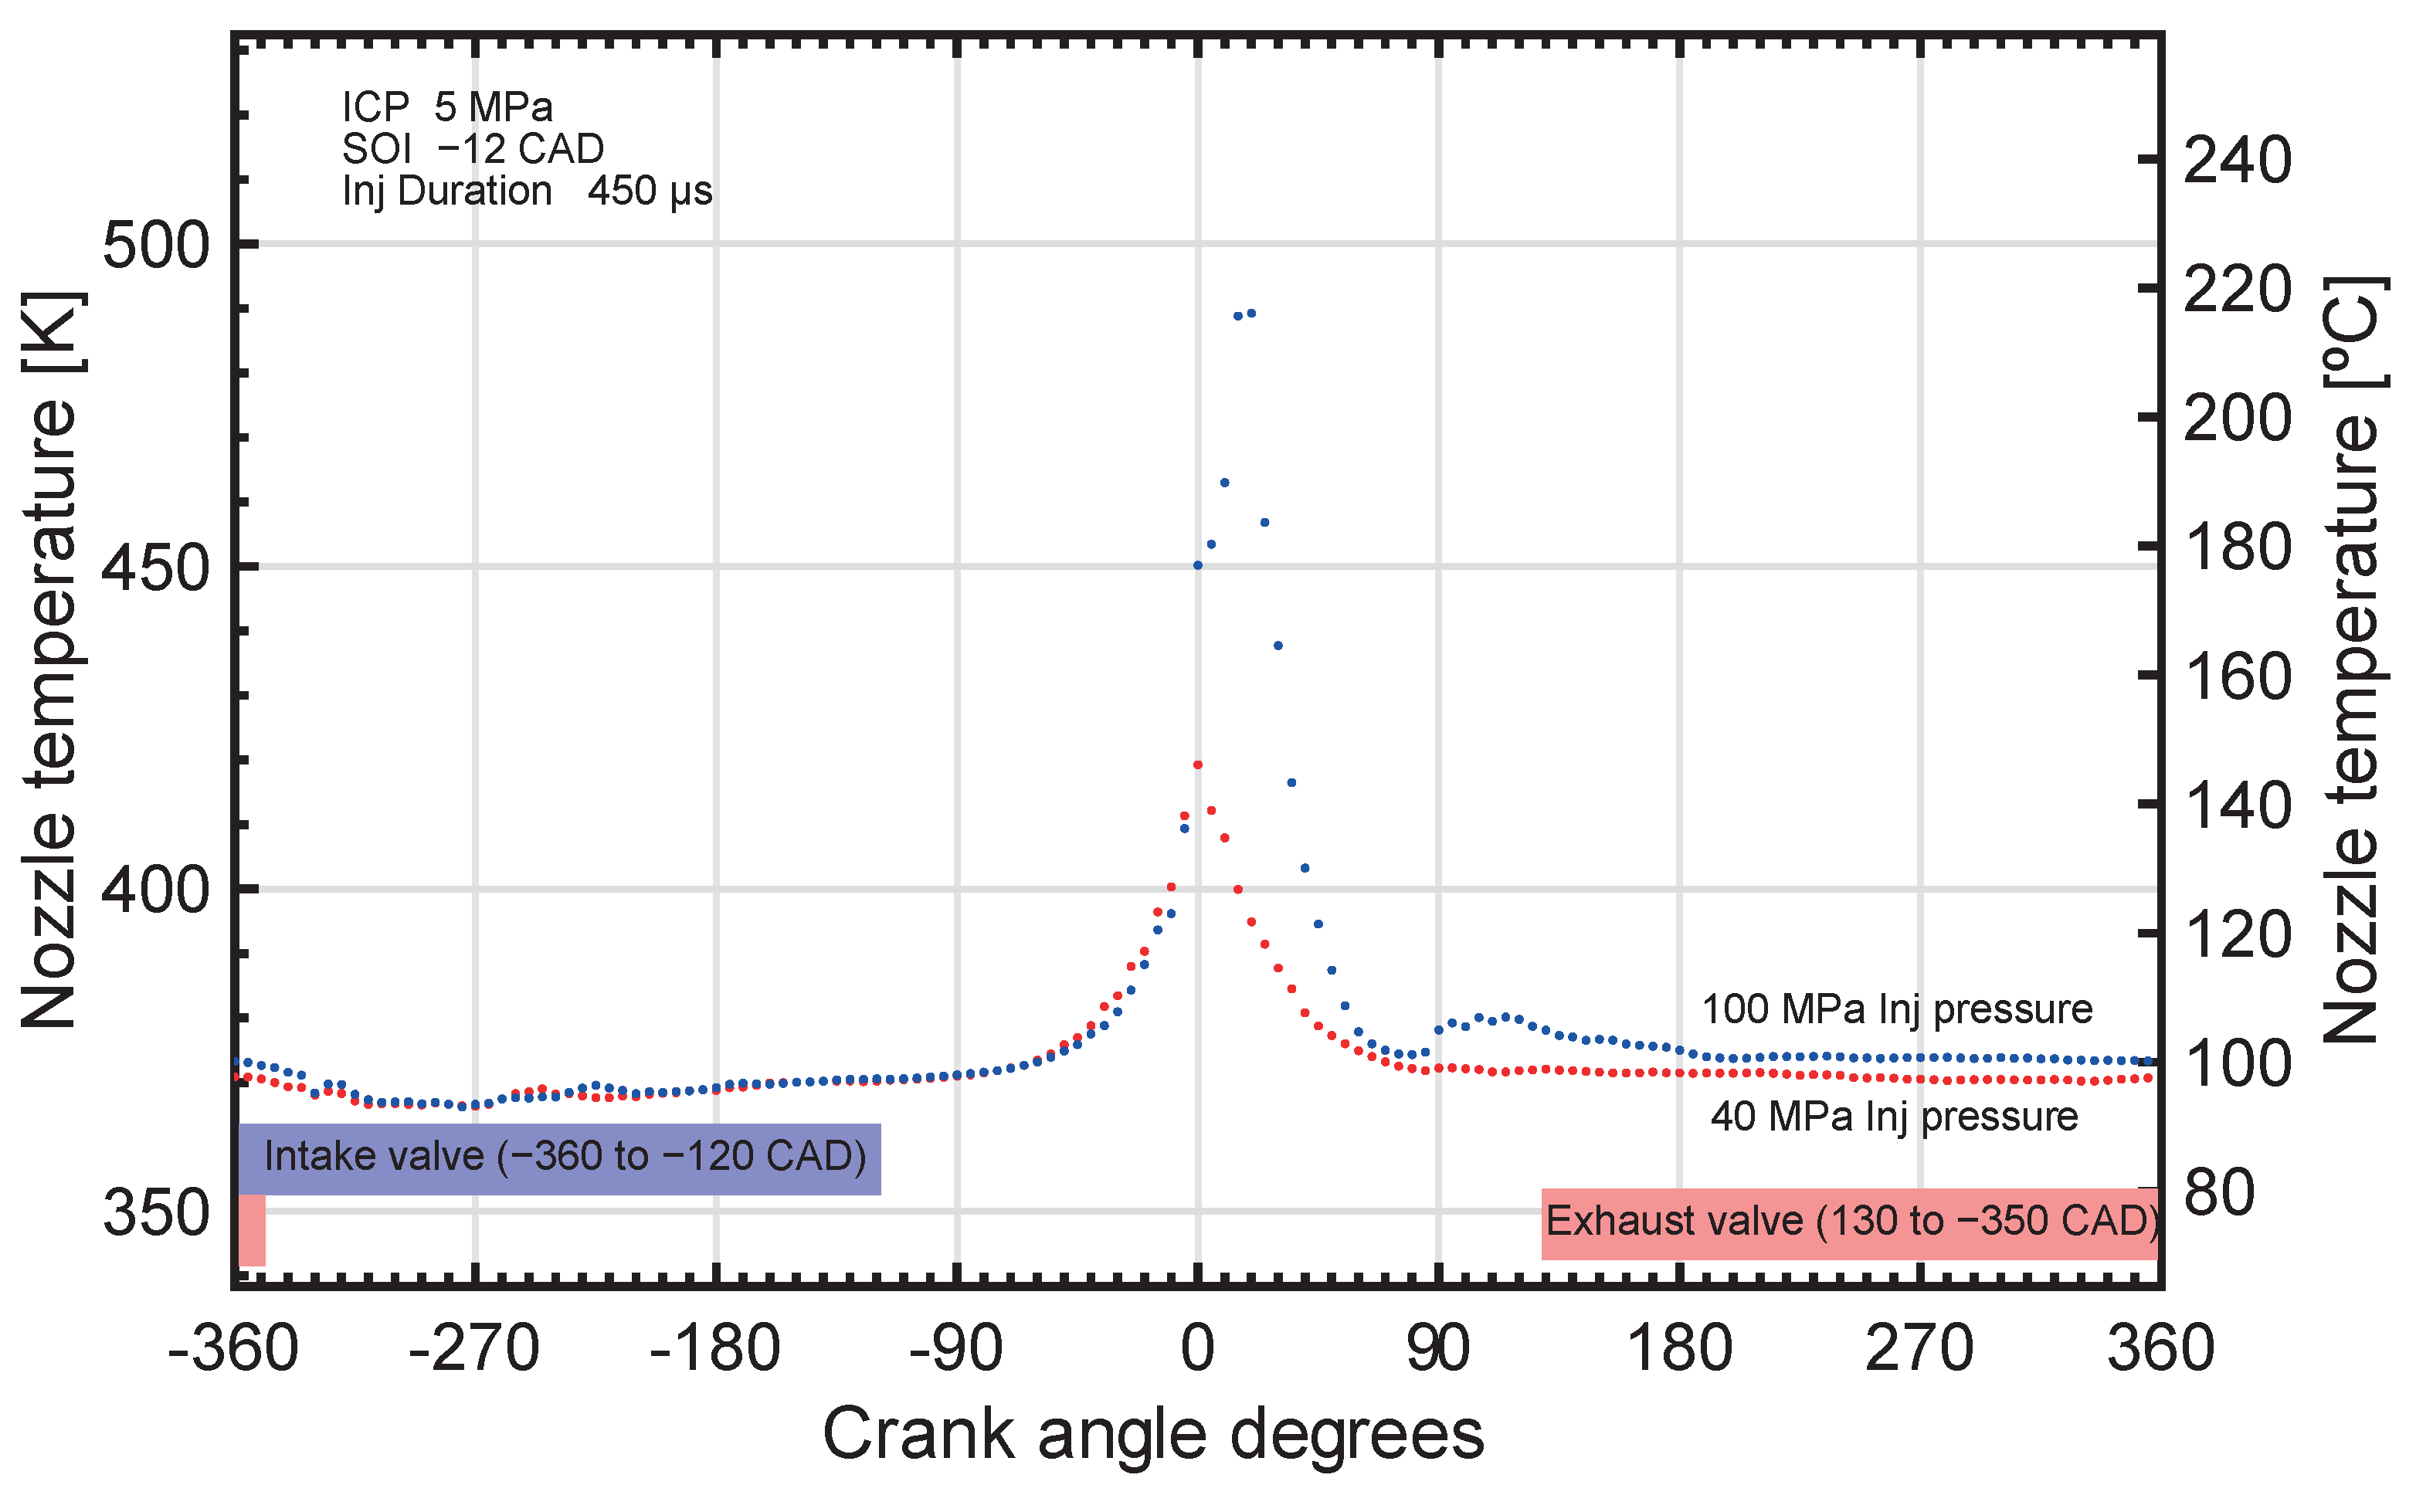
The test conditions shown in
Figure 14 are representative of a change from idle to low/medium load operating conditions, thus relating to the acceleration of a vehicle from stationary position. As expected, higher injection pressure (and thus larger injected mass as the pulse duration was kept constant) resulted in a hotter nozzle tip temperature.
Figure 15 shows a comparison between frames captured using high-speed microscopy and high-speed infrared imaging during injection and combustion. Although no emissivity data could be obtained for the multi-component diesel used in this test point (CEC RF-79-07), data available for other liquids and fuels such as decane show that emissivities are in the order of 0.65 within the measured spectral bandwidth [
46]. We can also note that the emissivity of fluids is increases with their density and so we can expect the emissivity of our reference diesel fuel (CEC RF-79-07, density: 833.8 kg/m
3) to be higher than 0.65 (decane, density: 750 kg/m
3). These estimates indicate that the radiometric fuel spray temperatures measured in
Figure 15 should be representative of the actual fuel spray temperatures until ignition occurs. After ignition, the reflection of flame luminosity by the liquid fuel can no longer be neglected. The test point shown here is not affected by combustion reflection as ignition did not occur until −4° CA (as observed from high-speed in-cylinder pressure measurements).
The thermal images in
Figure 15 indicate that there is no evidence of a significant instantaneous cooling of the nozzle by the fuel injection. This is apparent shortly after the start of injection at −13° CA where the fuel spray and nozzle have similar temperatures. There is also no evidence that the temperature of the residual liquid films seen on the microscopy frame at −3° CA can be resolved with the infrared imaging. The frames recorded at 2° and 7° CA show significant density gradients from the combustion disrupting the image formation for both the optical and infrared videos.
5. Conclusions
In this study, a methodology using high-speed infrared video in an optical engine was proposed to obtain crank angle resolved nozzle tip temperature measurements. The uncertainties of the measurement are dependant on the clean-running and operation of the engine to minimise fouling on the optical surfaces and optimising pixel well filling which can be achieved by estimating the exposure timing for the target temperature. The uncertainty on the temperature measurements, after soot coating of the nozzle and custom calibration of the optical path, was estimated at K.
The approach was demonstrated through the study of nozzle tip temperatures during motored cycles, as well as idle/low load engine operating conditions, and compared against time-averaged measurements from a thermocouple instrumented injector.
These findings provide empirical confirmation that high-speed infrared thermography can provide unprecedented surface temperature measurements during highly transient processes, as long as appropriate calibration and surface preparations are performed. This methodology could serve as a basis for future investigations into the effect of nozzle surface temperature on the degradation of nozzle-bound films, which can act as precursors to injector deposits.


 ,
, 


