Article

Thermal Efficiency and Economics of a Boil-Off Hydrogen Re-Liquefaction System Considering the Energy Efficiency Design Index for Liquid Hydrogen Carriers

1
Department of Mechanical Engineering, Korea Advanced Institute of Science and Technology (KAIST), Daejeon 34141, Korea
2
Energy Plant Research Center, Samsung Heavy Industries, Seongnam-si 13486, Korea
3
International Maritime Research Center (IMRC), Korea Research Institute of Ships & Ocean Engineering (KRISO), Daejeon 34103, Korea
*
Author to whom correspondence should be addressed.
Energies 2021, 14(15), 4566; https://doi.org/10.3390/en14154566
Submission received: 21 June 2021 / Revised: 13 July 2021 / Accepted: 20 July 2021 / Published: 28 July 2021
(This article belongs to the Topic Hydrogen Energy Technologies)

Abstract

:
This study analyzes the thermodynamic, economic, and regulatory aspects of boil-off hydrogen (BOH) in liquid hydrogen (LH2) carriers that can be re-liquefied using a proposed re-liquefaction system or used as fuel in a fuel cell stack. Five LH2 carriers sailing between two designated ports are considered in a case study. The specific energy consumption of the proposed re-liquefaction system varies from 8.22 to 10.80 kWh/kg as the re-liquefaction-to-generation fraction (R/G fraction) is varied. The economic evaluation results show that the cost of re-liquefaction decreases as the re-liquefied flow rate increases and converges to 1.5 $/kg at an adequately large flow rate. Three energy efficient design index (EEDI) candidates are proposed to determine feasible R/G fractions: an EEDI equivalent to that of LNG carriers, an EEDI that considers the energy density of LH2, and no EEDI restrictions. The first EEDI candidate is so strict that the majority of the BOH should be used as fuel. In the case of the second EEDI candidate, the permittable R/G fraction is between 25% and 33%. If the EEDI is not applied for LH2 carriers, as in the third candidate, the specific life-cycle cost decreases to 67% compared with the first EEDI regulation.

1. Introduction

Due to the current global attention concerning the reduction of carbon dioxide (CO2) emissions, which is the largest contributor to global warming [1], the demand for renewable energy is increasing. A large portion of CO2 emissions is attributed to the combustion of the fossil fuels, which provide approximately 80% of the total world energy supply [2]. From 2009 to 2018, global CO2 emissions increased by 16% [3]. To reduce CO2 emissions, power generation using renewable energy, which is not accompanied by CO2 emissions, has been increasing. According to the International Energy Agency, power generation achieved using renewable energy has increased by 57% from 2010 to 2018 [4]. The portion of renewable energy used for electricity generation has been projected to consistently increase in the future [5].
Although renewable energy can be used to reduce CO2 emissions, its production varies from region to region. This uneven distribution of renewable energy requires the use of energy carriers that can transport surplus renewable energy. Hydrogen is regarded as a potential energy carrier candidate for storing and transporting surplus renewable energy over long distances [6]. The delivered hydrogen generates energy from an oxidation process in fuel cells, which produces no CO2 and only pure water [7]. Hydrogen also has other principal advantages as an energy carrier, as noted by Rosen et al. [8]. It is free from exhaustion because it can be obtained by electrolyzing water into oxygen and hydrogen. Additionally, unlike electricity itself, it can be stored in a variety of forms such as compressed gas, liquid, and in chemical compounds including ammonia and metal hydrides [9].
Considering the large-scale transportation of hydrogen, it is essential to develop liquid hydrogen (LH2) carriers. LH2 has a density of 70 kg/m3, which is higher than the density of compressed hydrogen (39 kg/m3) at 70 MPa [10]. Compared to ammonia, LH2 is safer, as it is nontoxic. Moreover, because it is a pure substance that is not combined with other elements, it does not require any additional energy or processes to break its chemical bonds.
The main challenge concerning the transportation of hydrogen in a liquid state is its cryogenic boiling temperature, which is 20 K at atmospheric pressure. Although LH2 storage tanks on land are heavily equipped with an insulation layer, heat ingress is inevitable [11], resulting in the generation of boil-off hydrogen (BOH) and increase in the pressure of the storage tank if no preventative measures are used. This issue also exists for LH2 cargo tanks used in LH2 carriers.
In the case of relatively large-scale liquefied natural gas (LNG) carriers, whose cargo temperature is around 110 K, a boil-off gas (BOG) re-liquefaction system is usually installed. This system extracts the BOG from the cargo tanks, re-liquefies it using a refrigeration cycle, and returns the re-liquefied BOG to the cargo tank. Many studies have been conducted concerning this BOG re-liquefaction system [12,13,14,15]. Romero et al. analyzed and evaluated the conditions, parameters, and energy consumption of a reverse Brayton cycle-based BOG re-liquefaction system [16]. Kwak et al. investigated a small-scale BOG re-liquefaction system for use on LNG-fueled ships. They optimized the nitrogen reverse Brayton cycle using a genetic algorithm and compared two cases with and without BOG compressors [17]. Yin et al. compared a reverse Brayton cycle-based BOG re-liquefaction system with two expanders to such a system with a single expander. They simulated two cycles using parallel and serial nitrogen expanders and compared them with the base case that possessed a single expander [18]. Sayyaadi et al. used a genetic algorithm to optimize the price of the BOG re-liquefaction system products [19]. In these previous studies of BOG re-liquefaction systems, the specific energy consumption (SEC), which indicates the energy required to re-liquify 1 kg of BOG, was found to be between 0.73 to 1.41 kWh/kg. This value varied depending on the inlet conditions of the BOG system. Moreover, the precooling and precompression processes affected the SEC. The reverse helium Brayton cycle for BOG re-liquefaction was preferred because it was easy to operate. Additionally, this cycle did not require high pressures and was more appropriate for onboard systems in terms of safety [17]. These studies can be utilized to design appropriate BOH re-liquefaction systems.
Many studies have been conducted to liquefy hydrogen from ambient temperatures [20,21,22]. The main results of these investigations may also be applied towards designing BOH re-liquefaction systems. Chang et al. analyzed and compared various figures of hydrogen liquefaction systems in terms of exergy efficiency [23]. In their study, the reverse Brayton cycle with two expanders showed an exergy efficiency of 24.2%, while the Claude cycle had an exergy efficiency of 27.2%. Asadnia et al. proposed a hydrogen liquefaction system using combined mixed refrigerants [24]. They separated the cycles into two sections, in which the first section was used for precooling and the second was used for cryogenic liquefaction. In the precooling section, 11 materials including hydrocarbons were used as a mixed refrigerant. In the cryogenic section, hydrogen, helium and neon were used as mixed refrigerants. The simulation results showed an SEC of 7.69 kWh/kg. Sadaghiani et al. also proposed a hydrogen liquefaction system that used mixed refrigerants [25]. The proposed system was composed of two cycles, one of which used a mixture of hydrocarbons while the other used a mixture of hydrogen, neon and helium as a mixed refrigerant. This system demonstrated an SEC of 4.41 kWh/kg. Chang et al. proposed a hydrogen liquefaction system that utilized the cold energy of LNG [26]. In that study, the LNG precooled the hydrogen and was vaporized after precooling. Following the design of a hydrogen liquefaction system using LNG precooling, three configurations of the liquefaction cycles were compared in terms of their energy consumption. Considering the required energy for the liquefaction process described in their paper, the SEC for the most efficient configuration was calculated as 17.37 kWh/kg, which includes the energy consumed for ortho-para conversion. Yuksel et al. also proposed a hydrogen liquefaction system with four serial helium turbo expanders and analyzed this system [27]. These previous studies showed that the SECs of hydrogen liquefaction systems vary with the configuration of the system and the inlet conditions of the hydrogen.
BOH re-liquefaction systems, however, differ from liquefaction systems for hydrogen at ambient temperatures. The temperature of BOH is much lower than the ambient temperature. Additionally, such a system does not require an ortho-para conversion process because the LH
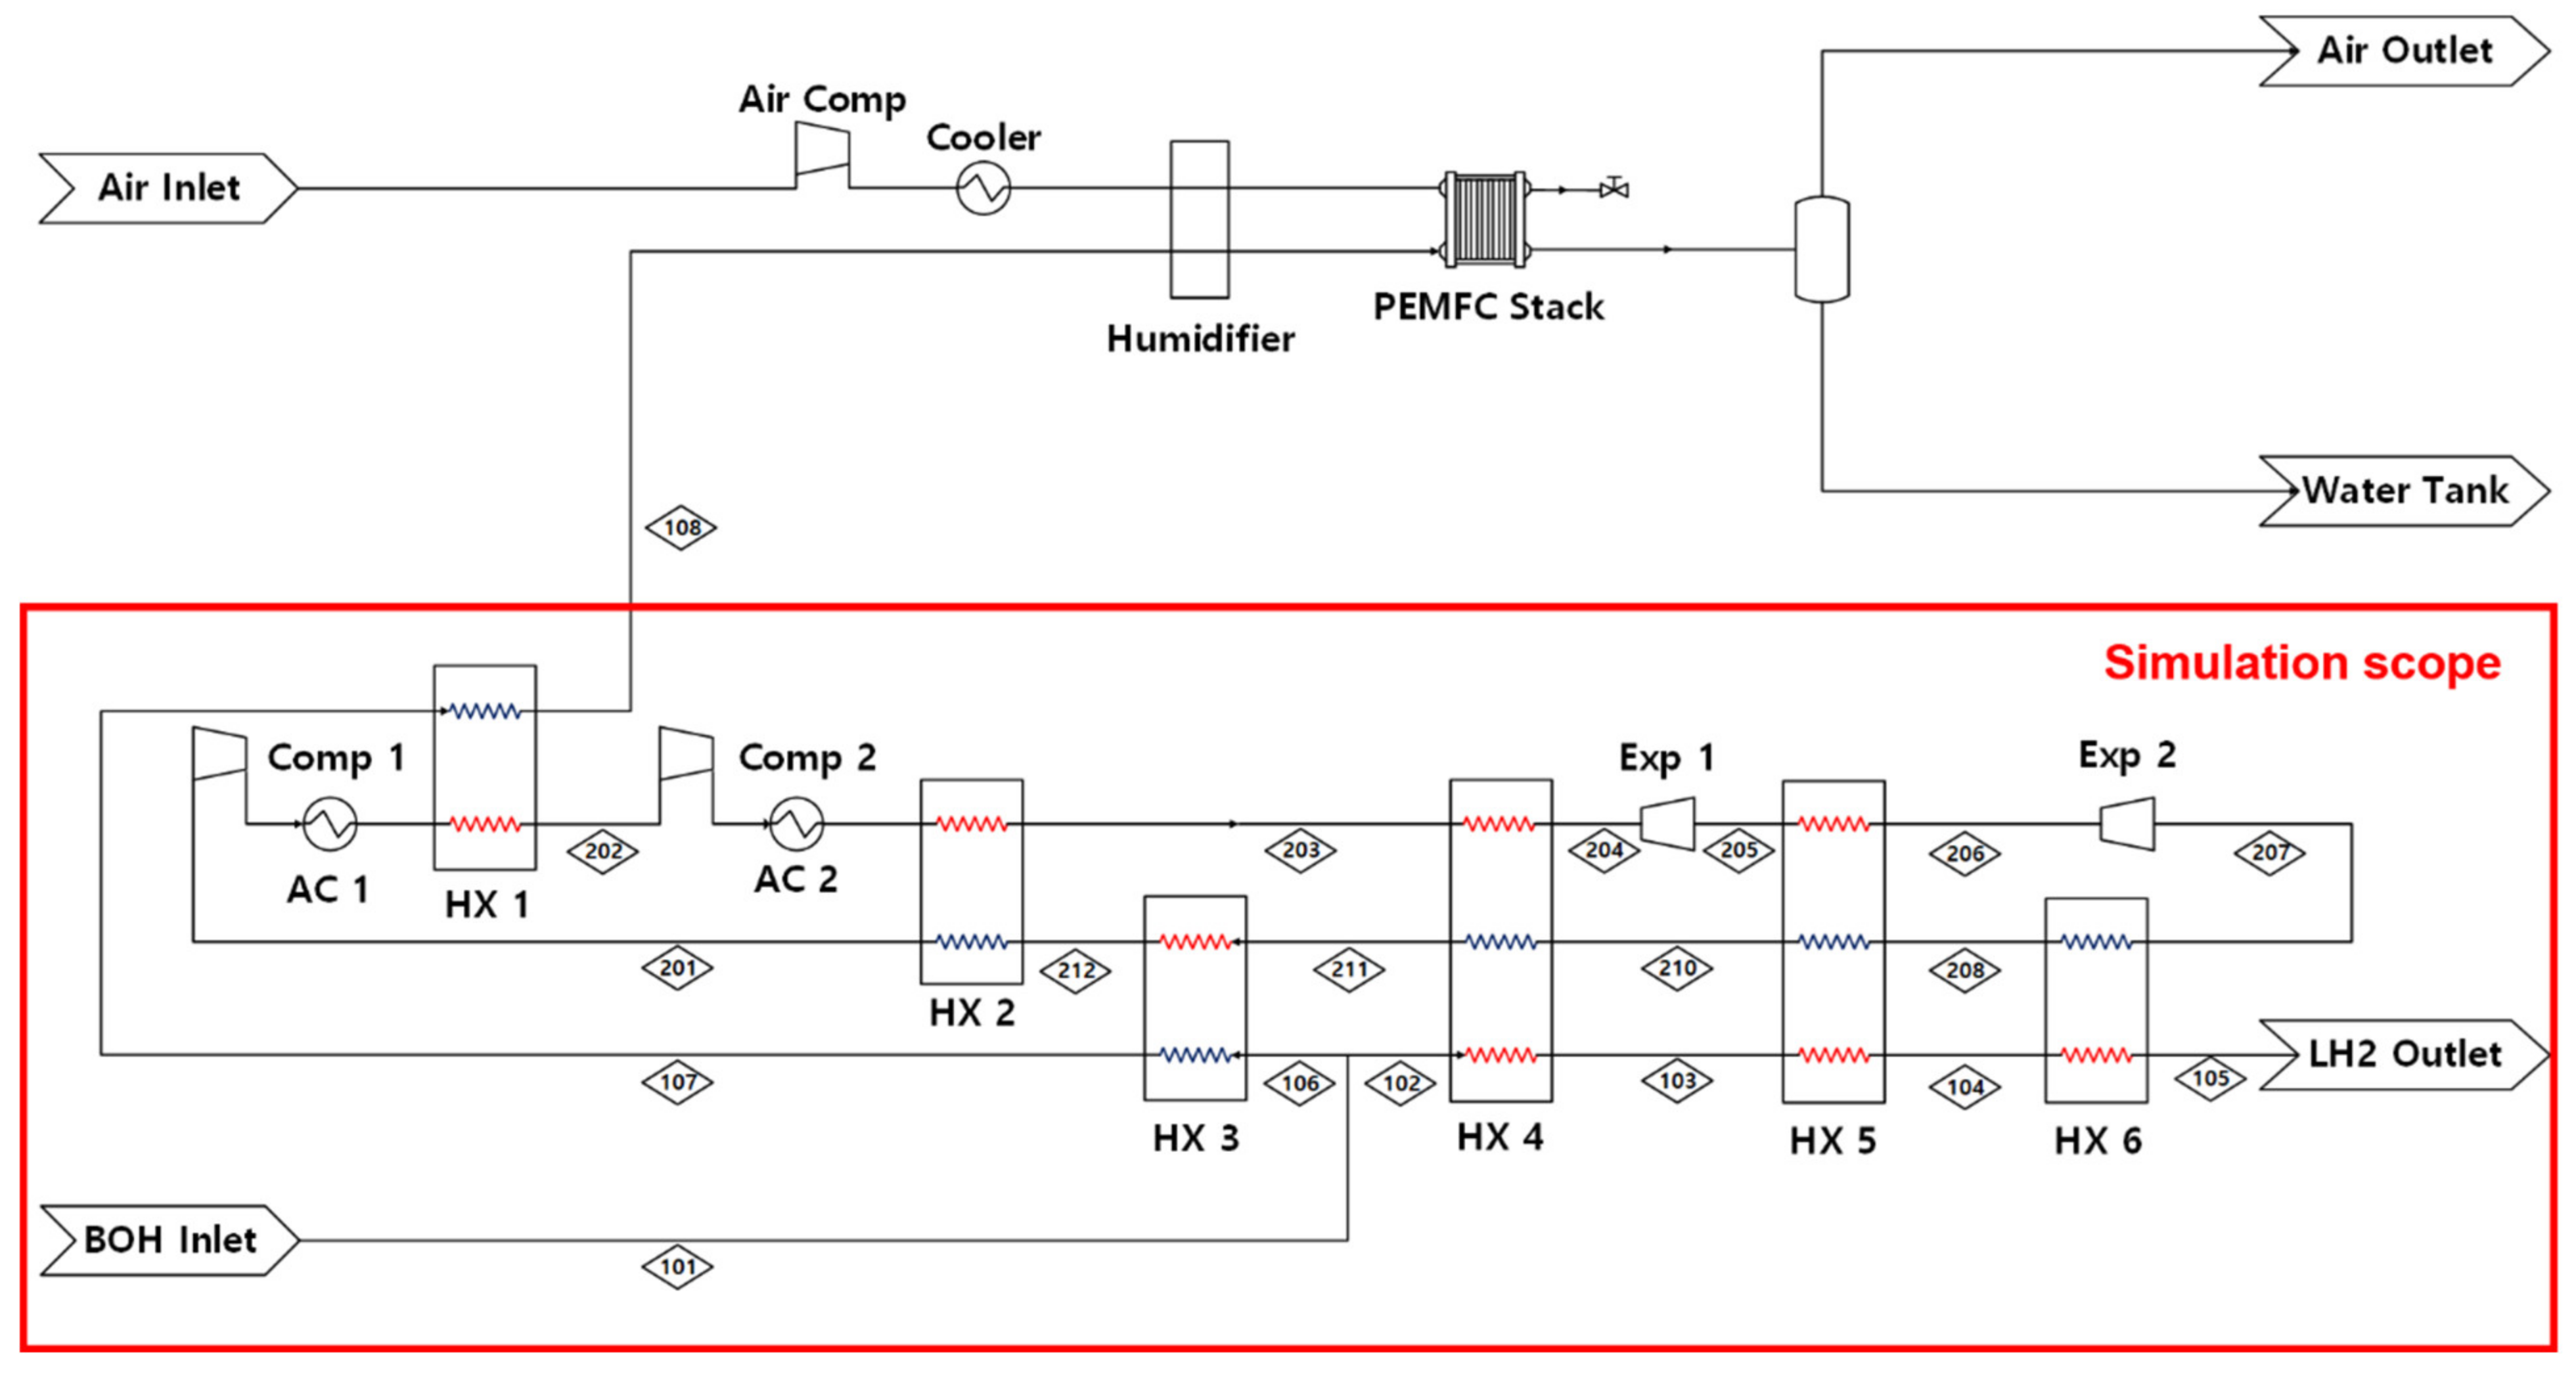
2 in the cargo tank has already been converted into para-hydrogen. Lee et al. proposed a partial BOH re-liquefaction system for use on an LH2 carrier [28]. In their study, some of the BOH from the LH2 cargo tank was used as a fuel in a proton-exchange membrane fuel cell (PEMFC). The remainder was precompressed to 40 bar using a cold compressor with an inlet temperature of 120 K. This compressed BOH was cooled down using helium in a reverse Brayton cycle and re-liquefied by expansion. This BOH re-liquefaction system exhibited an SEC of 3.30 kWh/kg and exergy efficiency of 74.9%.
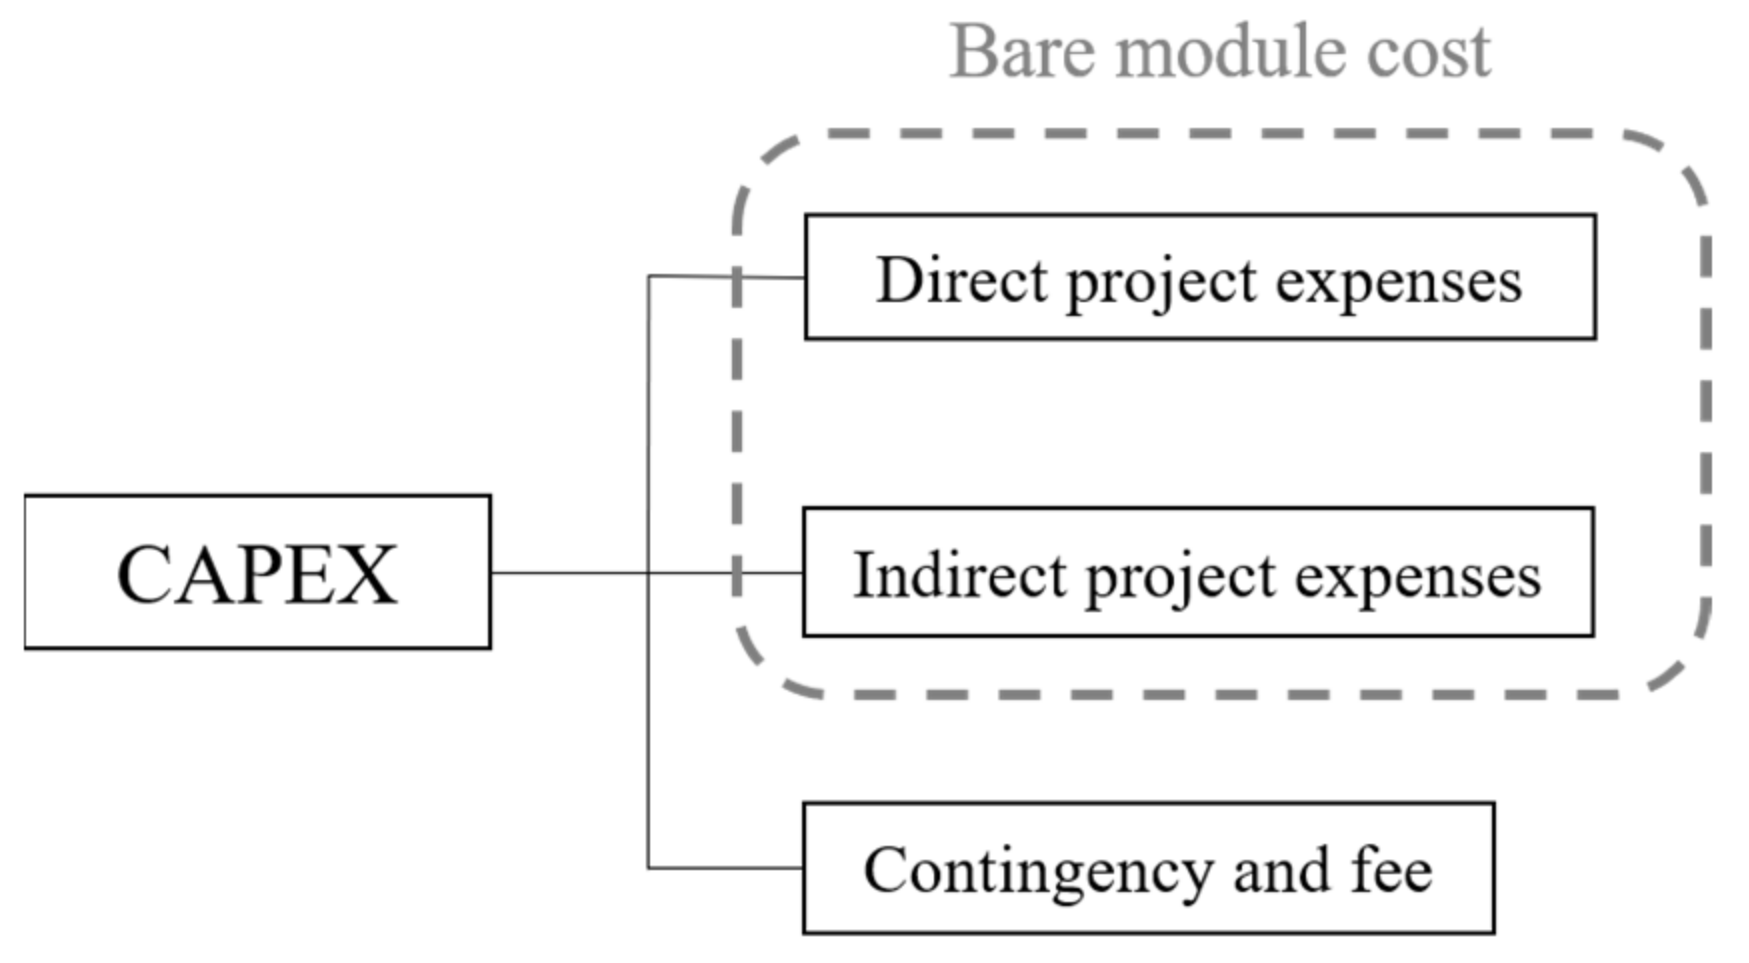
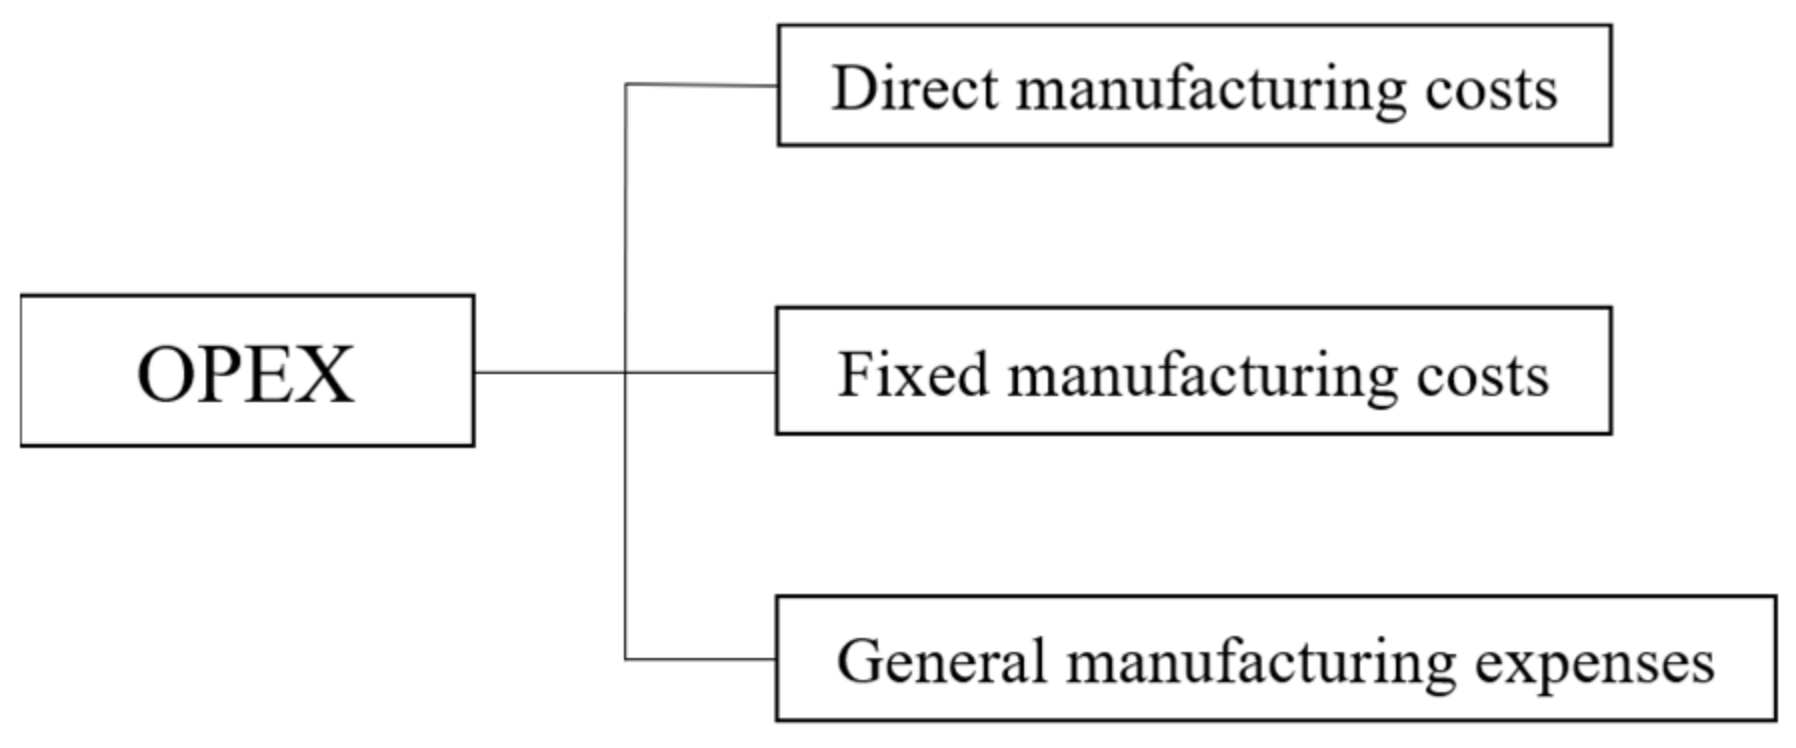
Previous studies of BOH re-liquefaction systems lacked an investigation of the economic feasibility of these systems that considered the installation and operation costs. A comparison with the production costs of LH2 can be used to investigate the economic feasibility of BOH re-liquefaction systems. Moreover, considering that existing LNG carriers vary in terms of their capacity, economic case studies of BOH re-liquefaction systems with varying capacities are required.
Another critical factor to consider in the design and operation of the BOH re-liquefaction system is the energy efficiency design index (EEDI) regulation of LH2 carriers. The EEDI is the design indicator regulated by the International Maritime Organization (IMO), which restricts the CO2 emissions of ships during the design process. Ship of certain types as indicated by the IMO must obey this index to operate. The EEDI also affects the electricity generation of BOH re-liquefaction systems. However, such a regulation for LH2 carriers has not yet been established. LH2 is similar to conventional liquefied gases such as LNG and liquefied petroleum gas (LPG) in that it is liquefied. However, liquid hydrogen differs from other conventional liquefied gases because it is an extremely low-density liquefied gas that is free from CO2 emissions. Consequently, the establishment of EEDI regulations for LH2 carriers is difficult in comparison with that of other liquefied gases.
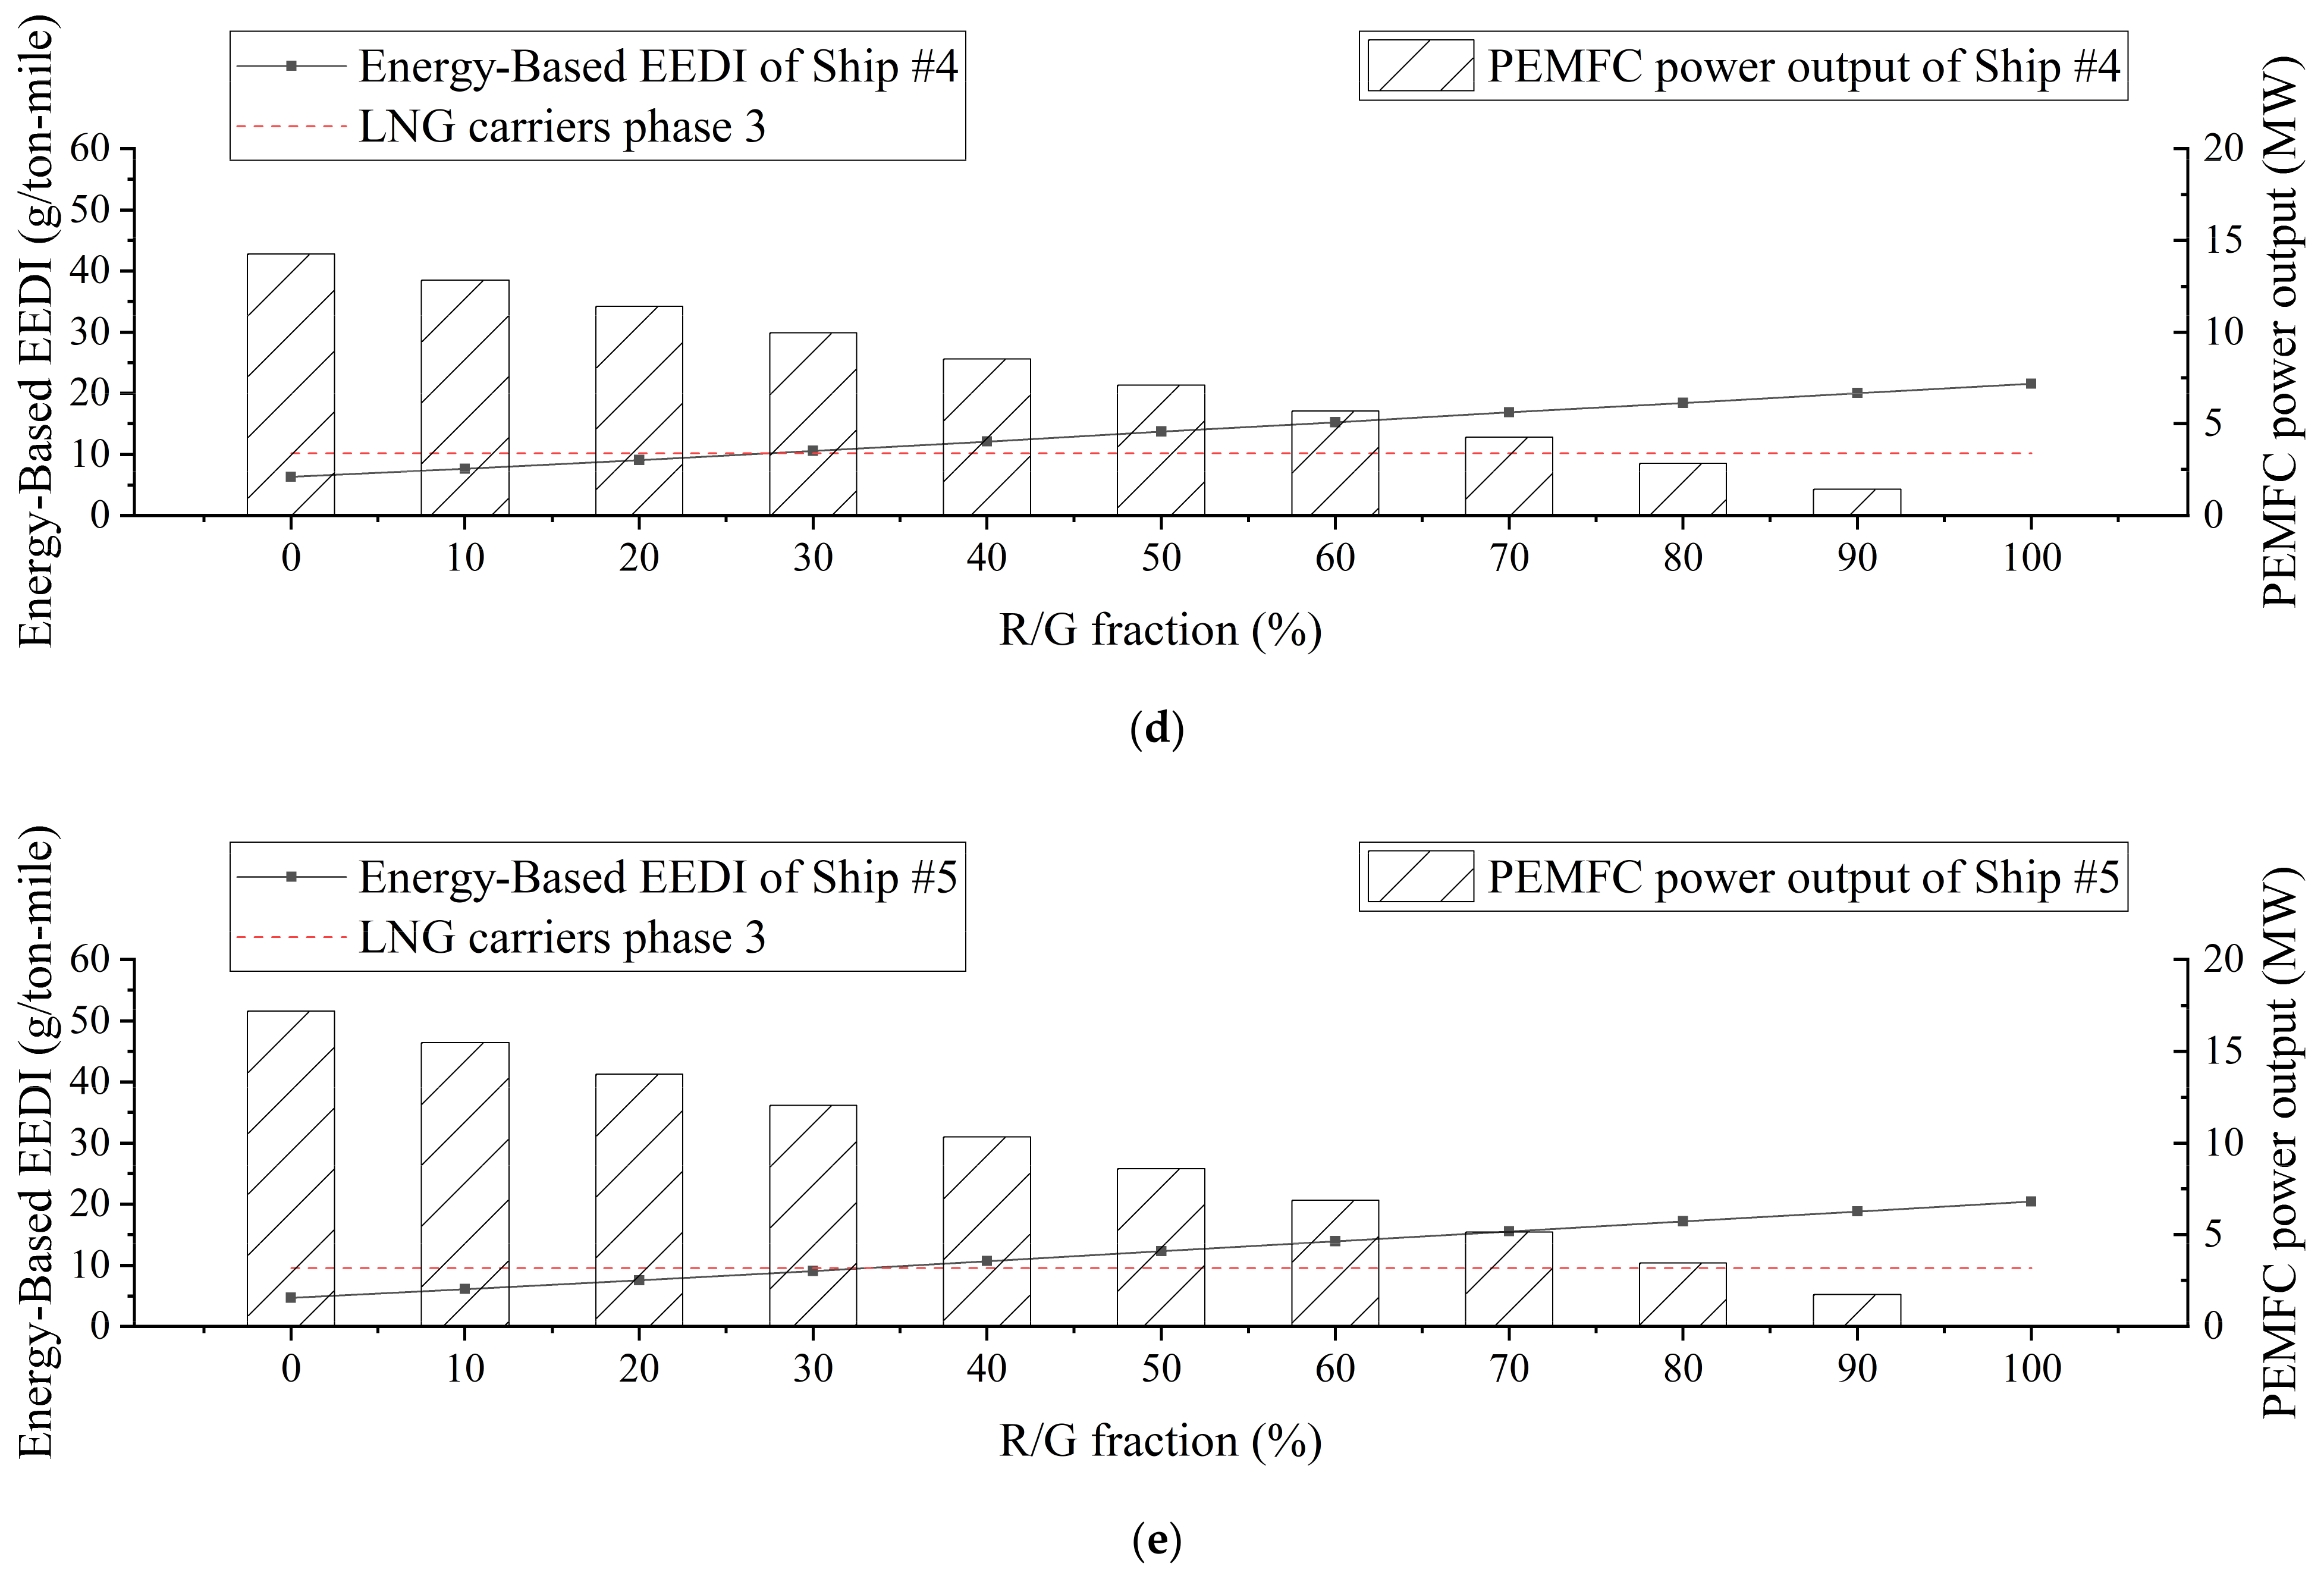
The objective of this study is to investigate the thermodynamic, economic, and regulatory aspects of BOH in LH2 carriers in which the BOH can be either re-liquefied using the proposed re-liquefaction system or used as fuel for the fuel cells. A case study is conducted that considers five LH2 carriers sailing between two designated ports. A thermodynamic analysis is carried out, followed by an economic assessment considering the re-liquefaction-to-generation (R/G) fraction. As these evaluations are meaningful in terms of the allowable EEDI, three EEDI candidates are proposed for estimating a feasible R/G fraction.

2. Proposed Boil-Off Hydrogen Re-Liquefaction System Combined with Fuel Cells

Figure 1 shows a process flow diagram of the proposed system. The system consists of a re-liquefaction cycle and PEMFC stack. The proposed re-liquefaction cycle is modified from a reverse Brayton cycle to utilize the cold energy of BOH heading to the PEMFC stack. The BOH to be utilized in the PEMFC stacks is first heated to the operating temperature of the PEMFC system. HX 1 and HX 3 are introduced to transfer the cold energy of the BOH to the helium refrigerant and increase the BOH temperature to the ambient temperature. Stream 101 indicates the BOH generation from the cargo tank. This stream is divided into two streams, which are labelled as 102 and 106. Stream 102 is cooled down and re-liquefied to a subcooled liquid state. Stream 106 cools the helium refrigerant and is utilized for propulsion. Stream 201 indicates the low-pressure helium stream. This stream is pressurized to a high pressure through Comp 1 and Comp 2. After AC 1, the helium is cooled down along with the BOH heading to the PEMFC system. After the helium is compressed, it is cooled down using the cold helium in HX 4. It is then primarily expanded to an intermediate pressure via EXP 1 and cooled down via HX 5. After passing through HX 5, the helium is expanded to a low pressure through EXP 2 and the BOH is liquefied in HX 6. After the BOH has been re-liquefied, this cold helium then cools down the hot helium and hydrogen.
Aspen Hysys V11 was used to simulate the proposed system. The modified Benedict-Webb-Rubin equation was applied for the states of ortho- and para-hydrogen. The Aspen properties (RefProp) were used for helium. Table 1 shows the boundary conditions for the process simulation.
The following assumptions were made for this simulation:
  • The dead-state temperature and pressure are 298 K and 1.01 bar, respectively.
  • The temperature at the exit of the aftercooler is 313 K.
  • The minimum temperature at the inlet of the compressor is 240 K.
  • The high and low pressures of the helium cycle are 10 and 1.2 bar, respectively.
  • The adiabatic efficiencies of the compressors are 75%.
  • The adiabatic efficiencies of the expanders are 75%.
  • The pressure drop in the heat exchangers is negligible.
  • In the heat exchangers, the minimum temperature difference is larger than 1% of the hottest stream temperature. If the temperature of the hottest stream in the heat exchanger is greater than 300 K, the minimum temperature difference is 3 K [23,26].

3. Method of Evaluation

3.1. Energy and Exergy Efficiency

The total energy required to re-liquefy BOH is calculated using Equation (1).
W ˙ net =   W ˙ Comp   1 +   W ˙ Comp   2   W ˙ Exp   1   W ˙ Exp   2
  • W ˙ net : Total work required to re-liquefy BOH
  • W ˙ Comp   1 : Work input for Comp 1
  • W ˙ Comp   2 : Work input for Comp 2
  • W ˙ Exp   1 : Work output for Exp 1
  • W ˙ Exp   2 : Work output for Exp 2
The R/G fraction, which is the ratio of the re-liquefied flow rate to the BOH generation flow rate, is estimated using Equation (2). The SEC is defined by Equation (3) to evaluate the energy required to re-liquefy the 1 kg of BOH. Because the re-liquefaction system utilizes the cold energy of the hydrogen, the SEC varies with the R/G fraction.
R / G   fraction =   m ˙ re liqeufaction   m ˙ BOH generation × 100   %
SEC =   W ˙ net   m ˙ re liqeufaction
  • m ˙ BOH generation : Mass flow rate of the generated BOH
  • m ˙ re liqeufaction : Mass flow rate of the re-liquefied BOH
In thermodynamics, physical flow exergy refers to the maximum useful work delivered to an external user as the stream reaches the dead state [30]. Considering refrigeration systems, it refers to the reversible and minimum work required for refrigeration to occur at a certain state. The physical flow exergy of stream can be estimated using Equation (4) [31]. In Equation (4), subscripts S and 0 refer to present state of the stream and dead state, respectively. Subscript ** means state that has same temperature with the dead state and same pressure with the present state. The first two terms in Equation (4) corresponds to thermal exergy, which is the physical exergy from the temperature difference of the stream with the dead state. The last two terms represent mechanical exergy, which is the physical exergy from pressure difference of the stream with the dead state.
E S = E T + E M = H S H * * T 0 S S S * * + T 0 S 0 S * * H 0 H * *
  • E S : Physical flow exergy of stream
  • E T : Thermal exergy of stream
  • E M : Mechanical exergy of stream
  • H S : Enthalpy of stream at present state
  • H * * : Enthalpy of stream at state **
  • H 0 : Enthalpy of stream at dead state
  • S S : Entropy of stream at present state
  • S * * : Entropy of stream at state **
  • S 0 : Entropy of stream at dead state
  • T 0 : Ambient temperature
During re-liquefaction, the irreversibility between processes causes exergy loss. To calculate this exergy loss, the physical exergy difference between inlets and outlets of a component can be used [32]. This exergy loss makes the system less efficient and require more work than an ideal system. From this point of view, the system exergy efficiency can be estimated using the numerical indicator η e x via Equation (5).
η ex =   E ˙ re liquefaction in   E ˙ re liquefaction outlet   W ˙ net +   E ˙ BOH   to   PEMFC in   E ˙ BOH   to   PEMFC out
  • E ˙ re liquefaction in : Physical flow exergy of Stream 102
  • E ˙ re liquefaction outlet : Physical flow exergy of Stream 105
  • E ˙ BOH   to   PEMFC in : Physical flow exergy of Stream 106
  • E ˙ BOH   to   PEMFC out : Physical flow exergy of Stream 108

3.2. Economics

CAPEX is defined as the initial investment required to construct a plant [33], and it consists of the direct project expenses, indirect project expenses, contingency and fee as depicted in Figure 2. The direct expenses encompass the equipment costs, material costs, and labor costs required to install the equipment. The indirect project expenses include the freight costs, insurance, and taxes. They also include the overhead costs required to construct the plant. The contingency is the cost that covers unforeseen circumstances, while the fee is related to the contractors. Among these costs, the sum of the direct and indirect costs is called the bare module cost. The contingency and fee are assumed as 15% and 3% of the bare module cost, respectively. The bare module cost for each component is estimated using the Aspen Capital Cost Estimator V11.
OPEX is defined as the costs associated with the day-to-day operations of a plant [33]. OPEX consists of direct manufacturing costs, fixed manufacturing costs, and general manufacturing expenses as depicted in Figure 3. The direct manufacturing costs are the operating expenses, which vary with the production rate. They include raw materials costs, utilities costs, and operational labor. The fixed costs are independent of changes in the production rate. They include taxes and insurance. The general expenses are overhead costs that are necessary to carry out business functions. They include administration, distribution and selling costs, as well as costs for research and development. Equation (6) [33] is used to estimate OPEX. Table 2 shows the specific values used to estimate CAPEX and OPEX.
OPEX = 0.18   CAPEX + 2.73   C OL + 1.23   C UT + C WT
  • C OL : Cost of the operator salary
  • C UT : Cost of utilities
  • C WT : Cost of the cooling water
The life cycle cost (LCC) is defined as the total costs required to install and operate the system during the life cycle [33]. It is estimated using Equation (7). The specific life cycle cost (SLCC) is defined as the LCC required for 1 kg of BOH, which is estimated using Equation (8). Additionally, the cost difference is defined as the difference between the LH2 production cost and SLCC, as expressed by Equation (9).
LCC = CAPEX + Life   Cycle × OPEX
SLCC = LCC   m ˙ re liqeufaction
Cos t   difference = LH 2   production   cos t SLCC

3.3. Restrictions on CO2 Emissions from LH2 Carriers

The attained EEDI indicates the CO2 emissions per unit of deadweight divided by the ship speed, which is calculated using Equation (10) for each ship [36].
EEDI att = P ME · C ME · SFC ME + P AE · C AE · SFC AE DWT · V ref ·
  • P ME : Power of the main engine
  • P AE : Power of the auxiliary engine
  • C ME : Conversion factor of the main engine between the fuel consumption and CO2 emissions
  • C AE : Conversion factor of the auxiliary engine between the fuel consumption and CO2 emissions
  • SFC ME : Specific fuel consumption of the main engine
  • SFC AE : Specific fuel consumption of the auxiliary engine
  • DWT : Deadweight of the ship
  • V ref : Speed of the ship
A diesel electric propulsion obtained using LNG is assumed for LH2 carriers. Specific fuel consumption is assumed as 175 g/kWh. The conversion factor between the fuel consumption and CO2 emissions is 2.75 [37]. According to the Marine Environment Protection Committee (MEPC) issued by the IMO, the power of the main engine for diesel electric propulsion is calculated using Equation (11). The parameter η is taken as 91.3 %, which indicates the product of the electrical efficiencies of the generators, transformers, converters and motors. Considering ships whose rated output of the motor is larger than 10,000 kW, the power of the auxiliary engine is calculated using Equation (12) [36].
P ME = 0.83 × MPP motor η
P AE = 0.025 × MPP motor + 250   kW
  • MPP motor : Rated output of the motor
  • η : Product of the electrical efficiencies of the generator, transformer, converter, and motor
The PEMFC system uses the BOH to generate electricity, which is then utilized for propulsion in conjunction with the electricity from the main engine. Therefore, the required power of the main engine is calculated using Equation (13). In this study, the efficiency of the PEMFC system is assumed to be 42% compared with lower heating value of hydrogen. In the case of LNG carriers with a BOG re-liquefaction system, the power required for the BOG re-liquefaction is added to the auxiliary engine power, as shown in Equation (14).
P ME = 0.83 × MPP motor η P PEMFC
P AE = 0.025 × MPP motor + 250   kW + P re liq
  • P PEMFC : Electricity generated from the PEMFC
  • P re liq : Power required for re-liquefaction
The required EEDI indicates the criteria that the ship under EEDI regulations must satisfy. Equations (15)–(17) show the methodology for calculating the required EEDI [36].
EEDI ref = a · b c
EEDI req = 1 X × EEDI ref
EEDI att EEDI req
  • EEDI ref : Reference EEDI
  • EEDI req : Required EEDI
The parameters a and c in the required EEDI equation are determined based on the type of ships. The variable b is the deadweight of the ship. X, which is between 0 and 1, is a reduction factor that indicates the reinforcement of the regulations over time. The time factor (referred to as the ‘phase’) represents the reinforcement of the regulations over time, which is determined using the value of X. For example, phase 3 indicates the year after 2025 and the factor X in this time is 0.3.
Because the EEDI regulations for LH2 carriers have not yet been designated, various perspectives should be considered before determining the final designation. This study considers the following EEDI candidates:
  • EEDI Candidate 1: EEDI equivalent to that of LNG carriers
  • EEDI Candidate 2: EEDI considering the energy density of LH2
  • EEDI Candidate 3: No restrictions using LNG as a fuel

3.3.1. EEDI Candidate 1: EEDI Equivalent to That of LNG Carriers

The concept behind EEDI candidate 1 is to utilize the required EEDI of LNG carriers for LH2 carriers. Table 3 shows the parameters used for the evaluation of the required EEDI of LNG carriers. In this EEDI candidate, the parameters in Table 3 and the deadweight of the LH2 carrier are used to calculate the required EEDI for LH2 carriers. Therefore, the required EEDI of an LNG carrier with the same deadweight as the LH2 carrier is calculated and compared with the attained EEDI for the LH2 carrier.

3.3.2. EEDI Candidate 2: EEDI Considering the Energy Density of LH2

EEDI candidate 2 considers the energy density difference between LH2 and LNG. As shown in Table 4, the density of LH2 is 16% of that of LNG. This low density of LH2 makes the attained EEDI of an LH2 carrier calculated using Equation (10) smaller than that of an LNG carrier with the same volumetric capacity. Conversely, LH2 has a heating value that is 2.58 times that of LNG. This indicates that LH2 can carry more energy within the same mass as LNG. EEDI candidate 2, therefore, considers this energy density factor. The energy density is used to introduce the “re-scaled deadweight” concept shown in Equation (19) in place of the mass density. Using this rescaled deadweight, Equation (20) defines the “energy-based EEDI”, which applies the energy density concept to the attained EEDI. In EEDI candidate 2, it is compared with the required EEDI of LNG carriers with the same volumetric capacity.
DWT = DWT cargo + DWT other
DWT re scaled = LHV LH 2 LHV LNG   DWT cargo + DWT other
EEDI energy based = P ME · C ME · SFC ME + P AE · C AE · SFC AE DWT re scaled · V ref
  • DWT cargo : Deadweight of cargo
  • DWT other : Deadweight without cargo
  • DWT re scaled : Rescaled deadweight
  • LHV LH 2 : Lower heating value of LH2
  • LHV LNG : Lower heating value of LNG
  • EEDI energy based : Energy-based EEDI

3.3.3. EEDI Candidate 3: No Restrictions Using LNG as a Fuel

EEDI candidate 3 refers to the case in which LH2 carriers have no restrictions regarding their CO2 emissions provided that conventional clean fuels such as LNG are used. Unlike other gas carriers that carry CO2-rich fuels, such as LPG and LNG, LH2 carriers are used to transport CO2-free hydrogen. The strong regulations on CO2 emissions from LH2 carriers, such as those considered in EEDI candidates 1 and 2, may thereby be impartial to liquid hydrogen, ultimately preventing the shipping of this clean fuel. It would therefore be fair to impose no restrictions on CO2 emissions if these ships utilize relatively clean fuels such as LPG or LNG. In this case, the practicality of BOH re-liquefaction can be determined purely on an economic basis.

4. Case Study

4.1. Target Ship Descriptions

LH2 carriers with five different sizes are considered for the subsequent case studies. The data of LNG carriers from the Clarksons database is used to assume the cargo capacity, rated output of motors for propulsion, and deadweight of LH2 carriers [38]. The deadweight of an LH2 carrier is assumed to be sum of the LH2 cargo weight and the deadweight of an LNG carrier without cargo and with the same capacity. The rated output of the motor (MPP) is calculated to have the same propulsion power of an LNG carrier with the same capacity. Table 5 shows the specifications of the LH2 carriers based on these assumptions.

4.2. Voyage Conditions

The LH2 export terminal is assumed to located be at Darwin, Australia, while the import terminal is assumed to located be at Pyeongtaek, South Korea. The boil-off rate for a laden voyage is assumed to be 0.2%/day [29]. The BOH generation for a ballast voyage is assumed to be 40% of that of the laden voyage. Table 6 shows the voyage conditions between Darwin and Pyeongtaek. Table 7 shows the BOH generation rates for the laden and ballast voyages. Table 8 shows the total amounts of BOH generated during one-way trips.

4.3. Liquid Hydrogen Production Cost

An LH2 production cost is assumed for comparison with the LCC of the BOH re-liquefaction system. The Fuel Cells Program Records from the Department of Energy provides the costs for hydrogen production and liquefaction. These documents also provide the terminal cost of LH2 [39,40]. As a result, the total cost for LH2 production and shipping is assumed to be 6.5 $/kg as described in Table 9.

5. Results and Discussion

5.1. Energy and Exergy Efficiency Results

Figure 4 shows the SEC of the proposed BOH re-liquefaction system, which varies from 8.22 to 10.80 kWh/kg as the R/G fraction varies from 10% to 100%. The BOH that is diverted to the PEMFC cools down the helium refrigerant through HX 1 and HX 3. As the temperature of the helium at the inlet of the compressors decreases, the specific volume of the helium also decreases. The compressor work required to achieve a specific pressure ratio decreases as this specific volume decreases. In the 100% re-liquefaction case, the temperature of the helium increases from 311 to 486 K during compression from 1.20 to 2.89 bar in Comp 1. In this case, a specific compressor work of 907.94 kJ/kg is required. Conversely, in the 10% re-liquefaction case, the cold BOH heading to the PEMFC stacks cools down the helium refrigerant in HX 3. The inlet temperature of Comp 1 is 240 K and increases to 375 K during compression from 1.20 to 2.89 bar in Comp 1. In this case, the specific compressor work is 700.91 kJ/kg. By comparing the 100% to the 10% R/G fraction, the cold energy from BOH reduces 23% of the required compressor work. As noted for the compression at Comp 1, the cold energy from the BOH reduces the compressor work of Comp 2. In the 100% re-liquefaction case, the inlet and outlet temperatures are 313 and 582 K at Comp 2, respectively, where the helium refrigerant is compressed from 2.89 to 10 bar via 1396.85 kJ/kg of specific compressor work. Similarly, the BOH cools down the helium in the 10% re-liquefaction case. The inlet and outlet temperatures are 240 and 446 K, respectively, with same pressure ratio in the 10% re-liquefaction case, and the specific compressor work is 1071.37 kJ/kg. By comparing the effects of 100% and 10% R/G fractions at Comp 2, the cold energy from the BOH reduces 23% of the required compressor work.
Figure 5 shows the exergy efficiency of the BOH re-liquefaction system with varied R/G fractions. The exergy efficiency increases from 0.209 to 0.258 as the R/G fraction increases from 10% to 30%, and it then converges after an R/G fraction of 30%. Figure 6 shows the exergy loss at each component in the re-liquefaction system. The exergy loss in the expanders and compressors is caused by mechanical irreversibility. The exergy loss in the after-coolers and heat exchangers is caused by the heat transfer between a finite temperature difference. It should be mentioned that the exergy loss due to heat transfer decreases as the R/G fraction increases from 10% to 30%, while it converges after 30%. When the R/G fraction is lower than 30%, the excess cold energy is provided by the BOH heading to the PEMFC. The excess cold energy enlarges the temperature difference between the helium and BOH heading to the PEMFC, and this large temperature difference causes a large amount of exergy loss.
In the process flow diagram depicted in Figure 1, Stream 108 indicates the BOH diverted to the PEMFC stacks. This stream provided cold energy through HX 3 and HX 1 and is designed to be 310 K, which is the ambient temperature. However, in the cases of 10% and 20% re-liquefaction, the excess cold energy is not fully utilized, and the temperature of Stream 108 is lower than 310 K. Because of this low temperature of Stream 108, the temperature differences in HX 1 and HX 2 are larger than those in the higher R/G fraction cases. As a result, increased exergy losses of 58% and 15% are generated by the heat transfer at the 10% and 20% R/G fractions, respectively, compared to the other R/G fraction cases.

5.2. Economic Evaluation Results

Figure 7 shows the structures of the LCCs for the BOH re-liquefaction systems. It is indicated that OPEX, which includes the operation and maintenance expenses, more influences the LCC than CAPEX, which contains the initial investment of the system. It is obvious that the total LCC increases with the increasing LH2 capacity of the ship. However, the SLCC, which is the LCC per 1 kg of BOH to be re-liquefied, decreases because the increase of the LCC is lower than the increase of the mass of the re-liquefied BOH. Figure 8a shows the SLCC of the BOH re-liquefaction system as it varies with the capacity of the ship and R/G fraction. It is indicated that at the same R/G fraction, the SLCC decreases as the capacity of the ship increases. Moreover, the SLCC decreases as the R/G fraction increases for the same ship. It can be deduced that as the mass of BOH re-liquefaction increases, the SLCC of the BOH re-liquefaction system decreases. Figure 8b shows the SLCC results with the varied mass of the re-liquefied BOH. It is indicated that as the re-liquefied mass increases, the specific LCC decreases. The slope of the graph in Figure 8b decreases as the re-liquefied mass increases. After the re-liquefied mass is greater than 7.2 ton/day, the SLCC converges at 1.5 $/kg.
Compared to the LH2 production cost of 6.50 $/kg (as mentioned in Section 4.3), the BOH re-liquefaction system is considered to be beneficial for 20% to 100% R/G fractions. The production cost and SLCC can be used to estimate the economic benefit obtained by using such a system. During the voyage from Darwin to Pyeongtaek described in Section 4.2, the cost difference between the LH2 production cost and SLCC for a round-trip is estimated in Figure 9.

5.3. Consequences of the EEDI

5.3.1. EEDI Candidate 1

Figure 10 shows the attained EEDI results of the ships with varied R/G fractions. Each graph includes the required EEDI phase 3 line of the LNG carrier with the same volumetric capacity. As shown in Equation (10), the calculation results obtained using the same R/G fraction for each ship tend to decrease as the volume capacity of the ships increase. This indicates that as the volumetric capacity of the ship increases, the attained EEDI of the LH2 carriers tends to decrease and becomes more similar to EEDI candidate 1. As the R/G fraction increases, the BOH utilized in the PEMFC decreases and the required power from the main engine increases. The more power the main engine generates using the LNG fuel, the more CO2 the ship emits.
Table 10 shows the permittable R/G fractions according to EEDI candidate 1, indicating that only a small amount of BOH is permittable for re-liquefaction. In the cases of Ships #1 and #2, whose capacity is relatively smaller than the other LH2 carriers, additional hydrogen is required to satisfy the EEDI candidate 1. Additionally, in the cases of Ships #3 to #5 with larger capacities, less than 15% of the generated BOH is permittable for re-liquefaction.

5.3.2. EEDI Candidate 2

Figure 11 shows the energy-based EEDI calculation results defined for EEDI candidate 2. Each graph for Ships #1 to #5 presents the results of this energy-based EEDI with varied R/G fractions. The graphs also exhibit the required EEDI phase 3 for LNG carriers with the same rescaled deadweight as each LH2 carrier. Similar to the attained EEDI shown in Figure 10, as the R/G fraction increases, the energy-based EEDI increases. Moreover, the energy-based EEDI tends to decrease as the volumetric capacity of the ships increases. However, unlike the attained EEDI results shown in Figure 10, every ship is able to re-liquefy a ratio of BOH between 25% and 33% such that the energy-based EEDI is less than the required EEDI phase 3 of LNG carriers. These results were obtained due to the rescaled deadweight that was increased from the original deadweight considering the differing heating values of LH2 and LNG. Table 11 shows the permittable R/G fractions of Ships #1 to #5. The permittable R/G fraction tends to increase as the volumetric capacity of the ships increases.
The differences between Table 10 and Table 11 indicate how the mass and energy densities of LH2 differ from those of LNG. Because LH2 has a lower density but larger heating value than LNG, the permittable R/G fraction is larger in EEDI candidate 2 than in EEDI candidate 1. The cargo of the currently used energy carriers under EEDI regulations is mainly hydrocarbon materials such as oil and LNG. These materials have different densities and heating values compared to hydrogen. The existing EEDI regulation for energy carriers, which is calculated using the mass-based deadweight, is used due to the properties of these hydrocarbons. Therefore, the application of this regulation directly to LH2 carriers without considering the properties of LH2 is inappropriate. The large heating value of hydrogen should be reflected in these regulations such that the energy carrier may carry energy efficiently.

5.3.3. EEDI Candidate 3

EEDI candidate 3 exempts the LH2 carriers from the EEDI regulations. The LH2 carriers deliver LH2 cargo, which emits no CO2, unlike other fuels. In addition, it is highly likely that only CO2-free LH2 will be allowed for international trading. Therefore, although regulations on CO2 emissions may not be imposed on LH2 carriers, LH2 is far less CO2-intensive than other liquefied cargos such as LNG and LPG considering the entire supply chain.
In this case, the BOH R/G fraction is determined mainly via economic motivations. As discussed in Section 5.2, the SLCC of the BOH re-liquefaction system decreases as the R/G fraction increases. Consequently, all BOH may be re-liquefied considering the economic results obtained using EEDI candidate 3.
Table 12 shows the SLCCs for the permittable R/G fractions obtained using each EEDI candidate. As described in Section 5.3.1, the permittable R/G fraction indicates the amount satisfying the EEDI restrictions for each candidate. In the case of EEDI candidate 3, this ratio is 100% because there is no EEDI restriction. Compared with EEDI candidate 1, the SLCC for the permittable R/G fraction decreases from 50% to 68% depending on the capacity of the LH2 carriers in EEDI candidate 3. Likewise, the SLCC decreases from 18% to 48% compared to the EEDI candidate 2. These results indicate the economic advantages that may be obtained when LH2 carriers are not subjected to EEDI restrictions. Considering this advantage and the CO2-free characteristic of LH2, the EEDI-free regulation of LH2 carriers can be considered, which exempts LH2 carriers with LNG fuels from the CO2 emissions restrictions.

6. Conclusions

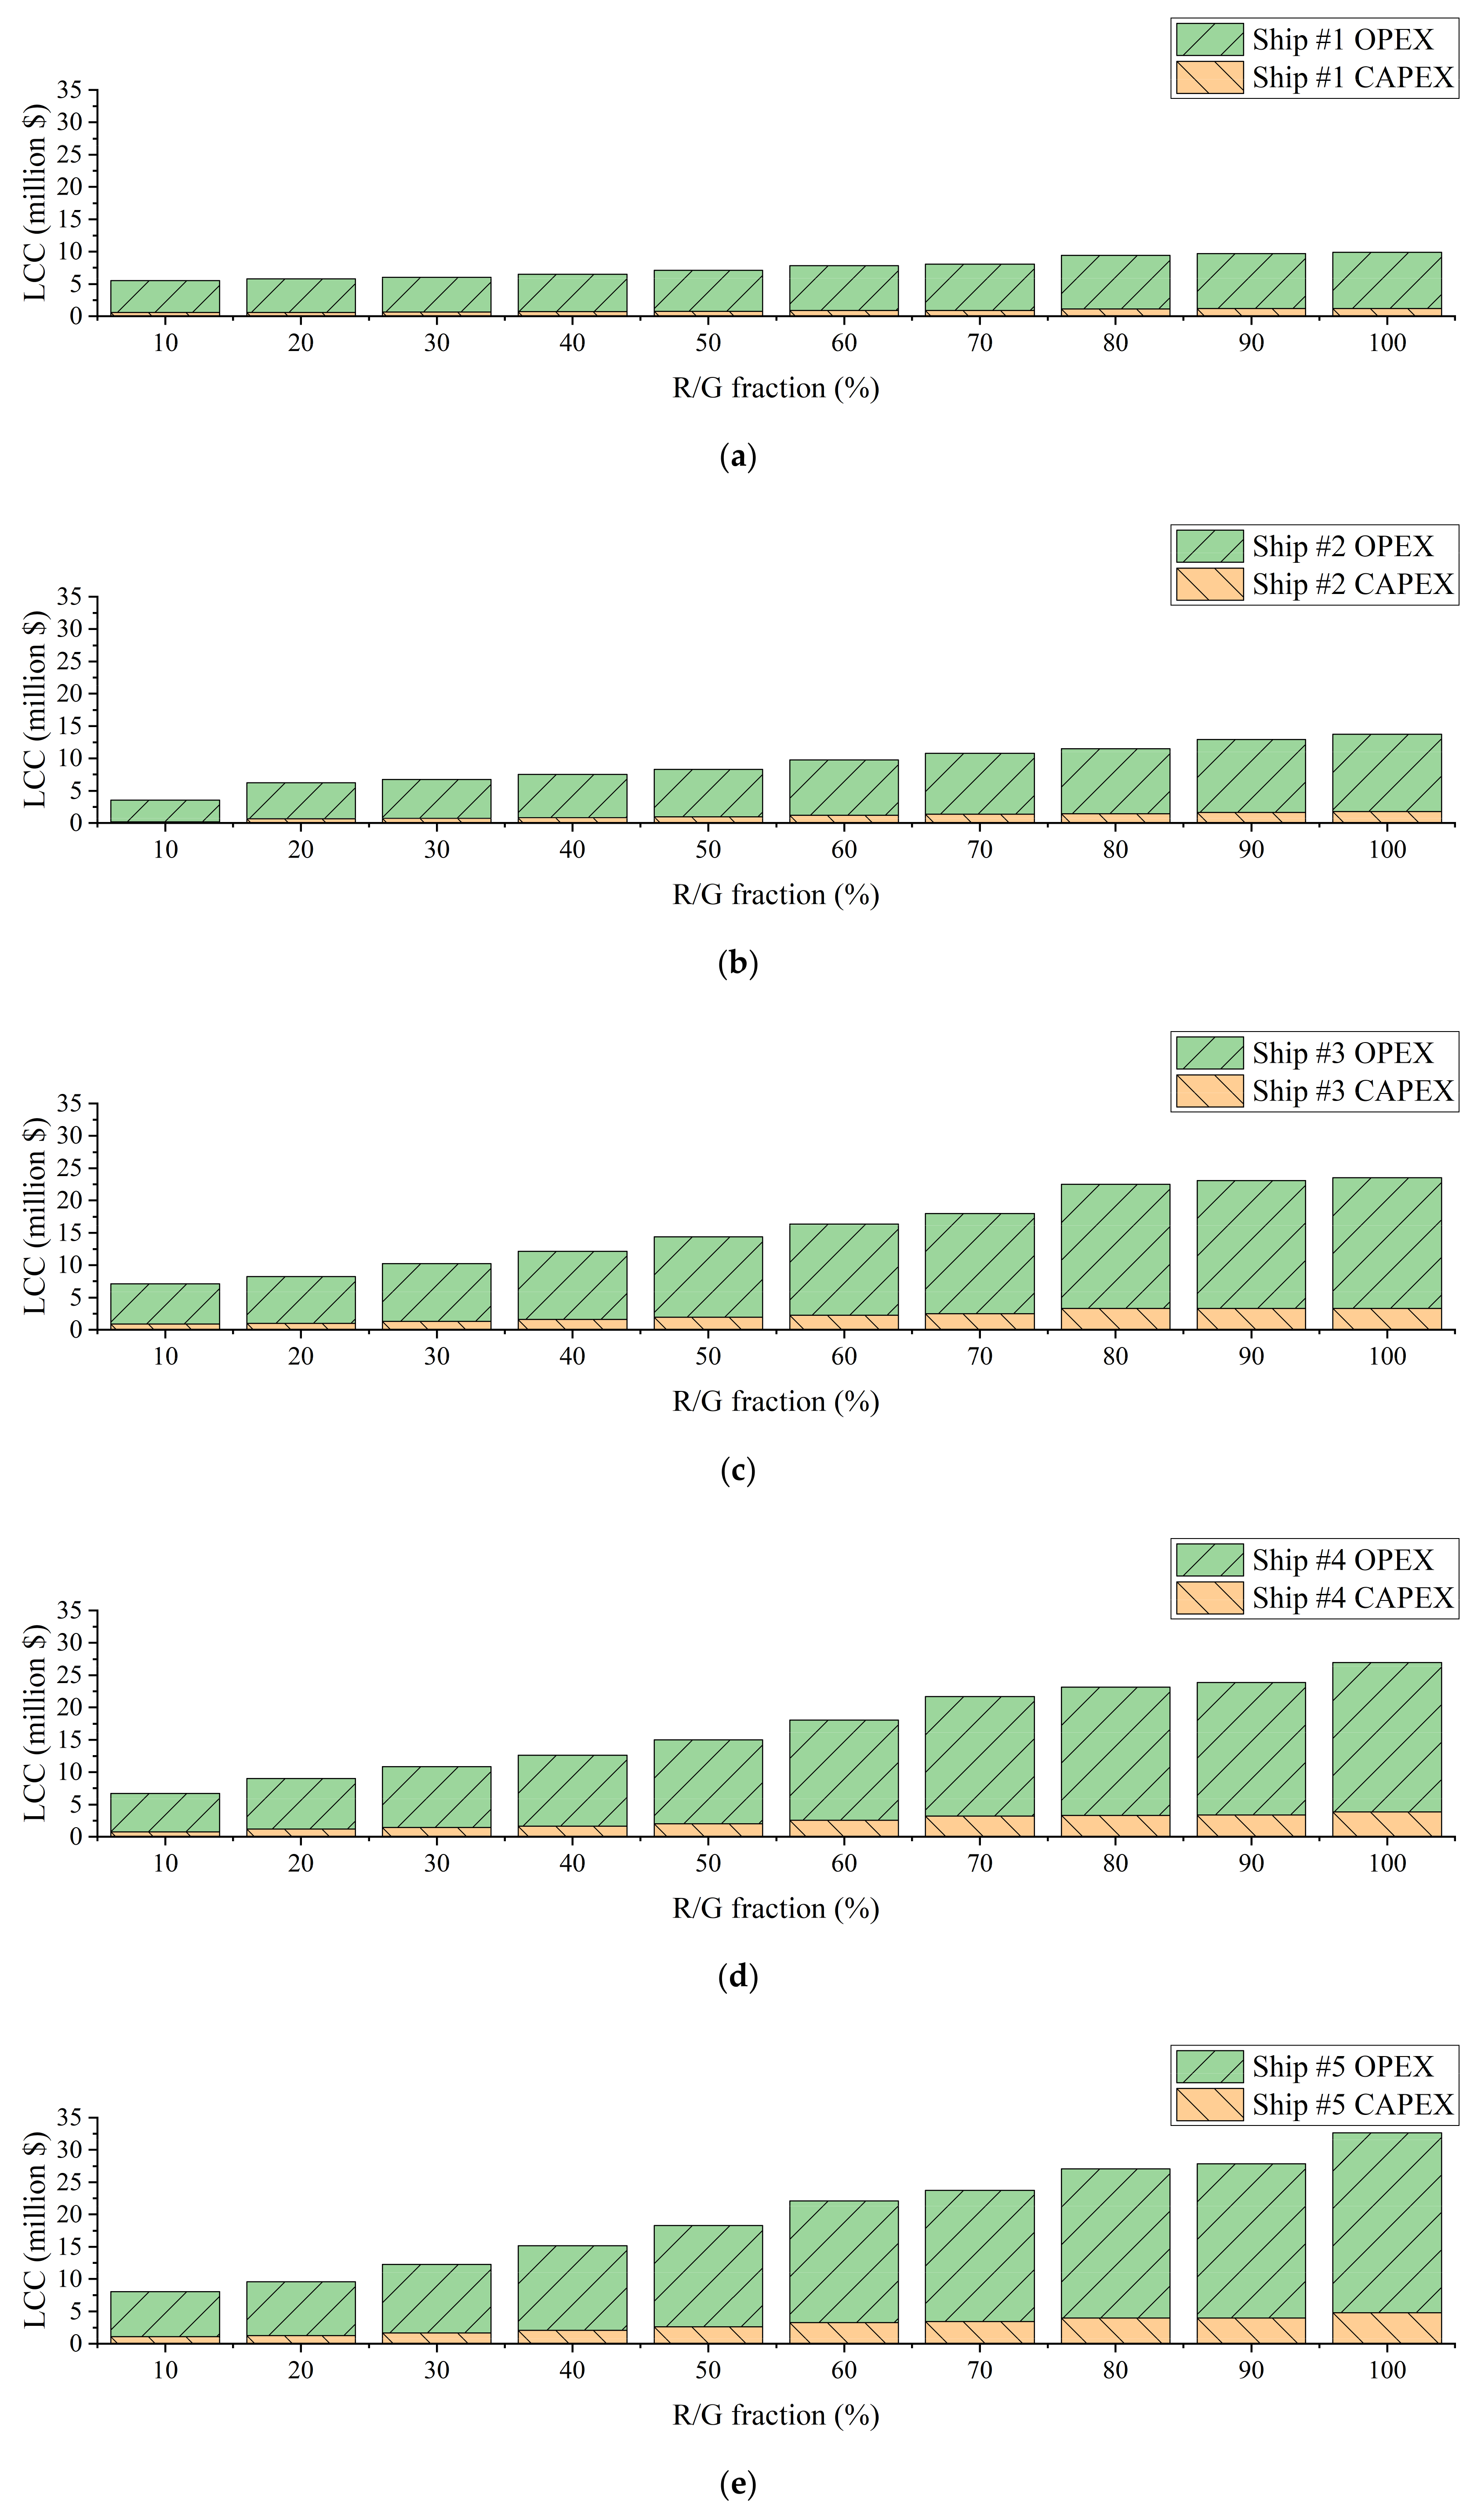
This study proposed a partial BOH re-liquefaction system based on the reverse Brayton helium cycles. This system divides the generated BOH into two streams, one of which is to be re-liquefied and the other is utilized to generate electricity in PEMFC stacks. Various evaluations for the system were performed based on an assumed voyage route, five different LH2 carrier specifications, and an assumed LH2 production cost.
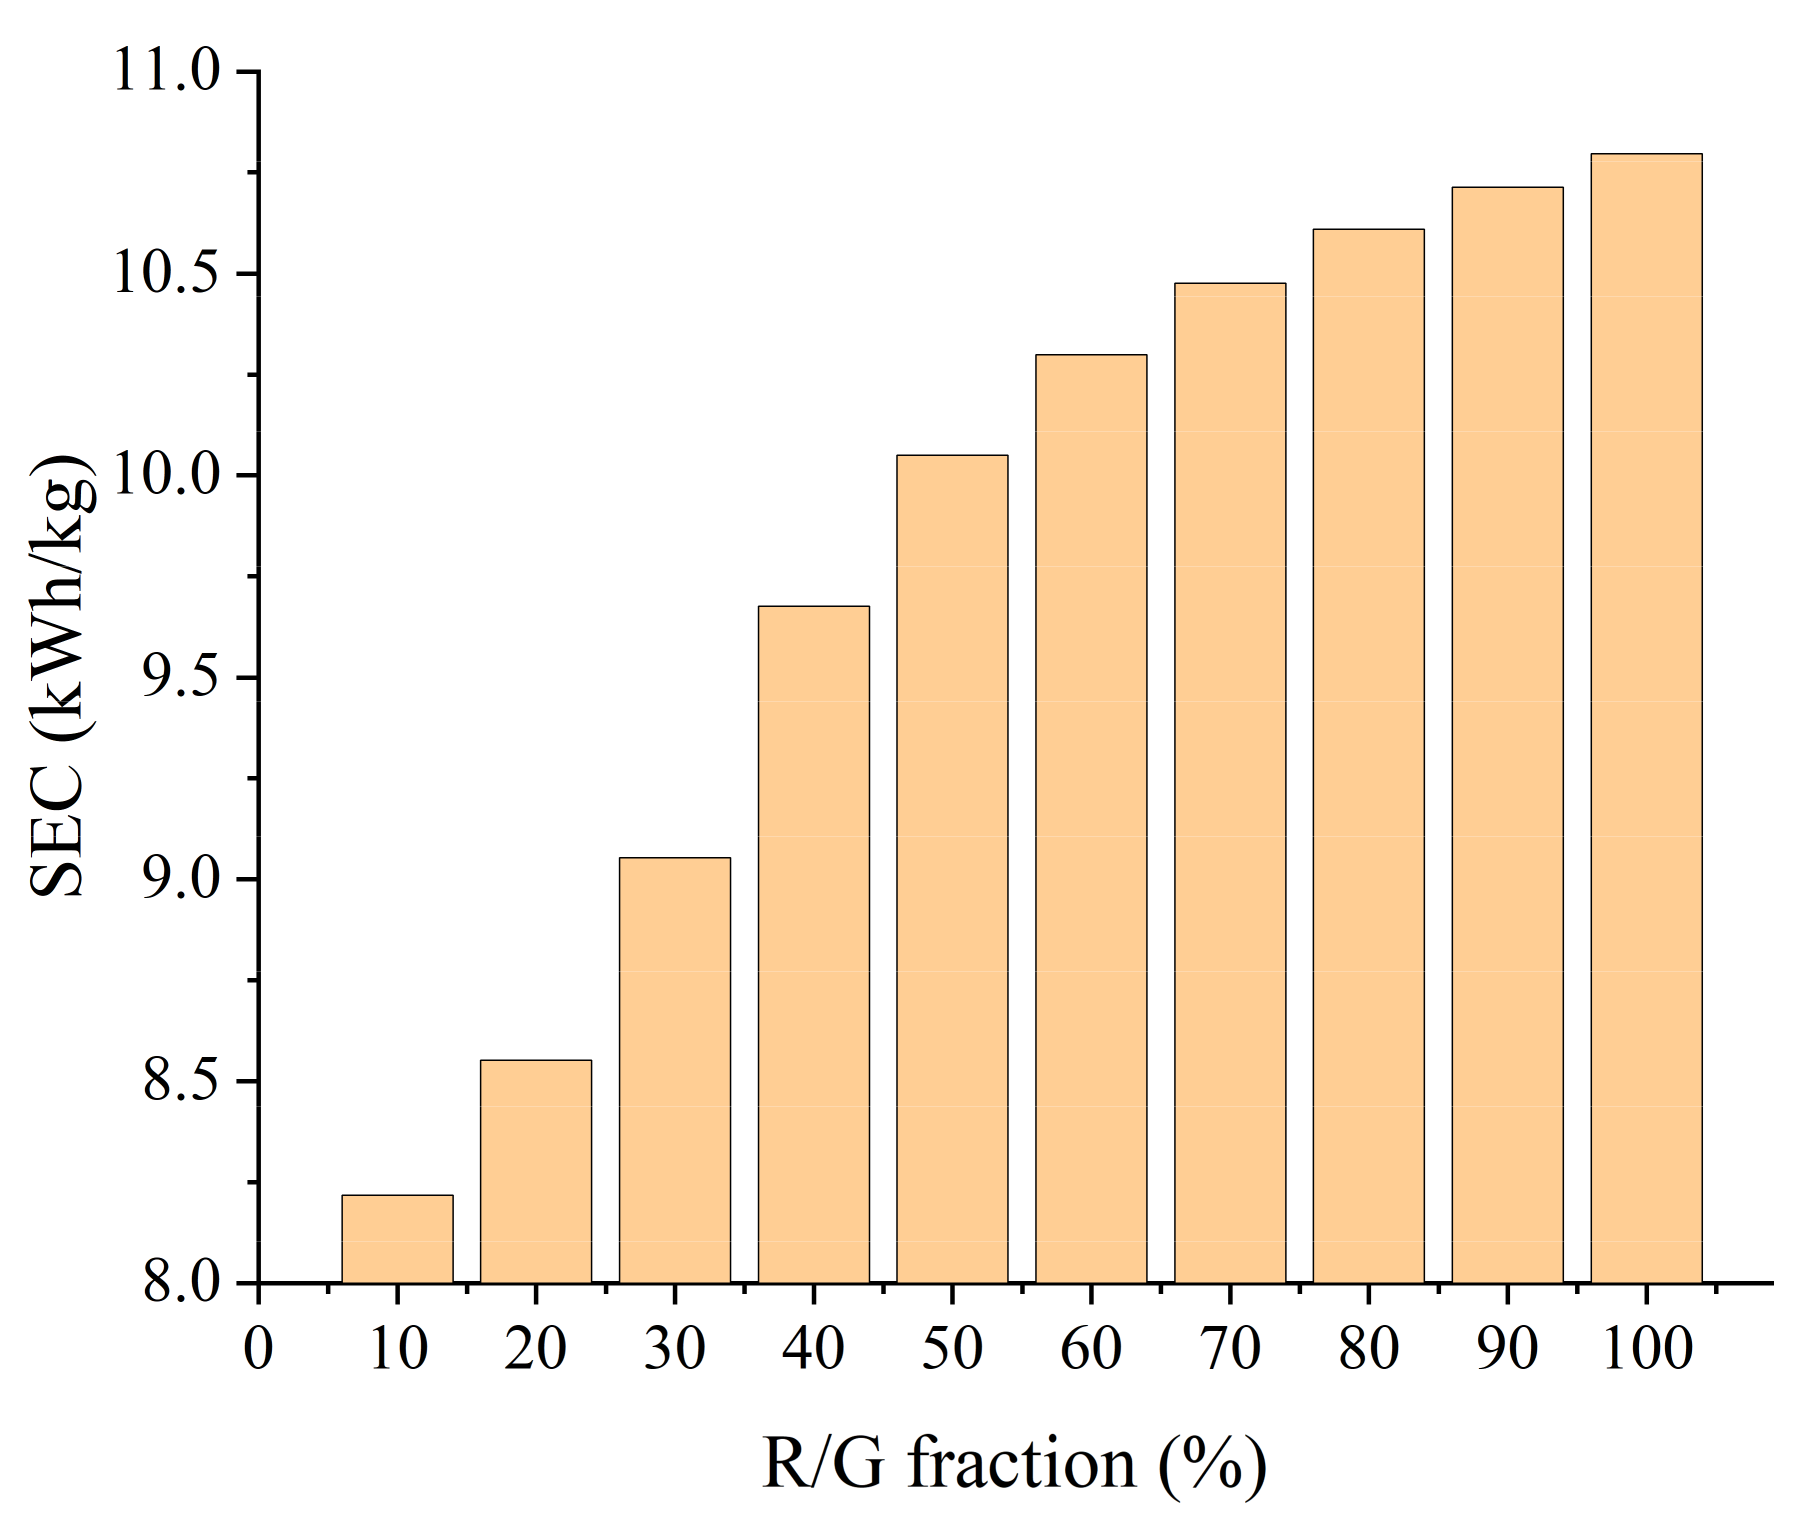
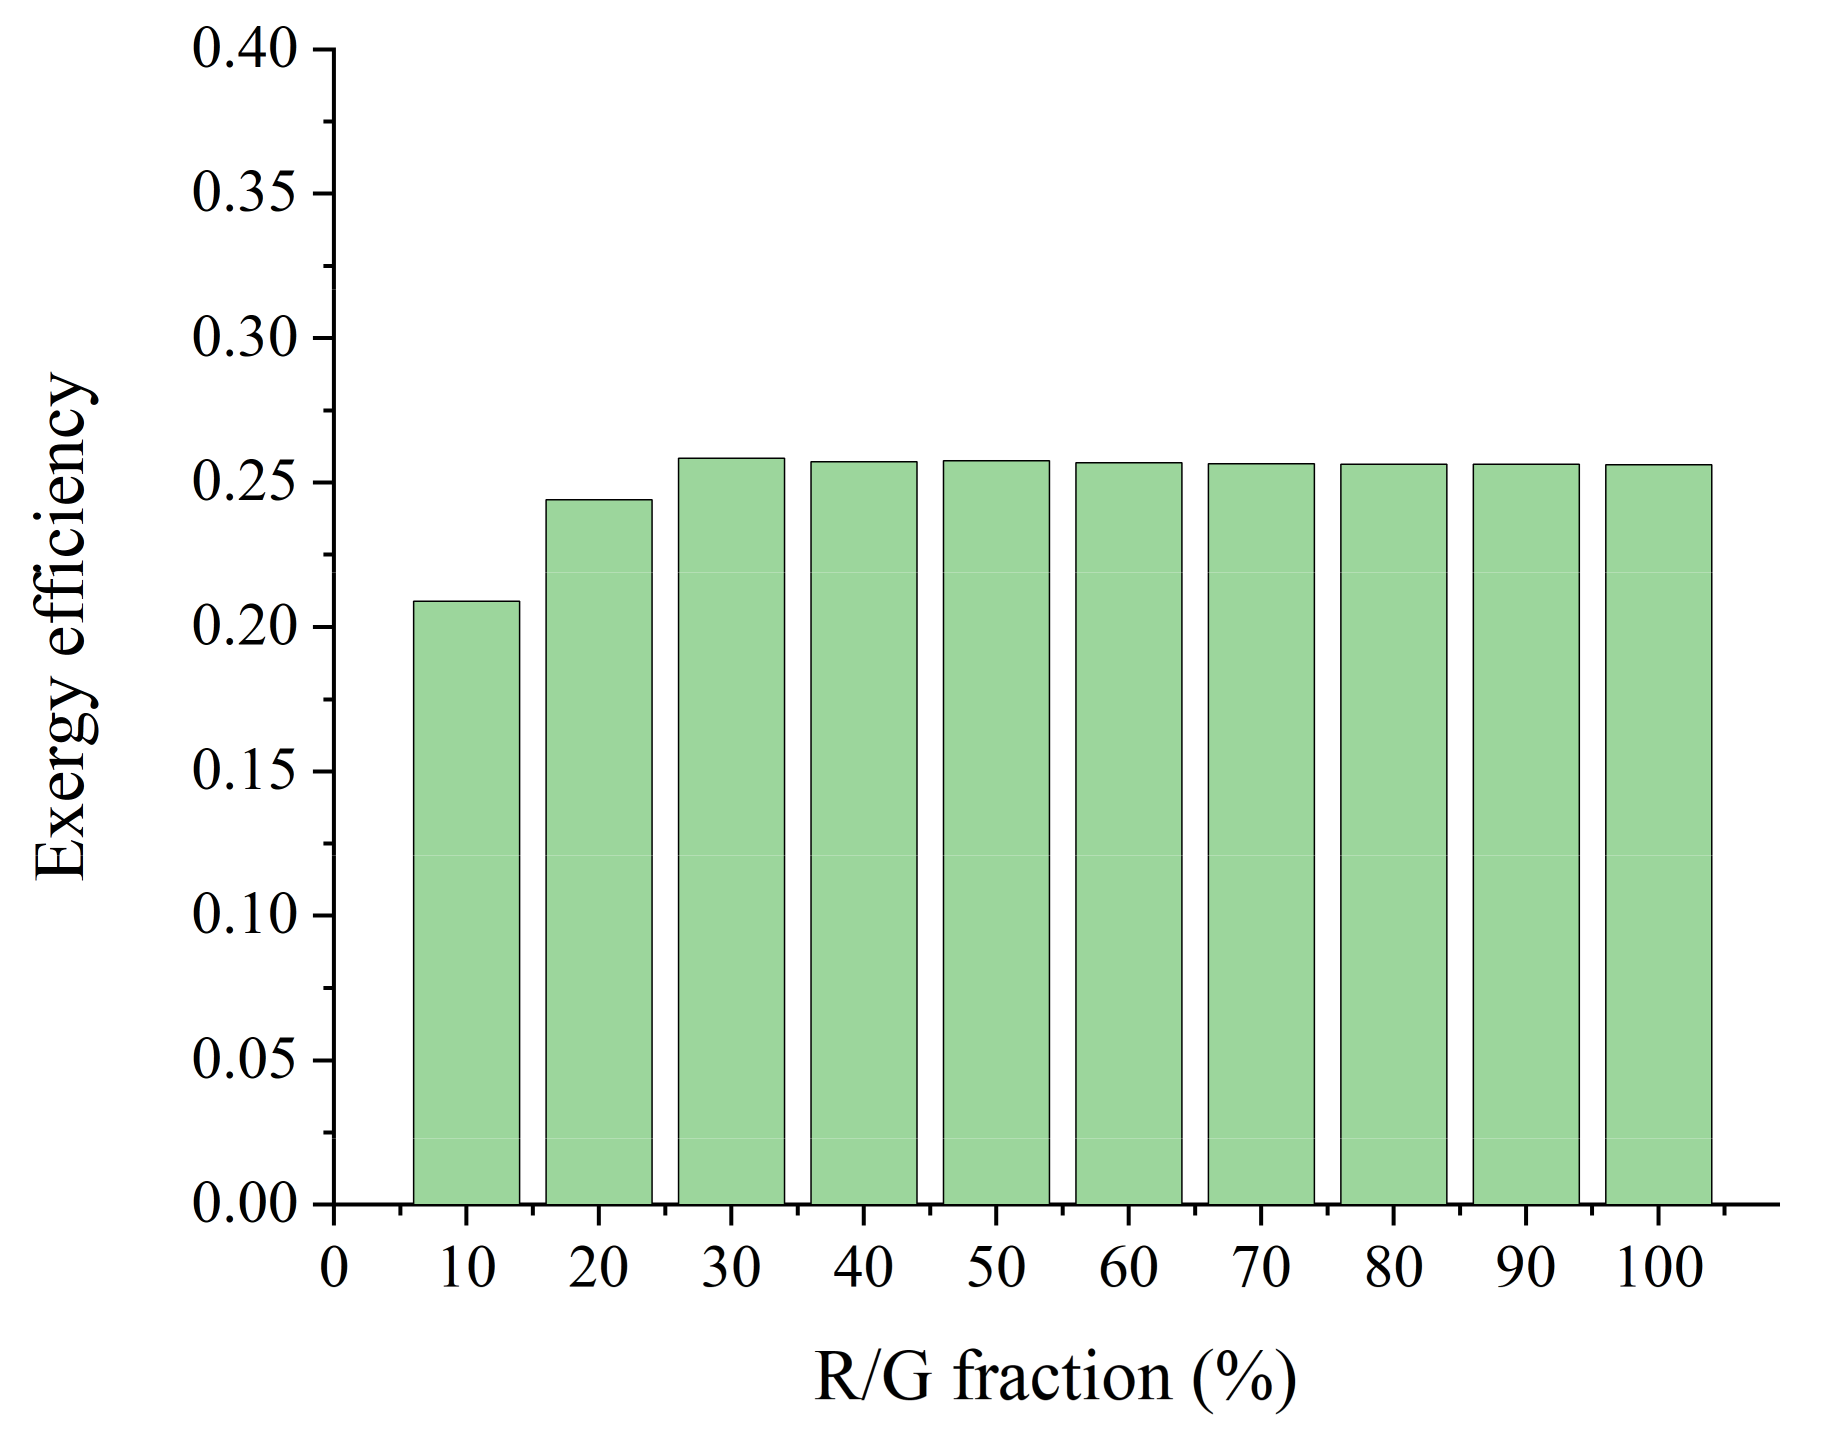
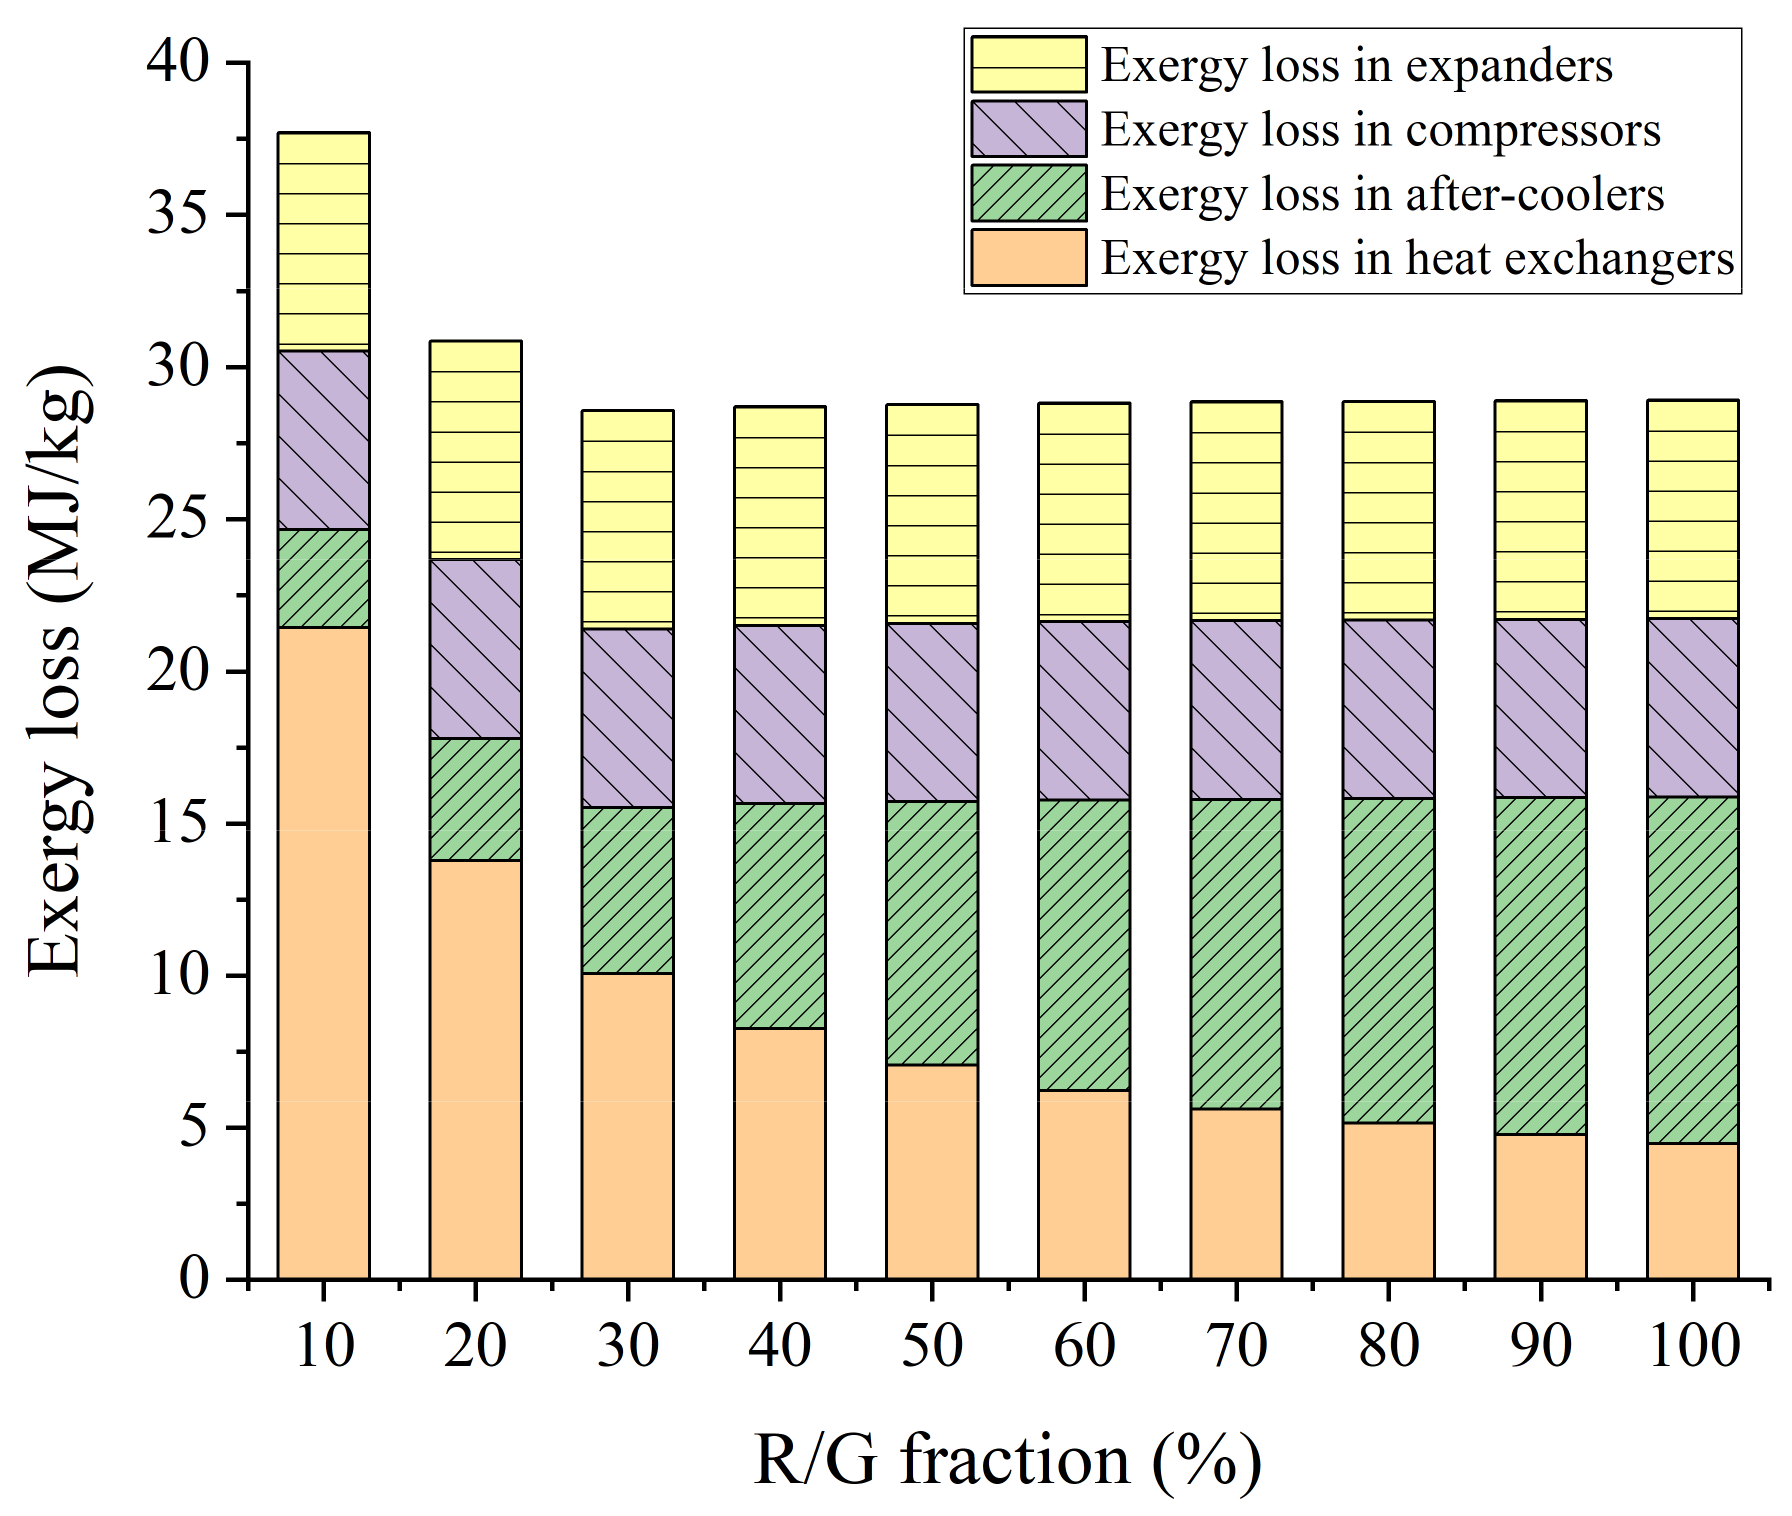
The SEC increased from 8.22 to 10.80 kWh/kg as the R/G fraction increased from 10% to 100%. The exergy efficiency was increased from 0.209 to 0.258 as the R/G fraction increased from 10% to 30%, and it converged to 0.258 when the R/G fraction was larger than 30%. The exergy loss in heat transfer occupied the largest portion of all. Due to the excessive cold energy of the BOH heading to the PEMFC stacks, compared to other R/G fraction cases, 58% and 15% more exergy loss occurred in 10% and 20% cases, respectively.
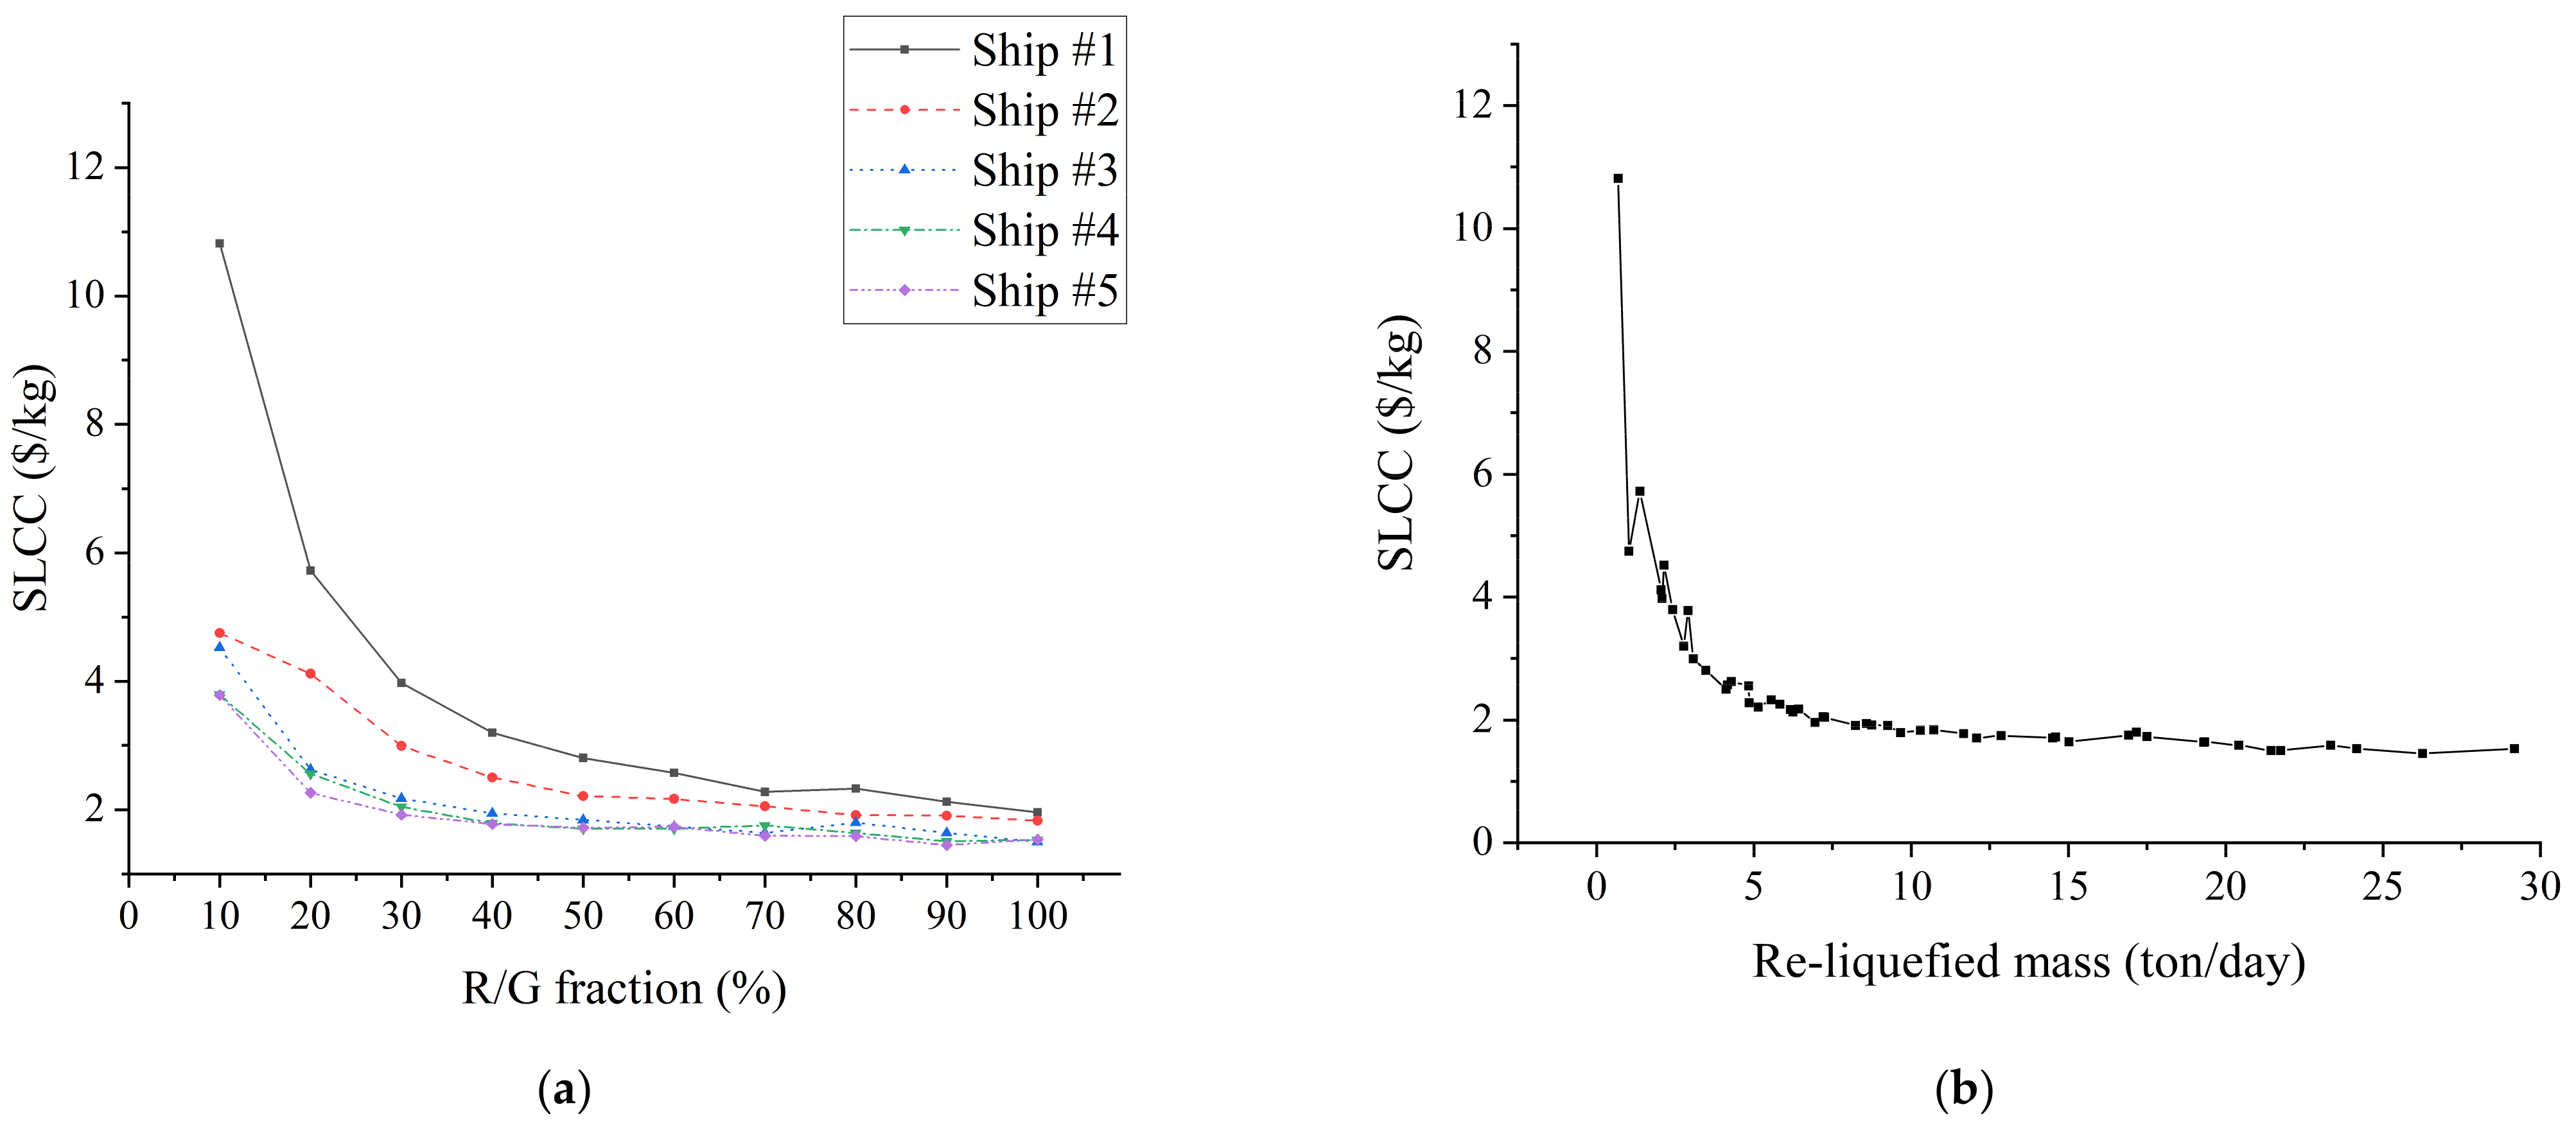
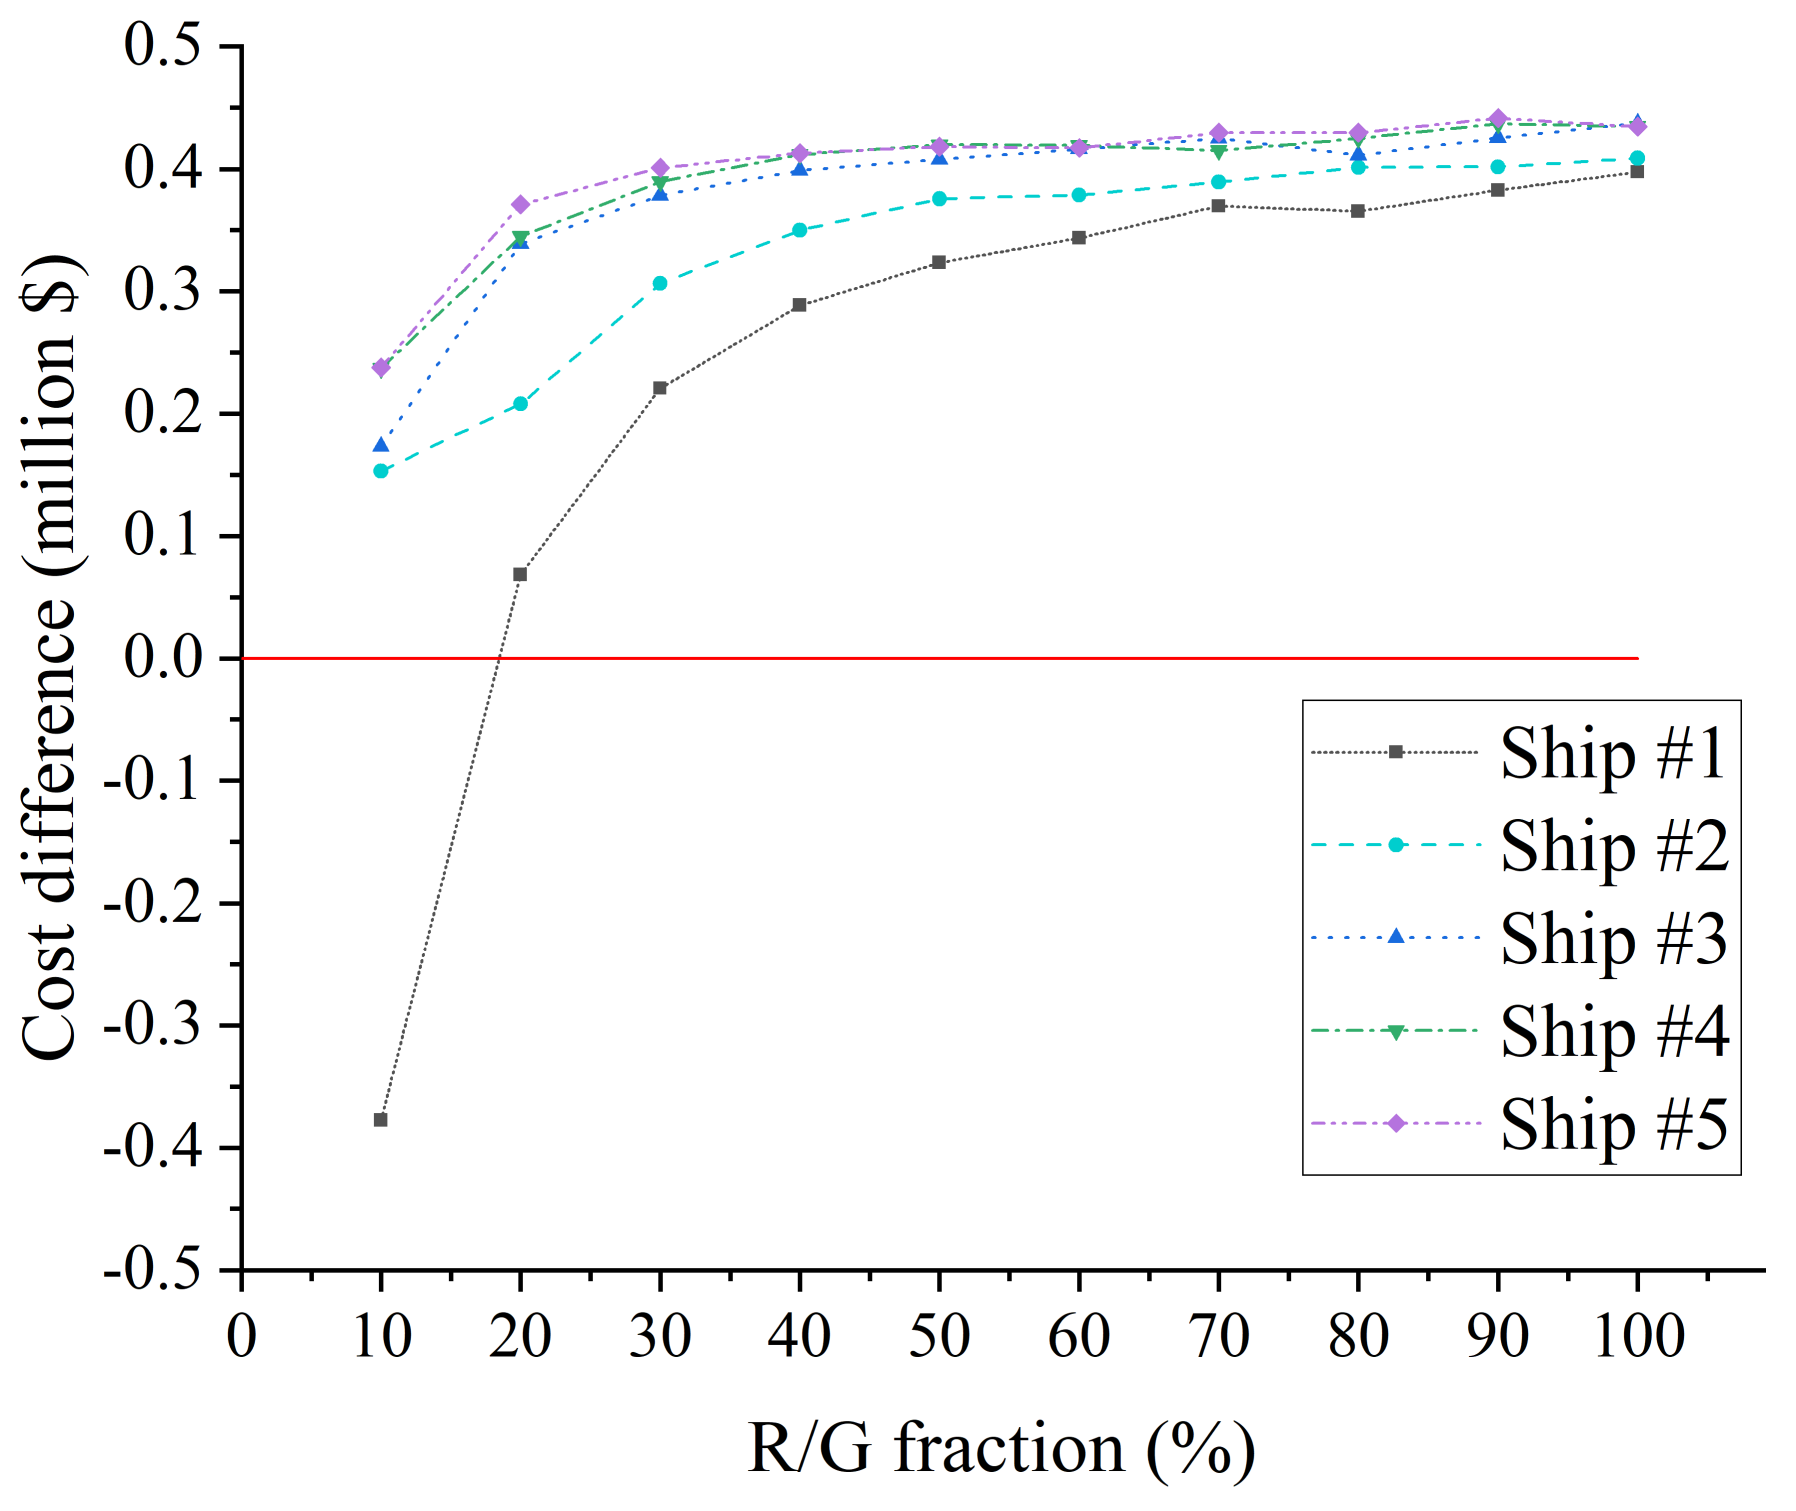
The system economics indicated that the re-liquefied mass of BOH is inversely proportional to the SLCC. The gradient of this decrease became smoother as the re-liquefied mass of BOH increased. When the re-liquefied mass of BOH was larger than 7200 kg/day, the SLCC was almost unchanged from 1.5 $/kg; this value is much lower than 6.50 $/kg, which is the assumed LH2 production cost.
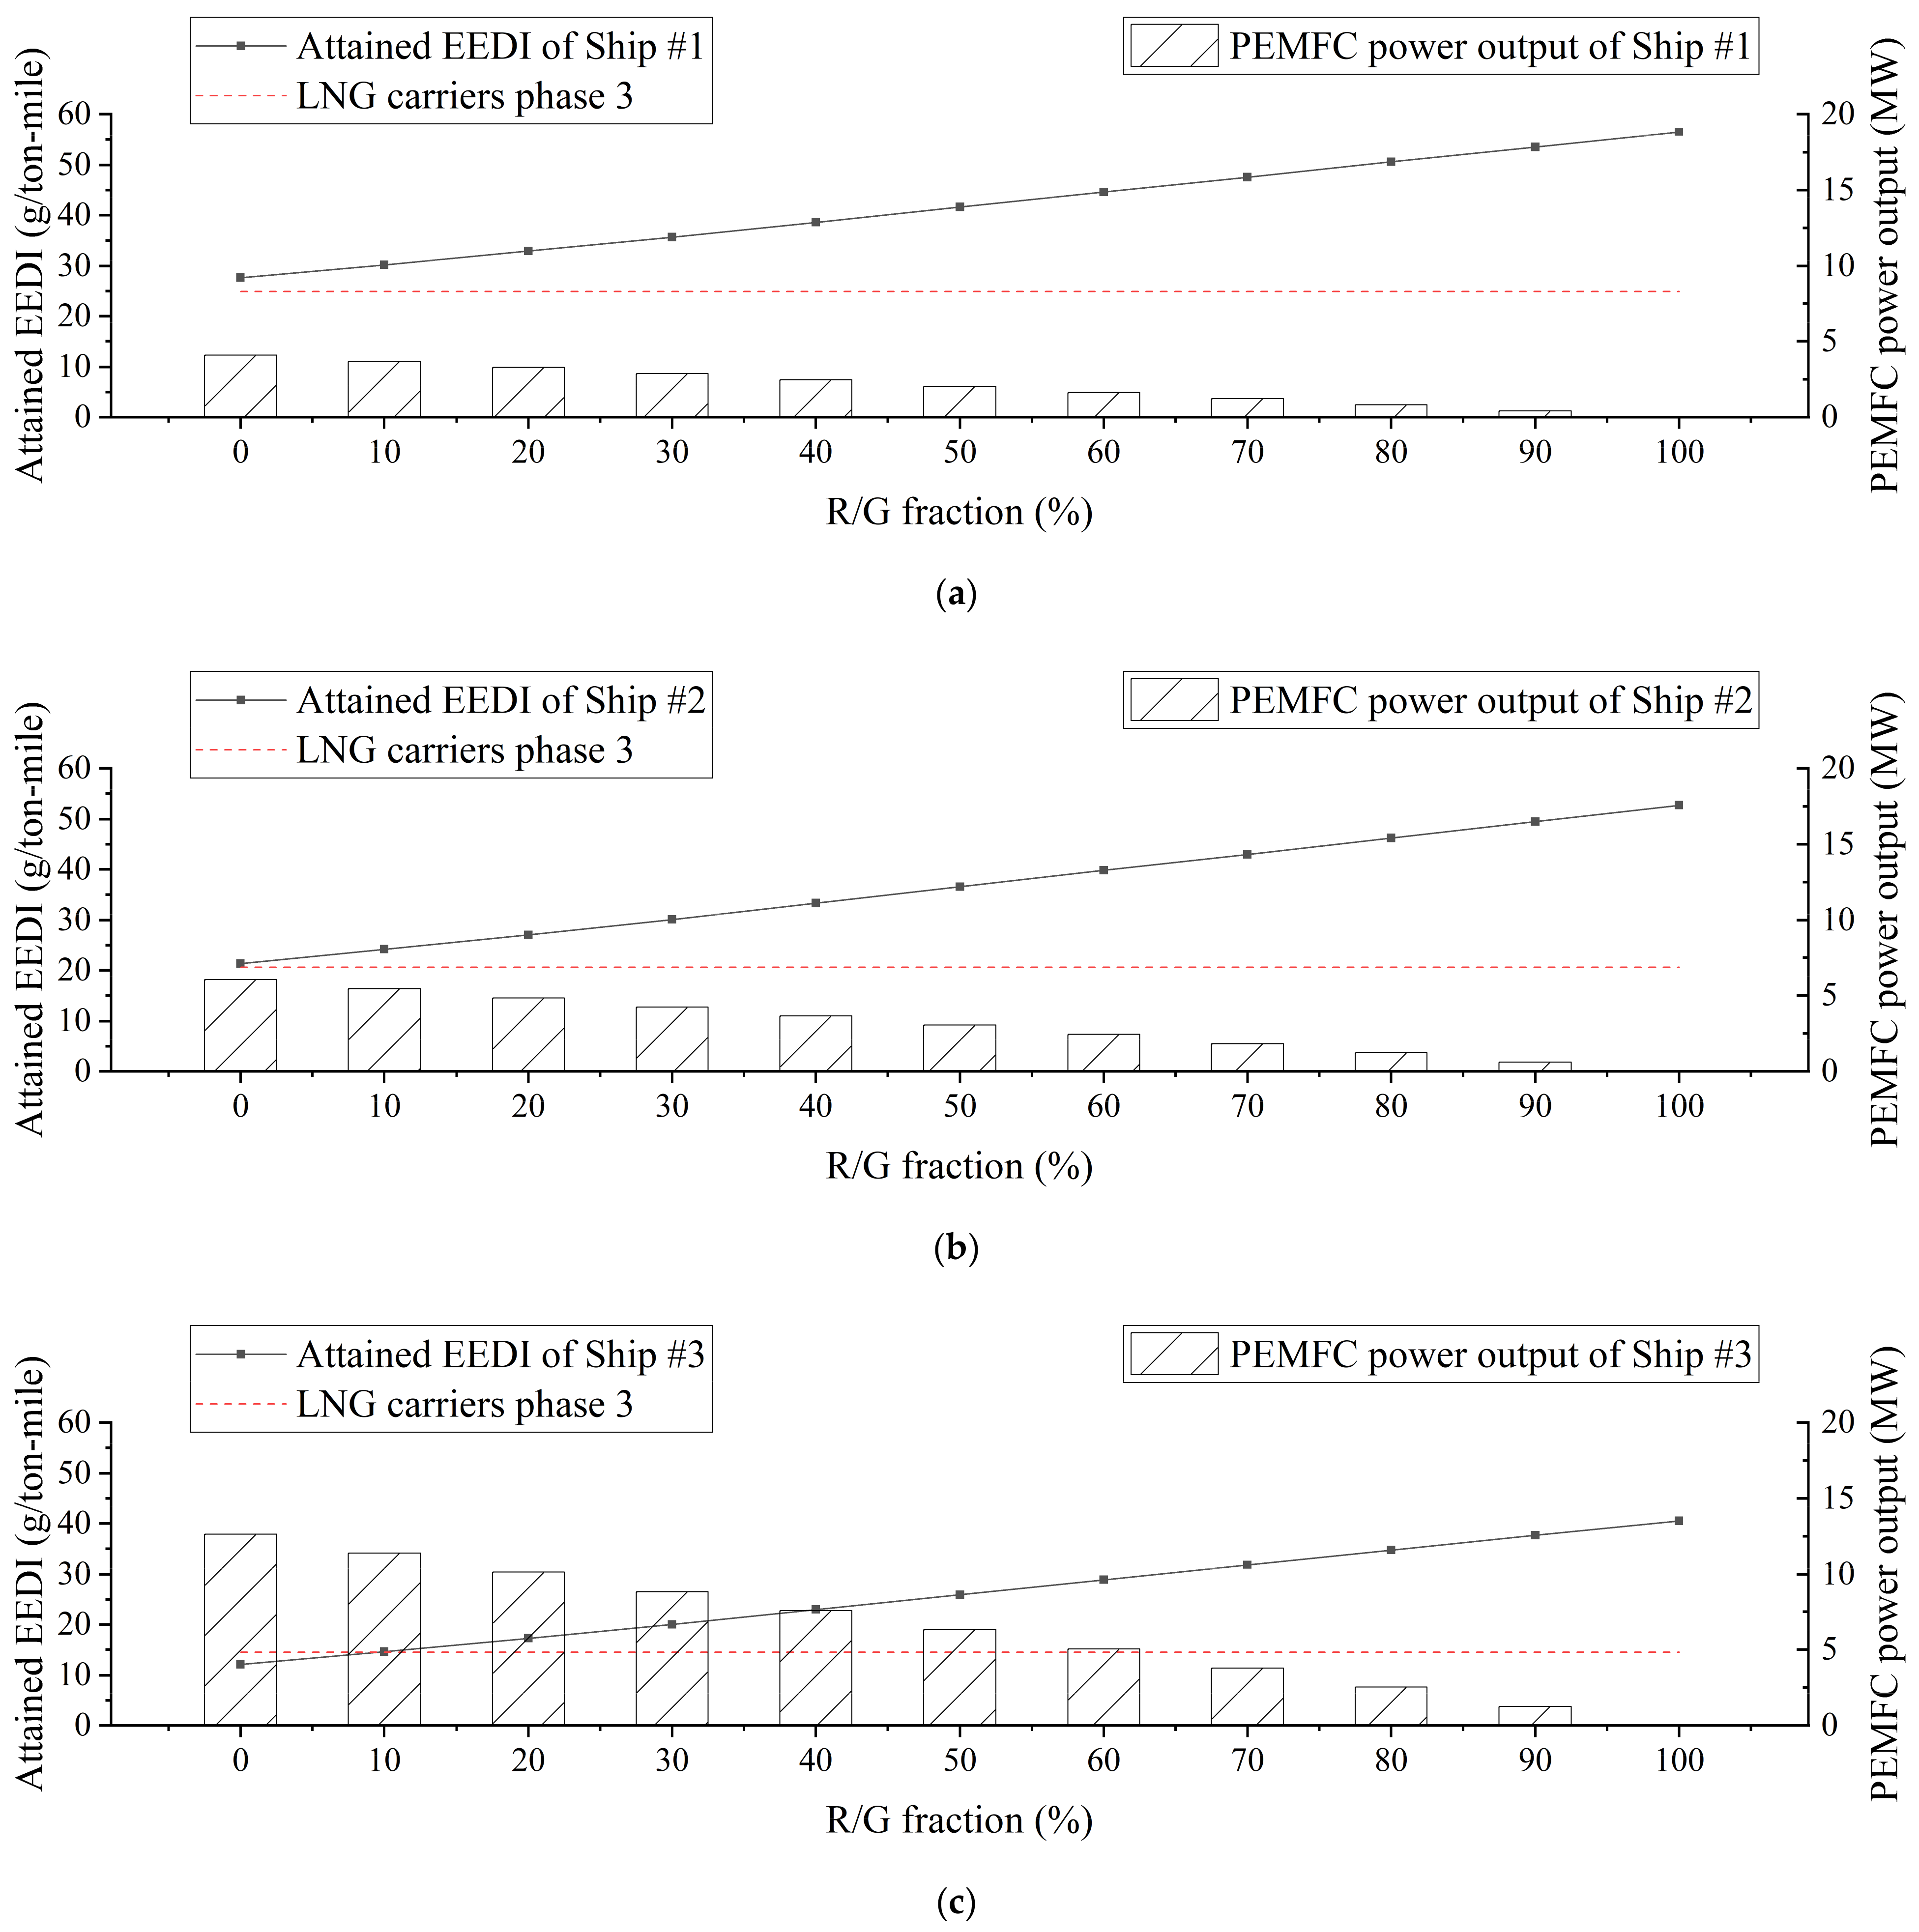
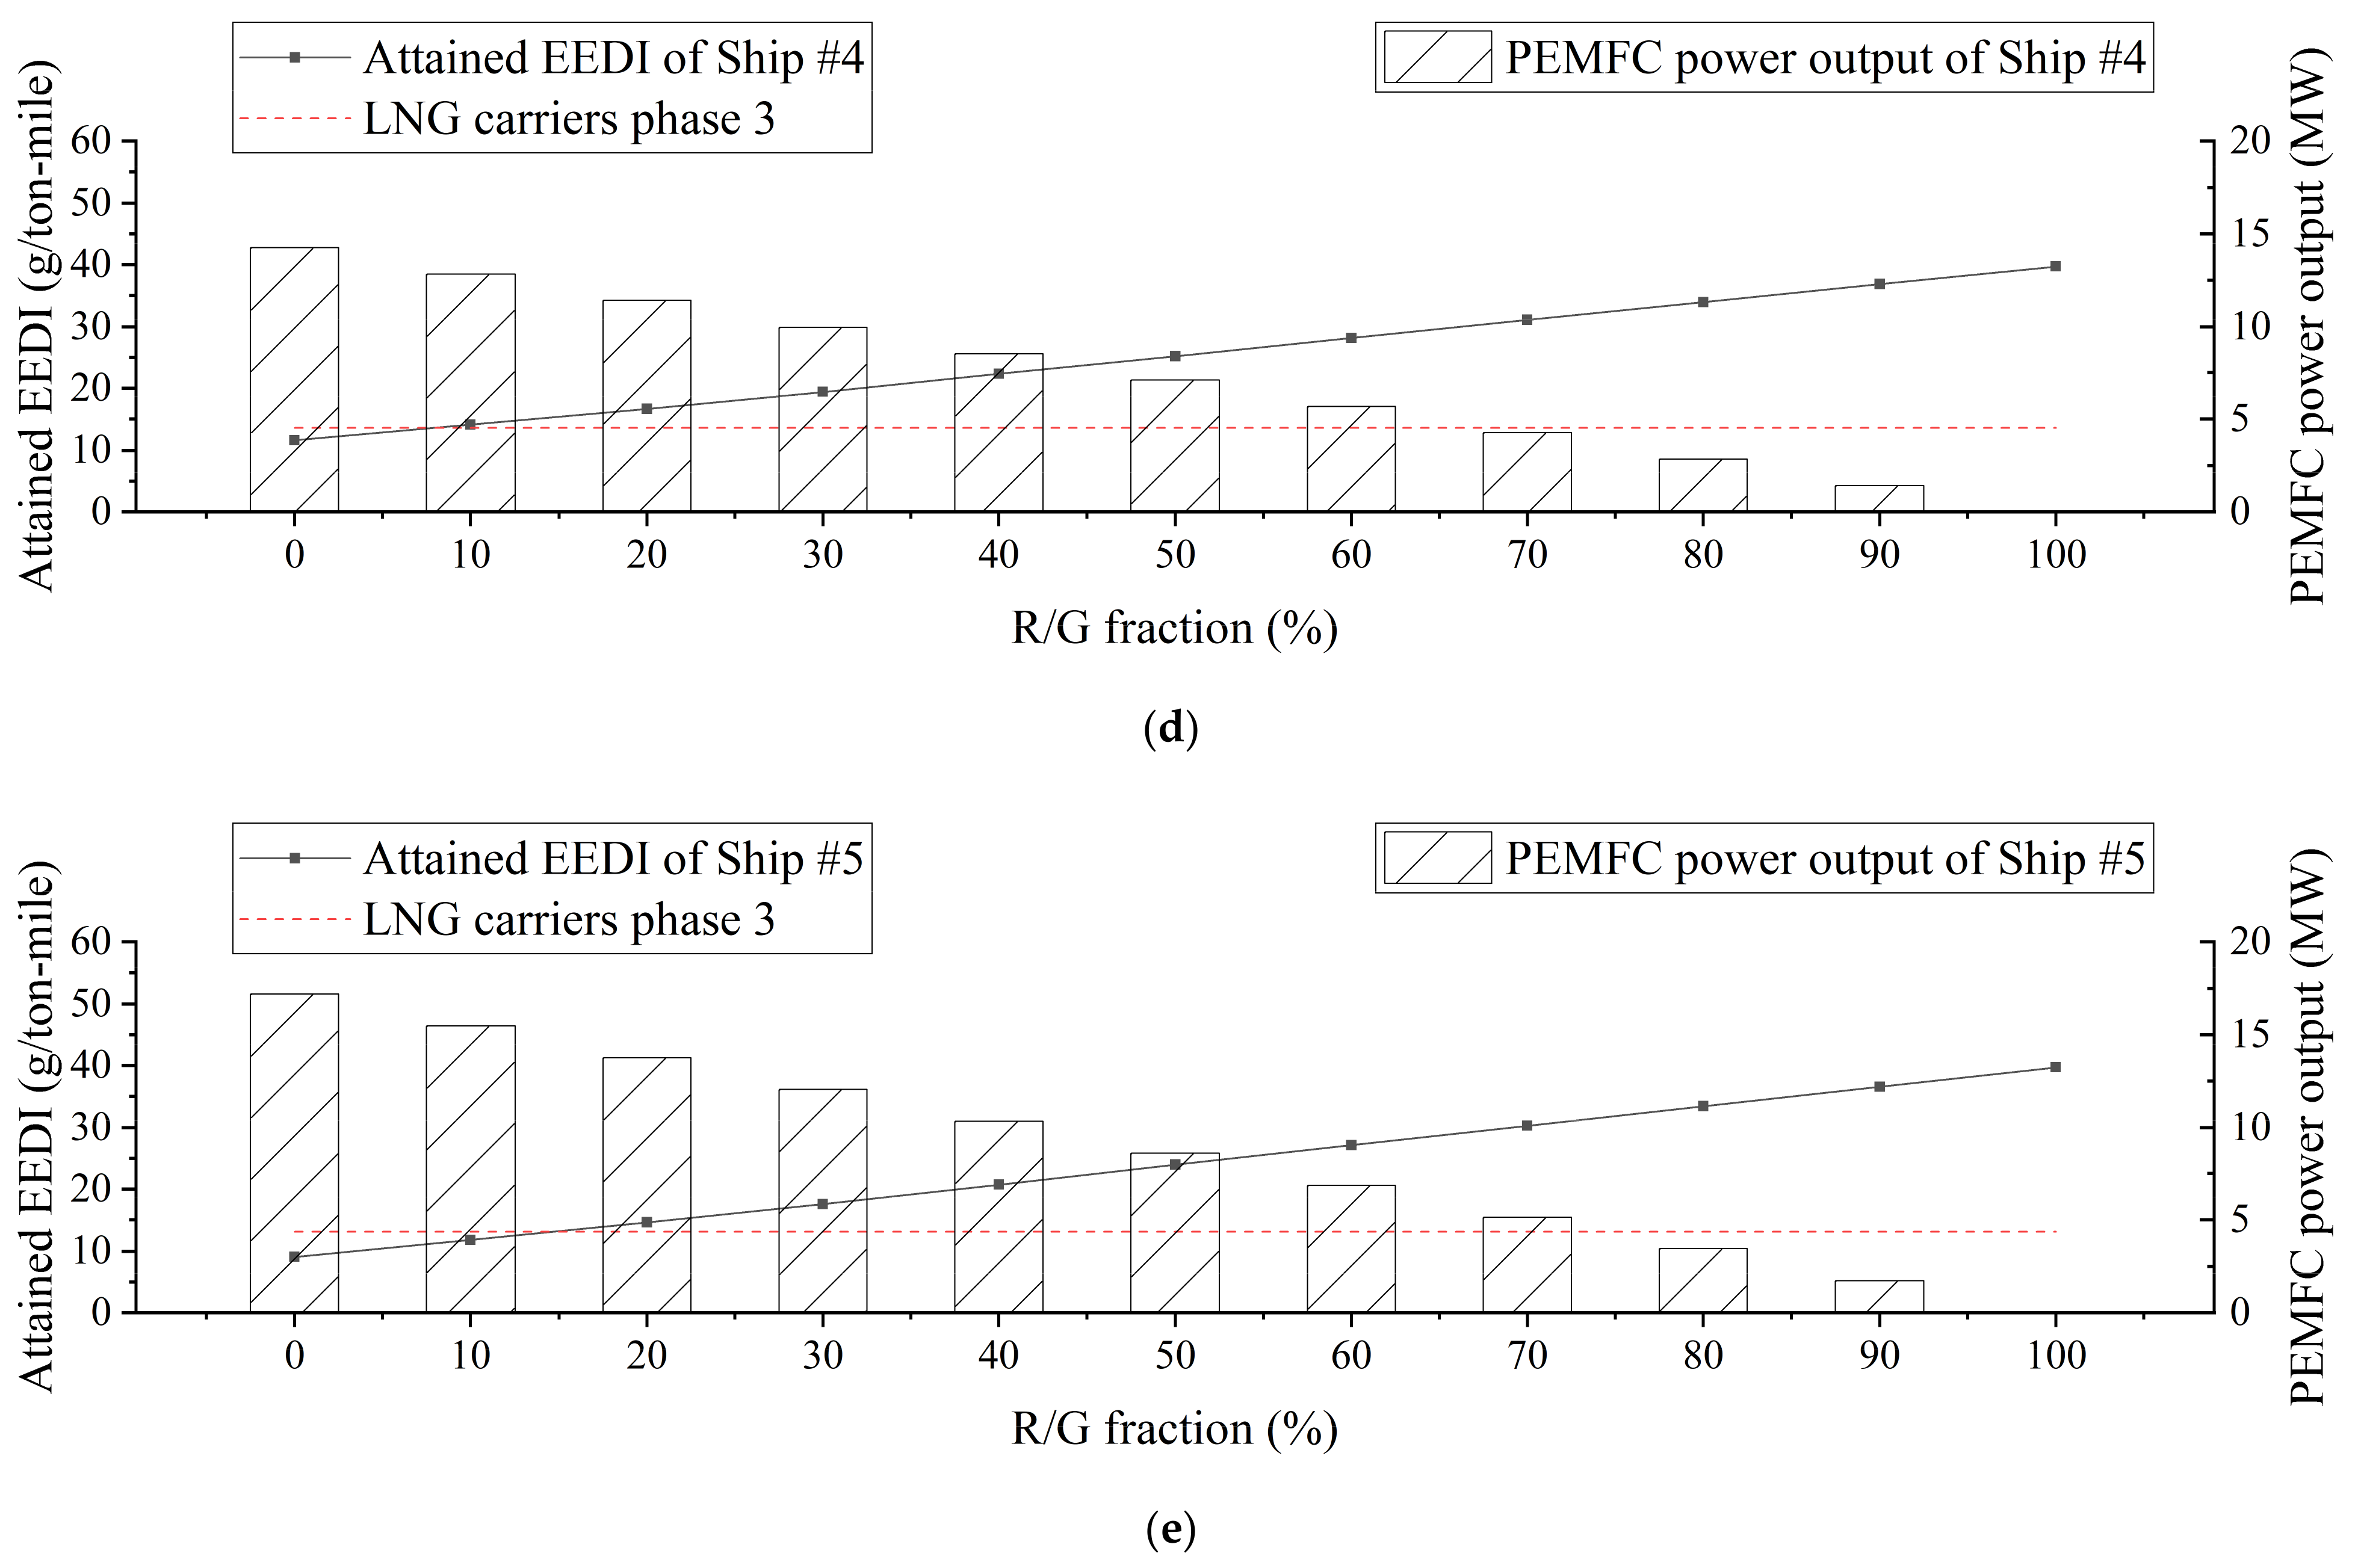
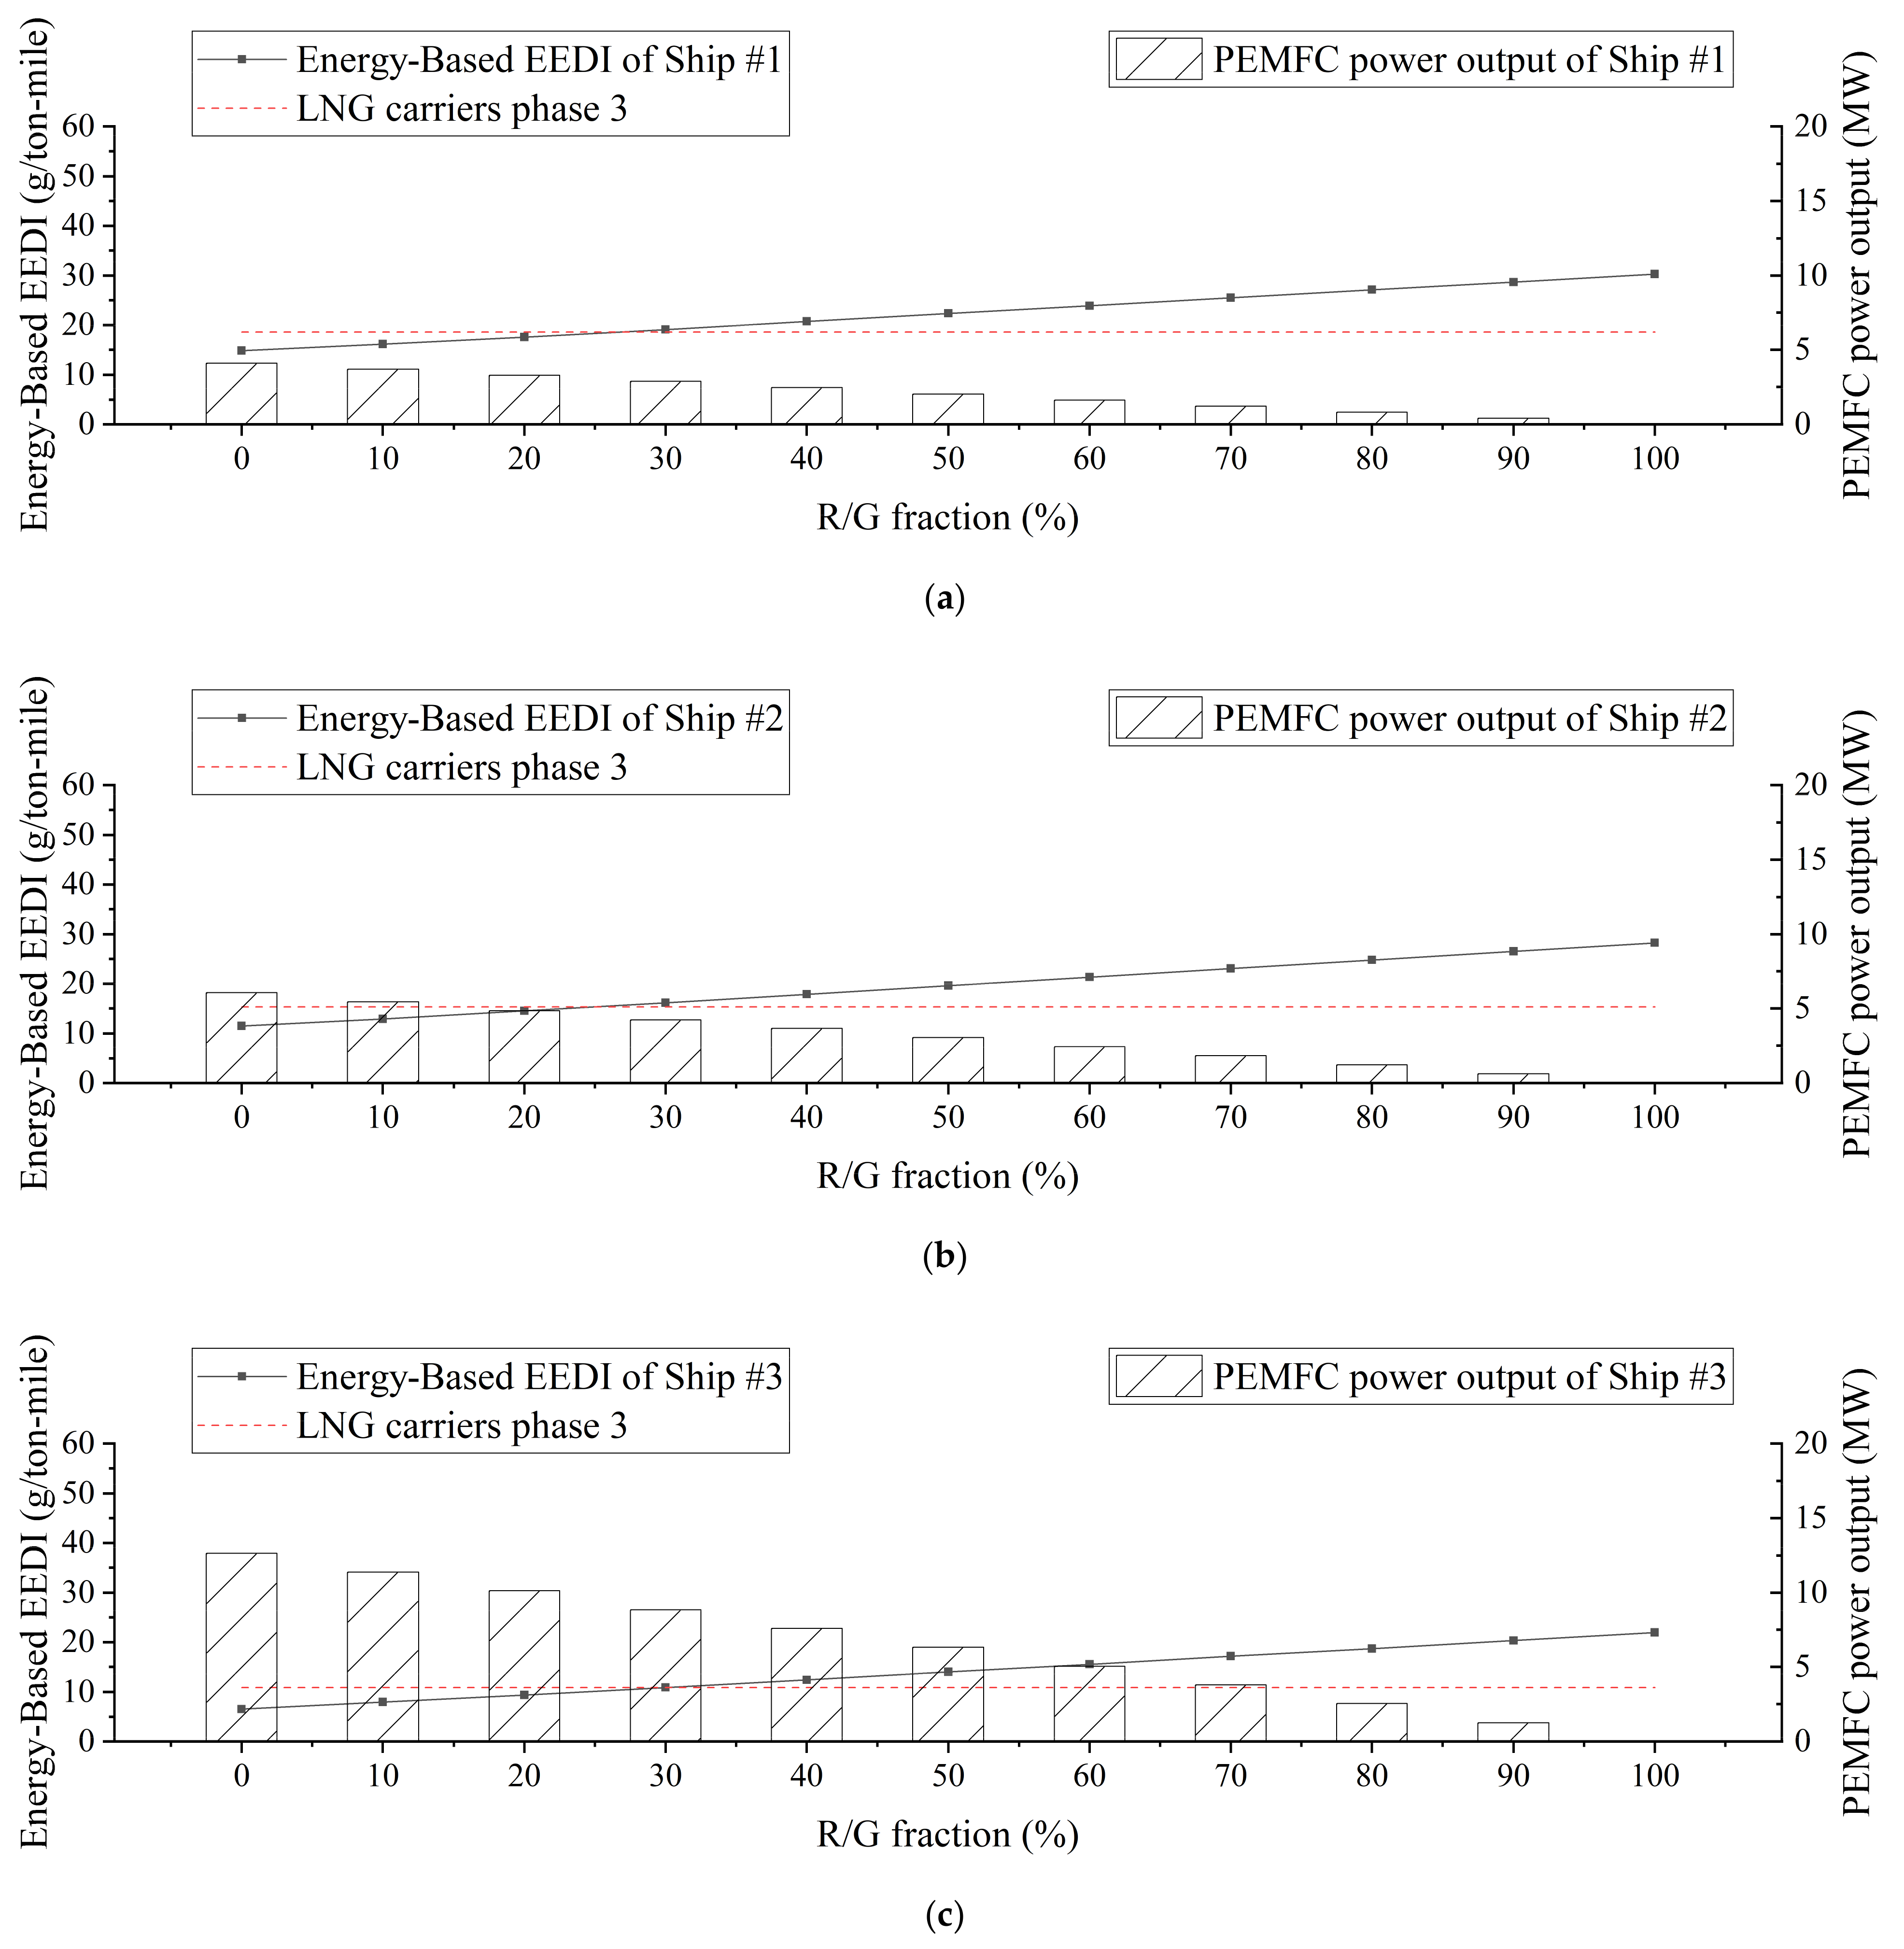
Considering EEDI candidate 1, the attained EEDI demonstrated that most of the BOH should not be re-liquefied when the required EEDI was evaluated based on the parameters of the LNG carrier for the required EEDI phase 3 with the same volumetric capacity. However, for EEDI candidate 2, it was shown that the permittable R/G fraction was between 25% and 33% considering energy-based EEDI and required EEDI phase 3. Finally, for EEDI candidate 3, the EEDI-free regulation of LH2 carriers was discussed considering the CO2-free characteristic of LH2. If the EEDI regulation is not used for LH2 carriers, the SLCC of the BOH re-liquefaction system decreases up to 68% compared to LNG carriers with equivalent EEDI regulations.

Author Contributions

Conceptualization, M.C., W.J. and S.L.; methodology, W.J. and T.J.; software, M.C.; validation, M.C. and W.J.; formal analysis, M.C.; investigation, M.C.; resources, T.J.; data curation, M.C.; writing—original draft preparation, M.C.; writing—review and editing, W.J.; visualization, M.C.; supervision, W.J. and D.C.; project administration, D.C.; funding acquisition, D.C. All authors have read and agreed to the published version of the manuscript.

Funding

This research was a part of the project titled ’Development of Safety and Control Standards for Hydrogen Ships: Cargo Handling and Fuel Gas Supply Systems’ (Grant number: 20200456), funded by the Ministry of Oceans and Fisheries, Korea.

Conflicts of Interest

The authors declare no conflict of interest.

Nomenclature

ScriptsDescription
W ˙ n e t Total work required to re-liquefy BOH (kW)
W ˙ C o m p   1 Work input for Comp 1 (kW)
W ˙ C o m p   2 Work input for Comp 2 (kW)
W ˙ E x p   1 Work output for Exp 1 (kW)
W ˙ E x p   2 Work output for Exp 2 (kW)
m ˙ B O H g e n e r a t i o n Mass flow of the generated BOH (kg/s)
m ˙ r e l i q e u f a c t i o n Mass flow of the re-liquefied BOH (kg/s)
E S Physical flow exergy of stream (kJ)
E T Thermal exergy of stream (kJ)
E M Mechanical exergy of stream (kJ)
H S Enthalpy of stream at present state (kJ)
H * * Enthalpy of stream at state ** (kJ)
H 0 Enthalpy of stream at dead state (kJ)
S S Entropy of stream at present state (kJ/K)
S * * Entropy of stream at state ** (kJ/K)
S 0 Entropy of stream at dead state (kJ/K)
T 0 Ambient temperature (K)
η e x Exergy efficiency
E ˙ B O H   t o   P E M F C i n Physical flow exergy of Stream 106 (kW)
E ˙ B O H   t o   P E M F C o u t Physical flow exergy of Stream 108 (kW)
E ˙ r e l i q u e f a c t i o n i n Physical flow exergy of Stream 102 (kW)
E ˙ r e l i q u e f a c t i o n o u t Physical flow exergy of Stream 105 (kW)
C O L Cost of the operator salary ($/yr)
C U T Cost of utilities ($/GJ)
C W T Cost of the cooling water ($/GJ)
E E D I a t t Attained EEDI (g/ton-mile)
P M E Power of the main engine (kW)
P A E Power of the auxiliary engine (kW)
C M E Conversion factor of the main engine between fuel consumption and CO2 emissions
C A E Conversion factor of the auxiliary engine between fuel consumption and CO2 emissions
S F C M E Specific fuel consumption of the main engine (g/kWh)
S F C A E Specific fuel consumption of the auxiliary engine (g/kWh)
D W T Deadweight of the ship (ton)
V r e f Speed of the ship (knot)
M P P m o t o r Rated output of the motor (kW)
η Product of the electrical efficiencies of the generator, transformer, converter, and motor
P P E M F C Electricity generated from the PEMFC (kW)
P r e l i q Power required for re-liquefaction (kW)
E E D I r e f Reference EEDI (g/ton-mile)
E E D I r e q Required EEDI (g/ton-mile)
D W T c a r g o Deadweight of cargo (ton)
D W T o t h e r Deadweight without cargo (ton)
D W T r e s c a l e d Re-scaled deadweight (ton)
L H V L H 2 Lower heating value of LH2 (MJ/kg)
L H V L N G Lower heating value of LNG (MJ/kg)
E E D I e n e r g y b a s e d Energy based EEDI (ton)
AbbreviationDescription
BOGBoil-off gas
BOHBoil-off hydrogen
CO2Carbon dioxide
IMOInternational Maritime Organization
LCCLife cycle cost ($)
LH2Liquid hydrogen
LNGLiquified natural gas
MEPCMarine Environment Protection Committee
PEMFCProton-exchange membrane fuel cell
R/G fractionRe-liquefaction-generation fraction (%)
SECSpecific energy consumption (kWh/kg)
SLCCSpecific life cycle cost ($/kg)

References

  1. NOAA’s Annual Greenhouse Gas Index. Available online: https://www.esrl.noaa.gov/gmd/aggi/ (accessed on 3 May 2021).
  2. Total Energy Supply (TES) by Source. Available online: https://www.iea.org/data-and-statistics/?country=WORLD&fuel=Energysupply&indicator=TPESbySource (accessed on 3 May 2021).
  3. Total CO2 Emissions. Available online: https://www.iea.org/data-and-statistics/?country=WORLD&fuel=CO2emissions&indicator=TotCO2 (accessed on 3 May 2021).
  4. Renewable Electricity Generation by Source (Non-Combustible). Available online: https://www.iea.org/data-and-statistics/?country=WORLD&fuel=Energysupply&indicator=RenewGenBySource (accessed on 3 May 2021).
  5. Share of Renewables in Power Generation in the Sustainable Development Scenario, 2000–2030. Available online: https://www.iea.org/data-and-statistics/charts/share-of-renewables-in-power-generation-in-the-sustainable-development-scenario-2000-2030 (accessed on 6 May 2021).
  6. Pethaiah, S.S.; Sadasivuni, K.K.; Jayakumar, A.; Ponnamma, D.; Tiwary, C.S.; Sasikumar, G. Methanol Electrolysis for Hydrogen Production Using Polymer Electrolyte Membrane: A Mini-Review. Energies 2020, 13, 5879. [Google Scholar] [CrossRef]
  7. Jayakumar, A. An Assessment on Polymer Electrolyte Membrane (PEM) Fuel Cell Stack Components; Apple Academic Press: Boca Raton, FL, USA, 2017; ISBN 9781771886062. [Google Scholar]
  8. Rosen, M.A.; Koohi-Fayegh, S. The prospects for hydrogen as an energy carrier: An overview of hydrogen energy and hydrogen energy systems. Energy Ecol. Environ. 2016, 1, 10–29. [Google Scholar] [CrossRef] [Green Version]
  9. Niaz, S.; Manzoor, T.; Pandith, A.H. Hydrogen storage: Materials, methods and perspectives. Renew. Sustain. Energy Rev. 2015, 50, 457–469. [Google Scholar] [CrossRef]
  10. Yanxing, Z.; Maoqiong, G.; Yuan, Z.; Xueqiang, D.; Jun, S. Thermodynamics analysis of hydrogen storage based on compressed gaseous hydrogen, liquid hydrogen and cryo-compressed hydrogen. Int. J. Hydrog. Energy 2019, 44, 16833–16840. [Google Scholar] [CrossRef]
  11. Notardonato, W.U.; Swanger, A.M.; Fesmire, J.E.; Jumper, K.M.; Johnson, W.L.; Tomsik, T.M. Zero boil-off methods for large-scale liquid hydrogen tanks using integrated refrigeration and storage. IOP Conf. Ser. Mater. Sci. Eng. 2017, 278, 012012. [Google Scholar] [CrossRef]
  12. Tan, H.; Zhao, Q.; Sun, N.; Li, Y. Enhancement of energy performance in a boil-off gas re-liquefaction system of LNG carriers using ejectors. Energy Convers. Manag. 2016, 126, 875–888. [Google Scholar] [CrossRef]
  13. Choi, J. Development of partial liquefaction system for liquefied natural gas carrier application using exergy analysis. Int. J. Nav. Archit. Ocean Eng. 2018, 10, 609–616. [Google Scholar] [CrossRef]
  14. Sayyaadi, H.; Babaelahi, M. Multi-objective optimization of a joule cycle for re-liquefaction of the Liquefied Natural Gas. Appl. Energy 2011, 88, 3012–3021. [Google Scholar] [CrossRef]
  15. Kim, D.; Hwang, C.; Gundersen, T.; Lim, Y. Process design and economic optimization of boil-off-gas re-liquefaction systems for LNG carriers. Energy 2019, 173, 1119–1129. [Google Scholar] [CrossRef]
  16. Romero, J.; Orosa, J.A.; Oliveira, A.C. Research on the Brayton cycle design conditions for reliquefaction cooling of LNG boil off. J. Mar. Sci. Technol. 2012, 17, 532–541. [Google Scholar] [CrossRef]
  17. Kwak, D.H.; Heo, J.H.; Park, S.H.; Seo, S.J.; Kim, J.K. Energy-efficient design and optimization of boil-off gas (BOG) re-liquefaction process for liquefied natural gas (LNG)-fuelled ship. Energy 2018, 148, 915–929. [Google Scholar] [CrossRef]
  18. Yin, L.; Ju, Y.L. Comparison and analysis of two nitrogen expansion cycles for BOG Re-liquefaction systems for small LNG ships. Energy 2019, 172, 769–776. [Google Scholar] [CrossRef]
  19. Sayyaadi, H.; Babaelahi, M. Thermoeconomic optimization of a cryogenic refrigeration cycle for re-liquefaction of the LNG boil-off gas. Int. J. Refrig. 2010, 33, 1197–1207. [Google Scholar] [CrossRef]
  20. Krasae-in, S.; Stang, J.H.; Neksa, P. Development of large-scale hydrogen liquefaction processes from 1898 to 2009. Int. J. Hydrogen Energy 2010, 35, 4524–4533. [Google Scholar] [CrossRef]
  21. Krasae-In, S.; Stang, J.H.; Neksa, P. Exergy analysis on the simulation of a small-scale hydrogen liquefaction test rig with a multi-component refrigerant refrigeration system. Int. J. Hydrog. Energy 2010, 35, 8030–8042. [Google Scholar] [CrossRef]
  22. Ratlamwala, T.A.H.; Dincer, I.; Gadalla, M.A. Thermodynamic analysis of a novel integrated geothermal based power generation-quadruple effect absorption cooling-hydrogen liquefaction system. Int. J. Hydrog. Energy 2012, 37, 5840–5849. [Google Scholar] [CrossRef]
  23. Chang, H.M.; Ryu, K.N.; Baik, J.H. Thermodynamic design of hydrogen liquefaction systems with helium or neon Brayton refrigerator. Cryogenics 2018, 91, 68–76. [Google Scholar] [CrossRef]
  24. Asadnia, M.; Mehrpooya, M. A novel hydrogen liquefaction process configuration with combined mixed refrigerant systems. Int. J. Hydrog. Energy 2017, 42, 15564–15585. [Google Scholar] [CrossRef]
  25. Sadaghiani, M.S.; Mehrpooya, M. Introducing and energy analysis of a novel cryogenic hydrogen liquefaction process configuration. Int. J. Hydrog. Energy 2017, 42, 6033–6050. [Google Scholar] [CrossRef]
  26. Chang, H.M.; Kim, B.H.; Choi, B. Hydrogen liquefaction process with Brayton refrigeration cycle to utilize the cold energy of LNG. Cryogenics 2020, 108, 103093. [Google Scholar] [CrossRef]
  27. Yuksel, Y.E.; Ozturk, M.; Dincer, I. Analysis and assessment of a novel hydrogen liquefaction process. Int. J. Hydrog. Energy 2017, 42, 11429–11438. [Google Scholar] [CrossRef]
  28. Lee, H.; Shao, Y.; Lee, S.; Roh, G.; Chun, K.; Kang, H. Analysis and assessment of partial re-liquefaction system for liquefied hydrogen tankers using liquefied natural gas (LNG)and H2 hybrid propulsion. Int. J. Hydrog. Energy 2019, 44, 15056–15071. [Google Scholar] [CrossRef]
  29. Ishimoto, Y.; Voldsund, M.; Nekså, P.; Roussanaly, S.; Berstad, D.; Gardarsdottir, S.O. Large-scale production and transport of hydrogen from Norway to Europe and Japan: Value chain analysis and comparison of liquid hydrogen and ammonia as energy carriers. Int. J. Hydrog. Energy 2020, 45, 32865–32883. [Google Scholar] [CrossRef]
  30. Bejan, A. Advanced Engineering Thermodynamics, 3rd ed.; John Wiley & Sons: Hoboken, NJ, USA, 2006; ISBN 9781119245964. [Google Scholar]
  31. Morosuk, T.; Tsatsaronis, G. Splitting physical exergy: Theory and application. Energy 2019, 167, 698–707. [Google Scholar] [CrossRef]
  32. Tsatsaronis, G.; Morosuk, T. Advanced exergetic analysis of a novel system for generating electricity and vaporizing liquefied natural gas. Energy 2010, 35, 820–829. [Google Scholar] [CrossRef]
  33. Turton, R.; Bailie, R.C.; Whiting, W.B.; Shaeiwitz, J.A. Analysis, Synthesis and Design of Chemical Processes, 4th ed.; Prentice Hall: Upper Saddle River, NJ, USA, 2012. [Google Scholar]
  34. Federal Energy Regulatory Commission Market Assessments. Available online: https://cms.ferc.gov/sites/default/files/2020-11/ngas-ovr-archive.pdf (accessed on 10 May 2021).
  35. Moreno, N.G.; Molina, M.C.; Gervasio, D.; Robles, J.F.P. Approaches to polymer electrolyte membrane fuel cells (PEMFCs) and their cost. Renew. Sustain. Energy Rev. 2015, 52, 897–906. [Google Scholar] [CrossRef]
  36. 2018 Guidelines on The Method of Calculation of The Attained Energy Efficiency Design Index (Eedi) for New Ships. Available online: https://wwwcdn.imo.org/localresources/en/KnowledgeCentre/IndexofIMOResolutions/MEPCDocuments/MEPC.308(73).pdf (accessed on 6 May 2021).
  37. Jeong, J.; Seo, S.; You, H.; Chang, D. Comparative analysis of a hybrid propulsion using LNG-LH2 complying with regulations on emissions. Int. J. Hydrog. Energy 2018, 43, 3809–3821. [Google Scholar] [CrossRef]
  38. Clarksons Research. Available online: https://www.clarksons.net/portal/ (accessed on 20 July 2021).
  39. Connelly, E.; Penev, M.; Elgowainy, A.; Hunter, C. Current Status of Hydrogen Liquefaction Costs. Available online: https://www.hydrogen.energy.gov/pdfs/19001_hydrogen_liquefaction_costs.pdf (accessed on 6 May 2021).
  40. Vickers, J.; Peterson, D.; Randolph, K. Cost of Electrolytic Hydrogen Production with Existing Technology. Available online: https://www.hydrogen.energy.gov/pdfs/20004-cost-electrolytic-hydrogen-production.pdf (accessed on 6 May 2021).
Figure 1. Process flow diagram of the proposed system.
Energies 14 04566 g001
Figure 2. Composition of CAPEX.
Energies 14 04566 g002
Figure 3. Composition of OPEX.
Energies 14 04566 g003
Figure 4. SEC with varying R/G fraction.
Energies 14 04566 g004
Figure 5. Exergy efficiency with varied R/G fractions.
Energies 14 04566 g005
Figure 6. Specific exergy loss with varied R/G fractions.
Energies 14 04566 g006
Figure 7. Life cycle cost structures of (a) Ship #1, (b) Ship #2, (c) Ship #3, (d) Ship #4, and (e) Ship #5.
Energies 14 04566 g007
Figure 8. SLCC for each ship with varied (a) R/G fractions and (b) re-liquefied masses.
Energies 14 04566 g008
Figure 9. Cost difference with varied R/G fractions during the voyage.
Energies 14 04566 g009
Figure 10. Attained EEDIs for (a) Ship #1, (b) Ship #2, (c) Ship #3, (d) Ship #4, and (e) Ship #5 using EEDI candidate 1.
Energies 14 04566 g010aEnergies 14 04566 g010b
Figure 11. Energy-based EEDIs for (a) Ship #1, (b) Ship #2, (c) Ship #3, (d) Ship #4, and (e) Ship #5 using EEDI candidate 2.
Energies 14 04566 g011aEnergies 14 04566 g011b
Table 1. Boundary conditions of the BOH re-liquefaction cycle.
ItemUnitValue
Cargo LH2 densitykg/m370.83
Boil off rate%/day0.2 [29]
BOH inlet temperatureK80
BOH outlet temperatureK20
BOH pressurebar1.013
Table 2. Cost values for CAPEX and OPEX estimation.
ItemUnitValue
Operator salary$/yr59,580 [33]
Cooling water cost$/MWh243.68 [33]
Electricity$/MWh26.59 [34]
PEMFC system$/kW100 [35]
Table 3. Parameters and variables for the required EEDI of LNG carriers.
Ship TypeabcX
LNG carrier2253.70Deadweight (tons)0.4740.3 (Phase 3)
Table 4. Densities and lower heating values of LH2 and LNG.
ItemUnitsLNGLH2Ratio of LH2/LNG
Densitykg/m3437.8970.830.16
Gravimetric lower heating valueMWh/kg12.9233.332.58
Volumetric lower heating valueMWh/m35660.942360.410.42
Table 5. Specifications of the ship assumptions.
ShipCargo Capacity
(m3)
Speed
(knots)
MPP
(MW)
Dead Weight
(tons)
Ship #150,0001911.496300
Ship #274,00017.514.029400
Ship #3154,0001923.4019,800
Ship #4174,0001926.0023,000
Ship #5210,00019.527.6824,400
Table 6. Summary of the voyage conditions from Darwin to Pyeongtaek.
ItemUnitValue
Distancekm5600
Voyage timedays7
Loading timedays2
Unloading timedays2
BOR%/day0.2
Table 7. BOH generation during voyage.
VoyageShipUnitValue
Laden voyageShip #1kg/day6400
Ship #2kg/day9500
Ship #3kg/day19,900
Ship #4kg/day22,400
Ship #5kg/day27,000
Ballast voyageShip #1kg/day2600
Ship #2kg/day3800
Ship #3kg/day7900
Ship #4kg/day9000
Ship #5kg/day10,800
Table 8. Total amount of BOH during voyage.
VoyageCaseUnitValue
Laden voyageShip #1Tons58
Ship #2Tons86
Ship #3Tons179
Ship #4Tons201
Ship #5Tons243
Ballast voyageShip #1Tons23
Ship #2Tons34
Ship #3Tons72
Ship #4Tons81
Ship #5Tons97
Table 9. LH2 production cost assumption.
ItemUnitValue
LH2 production cost$/kg6.50
Table 10. Permittable R/G fractions of the LH2 carriers according to EEDI candidate 1.
CasePermittable R/G Fraction (%)
Ship #1No re-liquefaction
Ship #2No re-liquefaction
Ship #39.37
Ship #48.20
Ship #514.81
Table 11. Permittable R/G fractions of the LH2 carriers according to EEDI candidate 2.
CasePermittable R/G Fraction (%)
Ship #126.20
Ship #225.45
Ship #330.00
Ship #427.79
Ship #533.35
Table 12. SLCCs for the permittable R/G fractions obtained using each EEDI candidate.
SLCC with EEDI Candidate ($/kg)Ship #1Ship #2Ship #3Ship #4Ship #5
EEDI Candidate 1--4.644.013.05
EEDI Candidate 24.643.512.182.161.87
EEDI Candidate 31.961.831.501.531.53
Publisher’s Note: MDPI stays neutral with regard to jurisdictional claims in published maps and institutional affiliations.

