Article

Influence of Population Income on Energy Consumption for Heating and Its CO2 Emissions in Cities

by
Pedro J. Zarco-Periñán
1,*,
Irene M. Zarco-Soto
1,
Fco. Javier Zarco-Soto
1 and
Rafael Sánchez-Durán
2
1
Departamento de Ingeniería Eléctrica, Escuela Superior de Ingeniería, Universidad de Sevilla, Camino de los Descubrimientos, s/n, 41092 Sevilla, Spain
2
Endesa, Avenida de la Borbolla, 5, 41004 Sevilla, Spain
*
Author to whom correspondence should be addressed.
Energies 2021, 14(15), 4531; https://doi.org/10.3390/en14154531
Submission received: 4 July 2021 / Revised: 19 July 2021 / Accepted: 23 July 2021 / Published: 27 July 2021

Abstract

:
As a result of the increase in city populations, and the high energy consumption and emissions of buildings, cities in general, and buildings in particular, are the focus of attention for public organizations and utilities. Heating is among the largest consumers of energy in buildings. This study examined the influence of the income of inhabitants on the consumption of energy for heating and the CO2 emissions in city buildings. The study was carried out using equivalized disposable income as the basis for the analysis and considered the economies of scale of households. The results are shown per inhabitant and household, by independently considering each city. Furthermore, to more clearly identify the influence of the population income, the study was also carried out without considering the influence of the climate. The method was implemented in the case of Spain. For this purpose, Spanish cities with more than 50,000 inhabitants were analyzed. The results show that, both per inhabitant and per household, the higher the income of the inhabitants, the greater the consumption of energy for heating and the greater the emissions in the city. This research aimed to help energy utilities and policy makers make appropriate decisions, namely, planning for the development of facilities that do not produce greenhouse gases, and enacting laws to achieve sustainable economies, respectively. The overall aim is to achieve the objective of mitigating the impact of emissions and the scarcity of energy resources.

1. Introduction

1.1. Overview

In 2014, 54% of the world’s population lived in cities, and it is projected that by 2050, that number will reach 67%. In Europe and North America, more than 80% of the population will live in cities [1]. Currently, between 60% and 80% of energy is consumed in cities where, in addition, CO2 emissions account for 75% of the total [2]. From this perspective, buildings are the most important energy consumers in cities, in both the residential sector and the tertiary sector (businesses and activities that provide services but do not produce goods, such as banks, stores, government buildings, etc.). These sectors are responsible for the consumption of 36% of energy and the production of 40% of emissions [3]. The two usual forms of energy consumption in buildings are electrical and thermal in the form of natural gas [4], which is used for heating [5]. Specifically, this form of energy accounts for 45% of energy consumption in the OECD [6]. These factors highlight the importance of city buildings for both policy makers and utilities, in terms of legislation for more efficient consumption of energy and lower production of emissions, and appropriate planning of facilities using renewable energy to mitigate the scarcity of energy resources, respectively.
At the global level, this importance is reflected in the Sustainable Development Goals of the United Nations [7]. Specifically, Goal 11 is exclusive to cities: make cities and human settlements inclusive, safe, resilient, and sustainable. However, the above issues are also reflected in Goals 7 (regarding the use of renewable energies), 12 (regarding sustainable and responsible use), and 13 (regarding the reduction of CO2 emissions) [2]. At the European level, The European Green Deal was established to make Europe a climate neutral continent by 2050 [8]. In addition, Next Generation EU, a EUR 750 billion recovery plan, has been launched, in which buildings are among its priority fields of action [9]. This plan focuses on The European Green Deal and is also a response to the COVID-19 pandemic, which has mainly affected cities [10].

1.2. Literature Review

The main focus of this research is the consumption of energy for heating in the form of natural gas, and its relationship with population income and CO2 emissions. For this reason, the following review of the literature was carried out in terms of these three perspectives, the relationship between them, and the novelty of this study in relation to the existing research.
Studies have examined the more efficient use of energy in buildings and the reduction in their emissions. The importance placed on these issues by society is reflected in the increase in the number of these studies. Thus, in the period from 2007 to 2017, their number increased from 9 to 82 [11]. Building envelopes and their influence on energy consumption have been investigated in different types of buildings, namely, non-residential buildings [12]; residential buildings in rural [13] or urban [14] areas; and low-income houses [15]. The conclusion is that by improving the thermal insulation of the building envelope, energy consumption is reduced. The relationship between buildings and the health of occupants has also been studied. Inadequate indoor temperatures imply poor health, and particularly respiratory, cardiovascular, and mental health disorders [16].
Thermal energy in the form of natural gas is commonly used for heating in buildings. Conclusions can thus be drawn about how to reduce natural gas consumption and emissions. The studies carried out on this type of energy have been focused on predicting its daily demand at a global level [17], and at the level of a particular sector, such as residential [18] or residential and commercial [19] sectors. Artificial neural networks [20] and learning methods [21] are among the methods most commonly used to undertake demand prediction.
Gross domestic product (GDP), rather than the income of the population, is usually included in the variables used to make these predictions. Because GDP is a more general variable than income, it does not allow analysis at a more specific level of detail. However, the income variable has been used to analyze the detail of the thermal conditions of the low-income segment in some countries [22].
Regarding the use of GDP, certain studies have used the GDP variable to predict demand, although it is usually used with others, such as price [23], heating degree days [24], population [25], and urbanization [26]. Other studies analyzed the influence of different variables on each other, such as gas consumption and GDP. The conclusion they reached is that the elasticity of gas demand is very low; that is, consumers do not respond to price changes by adapting their consumption or using other sources of energy [27].
Regarding CO2 emissions, studies have examined the emissions produced in buildings in general, without specifically examining those that come from heating. Studies that have taken natural gas into account as an energy source have analyzed the emissions produced in distributed generation projects [28], or the differences in emissions when district heating systems or heat pumps are used for heating in buildings [29].
However, as was the case with consumption, most studies that analyze emissions have focused on the influence of different variables on each other. Among these, rather than income, GDP has again been used, but in this case, it has been related to energy consumption in general [30,31,32], and few studies have related it to gas consumption in particular [33]. Population is another of the commonly used variables. In two studies comprising a group of 83 countries [34] and the OECD countries [35], the results show that the higher the income, the greater the emissions.
The geographical scope of the studies is relatively wide, and does not focus on local detail. At the country level, household emissions in Ireland [36], and France and the USA [37], have been investigated. The conclusion of both studies is that the higher the income, the greater the emissions. Other studies at the national level have been carried out for China [38] and a group of 170 countries [39]. However, analysis of emissions at the city level has only been carried out for 10 cities considering technical and geophysical factors [40]. In addition, the complete CO2 emissions of the households of four Chinese cities, in both their urban and rural areas, have been analyzed. The conclusions indicate that emissions are higher in urban areas than in rural areas [41].
The above review indicates that, to the best of the knowledge of the authors, the previous studies have not addressed the analysis of energy consumption for heating and its CO2 emissions in cities using the approach undertaken in the current research: at the income level of the population, considering the cities independently, and eliminating the influence of the climate. Hence, the authors consider this study to be novel.

1.3. Aim of the Research
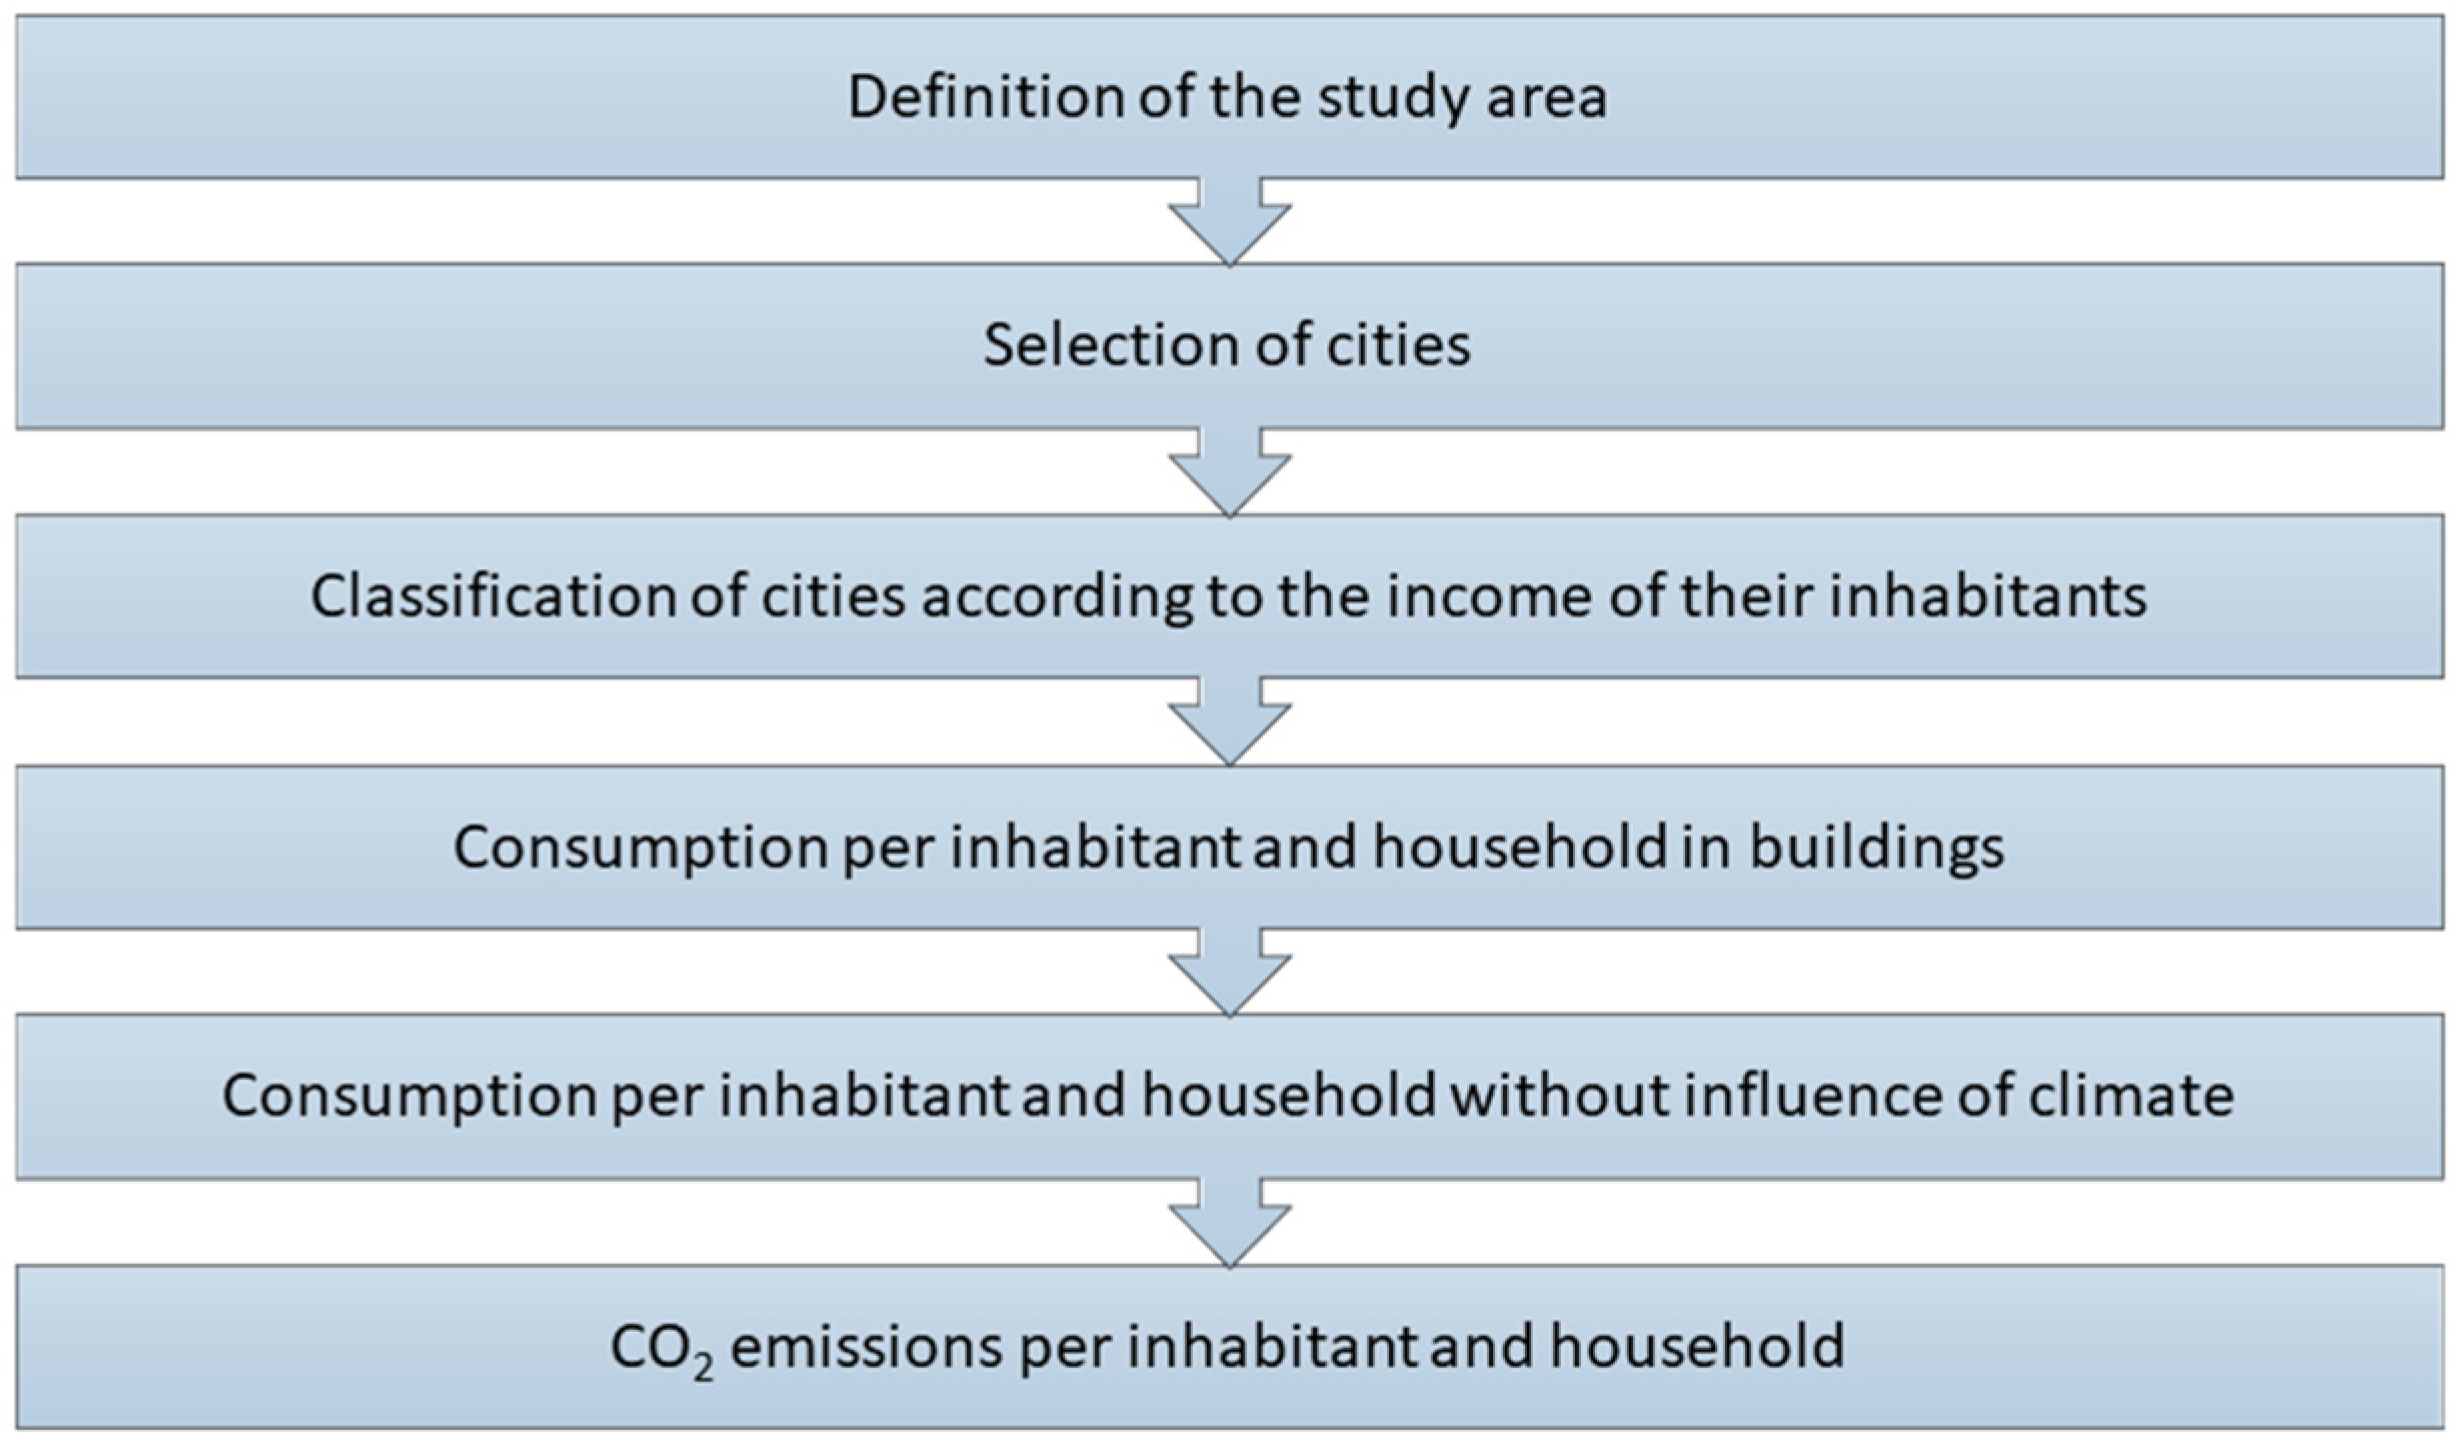
The importance for energy consumption and CO2 emissions of cities in general, their buildings in particular and, more specifically, thermal energy for heating, is highlighted in this research. It is necessary to know the starting point to allow governments and utilities to take the appropriate measures to reduce energy consumption and emissions, and plan the necessary infrastructure to achieve this. For this purpose, cities must be considered to be independent elements of study, rather than being treated with a single criterion for the application of the same solution to all cities. For this reason, this study focused on the energy consumption related to heating in city buildings and the emissions they produce. To allow analysis and comparison of the cities as independent elements, the inhabitants and households are used as basic units, and the energy consumption for heating of all the buildings in the city is assigned to these units. For this purpose, the consumption corresponding to non-residential buildings is also distributed among the inhabitants and households. This is because the purpose of non-residential buildings is to fulfill the needs of the city’s residents, and the number of these buildings is proportional to the number of inhabitants.
The methodology used in the study is based on other classical approaches that have been used recently [42,43,44,45], and on others that are based on the creation of synthetic populations [46]. These approaches use aggregated public data to represent the population of each city in a simplified manner. The practical application of the method was implemented for the 145 Spanish cities, considered individually, with more than 50,000 inhabitants.
The main contributions of this paper are to: analyze energy consumption for heating and related emissions in buildings; study energy consumption and related emissions based on the income of building inhabitants; analyze the results at the inhabitant and household level; consider all of the cities of a country separately rather than in aggregate form; and eliminate the influence of the climate on the results. To the best of the authors’ knowledge, a similar investigation has not been carried out previously.
The paper is structured as follows: Section 2 presents the proposed methodology; the application of the method to the case of Spain, in which the scope is defined as cities with more than 50,000 inhabitants, is shown in Section 3; in Section 4 the results are presented and discussed; finally, Section 5 summarizes the findings with respect to the study’s aims.

2. Method

The sequence followed in the proposed method was: first, define the study area; second, define the criteria for selecting the cities under study; third, classify cities according to the income of their inhabitants; fourth, determine the consumption of thermal origin of the buildings, per inhabitant and per household (it should be recalled that energy for heating usually has a thermal origin in the form of natural gas); fifth, eliminate the influence of the climate on consumption; and sixth, calculate the CO2 emissions produced by this consumption. Because the climate is a variable that notably influences the consumption of heating, this influence was eliminated. In addition, other variables can also influence energy consumption: population density, income of its inhabitants, characteristics of the house, age of buildings, etc. However, their elimination is beyond the scope of this study. All of the data used was publicly accessible and, where possible, of governmental origin. The aim was that the obtained results would provide individualized information for each city. Thus, the information relating to the energy consumed by each city allowed the determination of the power demand for each city, and thus the corresponding level of emissions and the requirement for energy from renewable sources to reduce the city’s emissions. Figure 1 presents the methodological approach.

2.1. Classification of Cities by Income of Their Inhabitants

First, the geographical area of interest was selected, which could be as large as desired. The cities to be studied and that met a certain criterion of interest were chosen. This criterion could include the number of inhabitants, the possible saturation of its infrastructure, etc. Next, each city was assigned a certain income value of its inhabitants, thus allowing a segmentation of that income. This was based on different criteria, such as the National Minimum Wage (NMW) or a relationship to it.
To perform the analysis, the main statistical data of thermal consumption for each group of cities were studied:
Mean:
E ¯ i = j E i j n i
Standard deviation:
s i = i j ( E i j E ¯ i ) 2 ( n i 1 )
Median:
M e d i a n i = [ n i + 1 2 ] t h   term   if   the   total   number   of   the   elements   is   an   odd   number ,   otherwise   M e d i a n i = ( n i 2 ) t h   term   + ( n i 2 + 1 ) t h   term 2
where ni is the number of cities that belong to group i; E ¯ i is the mean energy consumed in group i; Eij is the energy consumption of city j, which is in group i; si is the standard deviation of the energy consumed in the cities of group i. The consumption of thermal energy and cities’ consumption were listed in ascending order to calculate the median.
Furthermore, to analyze the variations in consumption, an index was defined. A similar index for monthly electric energy consumption was defined in [47]. The income variation index (IVI) was defined as follows:
I V I i = E ¯ i / E ¯
where I V I i is the index of the group of cities that have size i, E ¯ i is the energy consumption mean value of group i, and E ¯ is the mean energy consumption of all cities (of all groups). This index allows visualization of the variations of each group of cities, and identification of those with the highest and lowest consumption.
A common reference was selected to make the comparison between the city groups. For this purpose, different possible criteria may be used. The most basic is the income per inhabitant. However, equivalized disposable income is another possible criterion. Because this research was carried out both per inhabitant and per household, in the opinion of the authors, the latter criterion is more appropriate and was therefore used in the analysis.

2.2. Equivalized Disposable Income

Households are characterized by a certain economy of scale depending on the number of members and the ages of the people who form it. This is considered in the concept of equivalized disposable income, which also considers total household income after taxes. Each household was assigned an equivalent size, which is the sum of the weights of all of the members of a given household. The weight of each member was calculated using the modified OECD equivalence scale. This scale attributes the following weights to each member: 1 to the first adult, 0.5 to the other adults in the household, and 0.3 to those under 14 years of age. Finally, equivalized disposable income was calculated by dividing the household’s total income from all sources by its equivalent size. Using the equivalized disposable income of each household, it is possible to obtain that corresponding to the city. Thus:
E S = n i + 0.5   n j + 0.5   n k
E D I = i I n c o m e E S
where ES is the equivalent size, ni is equal to 1 for the first adult in the household, nj is the total number of people over 14 years of age minus 1, nk is the number of people under 14 years of age living in the household, and EDI is the equivalent disposable income.
Therefore, it is necessary to have access to data on inhabitants per household and their ages, and on disposable income per inhabitant and city. Note that, hereinafter, the word income is used to refer to the equivalized disposable income.

2.3. Thermal Energy Consumption

Energy consumption for heating in homes is produced almost exclusively by means of thermal energy in the form of natural gas. The pressure at these supply points is equal to or less than 4 bar. The official data that are usually published for this supply pressure do not distinguish between whether these consumption points are residential, commercial, or administrative office buildings. In addition, stores and administrative offices exist in a city to fulfill the needs of its inhabitants. For this reason, it was decided to carry out the study by distributing the energy consumed in these non-residential buildings among all citizens. Therefore, the allocated energy consumption includes both that consumed in households and that of stores and administrative offices. All information from public databases was processed to obtain the necessary data for the investigation.

2.4. Elimination of the Influence of Climate

Climate is a parameter that significantly influences energy consumption in cities [48]. Energy consumption varies depending on the climate [49]. To better analyze the influence of income on consumption for heating, the influence of climate can be eliminated. For this purpose, each city must be assigned a climate, for which the city must be geographically located on the climate map of the study area. Subsequently, the mean consumption of the climatic zone to which it belongs must be identified.
The correction is made by a factor [43] as follows:
K c i = E ¯ c / E ¯ c i
where E ¯ c i is the mean energy consumed in the climate zone i; E ¯ c is the mean energy consumed in all cities studied; and K c i is the correction factor by which each city will be affected according to its climate. Finally, the energy consumption of the city must be corrected. The correction factor is applied to the energy consumed by each city according to the climatic zone in which it is located.

2.5. CO2 Emissions

CO2 emissions are obtained based on energy consumption in buildings. Therefore, based on the information obtained on energy consumed, it is possible to determine the emissions.

3. Application of the Method to the Case of Spain

The case of Spain is presented as an application of the proposed method. As a study area, Spain as a whole was considered. The data used were those corresponding to the year 2016. The study cities were those with more than 50,000 inhabitants. These represent more than 50% of the Spanish population [50]. Knowledge of the consumption of thermal energy and the emissions they produce will allow correct planning of infrastructure to cover future needs, in addition to promoting ad hoc measures to reduce energy consumption and emissions in each city.

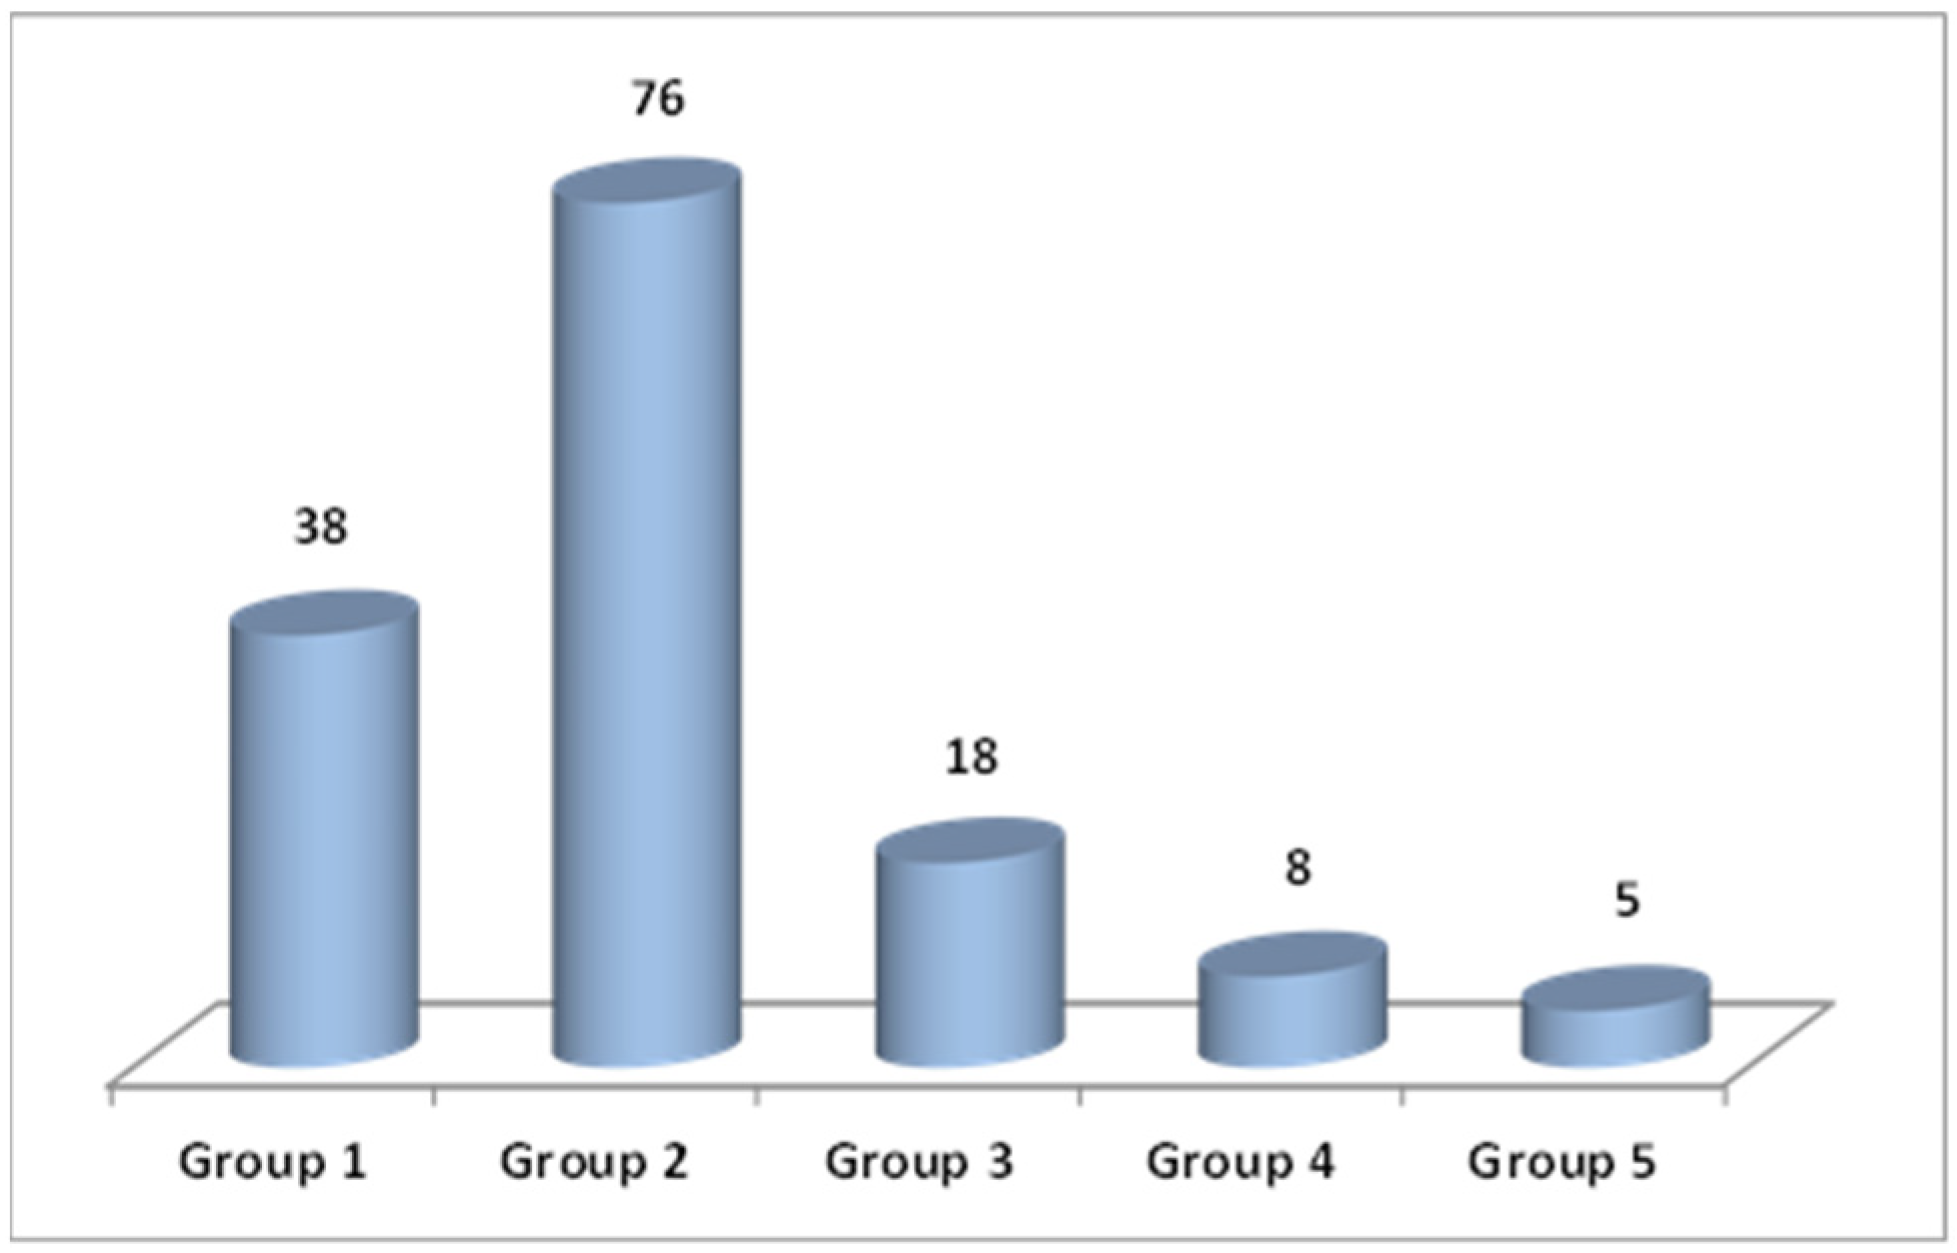
3.1. Classification of Study Cities

In Spain there are 145 cities with more than 50,000 inhabitants. For each of these, the income of its inhabitants, its thermal energy consumption, and its CO2 emissions were considered. The cities were separated into five groups based on the mean income value of their inhabitants. This value was assigned to each of the cities. NMW was chosen as the basis for segmentation and its value in 2016 amounted to EUR 7429.97 per year [51]. Initially, a division into groups based on a differentiation at 0.5 NMW was studied. However, this resulted in a highly unbalanced number of cities per group. The number of cities with income between 2 and 2.5 NMW was much higher than the remainder. To achieve a more balanced number of cities per group, groups with different multiples of the NMW were established. Thus, the difference between some groups is 0.5 NMW and in others it is 1 NMW.
Cities with incomes less than 2 times the NMW form Group 1; those between 2 and 2.5 times the NMW form Group 2; Group 3 comprises those with income between 2.5 and 3 times the NMW; Group 4 includes those whose inhabitants have incomes between 3 and 4 NMW; finally, the cities with incomes greater than 4 NMW make up Group 5. The cities that make up each group, arranged alphabetically, are shown in Table 1.
Normally, the information on the average income of the inhabitants is provided in the databases, and is the situation in Spain. Alternatively, if information corresponding to the median income was available, rather the average, this could be used instead.

3.2. Thermal Energy Consumption

Data for the study were obtained from the Ministry of Economic Affairs and Digital Transformation. Those corresponding to population and cities were taken from the Spanish National Statistics Institute [52], and those for consumption were taken from the National Commission on Markets and Competition [53].

3.3. CO2 Emissions

Directive 2010/31/UE of the European Parliament and the Council of 19 May 2010 was issued in 2010 by the European Union. This directive establishes energy performance of buildings, based on which, Spain established the emission factor for natural gas at 0.252 t CO2/MWh [54].

4. Results and Discussion

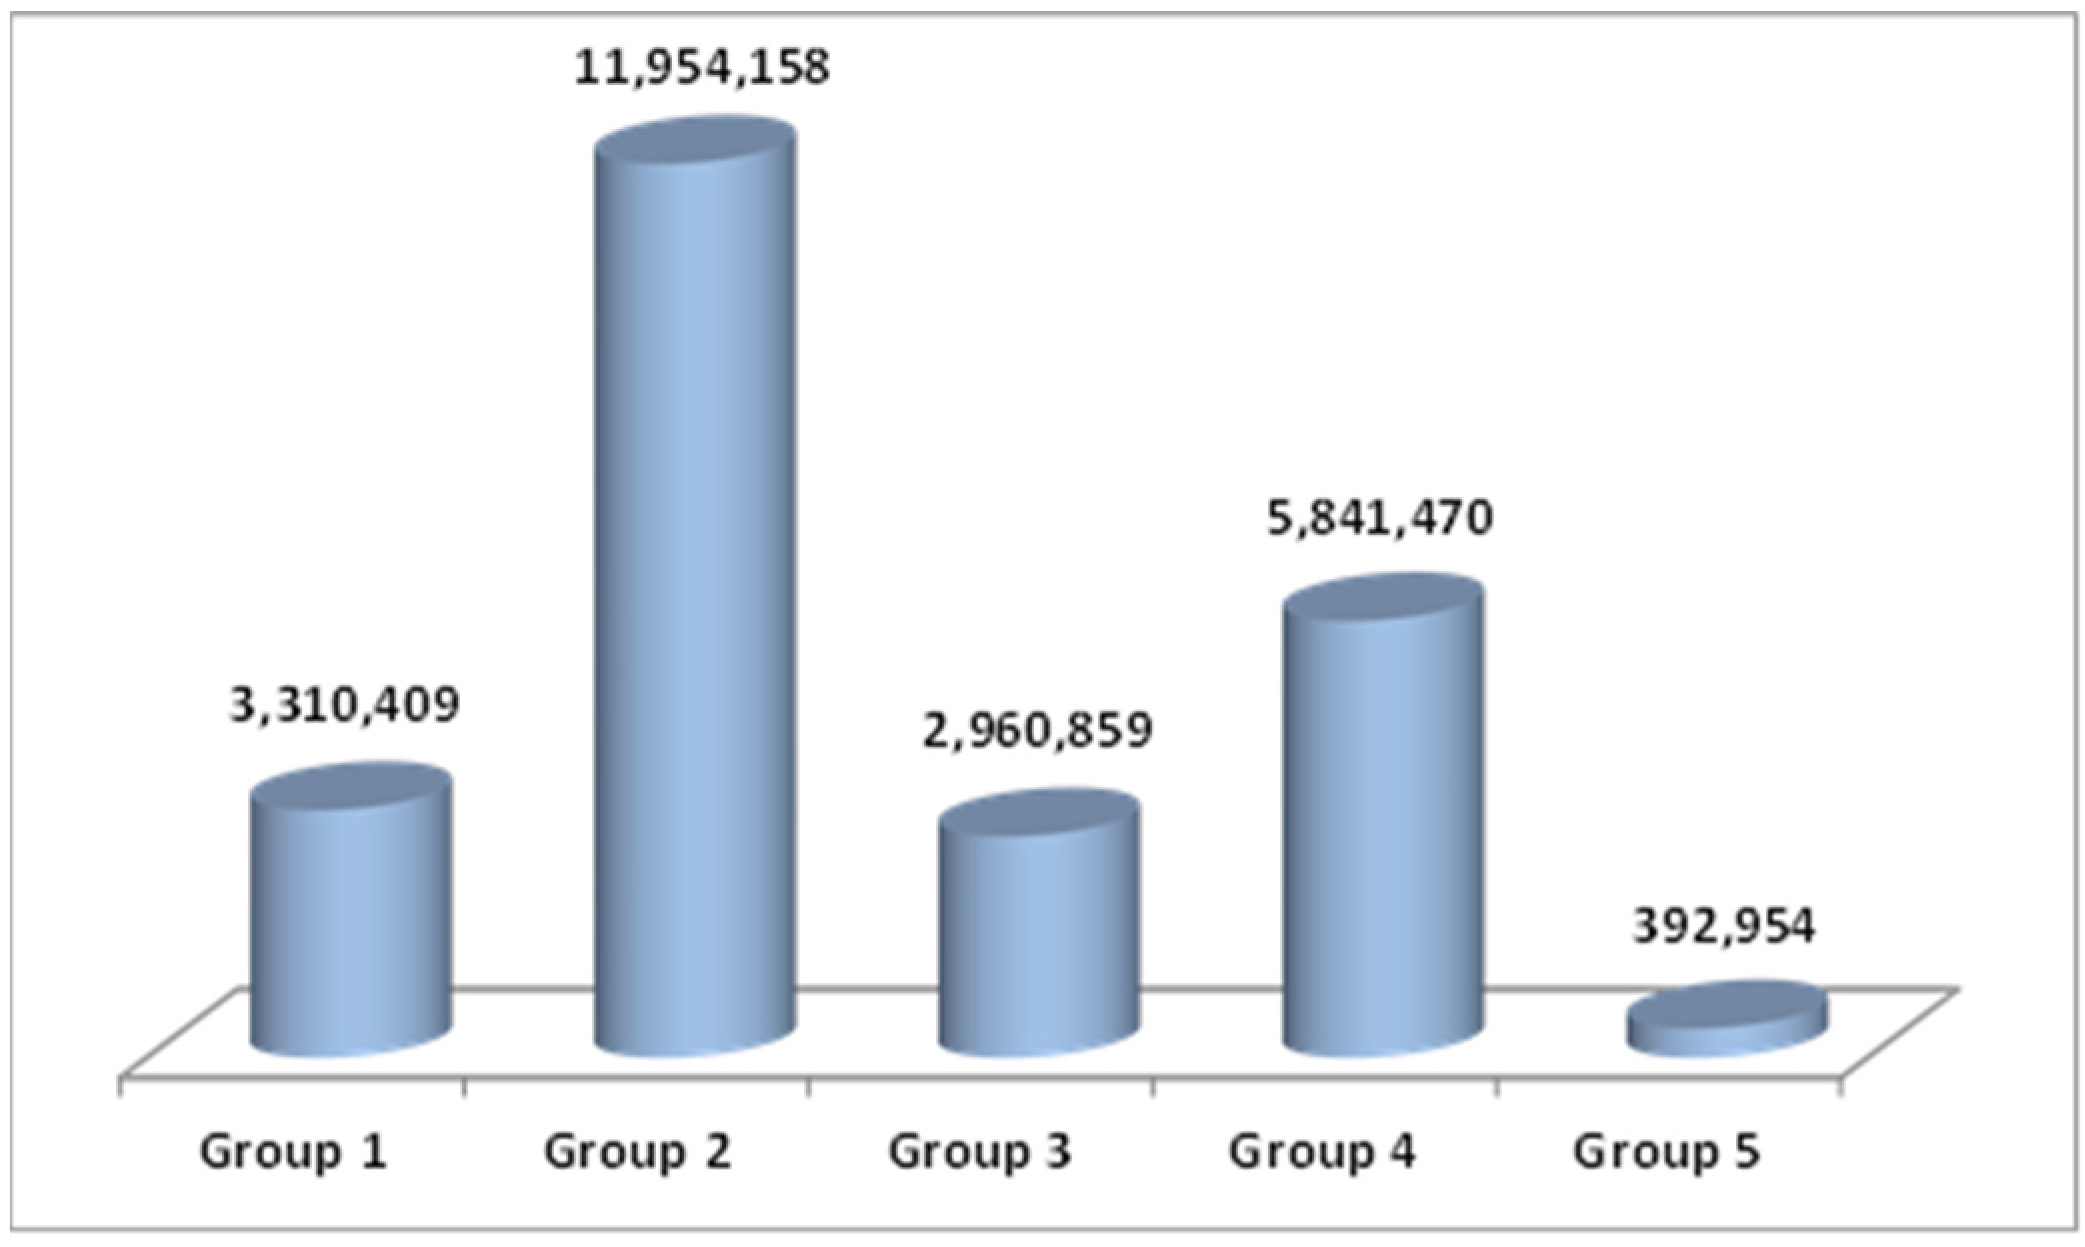
4.1. Sample of Study

The study area considered comprised Spain and, separately, the 145 cities with more than 50,000 inhabitants. The consumption of energy for heating in buildings was studied. The data obtained from public sources were processed to obtain the conclusions of the investigation. Five groups of cities were defined based on the NMW.
The number of cities in each group is presented in Figure 2. Almost 80% of the cities have incomes lower than 2.5 times the NMW, of which the cities with NMW between 2 and 2.5 are the most numerous. The number of cities decreases as the NMW of their inhabitants increases, with those corresponding to incomes greater than 4 NMW the least numerous. Regarding the population of cities, almost half of the inhabitants have incomes between 2 and 2.5 times the NMW (Group 2) and almost 25% have incomes between 3 and 4 times the NMW (Group 4), despite accounting for only 5% of cities. Cities with fewer inhabitants are those with incomes greater than 4 NMW (Group 5), for which the number of inhabitants is less than 2% (Figure 3). The main statistical data of population and households are shown in Table 2. Both have a similar behavior.

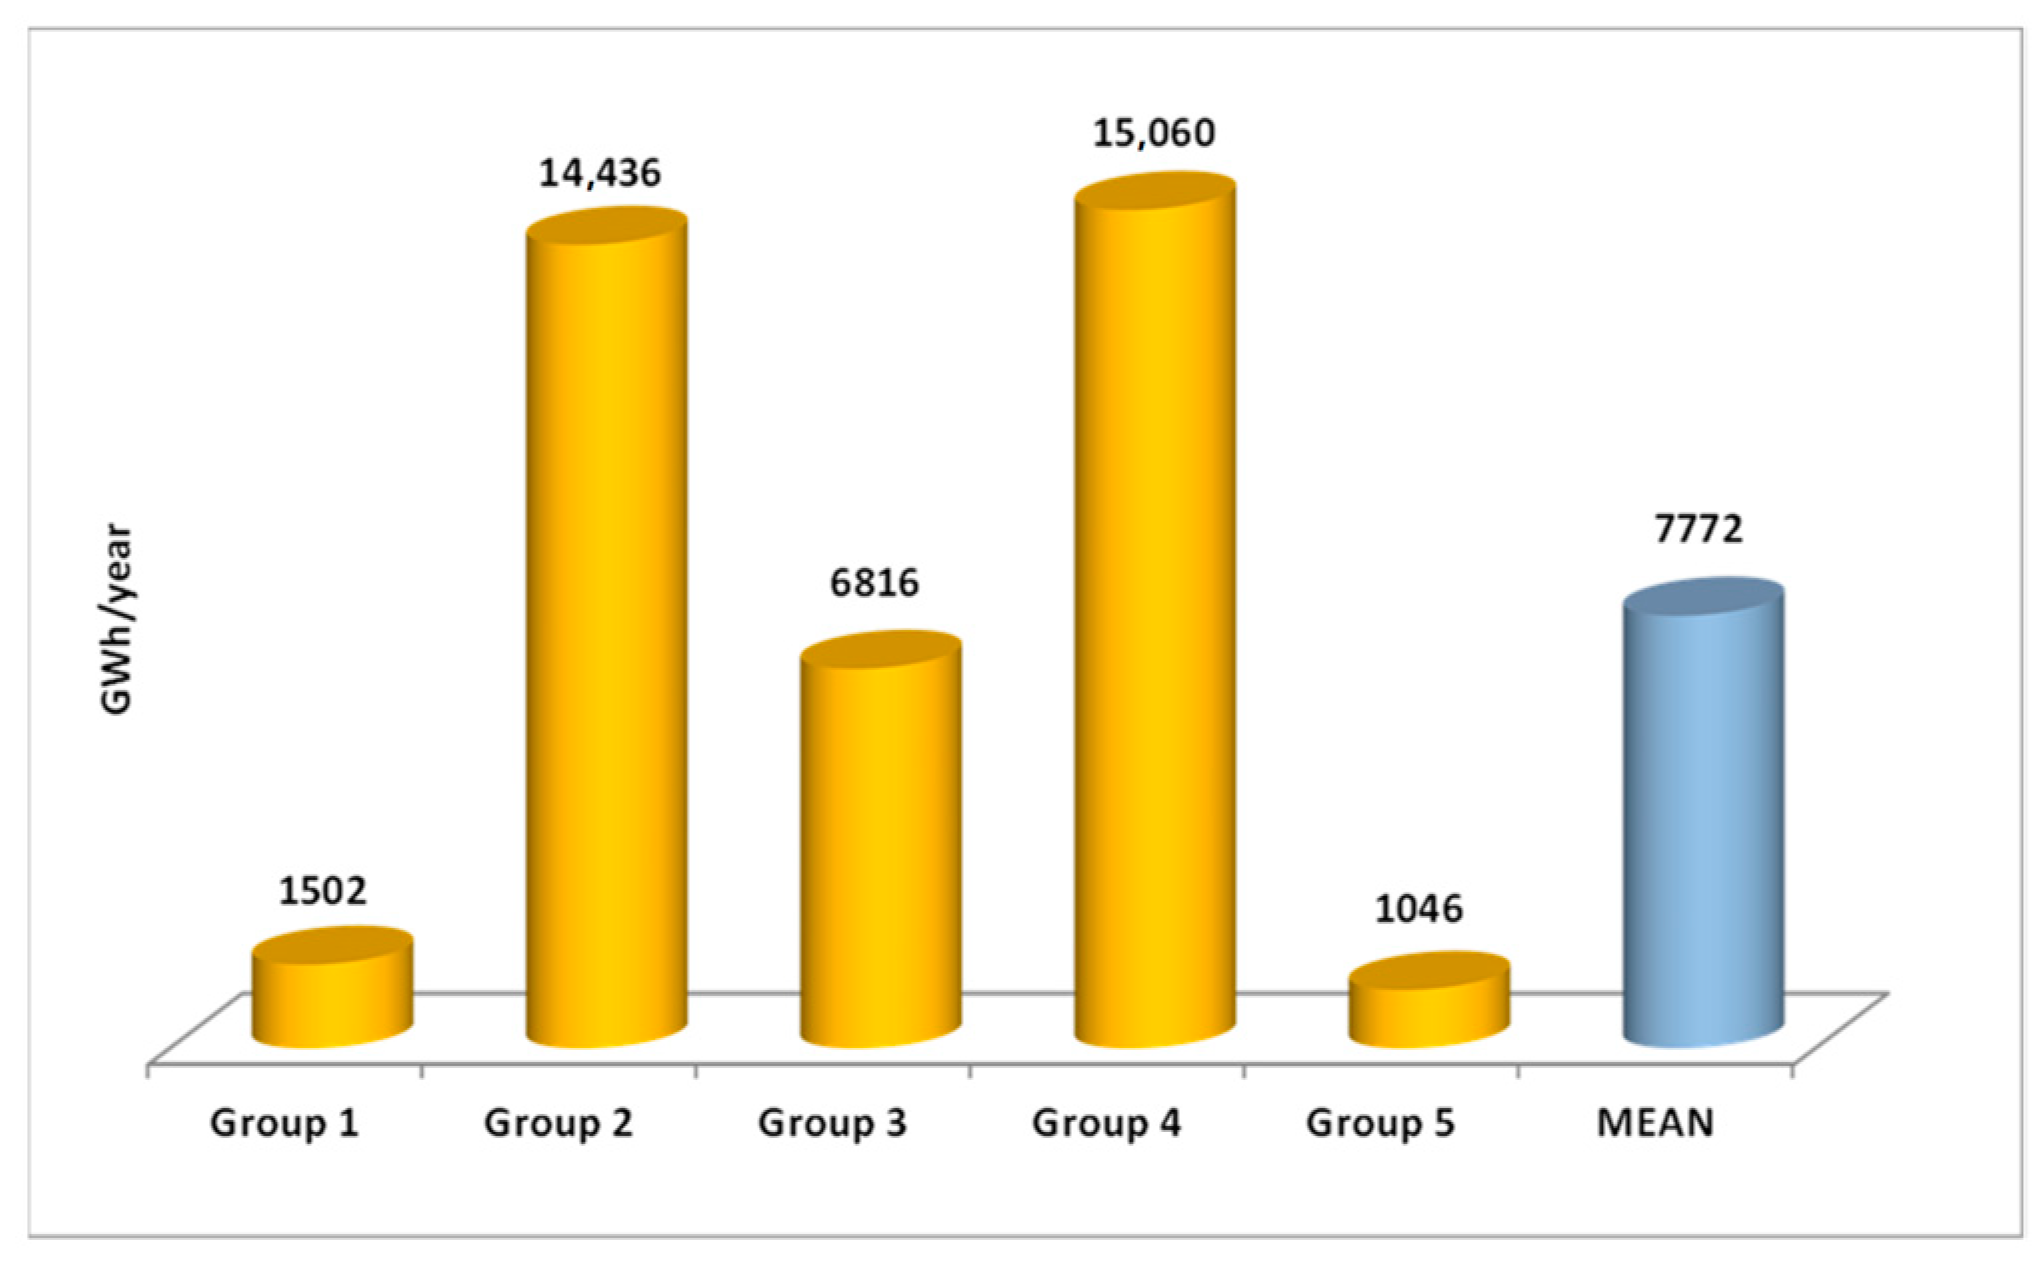
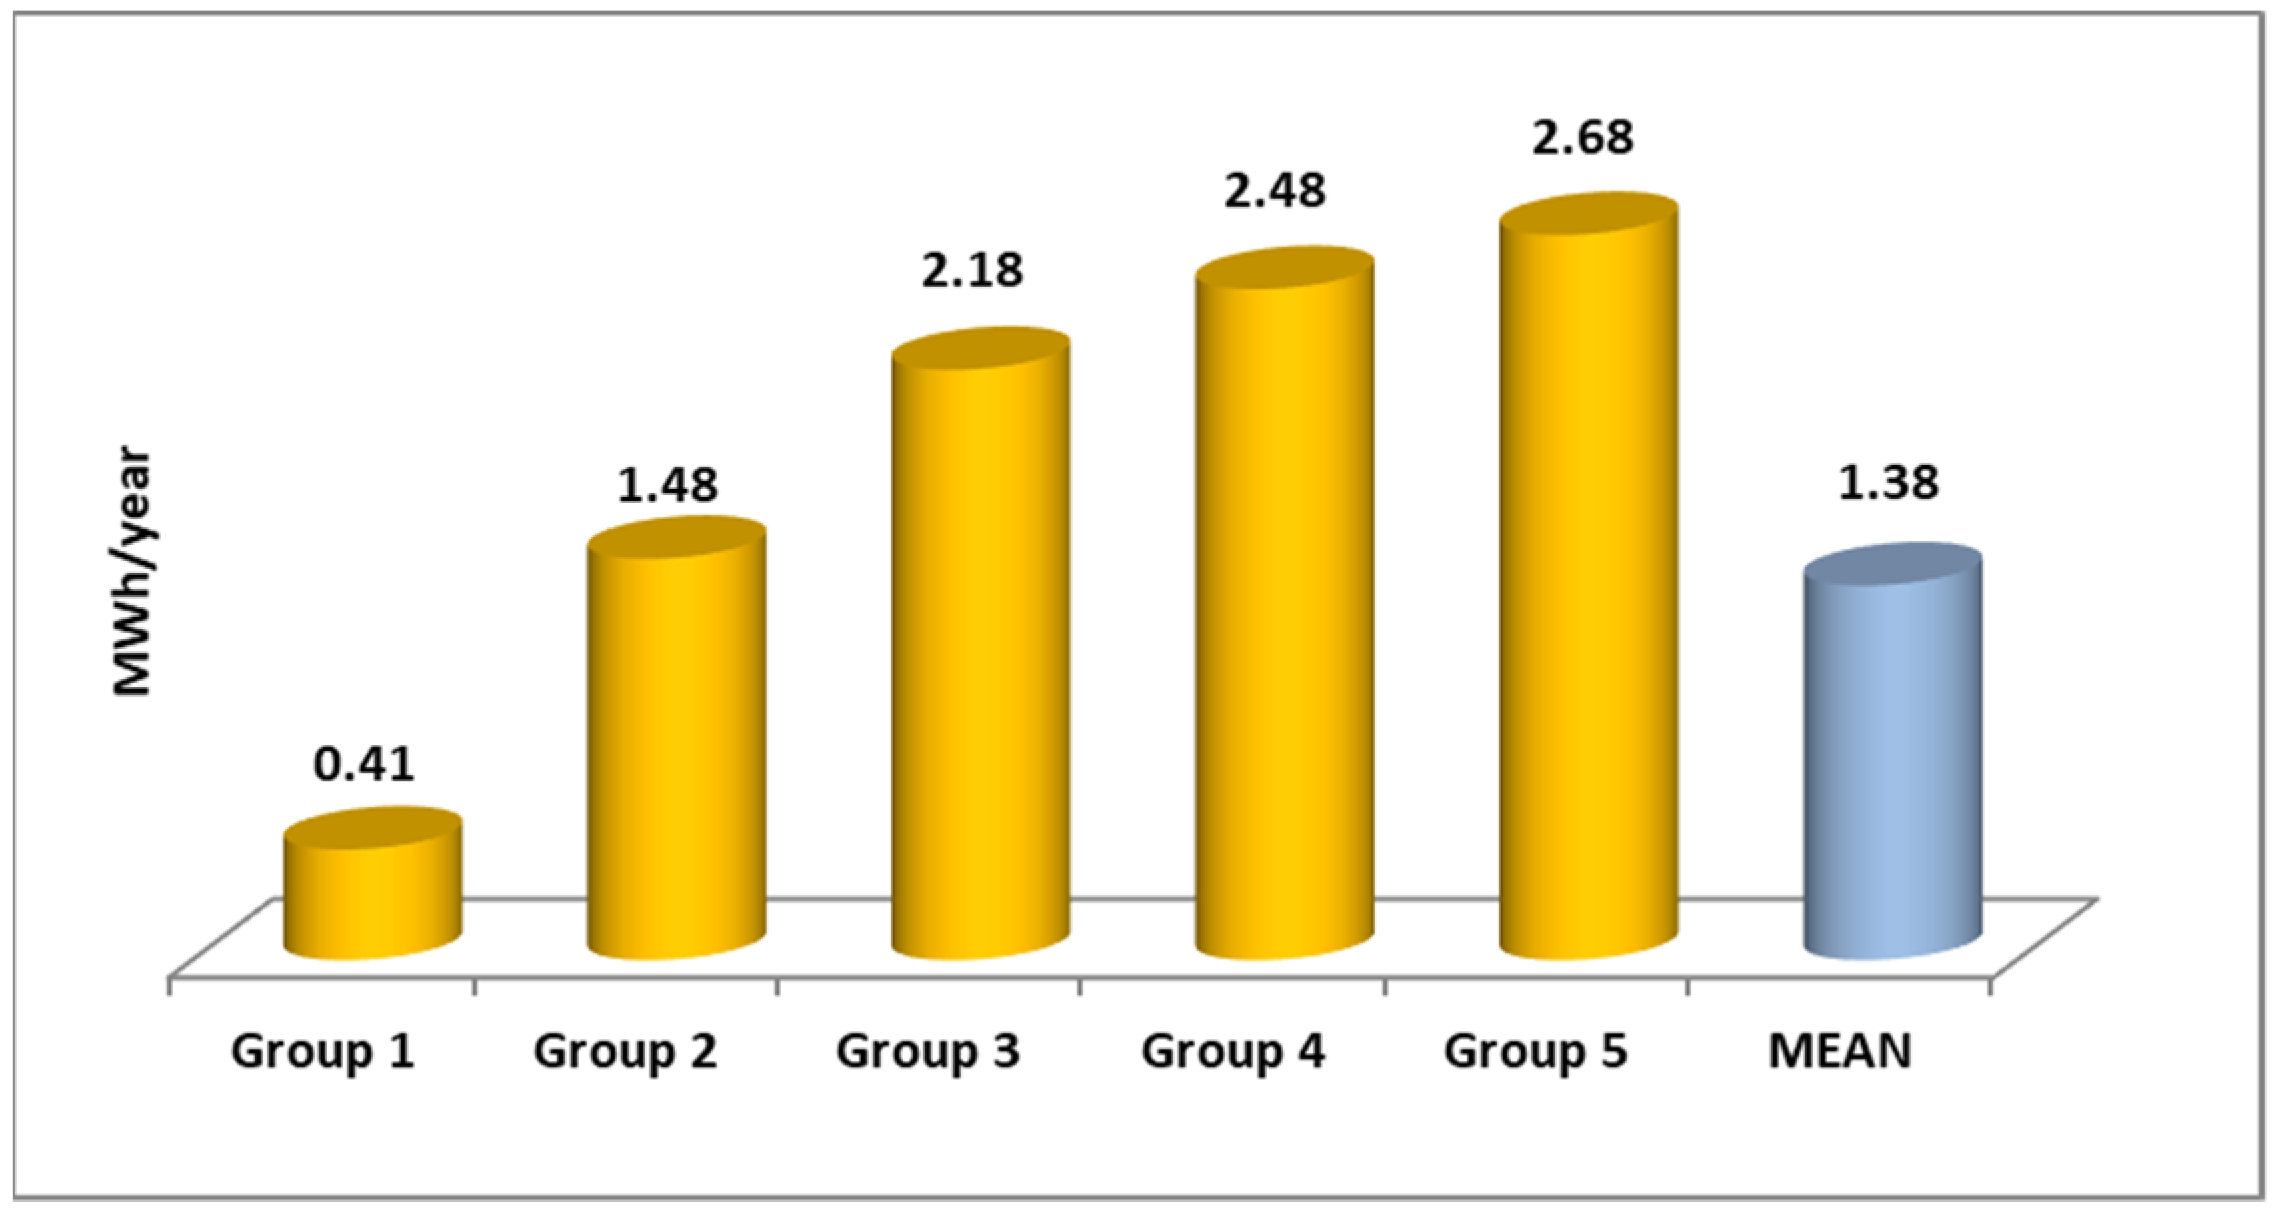
4.2. Energy Consumption per Group

Statistical data of the energy consumed in cities, in MWh per year, are shown in Table 3. Group 4 has the highest consumption, although it has half the population of Group 2, which has the next highest, but similar, consumption. These are followed by Group 3 which, although it has a population similar to that of Group 1, has a consumption that is almost five-fold higher. The final group is that with incomes above 4 NMW, which has a similar consumption, despite having a population 10-fold lower than that of Group 1. The total consumption of each group, in GWh per year, and the of the mean groups, are shown in Figure 4.

4.3. Energy Consumption per Household

Table 4 presents the statistical data of the consumption per household of each group, in MWh per year, and Figure 5 shows the mean values and the mean consumption of all the groups. Consumption increases as income increases, and the group of cities with incomes greater than 4 times the NMW has the highest consumption. With the exception of the group of cities with incomes below 2 NMW, the groups have a higher value than the median. The difference between the consumption of the group with less than 2 NMW and that of the remainder is marked. Thus, the next highest group, Group 2, consumes almost four-fold that of Group 1, and that with the highest consumption, Group 5, consumes more than seven-fold that of Group 1. The consumption of the highest income group is more than 35% greater than that of the next highest.
Consumptions was analyzed using the IVI index defined in Section 2.1. Figure 6 presents the variation of the index in the groups. The higher the income in the cities, the higher the index and, therefore, the consumption. The lowest value of the index is 0.3 in the group with incomes less than 2 times the NMW; that is, consumption in these cities is 70% lower than the average consumption. On the contrary, cities with incomes greater than 4 times the NMW have an index value of 2.32; that is, their consumption is 132% higher than the average. Therefore, there is a consumption difference of more than 200% between the cities with the highest and lowest consumption values.
In conclusion, the higher the income, the higher the consumption per household.

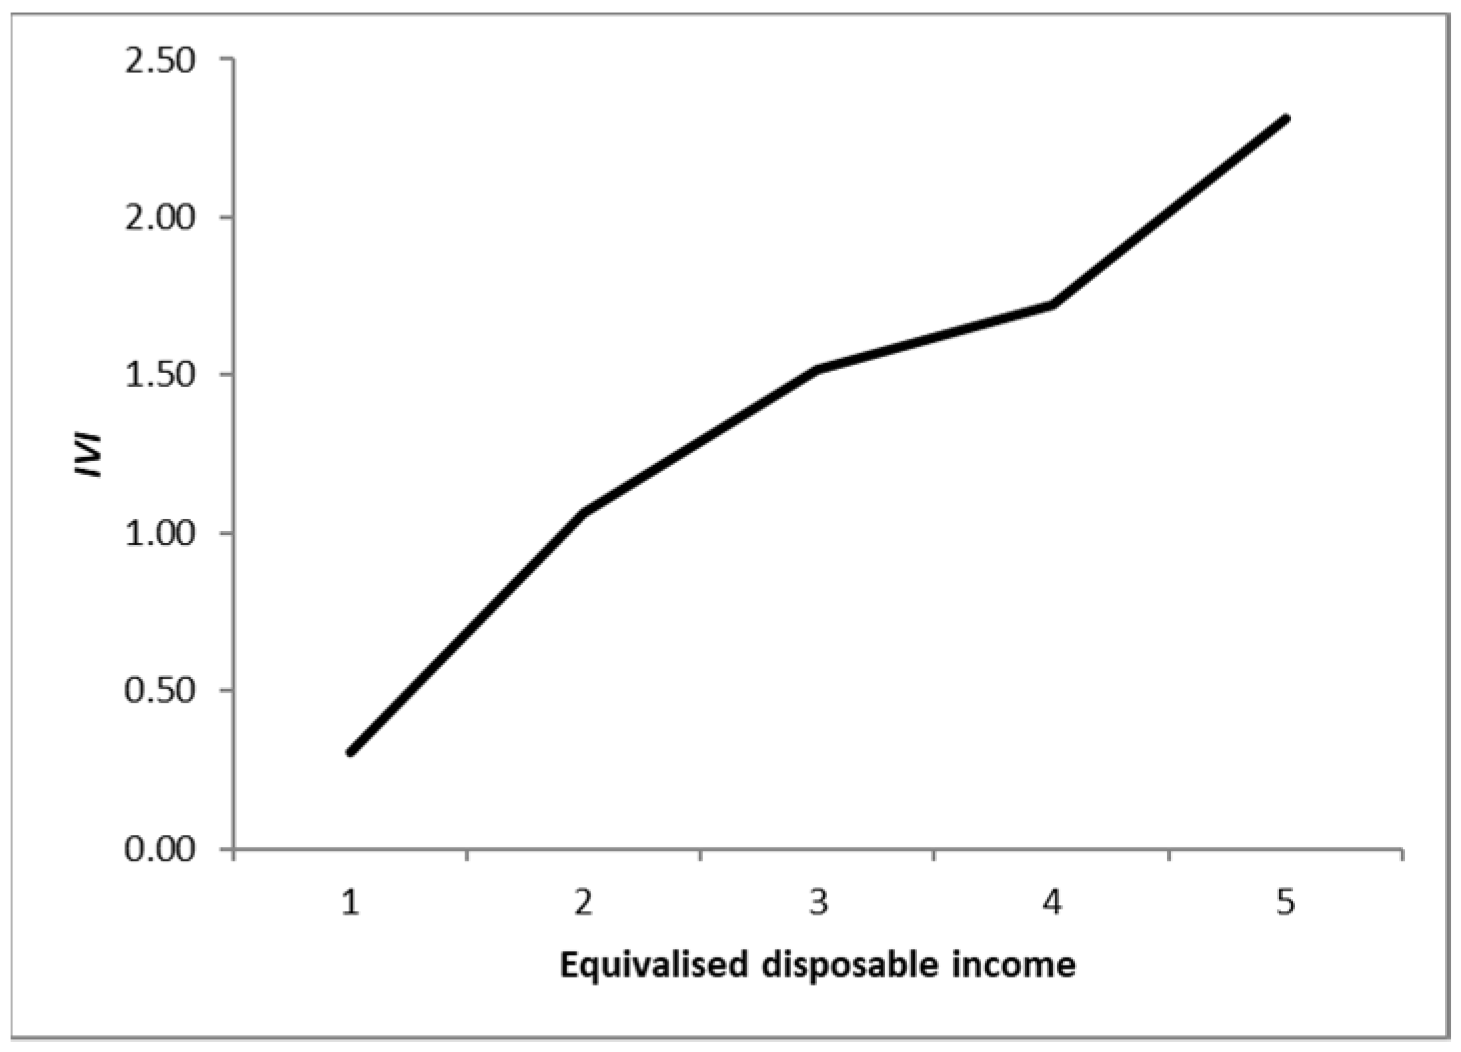
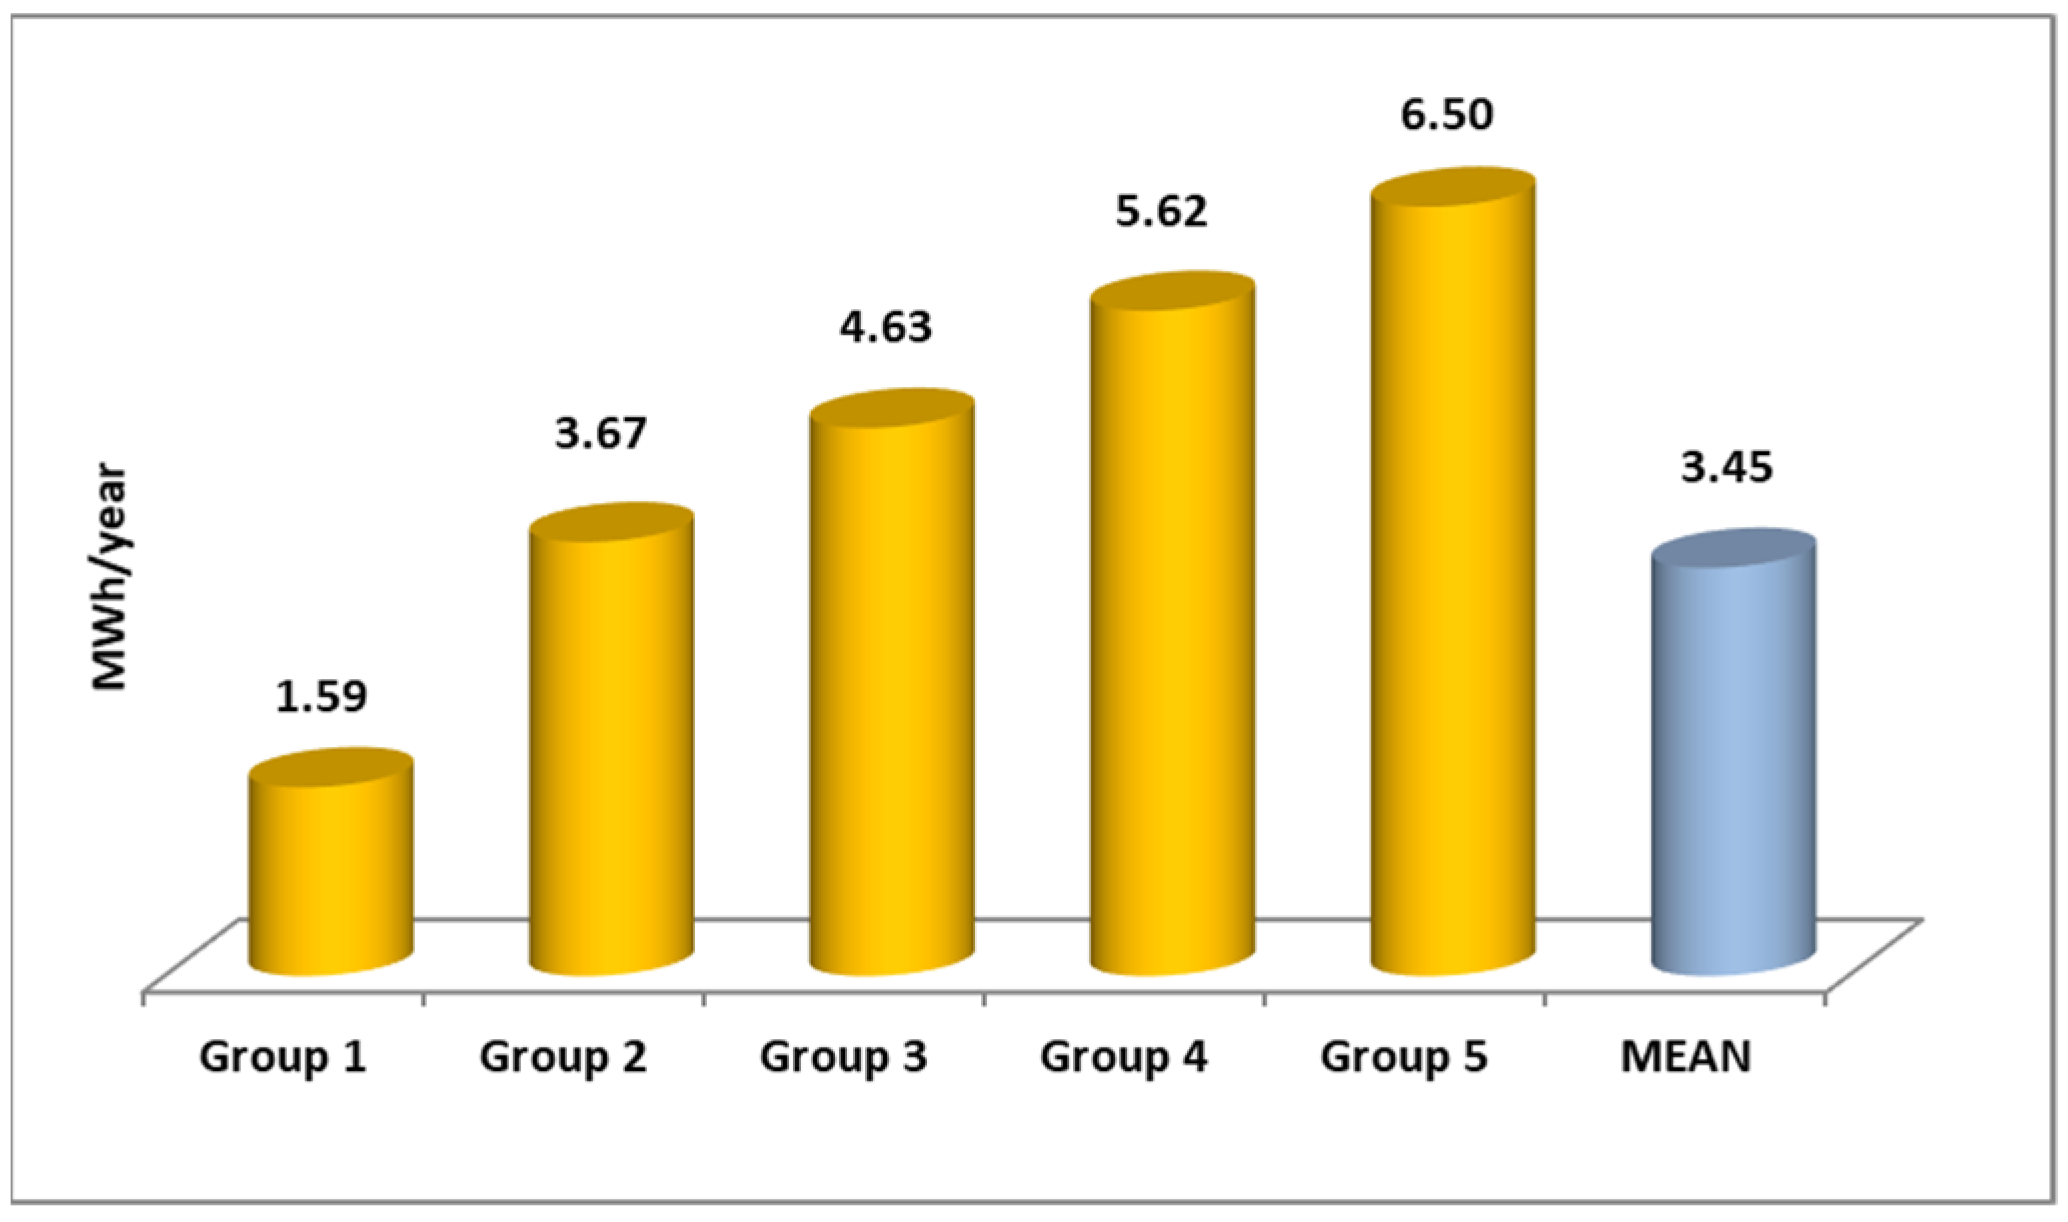
4.4. Energy Consumption per Inhabitant

To calculate consumption per inhabitant, the value of consumption per household in each city was used. Furthermore, the number of inhabitants per household in each city was determined. Using these data, the information corresponding to energy consumption per inhabitant was calculated.
The main statistical data of the consumption per inhabitant of each group, in MWh per year, are shown in Table 5, and the mean values and the mean consumption of all the groups are presented in Figure 7. As in the case of energy consumed per household, the higher the income in the cities, the higher the consumption. Similarly, only the consumption of cities with incomes less than 2 NMW is less than the mean consumption. In this case, the greatest difference between groups occurs between Groups 1 and 2; consumption is three-fold greater in Group 2. Consumption of the group with the higher income is six-fold greater. Therefore, the differences between the groups are somewhat smaller than in consumption per household.
Analyzing the variations in consumption using the IVI index (Figure 8), it is once again found that, as income increases in city groups, consumption increases. In this case, the increase with respect to the previous group of cities is less pronounced. The index in Group 1 is 0.3, equal to that in the case of households, whereas in Group 5 it is 1.94 and, therefore, lower than that in the case of households, which is 2.32.
Therefore, the higher the income, the higher the consumption per inhabitant.

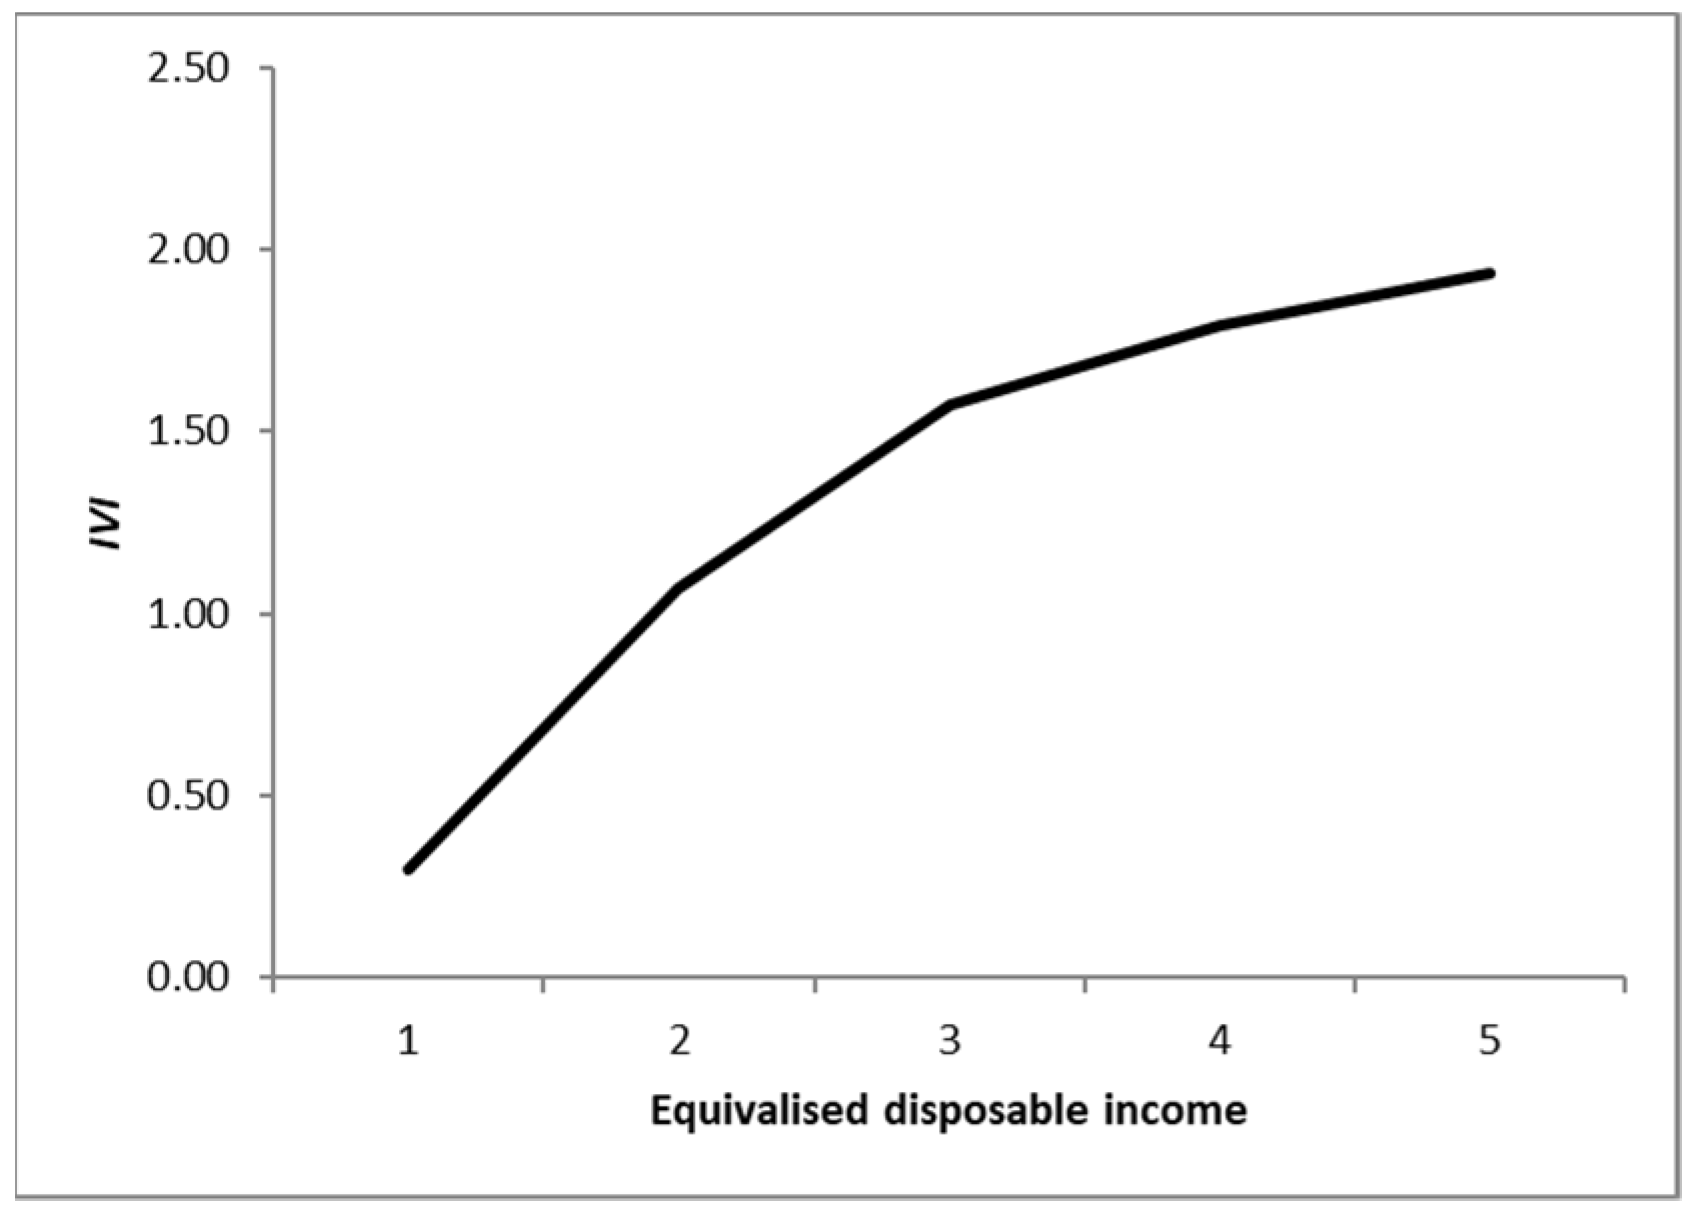
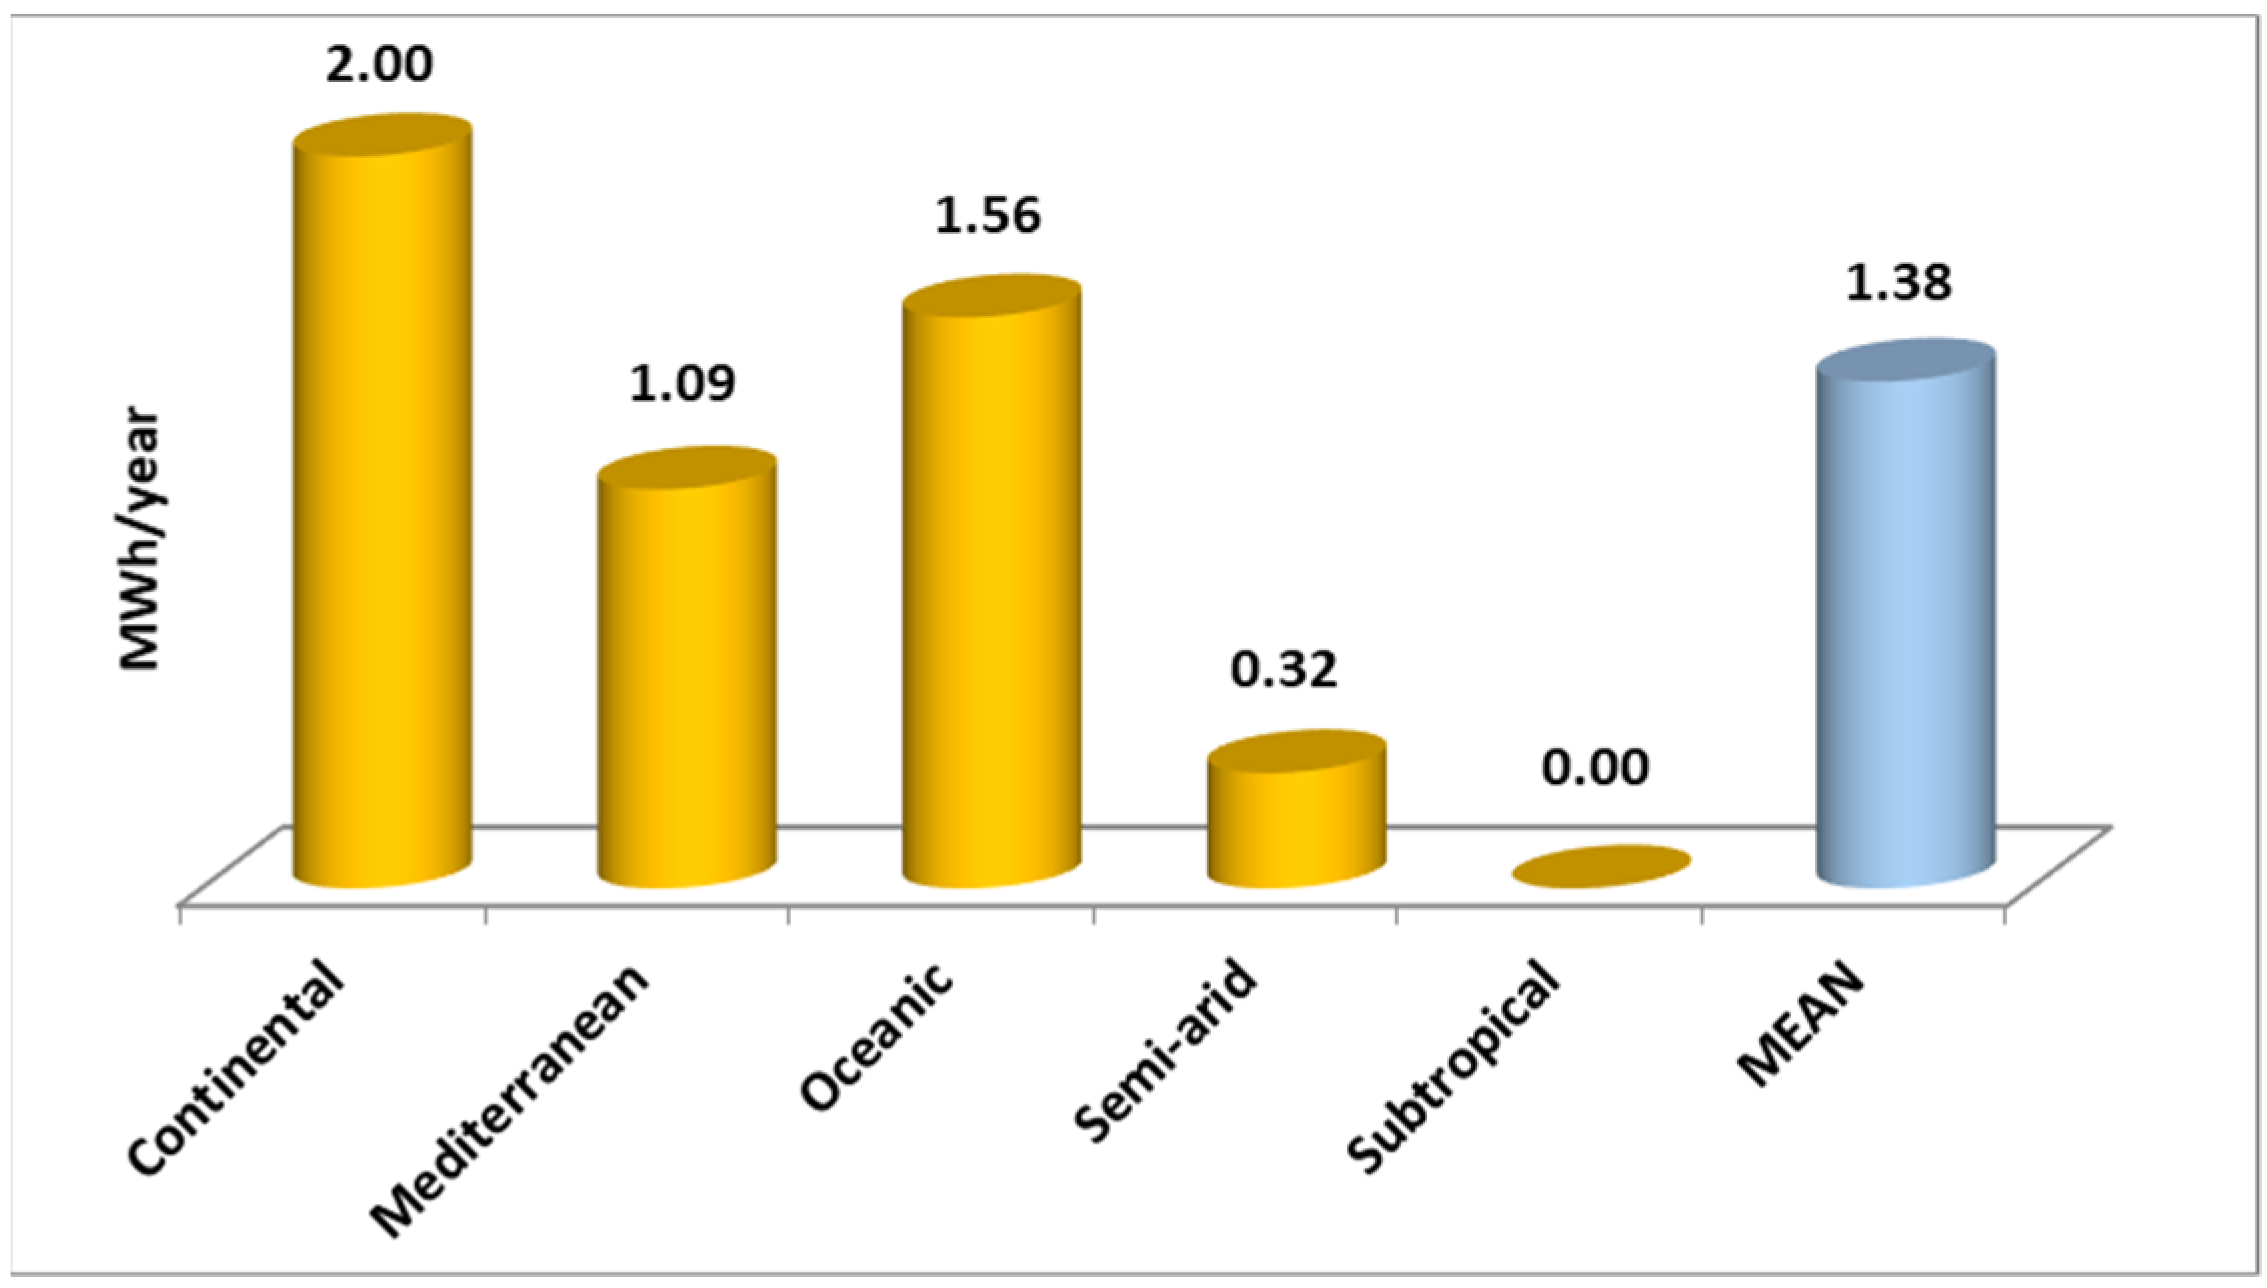
4.5. Energy Consumption without the Influence of Climate
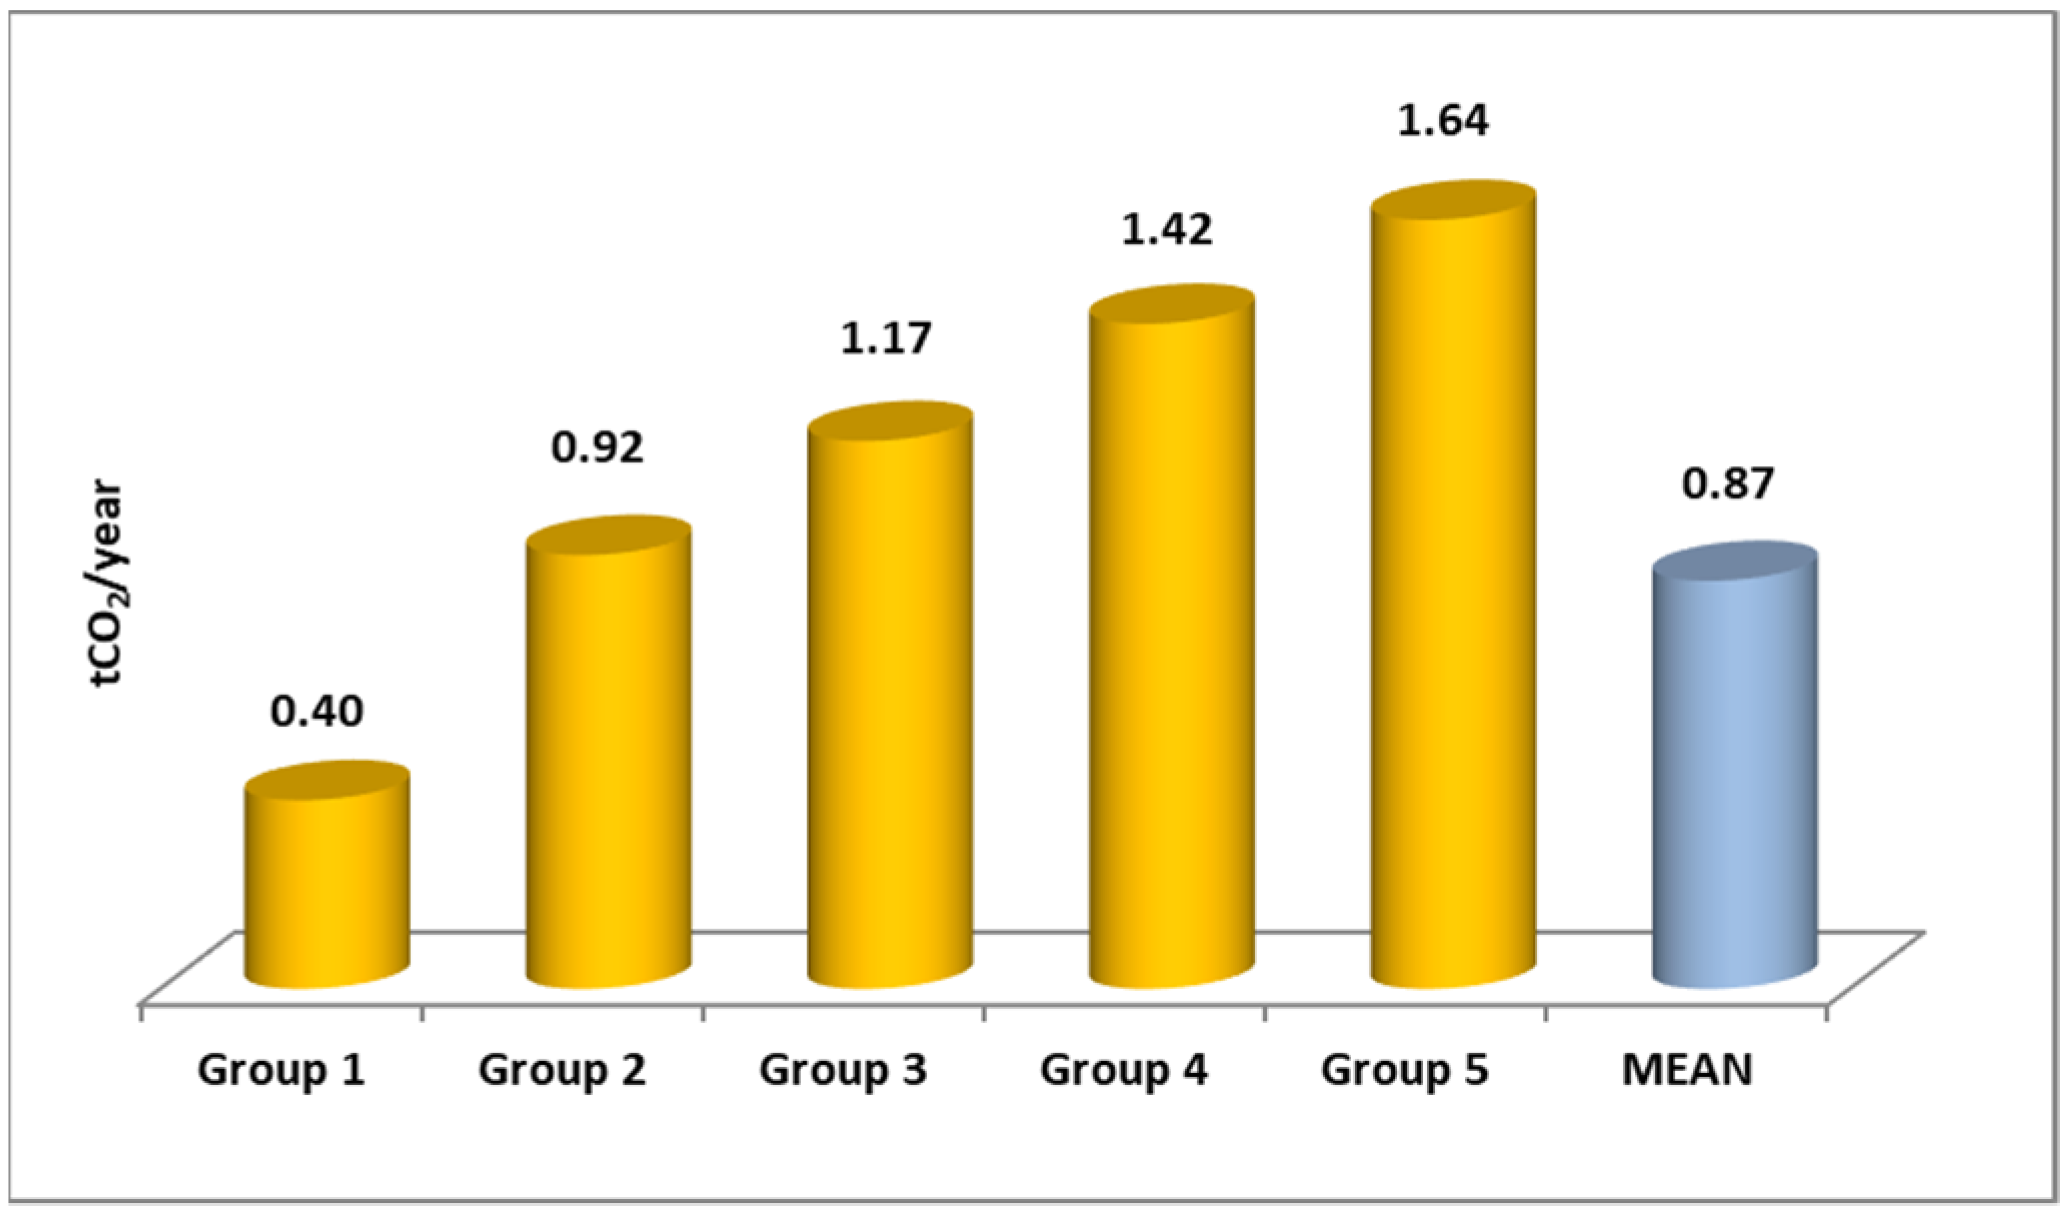
The climate influences the energy consumption in each city. To analyze the influence of the income of the inhabitants on the energy consumption, without being masked by another important variable, the influence of the climate was eliminated. For this, the 145 analyzed cities were located on the climate map of Spain. Thus, each city was assigned a climate zone. Using the research carried out in [49], the consumption per household (Figure 9) and per inhabitant (Figure 10) of each city as a function of its climate were identified.
Considering the consumption of the cities calculated in Section 4.3 and Section 4.4, and the consumption based on the climate of each city, the consumption of the cities per household and inhabitant was obtained without the influence of the climate. Thus, Table 6 and Figure 11, and Table 7 and Figure 12, show the main statistical parameters and mean consumption, according to the income of each group, per household and inhabitant, respectively.
The conclusions regarding the consumption per household obtained by eliminating the influence of the climate are similar to those obtained previously: the higher the income, the higher the consumption. However, the differences, although large, are not as pronounced, and are about half the magnitude of the previous values. Thus, the group with the highest income has a consumption that is more than three-fold higher than the group with the lowest income. In addition, the consumption of the group with incomes above 4 NMW is 15% higher than that of the next highest. A similar result is found with the lowest income group compared to the next highest, for which the difference is more than double.
This also occurs when analyzing the results obtained per inhabitant by eliminating the influence of the climate: higher income implies higher consumption. The differences between the different groups of cities are approximately half those that existed without eliminating the influence of the climate. However, a difference is observed in the groups with incomes greater than 3 times the NMW. In this case, their consumption values are very similar, and those of Group 4 are only 3% higher than those of Group 5.

4.6. CO2 Emissions

In accordance with the method presented in Section 3.3, Spain established the emission factor for natural gas at 0.252 t CO2/MWh. Therefore, once the demand for this type of energy is known, its emissions can be obtained. In this section, the emissions produced by heating in cities are analyzed according to the income of their inhabitants. As undertaken previously, emissions are analyzed with and without the influence of the climate.
Figure 13 and Figure 14 present the CO2 emissions by households and inhabitants, respectively. In both cases, a similar behavior is observed: the higher the income, the higher the emissions. Regarding household emissions, only cities with incomes less than 2 times the NMW have emissions below the mean, and are 70% lower. On the contrary, cities with incomes above 4 NMW produce the most emissions, which are almost 90% higher than the mean. In addition, the jumps that occur between Groups 1 and 2, and between Groups 4 and 5, are greater than that in the groups who have incomes between 2 and 4 times the NMW.
Emissions per person display a similar behavior to those of households. However, the difference in emissions between Groups 1 and 2 is significantly more pronounced, and the emissions of the latter are almost four-fold higher than those of the former. By comparison, the increase in emissions among higher income groups is less pronounced than in the case of households. Regarding their comparison with respect to mean emissions, the group with the lowest emissions, Group 1, and the group with the largest, Group 5, have a behavior similar to that of households.
Emissions per household and inhabitant, after eliminating the influence of the climate, are reflected in Figure 15 and Figure 16, respectively. In this case, a similar behavior is once again evident: cities with higher incomes produce higher emissions. In both cases, only the cities with incomes below 2 NMW produce emissions lower than the mean, and furthermore, these cities have a greater difference with respect to the emissions of the upper group of cities. In the case of emissions per household, the growth between groups is approximately linear. In the case of emissions per inhabitant, growth among groups with incomes between 2 and 4 NMW is also approximately linear. However, cities with more than 4 NMW produce slightly fewer emissions than those in the group of cities between 3 and 4 times the NMW, although the difference is 3%.

5. Conclusions

More than 50% of the world’s population lives in cities, and that share is expected to exceed two-thirds by 2050. In certain areas, the urbanized proportion of the population is even larger. Furthermore, buildings consume more than 35% of energy and produce 40% of CO2 emissions. In particular, heating is among the uses that consumes the most energy, accounting for almost 50%, and produces the most emissions. Hence, cities in general, and buildings in particular, have significant importance for both public administration and utilities. This is even more so due to the COVID-19 pandemic, by which cities have been the most affected. Cities and buildings are important to public administrators because they are responsible for legislating to achieve sustainable development goals, and to utilities because they must plan infrastructure for the proper functioning of the cities.
Because of the importance of heating in buildings, this paper presents a method to analyze the influence of the income of city inhabitants on consumption and its related emissions. The study was carried out at the city level and was based on equivalized disposable income, which was used to consider the economies of scale of households. The method selected cities in a geographic area and grouped them based on the national minimum wage. The study was carried out using households and inhabitants as the basic unit. The energy consumed in all of the buildings of each city was distributed among all of its inhabitants and all of its households. In addition, to more clearly analyze the influence of income, the influence of climate was removed. For this purpose, it was necessary to locate each city on a climate map of the study area and thus assign it to a climate zone. To facilitate the analysis, an index was introduced.
The method was applied to 145 Spanish cities with more than 50,000 inhabitants. The inhabitants of the cities and the members of the households were identified, in addition to the heating energy consumed in all of the buildings. The results show that the higher the income, the higher the consumption for heating and the higher the emissions, at both the household and the inhabitant levels. Subsequently, the climate of each city was identified, and the study was carried out by eliminating the influence of the climate on the city. The results obtained again confirm the same finding: the higher the income, the higher the consumption and the higher the emissions.

Author Contributions

Conceptualization, P.J.Z.-P., I.M.Z.-S. and R.S.-D.; methodology, P.J.Z.-P. and I.M.Z.-S.; validation, P.J.Z.-P., I.M.Z.-S. and F.J.Z.-S.; formal analysis, P.J.Z.-P., I.M.Z.-S. and F.J.Z.-S.; investigation, P.J.Z.-P. and I.M.Z.-S.; data curation, I.M.Z.-S. and F.J.Z.-S.; writing—original draft preparation, P.J.Z.-P. and I.M.Z.-S.; writing—review and editing, I.M.Z.-S., F.J.Z.-S. and P.J.Z.-P.; visualization, I.M.Z.-S.; supervision, P.J.Z.-P. and R.S.-D. All authors have read and agreed to the published version of the manuscript.

Funding

This research received no external funding.

Institutional Review Board Statement

Not applicable.

Informed Consent Statement

Not applicable.

Data Availability Statement

Not applicable.

Acknowledgments

The authors would like to thank eCitySevilla project for providing facilities to conduct the research.

Conflicts of Interest

The authors declare no conflict of interest.

References

  1. Department of Economic and Social Affairs. 2014 Demographic Yearbook, 64th ed.; United Nations: New York, NY, USA, 2015. [Google Scholar]
  2. United Nations. Sustainable Development Goals. Available online: https://www.un.org/sustainabledevelopment/ (accessed on 13 May 2020).
  3. International Energy Agency. 2018 Global Status Report: Towards a Zero-Emission, Efficient and Resilient Buildings and Construction Sector; United Nations Environment Programme: Nairobi, Kenya, 2018. [Google Scholar]
  4. Shahrokni, H.; Levihn, F.; Brandt, N. Big meter data analysis of the energy efficiency potential in Stockholm’s building stock. Energy Build. 2014, 78, 153–164. [Google Scholar] [CrossRef]
  5. Lukic, N.; Nikolic, N.; Timotijevic, S.; Tasic, S. Influence of an unheated apartment on the heating consumption of residential building considering current regulations—Case of Serbia. Energy Build. 2017, 155, 16–24. [Google Scholar] [CrossRef]
  6. IEA. Energy Technology Perspective 2017, Catalysing Energy Technology Transformations; International Energy Agency: Paris, France, 2017. [Google Scholar]
  7. United Nations Educational, Scientific and Cultural Organization (UNESCO). Available online: https://en.unesco.org/sdgs (accessed on 29 June 2020).
  8. COM(2019) 640 Final. The European Green Deal; European Commission: Brussels, Belgium, 2019. [Google Scholar]
  9. European Parliament News. Available online: https://www.europarl.europa.eu/news/en/headlines/society/20200618STO81513/green-deal-key-to-a-climate-neutral-and-sustainable-eu (accessed on 15 August 2020).
  10. United Nation. Department of Economic and Social Affairs. Available online: https://sdgs.un.org/goals/goal11 (accessed on 14 September 2020).
  11. Wang, L.; Long, R.; Chen, H.; Li, W.; Yang, J. A review of studies on urban energy performance evaluation. Environ. Sci. Pollut. Res. 2019, 26, 3243–3261. [Google Scholar] [CrossRef]
  12. D’Agostino, D.; Zangheri, P.; Castellazzi, L. Towards nearly zero energy buildings in Europe: A focus on retrofit in non-residential buildings. Energies 2020, 10, 117. [Google Scholar] [CrossRef]
  13. Cui, Y.; Sun, N.; Cai, H.; Li, S. Indoor temperatura improvement and energy-saving renovations in rural houses of China’s cold region—A case study of Shandong province. Energies 2020, 13, 870. [Google Scholar] [CrossRef] [Green Version]
  14. Ala-Kotila, P.; Vainio, T.; Laamanen, J. The influence of building renovations on indoor comfort—A field test in an apartment building. Energies 2020, 13, 4958. [Google Scholar] [CrossRef]
  15. Hashemi, A. Climate resilient low-income tropical housing. Energies 2020, 9, 468. [Google Scholar] [CrossRef] [Green Version]
  16. Lima, F.; Ferreira, P.; Leal, V. A review of the relation between household indoor temperature and health outcomes. Energies 2020, 13, 2881. [Google Scholar] [CrossRef]
  17. Wang, D.; Liu, Y.; Wu, Z.; Fu, H.; Shi, Y.; Guo, H. Scenario analysis of natural gas consumption in China based on wavelet neural network optimized by particle swarm optimization algorithm. Energies 2018, 11, 825. [Google Scholar] [CrossRef] [Green Version]
  18. Scarpa, F.; Bianco, V. Assessing the quality of natural gas consumption forecasting: An application to the Italian residential sector. Energies 2017, 10, 1879. [Google Scholar] [CrossRef] [Green Version]
  19. Tavakoli, E.; Montazerin, N. Stochastic analysis of natural gas consumption in residential and commercial buildings. Energy Build. 2011, 43, 2289–2297. [Google Scholar] [CrossRef]
  20. Akpinar, M.; Adak, M.F.; Yumusak, N. Day-ahead natural gas demand forecasting using optimized ABC-based neural network with sliding window technique: The case study of regional basis in Turkey. Energies 2017, 10, 781. [Google Scholar] [CrossRef] [Green Version]
  21. De, G.; Gao, W. Forecasting China’s natural gas consumption based on AdaBoost—Particle swarm optimization—Extreme learning machine integrate learning method. Energies 2018, 11, 2938. [Google Scholar] [CrossRef] [Green Version]
  22. Flores-Larsen, S.; Filippín, C. Energy efficiency, thermal resilience, and health during extreme heat events in low-income housing in Argentina. Energy Build. 2021, 231, 110576. [Google Scholar] [CrossRef]
  23. Erdogdu, E. Natural gas demand in Turkey. Appl. Energy 2010, 87, 211–219. [Google Scholar] [CrossRef] [Green Version]
  24. Bianco, V.; Scarpa, F.; Tagliafico, L.A. Analysis and future outlook of natural gas consumption in the Italian residential sector. Energy Conv. Manag. 2014, 87, 754–764. [Google Scholar] [CrossRef]
  25. Behrouznia, A.; Saberi, M.; Azadeh, A.; Asadzadeh, S.M.; Pazhoheshfar, P. An adaptive network based fuzzy inference system-fuzzy data envelopment analysis for gas consumption forecasting and analysis: The case of South America. In Proceedings of the 2010 International Conference on Intelligent and Advanced Systems, Kuala Lumpur, Malaysia, 15–17 June 2010; pp. 1–6. [Google Scholar] [CrossRef]
  26. Li, J.; Dong, X.; Shangguan, J.; Hook, M. Forecasting the growth of China’s natural gas consumption. Energy 2011, 36, 1380–1385. [Google Scholar] [CrossRef] [Green Version]
  27. Wang, T.; Lin, B. China’s natural gas consumption and subsidies—From a sector perspective. Energy Policy 2014, 65, 541–551. [Google Scholar] [CrossRef]
  28. Liu, H.; Zhou, S.; Peng, T.; Ou, X. Life cycle energy consumption and greenhouse gas emissions analysis of natural gas- based distributed generation projects in China. Energies 2017, 10, 1515. [Google Scholar] [CrossRef] [Green Version]
  29. Gustafsson, M.; Thygesen, R.; Karlsson, B.; Ödlund, L. Rev-changes in primary energy use and CO2 emissions—An impact assessment for a building with focus on the Swedish proposal for nearly zero energy buildings. Energies 2017, 10, 978. [Google Scholar] [CrossRef] [Green Version]
  30. Ouyang, X.; Lin, B. Carbon dioxide (CO2) emissions during urbanization: A comparative study between China and Japan. J. Clean Prod. 2017, 143, 356–368. [Google Scholar] [CrossRef]
  31. Alam, M.M.; Murad, M.W.; Noman, A.H.M.; Ozturk, I. Relationships among carbon emissions, economic growth, energy consumption and population growth: Testing Environmental Kuznets Curve hypothesis for Brazil, China, India and Indonesia. Ecol. Indic. 2016, 70, 466–479. [Google Scholar] [CrossRef]
  32. Sharma, S.S. Determinants of carbon dioxide emissions: Empirical evidence from 69 countries. Appl. Energy 2011, 88, 376–382. [Google Scholar] [CrossRef]
  33. Solarin, S.A.; Lean, H.H. Natural gas consumption, income, urbanization, and CO2 emissions in China and India. Environ. Sci. Pollut. Res. 2016, 23, 18753–18765. [Google Scholar] [CrossRef] [PubMed]
  34. Sohag, K.; Mamun, M.d.A.; Uddin, G.S.; Ahmed, A.M. Sectoral output, energy use, and CO2 emission in middle-income countries. Environ. Sci. Pollut. Res. 2017, 24, 9754–9764. [Google Scholar] [CrossRef] [PubMed] [Green Version]
  35. Chen, J.; Wang, P.; Cui, L.; Huang, S.; Song, M. Decomposition and decoupling analysis of CO2 emissions in OECD. Appl. Energy 2018, 231, 937–950. [Google Scholar] [CrossRef]
  36. Lyons, S.; Pentecost, A.; Tol, R.S.J. Socioeconomic distribution of emissions and resource use in Ireland. J. Environ. Manag. 2012, 112, 186–198. [Google Scholar] [CrossRef] [PubMed] [Green Version]
  37. Chancel, L. Are younger generations higher carbon emitters than their elders? Inequalities, generations and CO2 emissions in France and in the USA. Ecol. Econ. 2014, 100, 195–207. [Google Scholar] [CrossRef]
  38. Golley, J.; Meng, X. Income inequality and carbon dioxide emissions: The case of Chinese urban households. Energy Econ. 2012, 34, 1864–1872. [Google Scholar] [CrossRef]
  39. Wang, S.; Guangdong, L.; Fang, C. Urbanization, economic growth, energy consumption, and CO2 emissions: Empirical evidence form countries with different income level. Renew. Sustain. Energy Rev. 2018, 81, 2144–2159. [Google Scholar] [CrossRef]
  40. Kennedy, C.; Steinberger, J.; Gasson, B.; Hansen, Y.; Hillman, T.; Havránek, M.; Pataki, D.; Phdunngsilp, A.; Ramaswami, A.; Mendez, G.V. Greenhouse gas emissions from global cities. Environ. Sci. Technol. 2009, 43, 7297–7302. [Google Scholar] [CrossRef]
  41. Huang, R.; Zhang, S.; Liu, C. Comparing urban and rural household CO2 emissions—Case from China’s four megacities: Beijing, Tianjin, Shanghai, and Chongqing. Energies 2018, 11, 1257. [Google Scholar] [CrossRef] [Green Version]
  42. Jiang, L.; Xing, R.; Chen, X.; Xue, B. A survey-based investigation of greenhouse gas and pollutant emissions from household energy consumption in the Qinghai-Tibet Plateau of China. Energy Build. 2021, 235, 110753. [Google Scholar] [CrossRef]
  43. Zarco-Soto, I.M.; Zarco-Periñán, P.J.; Sánchez-Durán, R. Influence of cities population size on their energy consumption and CO2 emissions: The case of Spain. Environ. Sci. Pollut. Res. 2021, 28, 28146–28167. [Google Scholar] [CrossRef]
  44. Urquizo, J.; Calderón, C.; James, P. Metrics of urban morphology and their impact on energy consumption: A case study in the United Kingdom. Energy Res. Soc. Sci. 2017, 32, 193–206. [Google Scholar] [CrossRef]
  45. Hekkenberg, M.; Benders, R.M.J.; Moll, H.C.; Schoot, A.J.M. Indications for a changing electricity demand pattern: The temperature dependence of electricity demand in the Netherlands. Energy Policy 2009, 37, 1542–1551. [Google Scholar] [CrossRef]
  46. Nageli, C.; Camarasa, C.; Jakob, M.; Catenazzi, G.; Ostermeyer, Y. Synthetic building stocks as a way to assess the energy demand and greenhouse gas emissions of national building stocks. Energy Build. 2018, 173, 443–460. [Google Scholar] [CrossRef]
  47. Valor, E.; Meneu, V.; Caselles, V. Daily air temperature and electricity load in Spain. Appl. Meteorol. 2001, 40, 1413–1421. [Google Scholar] [CrossRef]
  48. Li, D.H.W.; Yang, L.; Lam, J.C. Impact of climate change on energy use in the built environment in different climate zones—A review. Energy 2012, 42, 103–112. [Google Scholar] [CrossRef]
  49. Zarco-Soto, I.M.; Zarco-Periñán, P.J.; Sánchez-Durán, R. Influence of climate on energy consumption and CO2 emissions: The case of Spain. Environ. Sci. Pollut. Res. 2020, 27, 15645–15662. [Google Scholar] [CrossRef] [PubMed]
  50. Instituto Nacional de Estadística, Cifras de Población, Ministerio de Asuntos Económicos y Transformación Digital. Available online: http://www.ine.es/dyngs/INEbase/es/operacion.htm?c=Estadistica_C&cid=1254736176951&menu=ultiDatos&idp=1254735572981 (accessed on 12 October 2020).
  51. Ministerio de Empleo y Seguridad Social. Real Decreto 1171/2015, de 29 de Diciembre, por el que se fija el Salario Mínimo Interprofesional para 2016; Boletín Oficial del Estado: Madrid, Spain, 2015.
  52. Instituto Nacional de Estadística, Demografía y Población, Ministerio de Asuntos Económicos y Transformación Digital. Available online: http://www.ine.es/ss/Satellite?L=es_ES&c=Page&cid=1254735910183&p=1254735910183&pagename=INE%2FINELayout (accessed on 1 November 2020).
  53. Comisión Nacional de los Mercados y la Competencia. Informe de Supervisión del Mercado de Gas Natural en España; Ministerio de Economía, Industria y Competitividad: Madrid, Spain, 2017.
  54. Ministerio de Industria, Energía y Turismo & Ministerio de Fomento, Factores de Emisión de CO2 y Coeficientes de paso a Energía Primaria de Diferentes Fuentes de Energía Final Consumidas en el Sector de Edificios de España. Available online: https://energia.gob.es/desarrollo/EficienciaEnergetica/RITE/Reconocidos/Paginas/IndexDocumentosReconocidos.aspx (accessed on 19 March 2020).
Figure 1. Methodological approach.
Energies 14 04531 g001
Figure 2. Number of cities of each group.
Energies 14 04531 g002
Figure 3. Population of each group of cities.
Energies 14 04531 g003
Figure 4. Mean energy consumption by group of cities.
Energies 14 04531 g004
Figure 5. Mean energy consumption per household by group of cities.
Energies 14 04531 g005
Figure 6. Variation of the IVI index for energy consumption per household by group of cities.
Energies 14 04531 g006
Figure 7. Mean energy consumption per inhabitant by group of cities.
Energies 14 04531 g007
Figure 8. Variation of the IVI index for energy consumption per inhabitant by group of cities.
Energies 14 04531 g008
Figure 9. Mean energy consumption per inhabitant by climate zone.
Energies 14 04531 g009
Figure 10. Mean energy consumption per household by climate zone.
Energies 14 04531 g010
Figure 11. Mean energy consumption per household by group of cities without the influence of climate.
Energies 14 04531 g011
Figure 12. Mean energy consumption per inhabitant by group of cities without the influence of climate.
Energies 14 04531 g012
Figure 13. Mean CO2 emissions per household by group of cities.
Energies 14 04531 g013
Figure 14. Mean CO2 emissions per inhabitant by group of cities.
Energies 14 04531 g014
Figure 15. Mean CO2 emissions per household by group of cities without the influence of climate.
Energies 14 04531 g015
Figure 16. Mean CO2 emissions per inhabitant by group of cities without the influence of climate.
Energies 14 04531 g016
Table 1. Classification of cities according to their equivalized disposable income.
Equivalized Disposable IncomeCities
Group 1: income less than 2 times the NMWAlcalá de Guadaíra, Alcoy/Alcoi, Arona, Arrecife, Benalmádena, Benidorm, Chiclana de la Frontera, Dos Hermanas, Ejido (El), Elche/Elx, Elda, Estepona, Fuengirola, Gandía, Jerez de la Frontera, Linares, Línea de la Concepción (La), Lorca, Marbella, Mijas, Motril, Orihuela, Parla, Puerto de Santa María, Roquetas de Mar, San Bartolomé de Tirajana, San Fernando, San Vicente del Raspeig, Sanlúcar de Barrameda, Santa Coloma de Gramenet, Santa Lucía de Tirajana, Talavera de la Reina, Telde, Torremolinos, Torrent, Torrevieja, Utrera, Vélez-Málaga,
Group 2: income between 2 and 2.5 times the NMWAlbacete, Alcalá de Henares, Alcorcón, Algeciras, Alicante/Alacant, Almería, Aranjuez, Arganda del Rey, Ávila, Avilés, Badajoz, Badalona, Cáceres, Cádiz, Cartagena, Castellón de la Plana, Ceuta, Ciudad Real, Collado Villalba, Córdoba, Cornellà de Llobregat, Coslada, Cuenca, Ferrol, Fuenlabrada, Getafe, Gijón, Granada, Guadalajara, Huelva, Huesca, Jaén, Las Palmas, Leganés, L’Hospitalet de Llobregat, Lleida, Logroño, Lugo, Málaga, Manresa, Mataró, Melilla, Mérida, Molina de Segura, Mollet del Vallès, Móstoles, Murcia, Ourense, Palencia, Palma de Mallorca, Paterna, Pinto, Ponferrada, Pontevedra, Prat de Llobregat (El), Reus, Rubí, Sabadell, Sagunto/Sagunt, Salamanca, San Cristóbal de la Laguna, Sant Boi de Llobregat, Santa Cruz de Tenerife, Segovia, Sevilla, Siero, Terrassa, Torrejón de Ardoz, Torrelavega, Valdemoro, Valencia, Vigo, Viladecans, Vilanova i la Geltrú, Vila-Real, Zamora
Group 3: income between 2.5 and 3 times the NMWA Coruña, Barakaldo, Burgos, Cerdanyola del Vallès, Girona, Granollers, Irún, León, Oviedo, Pamplona/Iruña, Rivas-Vaciamadrid, San Sebastián de los Reyes, Santander, Santiago de Compostela, Tarragona, Toledo, Valladolid, Zaragoza
Group 4: income between 3 and 4 times the NMWAlcobendas, Barcelona, Bilbao, Castelldefels, Getxo, Madrid, San Sebastián/Donostia, Vitoria/Gasteiz
Group 5: income greater than 4 times the NMWBoadilla del Monte, Majadahonda, Pozuelo de Alarcón, Rozas de Madrid (Las), Sant Cugat del Vallès
Table 2. Statistical data by population and household of each group of cities.
POPULATIONNUMBEROF HOUSEHOLDS
Equivalized Disposable IncomeTotalMeanStd. Dev.MedianMaximumMinimumTotalMeanStd. Dev.MedianMaximumMinimum
Group 13,310,40987,11638,47376,624228,67552,6201,220,12832,10913,57129,24983,18218,927
Group 211,954,158157,292140,553104,380787,80850,3344,517,51959,44153,45241,936312,33917,901
Group 32,960,859164,492142,846112,815664,93857,7231,188,75566,04259,00146,331269,34721,470
Group 45,841,470730,1841,116,856216,6733,182,98165,9542,345,167293,146445,64990,6171,262,28223,811
Group 5392,95478,59117,53085,60595,07151,463122,90024,580596326,29129,93715,434
Table 3. Statistical data of consumption of the groups.
MWh/Year
Equivalized Disposable IncomeTotalMeanStd. Dev.MedianMaximumMinimum
Group 11,501,71839,51967,36919,955354,7930
Group 214,435,580189,942171,343140,476643,1460
Group 36,815,922378,662400,478234,3131,627,61478,422
Group 415,059,6101,882,4513,062,082550,7188,969,965140,304
Group 51,045,547209,10947,470200,928267,920145,028
Table 4. Statistical data of household consumption.
MWh/Year
Equivalized Disposable IncomeMeanStd. Dev.MedianMaximumMinimum
Group 11.111.570.698.290.00
Group 23.892.724.368.430.00
Group 35.532.155.678.651.94
Group 46.291.635.798.804.44
Group 58.461.178.999.166.38
Table 5. Statistical data of inhabitant consumption.
MWh/Year
Equivalized Disposable IncomeMeanStd. Dev.MedianMaximumMinimum
Group 10.410.550.262.820.00
Group 21.481.001.763.280.00
Group 32.180.822.133.640.81
Group 42.480.642.283.761.88
Group 52.680.312.822.8221.3
Table 6. Statistical data of household consumption without the influence of climate.
MWh/Year
Equivalized Disposable IncomeMeanStd. Dev.MedianMaximumMinimum
Group 11.591.760.807.390.00
Group 23.672.353.487.470.00
Group 34.631.624.607.231.87
Group 45.620.985.687.334.30
Group 56.500.896.118.095.96
Table 7. Statistical data of inhabitant consumption without the influence of climate.
MWh/Year
Equivalized Disposable IncomeMeanStd. Dev.MedianMaximumMinimum
Group 10.600.640.332.690.00
Group 21.390.871.482.690.00
Group 31.790.621.812.690.72
Group 42.170.442.052.691.66
Group 52.090.331.942.691.94
Publisher’s Note: MDPI stays neutral with regard to jurisdictional claims in published maps and institutional affiliations.

