Article

A New Device Hypothesis for Water Extraction from Air and Basic Air Condition System in Developing Countries

Department of Engineering for Innovation, University of Salento, 73100 Lecce, Italy
*
Author to whom correspondence should be addressed.
Energies 2021, 14(15), 4507; https://doi.org/10.3390/en14154507
Submission received: 7 June 2021 / Revised: 22 July 2021 / Accepted: 23 July 2021 / Published: 26 July 2021
(This article belongs to the Section B2: Clean Energy)

Abstract

:
This work proposes a new device for air treatment with dehumidification and water recovery/storage, with possible mitigation of indoor environmental conditions. The system is based on Peltier cells coupled with a horizontal earth-to-air heat exchanger, it is proposed as an easy-to-implement alternative to the heat pumps and air handling units currently used on the market, in terms of cost, ease of installation, and maintenance. The process provides the water collection from the cooling of warm-humid air through a process that leads to condensation and water vapor separation. The airflow generated by a fan splits into two dual flows that lap the two surfaces of the Peltier cells, one flow laps the cold surfaces undergoing sensible, latent cooling with dehumidification; the other flow laps the hot surfaces and heats up. The airflow undergoes thermal pre-treatment through the underground horizontal geothermal pipe that precedes the Peltier cells. In the water storage tank, which also works as a mixing chamber, the two air streams are mixed to regulate the outlet temperature. The system can be stand-alone if equipped with a photovoltaic panel and a micro wind turbine, able to be used in places where electricity is absent. The system, with different configurations, is modeled in the African city Kigali, in Rwanda.

Graphical Abstract

1. Introduction

Climate change has led to multiple effects on natural and human systems on all continents, worsening living conditions [1]. Water is a vital resource for human life, but over time this resource is gradually decreasing and has become one of the main challenges to sustainable development in the framework of climate change [2]. This phenomenon is causing many social and environmental problems, including the scarcity of potable water [3], the reduction of agricultural productivity [4], and the degradation of water quality [5], leading to inevitable serious consequences to socioeconomic development as well [6]. A clear picture of savings in water consumption is becoming increasingly important to ensure the sustainability of buildings and districts [7,8]. The main causes of water scarcity include rapid population growth, lack of adequate government planning, the presence of many rural communities far from typical urban water sources, and an increase in hot weather and drought. It is necessary to identify effective solutions to combat this crisis.
In recent years, a great concern about the implementation of energy efficiency devices in South Africa’s residential sector has been developed [9]. Growth and innovation are key aspects of South Africa’s development, which can lead to efficient, sustainable, and equitable management of water resources. Approximately 80% of the South African population includes poor people who experience low household water security [10]. In addition to the residential sector, water scarcity also threatens productive sectors. The long experience with water scarcity and urgent water supply challenges have led to numerous studies for water sector innovation [11]. The current state of drinking water networks in most African countries highlights the need to have effective management methods for physical and financial operations. Innovative technologies can bring operational and financial risks for water utilities, especially for completely new platforms [12]. In addition, poor maintenance, and lack of adequate investment in the already old water storage, distribution, and treatment infrastructure can lead to inadequate water supply [13].
Salehi et al. [14] conducted a comprehensive overview of the most prominent emerging technologies for water production.
Although innovative, affordable, and more portable new water technologies have been developed [15,16,17], their energy consumption may still be too high, leading to many environmental pressures.
An important advancement with strong potential to counter the problem of water scarcity is the Atmospheric Water Generator (AWG), which permits the production of water from the air. Specifically, AWGs extract water molecules from the air, leading to a phase change from vapor to liquid [18].
Shourideh et al. [19] proposed a small-scale AWG prototype using the Peltier effect for cooling. Water efficiency increases with relative humidity. Increasing the current of the individual thermoelectric cooler (TEC) increases the water generation rate, resulting in higher specific energy consumption as a result of the decrease in COP (Coefficient of Performance).
Liu et al. [20] implemented a portable water generator with two thermoelectric coolers (TECs). The results showed that the amount of water generated, and the condensation rate increased with increasing RH (Relative Humidity). This system had a small size and could work at small airflow rates, which was suitable for outdoor applications. Although many experimental studies have been performed on vapor treatment [21,22], another method of collecting water is through underground condensation which results in a simple process for producing water from humid air. In this approach, through the intake system, the air is directed underground where it cools rapidly due to the different temperatures between the surface and underground sections. The water is stored in underground reservoirs, and a water pump enables the water to be pumped up to the surface for agricultural and irrigation purposes [23,24].

Objective and Novelty of the Project

This study presents a hypothetical solution useful to combat water scarcity. The new water collection system is based on the condensation process achieved by coupling Peltier cells to a horizontal earth-to-air heat exchanger (EAHX). The system involves exploiting the ground temperature, which is almost constant, with small and slow fluctuations throughout the year, lower than the outdoor temperature in summer and higher in winter [25]. The airflow is so pretreated before meeting the Peltier cells.
The novelty of this study is the combination of geothermal systems with Peltier cells, both of which are widely studied individually but never coupled to implement water harvesting and air conditioning. This innovative system is totally new and has never been presented in the literature.
The designed system involves a simple construction with low costs, realizable on-site, and reduced environmental impact, being built with easily available materials, such as plastic pipes (for the construction of geothermal pipes) and Peltier cells (for example recovered from the dismantling of old computers or portable refrigerators). It is also a simple alternative to heat pumps and air handling units currently on the market, in terms of cost, ease of installation, and maintenance. As the scientific and industrial community is increasingly interested in the use of renewable energy sources as an alternative to conventional, more expensive, and highly polluting generators [26], the proposed system can be considered in line with this trend, as in addition to the use of geothermal, can also become stand-alone when coupled with a hybrid system, and thus can also be widely used in remote areas not connected to the grid [27].
The behavior of the new device is shown by simulating its performance in Kigali, Rwanda. The results highlight the amount of water stored as the number of Peltier cells varies.

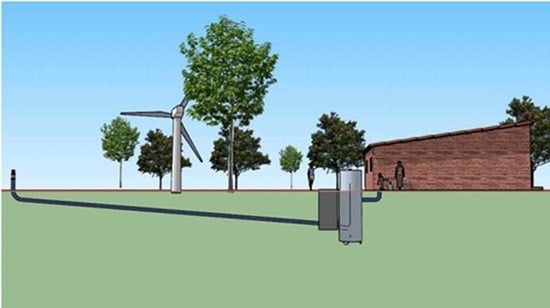
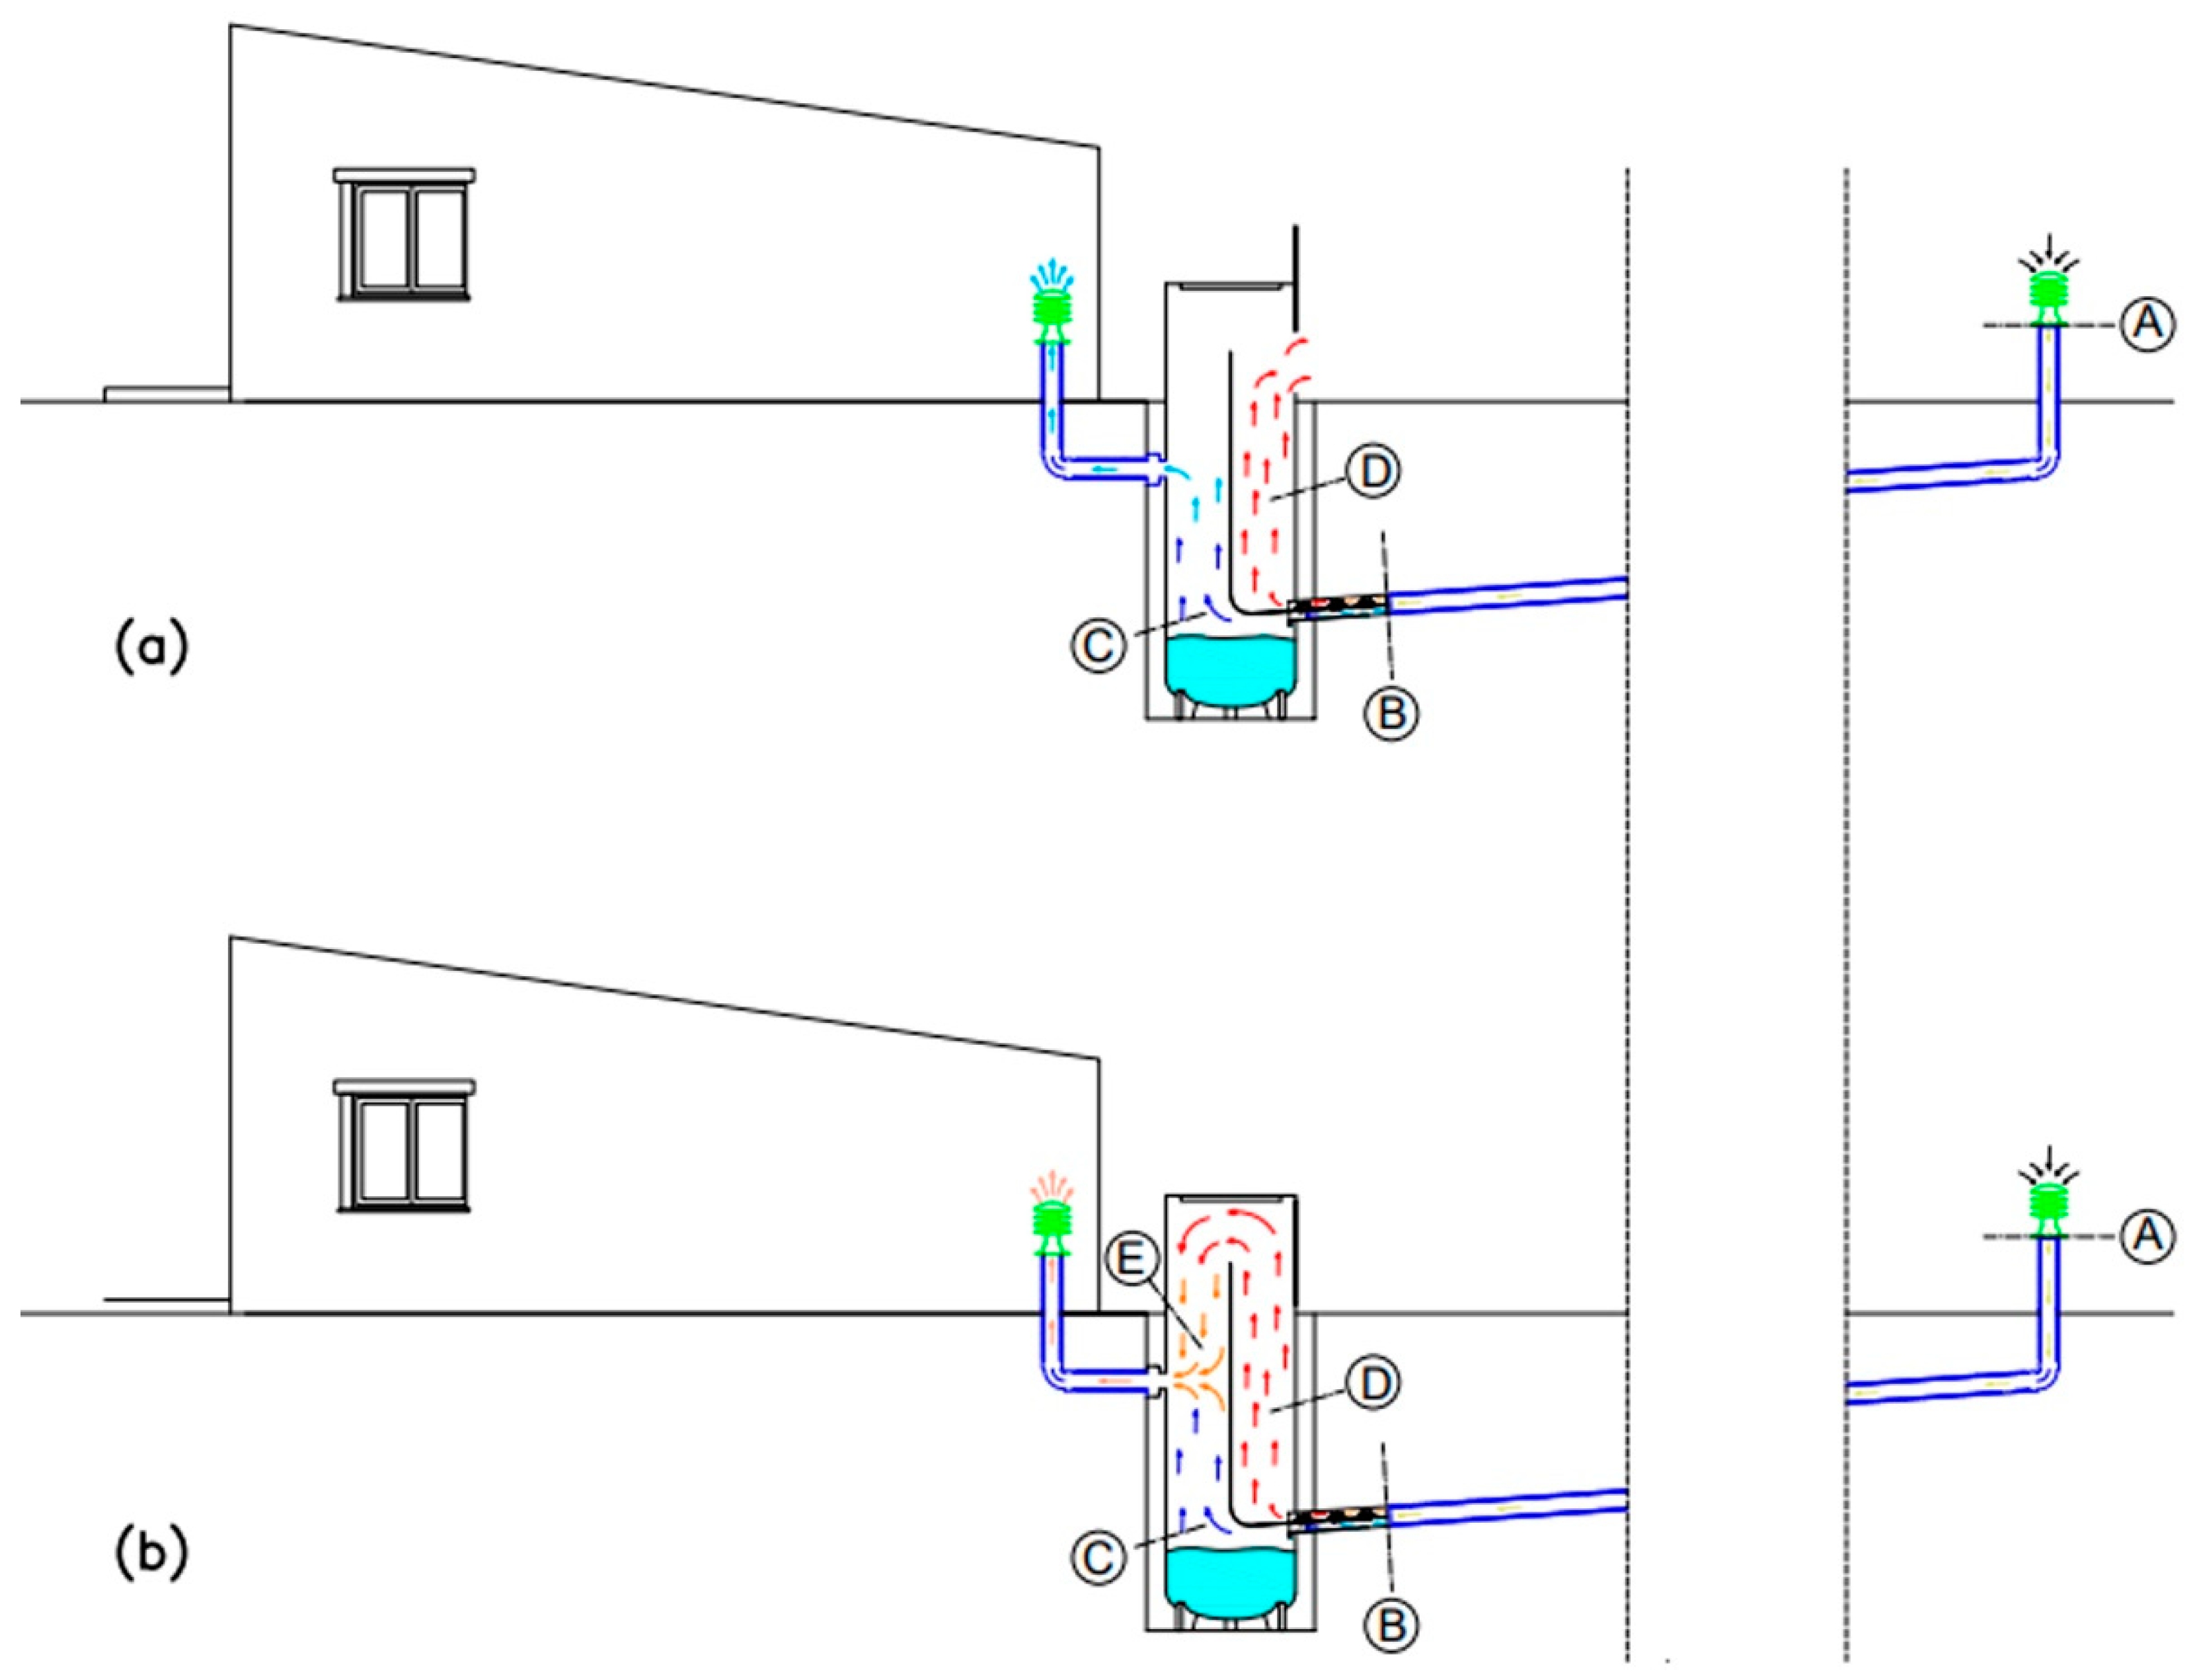
2. The Proposed System
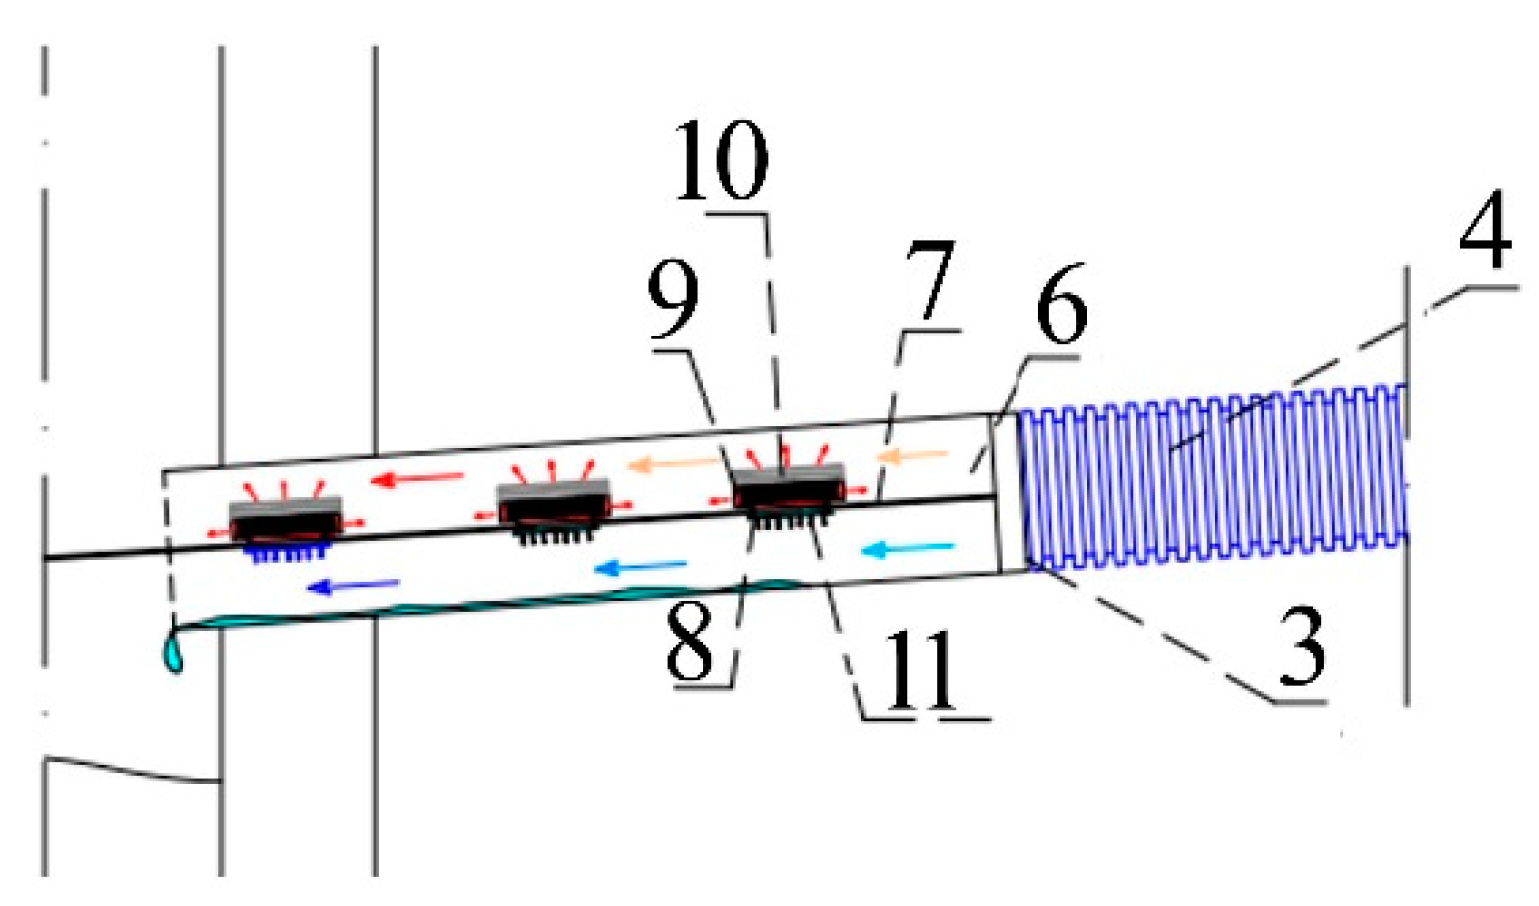
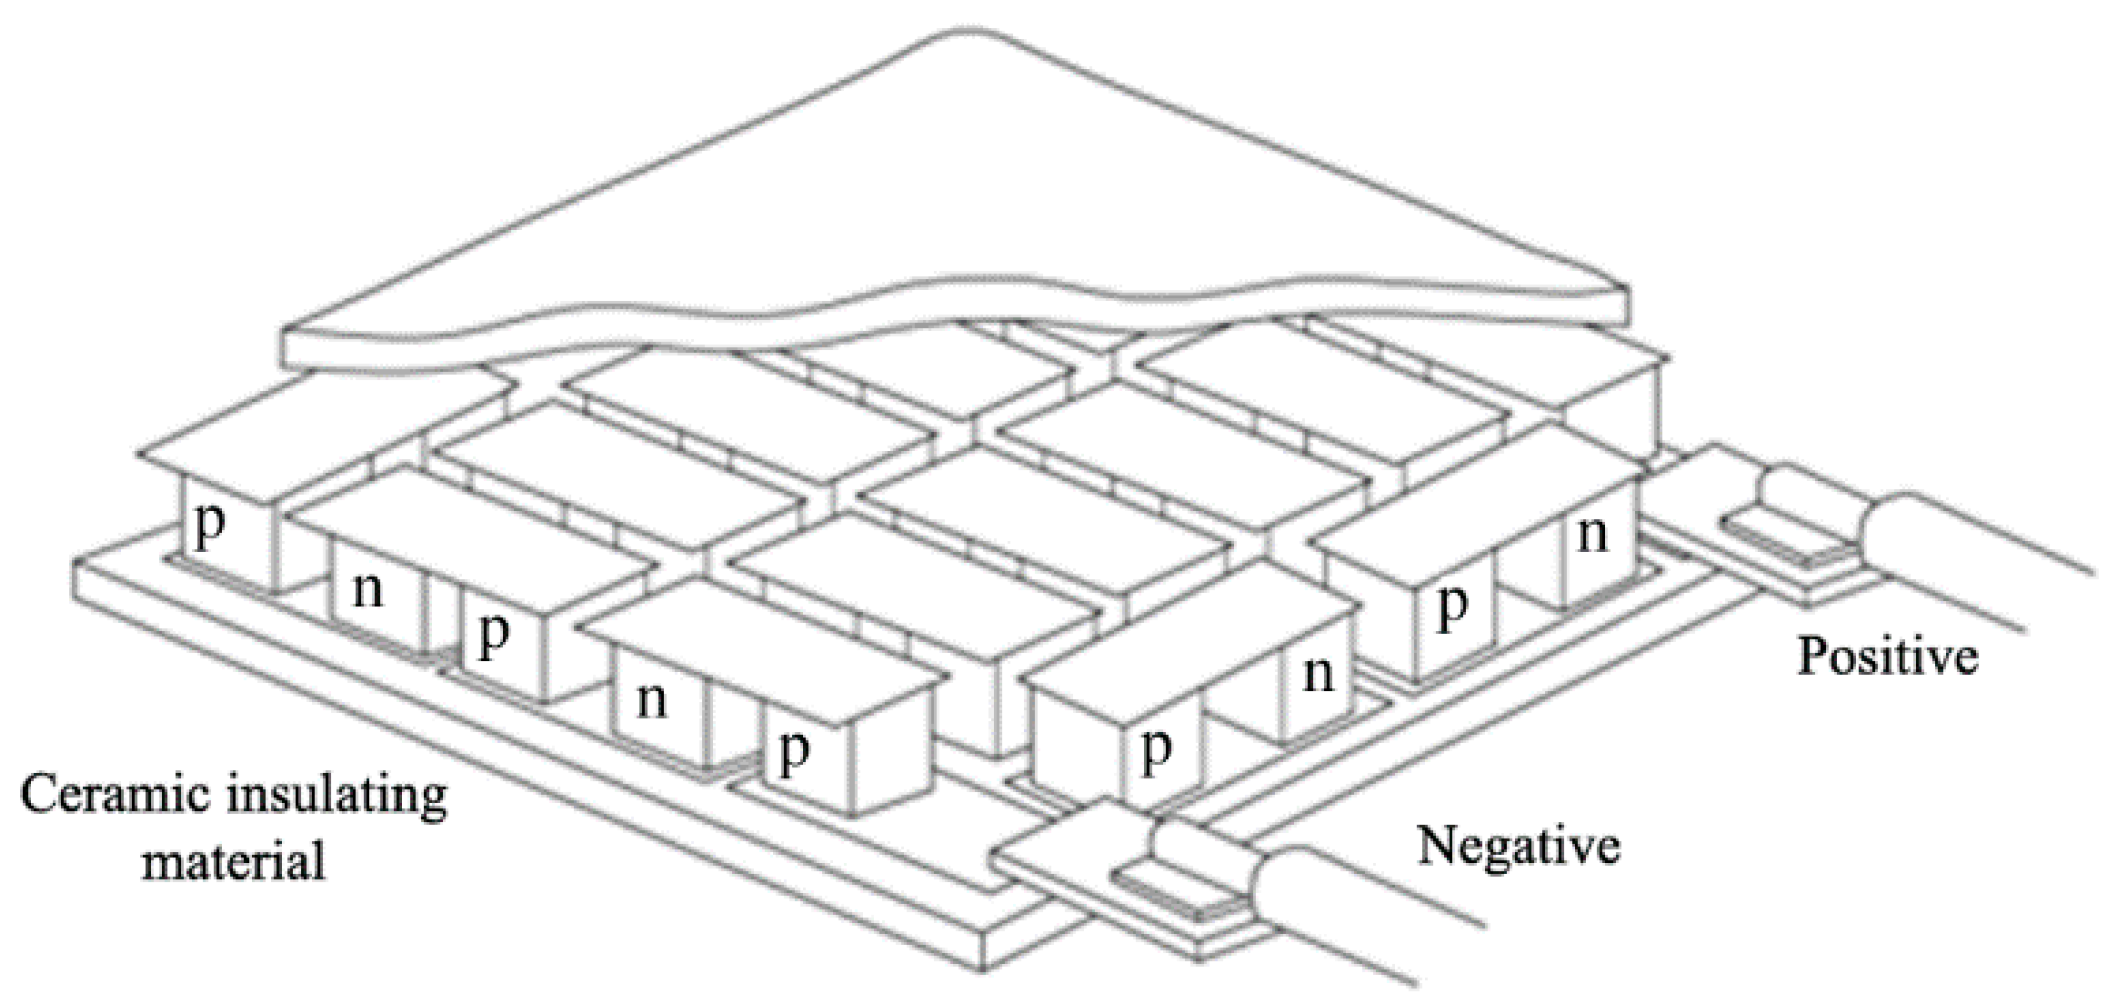
Figure 1, Figure 2 and Figure 3 show the details of the different components that make up the system, while Figure 4 illustrates the states of the humid air along with the entire system and Table 1 makes it easy to identify system components and humid air states.
External ventilation air (state A) is passed through a geothermal probe, where it undergoes thermal pre-treatment, mainly pre-cooling (B). If the temperature falls below the dew point, condensation of the water begins in the geothermal probe itself. Next, the airflow meets the Peltier cell array, where the airflow is divided into two streams: the first laps the cold side of the Peltier cell cooling and dehumidifying (state C), the second laps the hot side heating (state D).
The condensed water accumulates in the tank, which also acts as a mixing chamber. If necessary, the two air flows can mix to regulate the temperature of the room (state E). The fans and Peltier cells can be powered by small photovoltaic panels and micro wind turbines, creating autonomous systems.
The air intake (component 1) is raised at least one meter above the ground to prevent dirt or dust from entering. The geothermal pipe (component 4), approximately 20 m long, is laid at a depth of 1.2 m, with a slope of 0.5% in the direction of flow to facilitate the collection of condensation water. The soil on which the geothermal pipe rests must be well compacted to avoid subsidence and the formation of water pockets. The trench will then be filled with fine-grained, stone-free, and thoroughly compacted material to prevent the formation of air pockets.
As shown in Figure 2, the geothermal pipe (component 4) is followed by the Peltier cell array (component 8), where a planar septum (7) is positioned to split the entire volume longitudinally into two half-cylinders.
The blue arrows indicate the flow of air that laps the cold side, cooling and dehumidifying, and the red arrows represent the flow that laps the hot side, heating.
The result of this process is the formation of condensation on the cold side. Condensate water falls downward by gravity, where it is collected in a tank (component 13), shown in Figure 3. The dimensions of the square-based tank are width 1.25 m, height 3.30 m, of which 2.30 m are underground.
Depending on seasonal requirements, it is possible to choose to supply fresh or warm air into the home through the opening or closing of the grille (12), shown in Figure 3. Specifically, when the grille is open (Figure 3a) hot air flows outside, when it is closed (Figure 3b) it mixes with cold air through the space between the septum and the tank closure. The opening and closing of the grille are managed directly from the outside allowing the temperature to be regulated inside the home.
In other words, looking at Figure 4, the two flows can then proceed separately or give rise to adiabatic mixing. If the objective is to maximize the cooling component, the flow in condition (C) is sent directly into the room to be conditioned (Figure 4a), whereas if a post-heating is required, the two flows, cold (C) and hot (D) are mixed again before being sent into the room to be conditioned (Figure 4b).
The system can be equipped with a photovoltaic panel and a micro-wind turbine, making the system adaptable even in places where there is no electricity. It can be susceptible to many modifications, all components can be customized and are replaceable with other technically equivalent elements, depending on the context in which the system operates.

2.1. Peltier Cells

Peltier cells can be considered as a reversible thermoelectric device, consisting of two external plates [28]. The Peltier cell is essentially a solid-state heat pump with the appearance of a thin plate; one of the two surfaces absorbs heat while the other emits it. The direction in which the heat is transferred depends on the direction of the direct current applied to the ends of the plate itself. A common Peltier cell consists of two N-doped semiconducting materials and P-type semiconductors, connected by a copper strip. If a positive voltage is applied to type N and a negative voltage is applied to type P, the upper strip cools while the lower strip heats up. By reversing the voltage, the thermal energy shift is correspondingly reversed. On the market, there are isolated Peltier cells and non-insulated Peltier cells, the former (Figure 5) is coated with ceramic material on the top and at the bottom and guarantees higher yields than the latter. The device is powered by a constant current.
The common use of the cell involves the subtraction of heat by adhesion of the cold side to the body to be cooled; the subtraction of heat is favored by the creation of appropriate thermal bridges (thermo-conductive adhesives or, for a better thermal transfer, graphite sheets with a thickness of a few tenths of a millimeter) that allow the best conduction. The subtracted heat is transferred to the hot side together with the operating heat (this is most of it); on the hot side, the heat must be transferred to the external environment. The main problem is the control of the current intensity which corresponds to the subtraction of heat: if the thermal source changes in the value of heat emission, the subtraction carried out by the cell must also vary accordingly. If possible, this variation must be carried out with temperature detectors so that, using a special feedback circuit, the current intensity administered to the cell maintains its operation in the permissible temperature ranges. Peltier cells are used where small quantities of material need to be cooled quickly. Peltier cells are reversible due to the Seebeck effect: heating one side and cooling the other, an electric circuit connected to the cell heads will flow a direct current proportional to the difference in temperature between the two faces.
Peltier cells have some significant disadvantages that limit their use. The efficiency of the Peltier cell is very low, the electricity input is much greater than the thermal energy taken from the cold side, leading to poor efficiency. This means that the amount of heat dissipated by the cell on the hot side is much greater than that which can be removed from the cell on the cold side or that, in the reverse use, only a small fraction of the thermal energy that passes into the cell is transformed into electricity. This limits the use of the Peltier cell to applications where power use is low.
Since the cell has a heat flow between the two sides, to maximize the temperature difference between the cold side and the environment and, at the same time, avoid damage to the cell on the hot side (which usually occurs around 90 °C), it is necessary to remove the heat generated using heat sinks, radiators or heat pipes which are usually larger and heavier than the cells themselves. This means that the size of a thermal system based on Peltier cells depends mainly on the cooling system of the cells. In the case study, heat is removed through a flow of air from the geothermal system which passes over the hot side of the cell.

2.2. Horizontal Earth-to-Air Heat Exchanger

A horizontal earth-to-air heat exchanger (EAHX) consists of an underground pipe usually installed near the building and connected to it [29]. One of the advantages of this system is the exploitation of the ground temperature for the treatment of the air passing through the pipe. Therefore, specifically, the ground can be used to pre-cool (in summer) or pre-heat (in winter) the air passing through the pipe. The exiting air can be used for ventilation and to handle partially or totally the thermal loads [30]. Clearly, the physical properties of the ground and the climatic conditions of the site need to be considered for optimal system design, as they affect system performance [31]. The pipe can be installed vertically or horizontally [32]. When the exterior building area is small, it is preferable to install the pipe vertically, in order not to have space problems. About the depth at which the pipes are buried, it should be noted that a greater depth allows the system to be less affected by external temperature fluctuations. In horizontal systems, to avoid interaction between the pipes, it is recommended that the pipes be spaced at least 1.5 m and buried at a depth of 1.2 m to 1.8 m [33]. There are clear advantages in using the earth-to-air heat exchangers in buildings located in hot climates during the summer season, already with short pipes, while in winter the benefits of the system are just for few hours during the day. In the paper [34], it was investigated how geometric configuration, soil thermal conductivity, heat transfer fluid velocity, and installation depth affect the behavior of earth-to-air heat exchangers, using CFD simulations. In addition, the paper [35] shows the impact of the unsaturated ground on the performance of the ground heat exchanger as the depth varies through numerical simulation. The results showed that the performance under unsaturated soil conditions decreased up to 40% compared to that under fully saturated ground conditions. In this regard, the study [36] has given a complete database on transient ground temperatures, which was acquired by surveying a case study located in southern Brazil. Regarding outdoor climate conditions, the study [37] considers different climate zones in China, showing higher energy savings of the system application in warm climates.

3. Calculation

The numerical analysis carried out for the simulation of the system consists of three phases:
(1)
Calculation of the geothermal heat transfer and determination of the thermohygrometric conditions at the outlet of the geothermal probe;
(2)
Calculation of the thermal power exchanged on the cold and hot sides with the Peltier cell array;
(3)
Calculation of the indoor air intake conditions with or without adiabatic mixing.
Given the conditions of the external air entering the system and the characteristics of the soil for calculating the heat exchange with the geothermal probe, the dry bulb temperature, relative humidity, and absolute humidity after passing through each component of the system were calculated.

3.1. The Geothermal System

The geothermal system is modeled considering all the characteristics of the pipe, installation, climate, and soil. There are several widely used software programs for modeling geothermal systems, including GAEA [38,39] Energy Plus [40], Fluent [41], TRNSYS tool [42]. This study involved the use of GAEA software, developed by the University of Siegen, which provides a simple and effective approach to dimension and evaluate the energy contribution of an EAHX system [43], especially during the preliminary design phase. The system is tested in the city of Kigali, Rwanda, classified as Aw, Tropical Savanna Climate [44,45], in Koppen Climate classification. Climate data are imported from the Meteonorm meteorological data file and processed with a 1-h step for 8760 h (one year).
The air geothermal pipe is generally made of high-pressure cross-linked polyethylene (in PE-Xa) and non-cross-linked polyethylene (in PE 100). The thermal conductivity of the pipe has little influence on the overall heat transfer, whereas the thermal conductivity of the ground is of particular importance. The influence of the soil thermal conductivity was not investigated and therefore an average reference value of 1.28 W/mK was taken.
GAEA, knowing the climatic conditions, the characteristics of the ground, and the geothermal pipe, returns the temperature of the air leaving the pipe (state B). This temperature was then compared with the dew temperature of the inlet conditions (state A) to determine any condensation that may have occurred in the geothermal probe. Table 2 reports all technical parameters useful for the simulation in GAEA software.

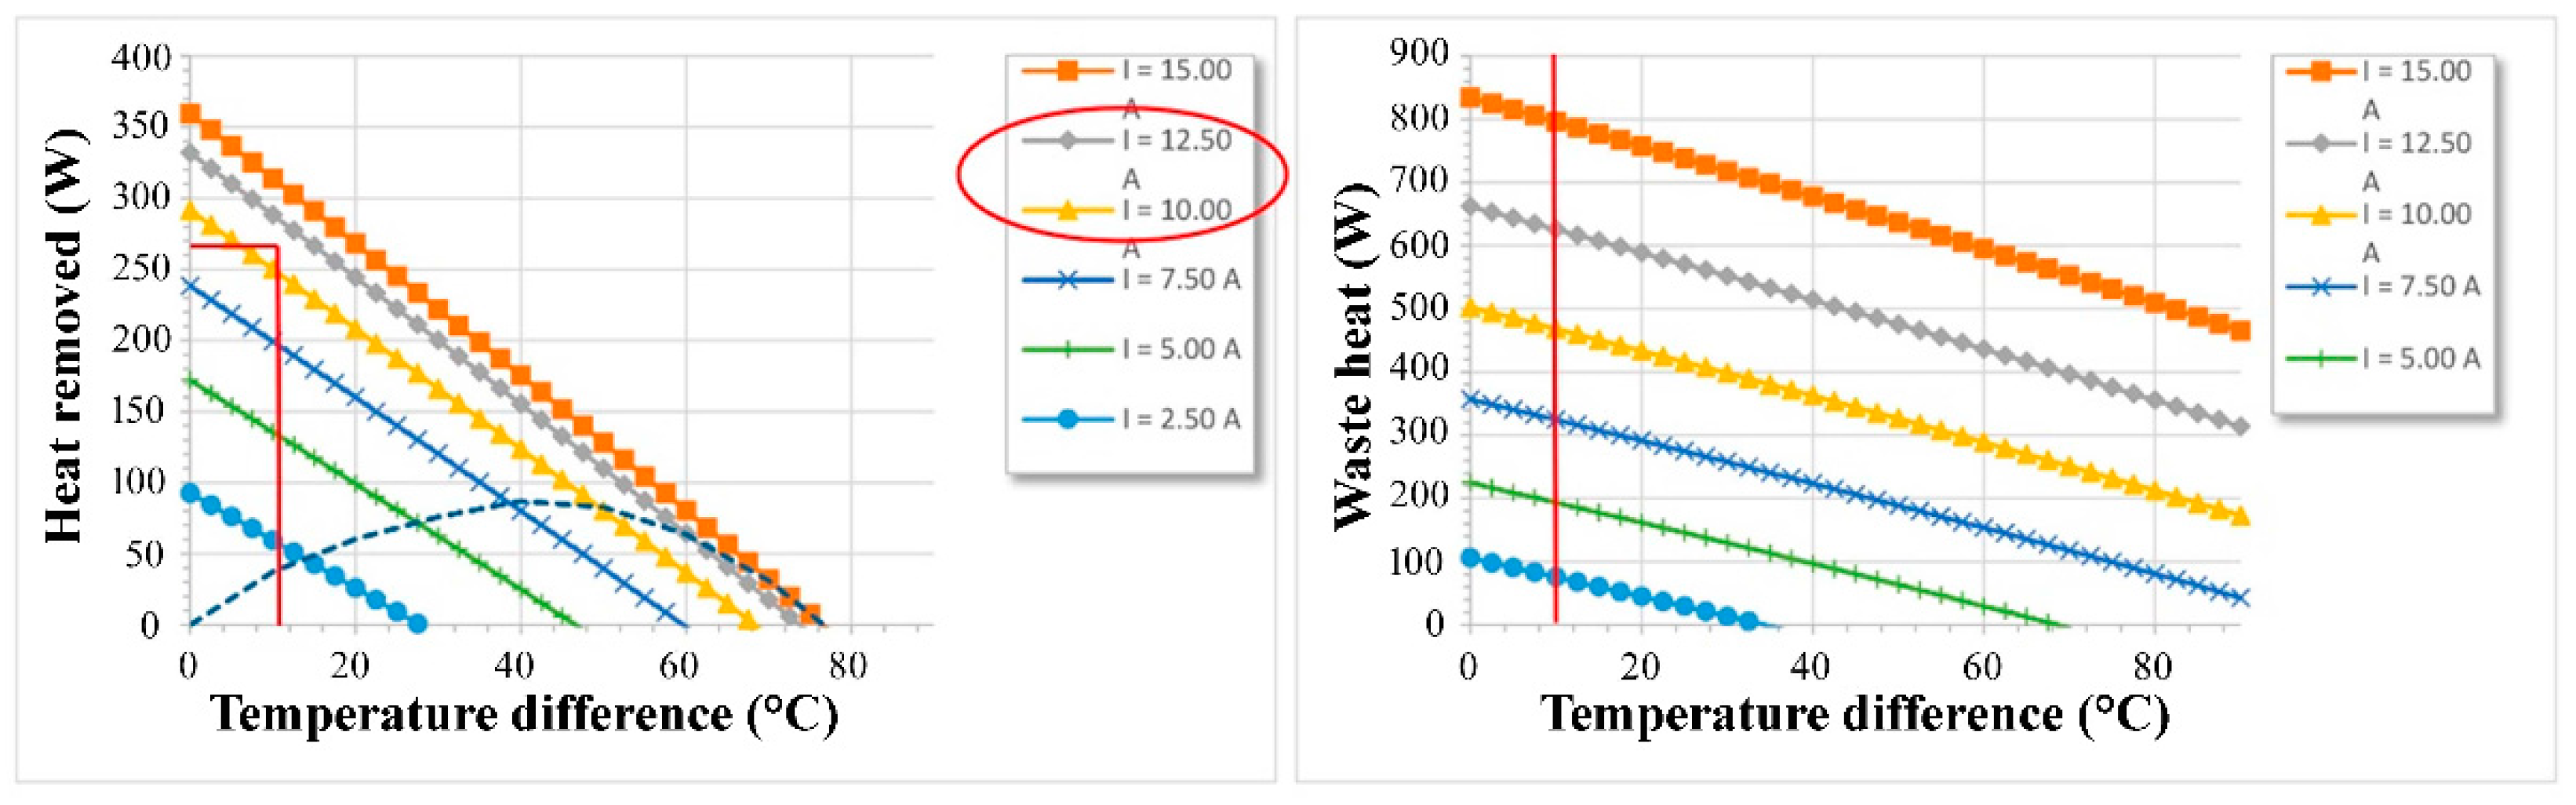
3.2. The Peltier Cell Array

Given the thermo-hygrometric conditions exiting the geothermal pipe and the thermal powers exchanged on the hot and cold sides of the Peltier cell, it was possible to use the Ashrae diagram to calculate the final conditions of the air passing through the series of Peltier cells.
As reported in Table 3, the maximum cooling capacity of the Peltier cell is assumed to equal 0.340 kW, detailed Peltier cell technical data can be seen in [46]. However, for a reliability calculation, the maximum nominal cooling power of the Peltier cells is not taken into account, but the calculation value was chosen on the operating conditions, as shown in the diagrams of Figure 6 relating to the performance behavior of the Peltier cell. In fact, the first hypothesis is that the Peltier cell will work with an amperage similar to that of a photovoltaic panel, i.e., around 10–12 A.
The second hypothesis is that the airflow coming from the geothermal probe is split into two flows at the same temperature that lap, respectively, the hot and cold sides of the cells. Therefore, it is expected that the Peltier cell will work with a hot-side temperature of about 50 °C and small temperature differences on the hot-cold side (about 15–20 °C), with a cold airflow that is cooled with a cooling power of about 0.267 kW for each cell and a hot airflow that is heated with a heating power of about 600 W for each cell.

3.3. Adiabatic Mixture

As mentioned above, the two flows exiting the Peltier cell section can proceed separately or result in adiabatic mixing. In the results section the thermo-hygrometric conditions for state E, following the possible adiabatic mixing of the two moist air streams, are shown. The calculation is omitted as it is widely found in the literature.

4. Results

The results, in terms of the thermo-hygrometric conditions of the humid air, such as dry bulb temperature, relative and absolute humidity, and heat exchanged, are reported for each passage through each component of the system.

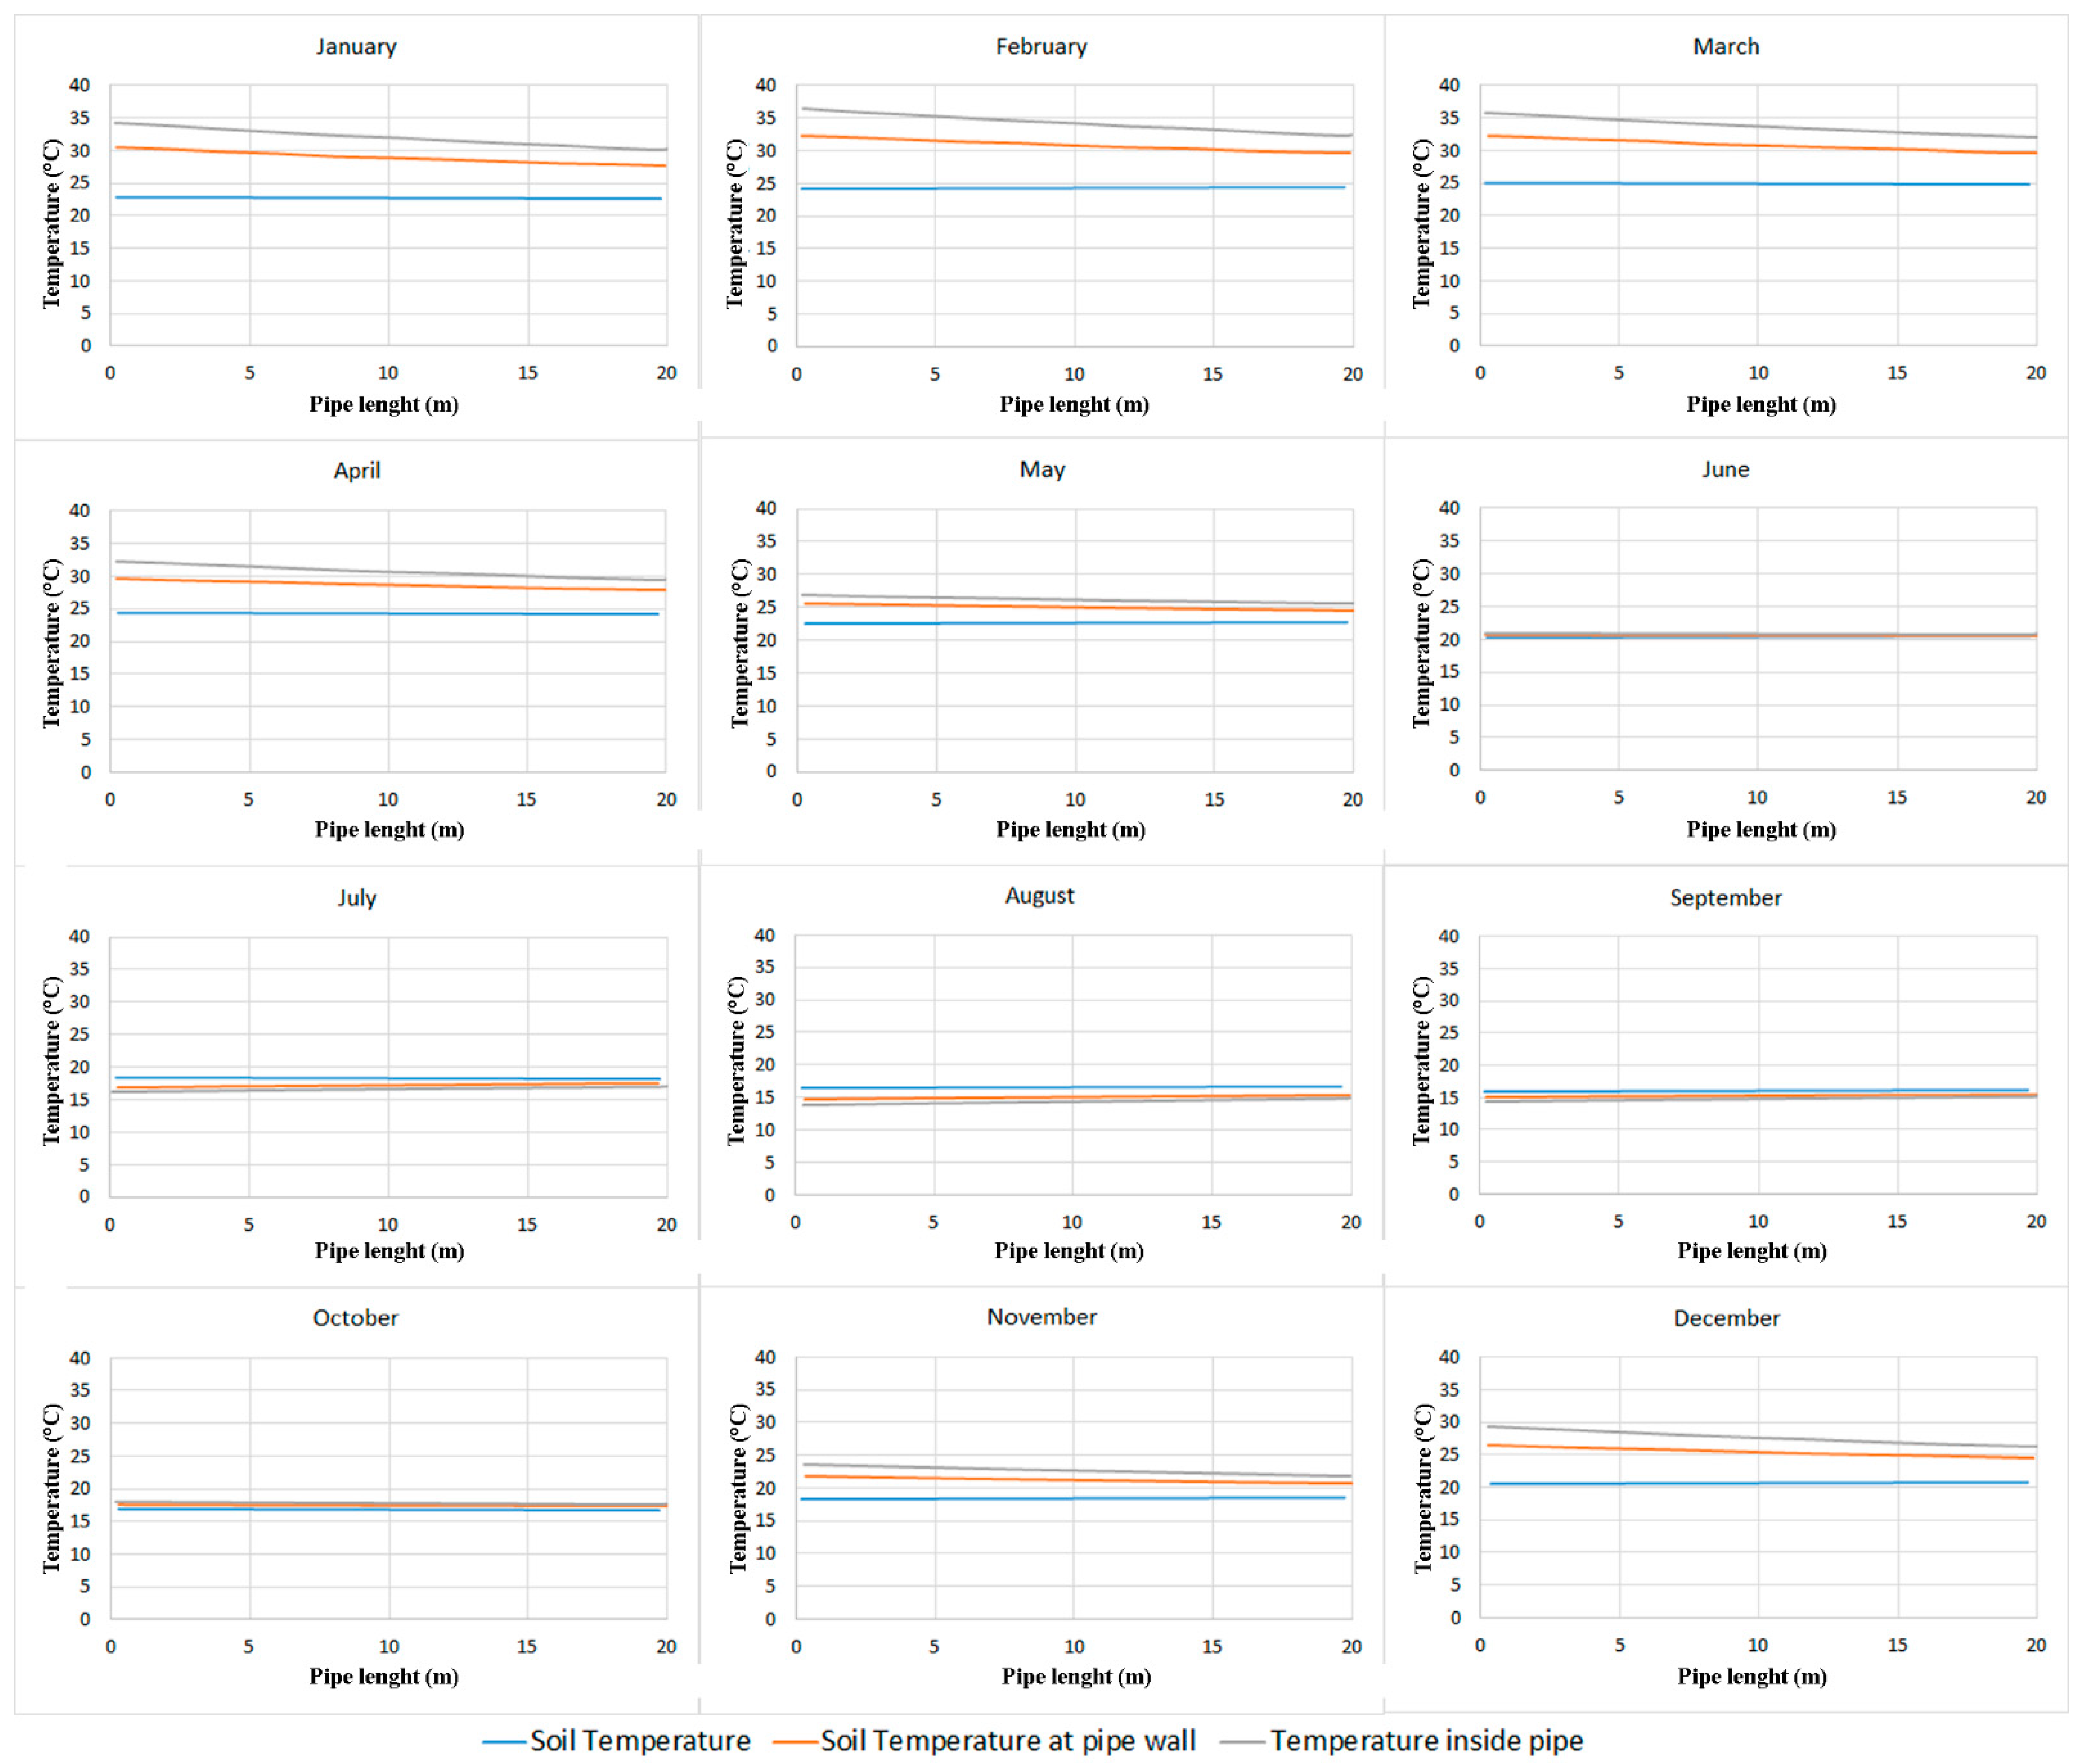
4.1. Monthly Trends of Temperatures Along the Length of the Pipe

Figure 7 shows the temperature trends of the soil, the outer side of the pipe, and the air flowing inside the pipe, for the entire length of the geothermal pipe (20 m in length), resulting from the simulations performed in the GAEA software. The technical parameters of the geothermal system set in GAEA are shown in Table 2. To provide an annual overview of temperature trends along the length of the pipe, trend values are plotted considering the 15th of each month at 12:00 noon.
Peltier cells were not simulated in GAEA because the airflow exiting the geothermal laps the Peltier cells after the 20-m pipe. In fact, the simulations performed in GAEA are used to only compute the pre-treatment provided by the geothermal system. Next, the Ashrae diagram is used to quantify the amount of condensed water.
As it is evident from the graphs, from June to October the three trends are very close, while in the other months they are more distanced, reaching the maximum distance in February. In July and August, although very close, the three curves show a reversal of trends with the soil temperature greater than the temperature inside the pipe. In other months, however, the temperature inside the pipe, being greatly influenced by the outside temperature is higher than the temperature of the soil.

4.2. Thermohygrometric Analysis and Calculation of Collected Water

The psychometric graph was used to calculate the amount of water collected. The complete process for calculating the amount of water relative to January 15 is shown as an example. The conditions of the external air entering the geothermal pipe are temperature equal to 34.3 °C, and relative humidity of 83.5%, which correspond to external air content of 29.28 g/kg, and enthalpy of 108.246 kJ/kg.
The total mass flow rate (Qm), corresponding to the mass of fluid flowing through a section in the unit, is calculated as follows:
Q m = ρ ·   Q v
where   ρ is the fluid density (kg/m3) and Q v is the volume flow (m3/s).
The chosen fan has dimensions equal to 120 mm × 120 mm × 38 mm and a capacity of 234 m3/h (corresponding to Qv), thus the Q m , t o t value is:
Q m , t o t = ( 234 · 1.225 ) / 3600 = 0.07963   kg / s
The output values of temperature and relative humidity are exported from the simulations performed in GAEA software.
By calculating the changes in relative humidity entering and exiting the geothermal pipe, the amount of water condensed in the geothermal has been determined ( q H 20 , g e o ) as the difference between the inlet and outlet title ( X 1 X 2 ) in the geothermal pipe, multiplied by the total mass flow rate ( Q m , t o t ).
q H 2 O , g e o = (   X 1 X 2 ) · Q m , t o t
As the number of cells can be variable the corresponding cooling power value (𝑃n𝐶𝑒𝑙𝑙 𝑃𝑒𝑙𝑡𝑖𝑒𝑟) is calculated by multiplying 𝑃𝐶𝑒𝑙𝑙 𝑃𝑒𝑙𝑡𝑖𝑒𝑟 for the number of cells.
The mass flow rate in a single cooling section (𝑄𝑚, 𝑠) is 0.03981 Kg/s. The enthalpy output from Peltier cells is ℎ3, calculated as the difference between the enthalpy input to Peltier cells and the subtracted enthalpy.
The condensed water in the Peltier section is given by:
q H 2 O , P e l t i e r   c e l l = Q m ,   s · ( X 2 X 3 )
where:
m is the mass flow value of the only cooling section (m3/h),
X 2 is the title corresponding to the output values from the geothermal system (g/kg),
X 3   is the title corresponding to the output values of the section Peltier (g/kg).
The amount of collected water can be calculated as the sum of the water condensed in geothermal plus the water condensed in the Peltier cell array.
As an example, the treatments of humid air on the ASHRAE diagram in January in Figure 8 and in August in Figure 9 are reported.
Figure 8 shows the treatment of the air on 15 January where it goes from state A to state B directly in the geothermal pipe. In other words, by starting the condensation of water vapor directly in the geothermal pipe, the airflow here is subject to pre-cooling and initial condensation of the vapor. However, the condensation phenomenon is not always triggered in the geothermal pipe, it depends on the climatic conditions, so the transformation represented with the orange line may take place in the geothermal pipe or be the first part of the treatment that takes place in the cold side of the Peltier cell section. In this case, as the external temperatures are high, there is no subsequent adiabatic mixing, but the flow that laps the cold side of the Peltier cells is sent directly into the room. The representative diagram of the system is shown in Figure 4a.
Figure 9 shows the Ashrae diagram for August 15. Specifically, the treatment of moist air begins as it passes through the geothermal probe, which does not produce a substantial temperature change from state A to state B. Subsequently, the airflow splits into two streams: the first laps the cold side of the Peltier cells passing from state B to state C, the second laps the hot side passing from state B to state D. The power exchanged with the hot side is about two-three times the power exchanged with the cold side.
The two flows are then mixed adiabatically, since the two flows have the same flow rate, the representative point of the final state is E, the midpoint of segment C-D.

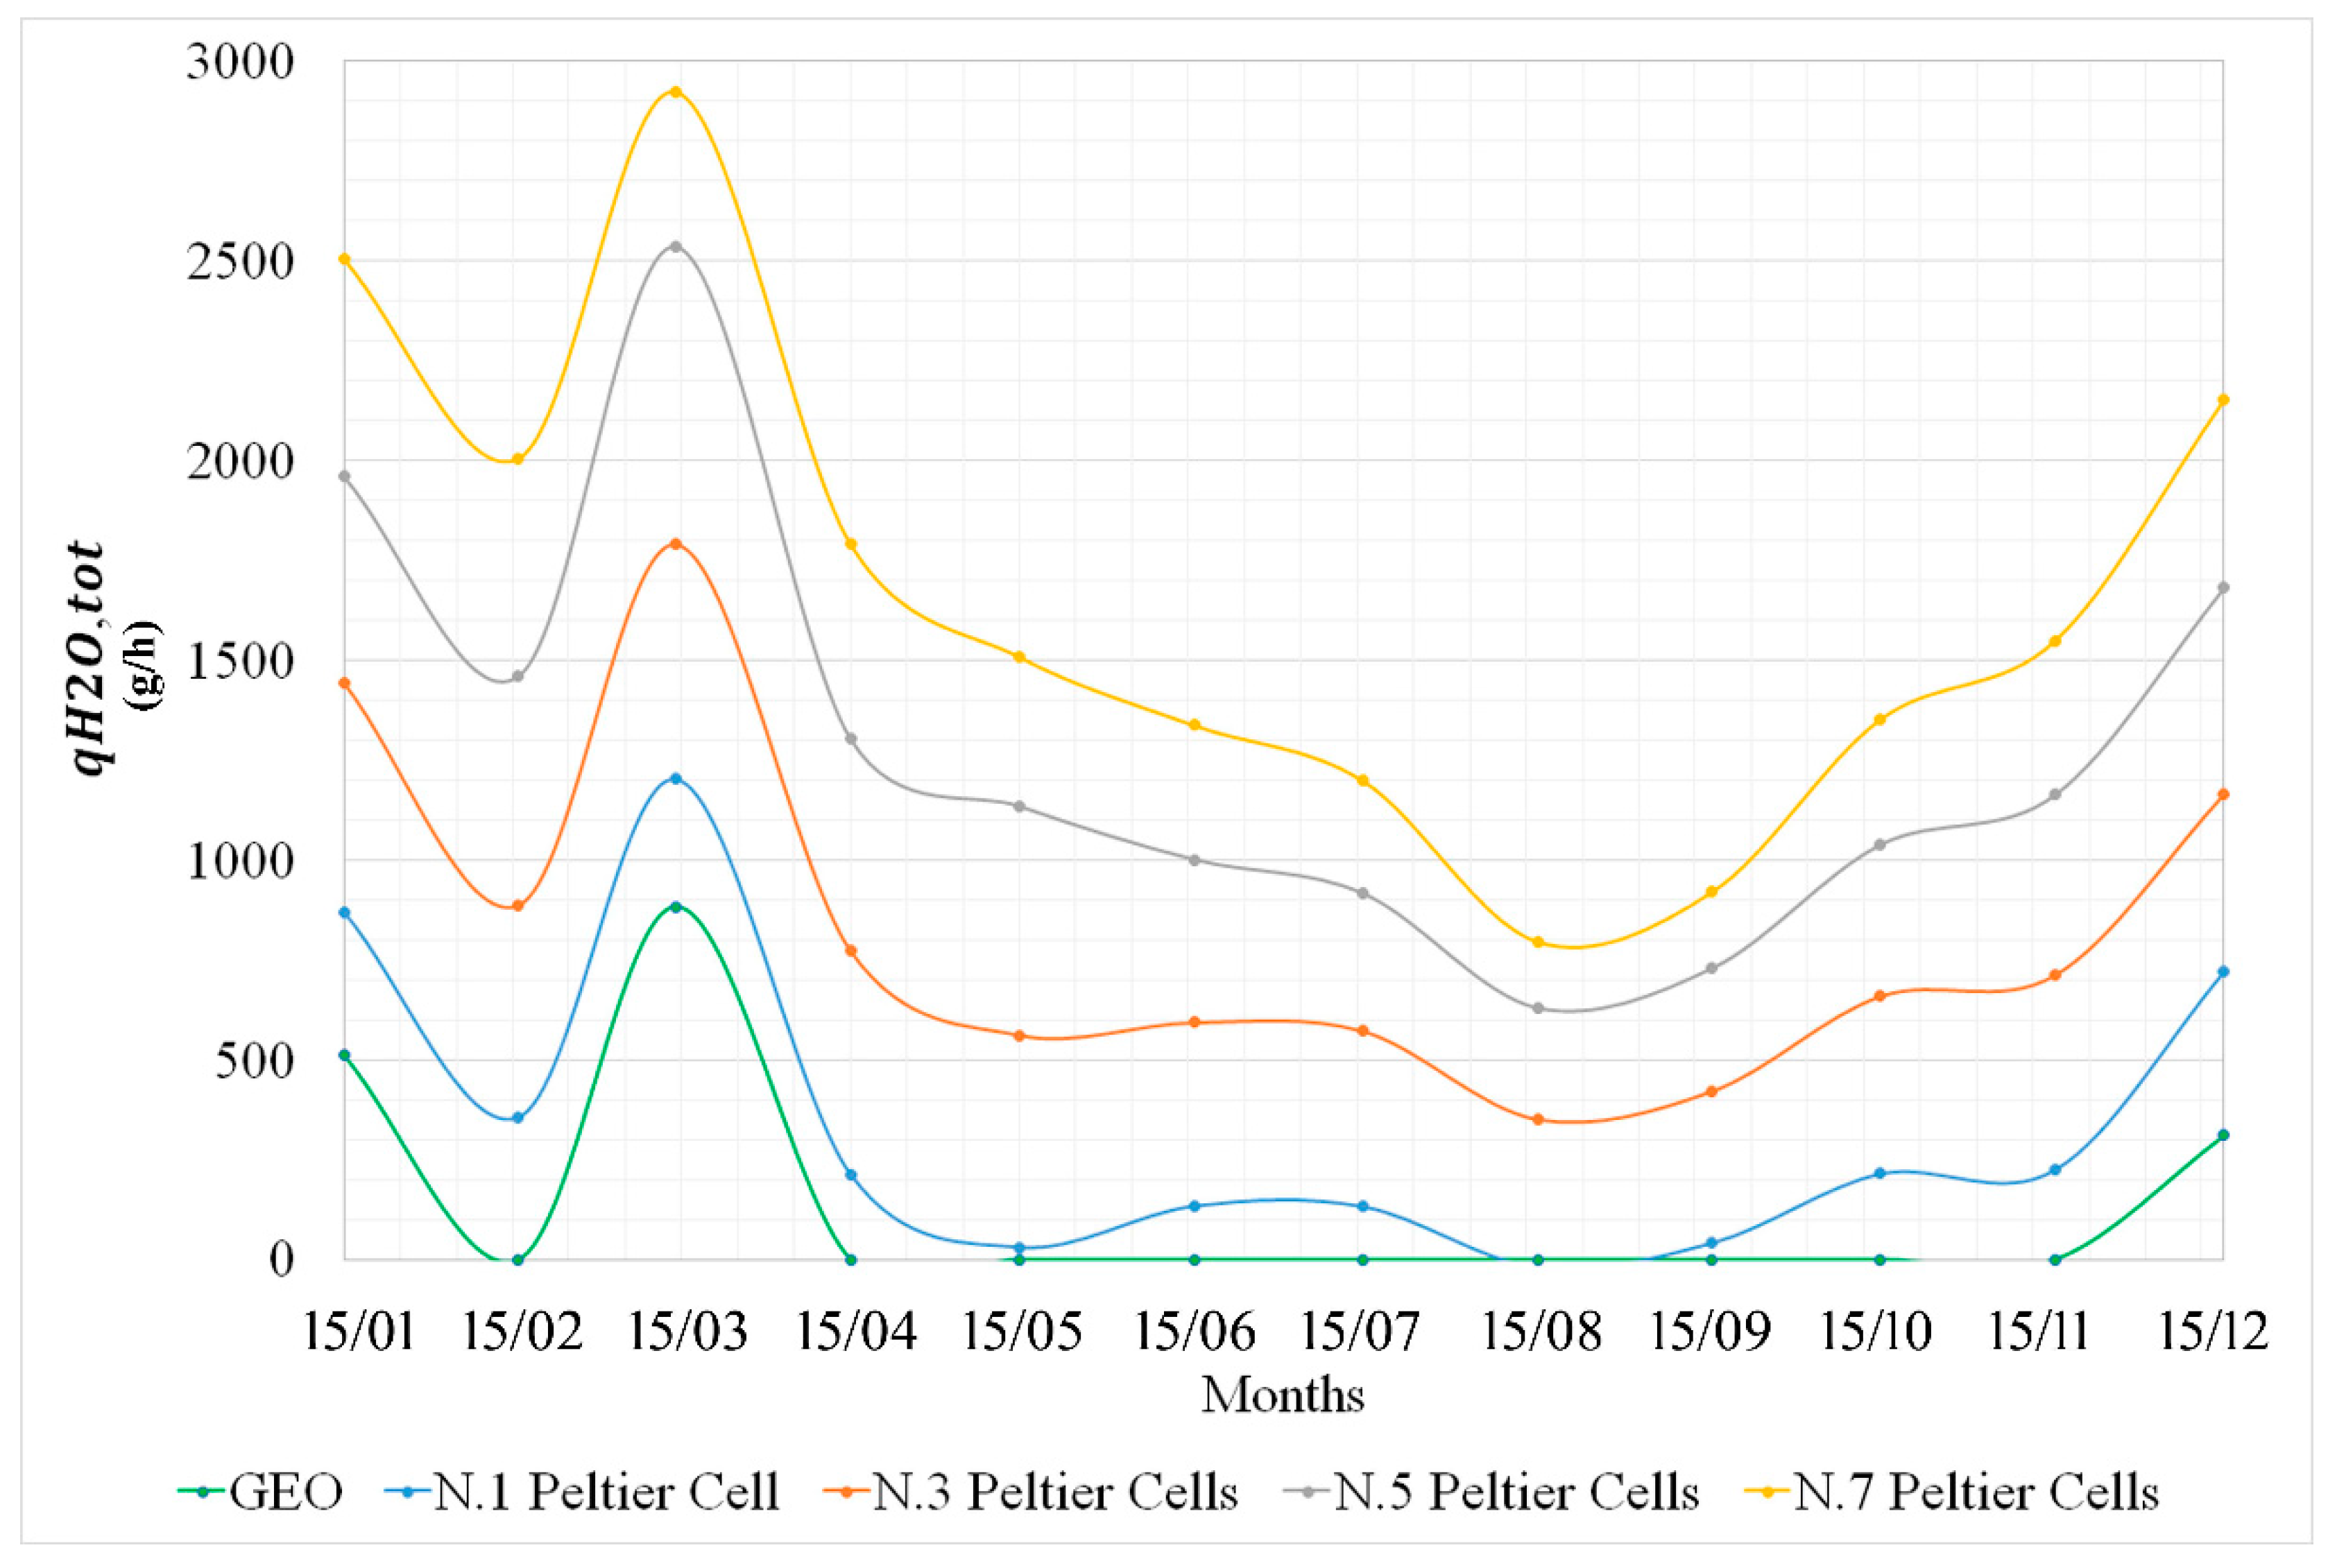
4.3. Optimization by Changing the Number of Peltier Cells

The amount of water collected through the contribution of the geothermal pipe alone ( q H 2 O , g e o ), thus not using Peltier cells, is shown in Table 4. The wet-bulb temperature, relative and absolute humidity data of the inlet A and outlet B states from the geothermal pipe are also reported in the table.
Table 5, Table 6, Table 7 and Table 8 show the amounts of condensed water ( q H 2 O , P e l t i e r   c e l l ) using 1,3,5,7 Peltier cells respectively, and the total value of condensed water ( q H 2 O , t o t ) obtained by summing the contribution of the geothermal probe q H 2 O , g e o .
All calculations are conducted considering the total volume flow rate ( Q v )   equal to 234 m3/h, the total mass flow rate ( Q m )   of 286.65 kg/h, and the mass flow rate in a single cooling section ( Q m ,   s )   of 0.040 kg/s. The flow rates are consistent with the diameter of the geothermal probe chosen and with the optimization of heat exchange with the ground. Any request for higher flow rates requires the addition of new geothermal probes.
From the analysis of Table 5, Table 6, Table 7 and Table 8, it can be seen that increasing the number of Peltier cells leads to a substantial increase in the temperature exiting the hot side of the Peltier cell section (state D). In the cases with 5 and 7 Peltier cells, the temperature (state D) reaches about 80 °C. The same temperature is, however, drastically reduced with the adiabatic mixing with the flow of air that laps the cold side of the cells. Therefore, the inlet temperature in the conditioned environment (state E) is lowered in the most critical cases up to 50–55 °C. This may suggest using the whole Peltier cell array in the air cooling and condensing phase and reducing the number of Peltier cells in the air post-heating phase.
Figure 10 illustrates how the grams of water produced increase as the number of Peltier cells increases and indicates that the maximum amount of water will be produced in March. The figure also shows the collected water by the use of the only geothermal system (geo), without the application of Peltier cells.
August is the month with the lowest production, as it is the month with low temperature and relative humidity values that do not favor condensation. The results showed that under the most favorable climatic conditions (March), for example with 3 and 7 Peltier cells, it is possible to condense about 1800–2900 g/h, respectively, while under the most unfavorable conditions (August) about 350–800 g/h.

4.4. System Electrical Consumption

Table 9 shows the final electrical consumption of the system for the different configurations. Future development of this study will include a thorough and detailed analysis of the installation and maintenance costs of the entire system, with particular attention to local labor costs.

5. Conclusions

The availability of water resources, especially in areas of hot climate and drought, is becoming increasingly problematic. Natural reserves are gradually reducing, and water is not available in abundance in every part of Rwanda.
This work proposes a new simple and innovative water-harvesting device, based on the water vapor condensation process achieved by coupling Peltier cells to an underground geothermal pipe used for air pre-treatment. The behavior of the system has been simulated in Kigali, Rwanda.
The system focuses on the specificity of Peltier cells that require two airflows, one hot and one cold, on its surfaces. The airflow generated by a fan, pre-treated in the geothermal probe, is separated into two streams that lap the two surfaces of the Peltier cells, one stream lapping the cold surfaces, undergoing sensible and latent cooling with dehumidification, the other stream lapping the hot surfaces, heating up.
The results showed that, under the most favorable climatic conditions (March), for example with 3 and 7 Peltier cells, it is possible to condense about 1800–2900 g/h, respectively, while under the most unfavorable conditions (August) about 350–800 g/h.
In the water storage tank, which also serves as a mixing chamber, the two air streams mix adiabatically to regulate the temperature entering the conditioned environment. In remote areas, where there is no electrical distribution network, the fan and Peltier cells can be powered by small photovoltaic panels and micro wind turbines.
The results show that as the number of Peltier cells used increases, the water produced increases but, conversely, the temperature exiting the hot side of the Peltier cell (state D) increases significantly. In cases with 5 and 7 Peltier cells, the temperature (state D) reaches about 80 °C. The same temperature decreases drastically with adiabatic mixing with the airflow lapping the cold side of the cells. Therefore, the inlet temperature in the conditioned environment (state E) drops in the most critical cases to 50–55 °C. This may suggest using the entire Peltier cell array in the air cooling and condensing phase and reducing the number of Peltier cells in the air post-heating phase.
The presented design is both environmentally friendly and economically viable. The system is simple and can be realized with elements easily available even in disadvantaged areas, such as plastic pipes for geothermal probes, and the recovery of Peltier cells, for example, from the disassembly of old computers.

Author Contributions

Conceptualization, P.M.C. and C.B.; methodology, P.M.C. and C.B.; software, P.M.C., C.B. and G.N.; formal analysis, P.M.C., C.B. and G.N.; investigation, P.M.C., C.B. and G.N.; data curation, P.M.C. and C.B.; writing—original draft preparation, P.M.C. and C.B.; writing—review and editing, P.M.C. and C.B.; visualization, P.M.C. and C.B.; supervision, P.M.C. and C.B. All authors have read and agreed to the published version of the manuscript.

Funding

This research received no external funding.

Institutional Review Board Statement

Not applicable.

Informed Consent Statement

Not applicable.

Conflicts of Interest

The authors declare no conflict of interest.

References

  1. Baglivo, C. Dynamic Evaluation of the Effects of Climate Change on the Energy Renovation of a School in a Mediterranean Climate. Sustainability 2021, 13, 6375. [Google Scholar] [CrossRef]
  2. Huang, Z.; Liu, X.; Sun, S.; Tang, Y.; Yuan, X.; Tang, Q. Global assessment of future sectoral water scarcity under adaptive inner-basin water allocation measures. Sci. Total Environ. 2021, 783, 146973. [Google Scholar] [CrossRef]
  3. Vörösmarty, J.; McIntyre, P.B.; Gessner, M.O.; Dudgeon, D.; Prusevich, A.; Green, P.; Glidden, S.; Bunn, S.E.; Sullivan, C.A.; Liermann, C.R.; et al. Global threats to human water security and river biodiversity. Nature 2010, 467, 555. [Google Scholar] [CrossRef] [PubMed]
  4. Gerten, D.; Heinke, J.; Hoff, H.; Biemans, H.; Fader, M.; Waha, K. Global water availability and requirements for future food production. J. Hydrometeorol. 2011, 12, 885–899. [Google Scholar] [CrossRef]
  5. Liu, J.; Liu, Q.; Yang, H. Assessing water scarcity by simultaneously considering environmental flow requirements, water quantity, and water quality. Ecol. Indic. 2016, 60, 434–441. [Google Scholar] [CrossRef] [Green Version]
  6. Hejazi, M.I.; Edmonds, J.; Clarke, L.; Kyle, P.; Davies, E.; Chaturvedi, V.; Wise, M.; Patel, P.; Eom, J.; Calvin, K. Integrated assessment of global water scarcity over the 21st century under multiple climate change mitigation policies. Hydrol. Earth Syst. Sci. 2014, 18, 2859–2883. [Google Scholar] [CrossRef] [Green Version]
  7. Congedo, P.M.; Baglivo, C. Implementation hypothesis of the Apulia ITACA Protocol at district level—part I: The model. Sustain. Cities Soc. 2021, 70, 102931. [Google Scholar] [CrossRef]
  8. Congedo, P.M.; Baglivo, C.; Toscano, A.M. Implementation Hypothesis of the Apulia ITACA Protocol at District Level—Part II: The Case Study. Sustain. Cities Soc. 2021, 70, 102927. [Google Scholar] [CrossRef]
  9. Van Blommestein, K.C.; Daim, T.U. Residential energy efficient device adoption in South Africa. Sustain. Energy Technol. Assess. 2013, 1, 13–27. [Google Scholar] [CrossRef]
  10. Weaver, M.; O’Keeffe, J.; Hamer, N.; Palmer, C. A civil society organisation response to water service delivery issues in South Africa drives transformative praxis. Part 2: Knowledge building, learning and active citizenship. Geoforum 2019, 107, 14–23. [Google Scholar] [CrossRef]
  11. Habiyaremye, A. Water innovation in South Africa: Mapping innovation successes and diffusion constraints. Environ. Sci. Policy 2020, 114, 217–229. [Google Scholar] [CrossRef]
  12. Zorić, A.; Heusinkveld, H. Developing Mobile Water Operator Technology for Africa. Environ. Sci. Policy 2020, 112, 314–317. [Google Scholar] [CrossRef]
  13. Zhuwakinyu, M. A Review of South Africa’s Water Sector; Creamer Media Research Channel: Johannesburg, South Africa, 2012. [Google Scholar]
  14. Salehi, A.A.; Ghannadi-Maragheh, M.; Torab-Mostaedi, M.; Torkaman, R.; Asadollahzadeh, M. A review on the water-energy nexus for drinking water production from humid air. Renew. Sustain. Energy Rev. 2020, 120, 109627. [Google Scholar] [CrossRef]
  15. Lundqvist, J.; Andersson, A.; Johannisson, A.; Lavonen, E.; Mandava, G.; Kylin, H.; Bastviken, D.; Oskarsson, A. Innovative drinking water treatment techniques reduce the disinfection-induced oxidative stress and genotoxic activity. Water Res. 2019, 155, 182–192. [Google Scholar] [CrossRef] [PubMed]
  16. Srithar, K.; Rajaseenivasan, T. Recent fresh water augmentation techniques in solar still and HDH desalination—A review. Renew. Sustain. Energy Rev. 2018, 82, 629–644. [Google Scholar] [CrossRef]
  17. Vakilifard, N.; Anda, M.; Bahri, P.A.; Ho, G. The role of water-energy nexus in optimising water supply systems—Review of techniques and approaches. Renew. Sustain. Energy Rev. 2018, 82, 1424–1432. [Google Scholar] [CrossRef]
  18. Wahlgren, R.V. Atmospheric water vapour processor designs for potable water production: A review. Water Res. 2001, 35, 1–22. [Google Scholar] [CrossRef]
  19. Shourideh, A.H.; Ajram, W.B.; Al Lami, J.; Haggag, S.; Mansouri, A. A comprehensive study of an atmospheric water generator using Peltier effect. Therm. Sci. Eng. Prog. 2018, 6, 14–26. [Google Scholar] [CrossRef]
  20. Liu, S.; He, W.; Hu, D.; Lv, S.; Chen, D.; Wu, X.; Xu, F.; Li, S. Experimental analysis of a portable atmospheric water generator by thermoelectric cooling method. Energy Procedia 2017, 142, 1609–1614. [Google Scholar] [CrossRef]
  21. Yıldırım, C.; Soylu, S.K.; Atmaca, İ.; Solmuş, İ. Experimental investigation of a portable desalination unit configured by a thermoelectric cooler. Energy Convers. Manag. 2014, 85, 140–145. [Google Scholar] [CrossRef]
  22. Milani, D.; Qadir, A.; Vassallo, A.; Chiesa, M.; Abbas, A. Experimentally validated model for atmospheric water generation using a solar assisted desiccant dehumidification system. Energy Build. 2014, 77, 236–246. [Google Scholar] [CrossRef]
  23. Lindblom, J.; Nordell, B. Underground condensation of humid air for drinking water production and subsurface irrigation. Desalination 2007, 203, 417–434. [Google Scholar] [CrossRef]
  24. Lindblom, J.; Nordell, B. Water production by underground condensation of humid air. Desalination 2006, 189, 248–260. [Google Scholar] [CrossRef]
  25. Bonuso, S.; Panico, S.; Baglivo, C.; Mazzeo, D.; Matera, N.; Congedo, P.M.; Oliveti, G. Dynamic Analysis of the Natural and Mechanical Ventilation of a Solar Greenhouse by Coupling Controlled Mechanical Ventilation (CMV) with an Earth-to-Air Heat Exchanger (EAHX). Energies 2020, 13, 3676. [Google Scholar] [CrossRef]
  26. Croce, D.; Giuliano, F.; Bonomolo, M.; Leone, G.; Musca, R.; Tinnirello, I. A decentralized load control architecture for smart energy consumption in small islands. Sustain. Cities Soc. 2020, 53, 101902. [Google Scholar] [CrossRef]
  27. Mazzeo, D.; Matera, N.; De Luca, P.; Baglivo, C.; Congedo, P.M.; Oliveti, G. A literature review and statistical analysis of photovoltaic-wind hybrid renewable system research by considering the most relevant 550 articles: An upgradable matrix literature database. J. Clean. Prod. 2021, 295, 126070. [Google Scholar] [CrossRef]
  28. Cannistraro, M.; Trancossi, M. Enhancement of indoor comfort in the presence of large glazed radiant surfaces by a local heat pump system based on Peltier cells. Therm. Sci. Eng. Prog. 2019, 14, 100388. [Google Scholar] [CrossRef]
  29. Congedo, P.M.; Baglivo, C.; Bonuso, S.; D’Agostino, D. Numerical and experimental analysis of the energy performance of an air-source heat pump (ASHP) coupled with a horizontal earth-to-air heat exchanger (EAHX) in different climates. Geothermics 2020, 87, 101845. [Google Scholar] [CrossRef]
  30. Baglivo, C.; D’Agostino, D.; Congedo, P.M. Design of a Ventilation System Coupled with a Horizontal Air-Ground Heat Exchanger (HAGHE) for a Residential Building in a Warm Climate. Energies 2018, 11, 2122. [Google Scholar] [CrossRef] [Green Version]
  31. Agrawal, K.K.; Agrawal, G.D.; Misra, R.; Bhardwaj, M.; Jamuwa, D.K. A review on effect of geometrical, flow and soil properties on the performance of Earth air tunnel heat exchanger. Energy Build. 2018, 176, 120–138. [Google Scholar] [CrossRef]
  32. Lund, J.W.; Freeston, D.H.; Boyd, T.L. Direct application of geothermal energy: 2005 Worldwide review. Geothermics 2005, 34, 691–727. [Google Scholar] [CrossRef]
  33. Wu, Y.; Gan, G.; Verhoef, A.; Vidale, P.L.; Gonzalez, R.G. Experimental measurement and numerical simulation of horizontal-coupled slinky ground source heat exchangers. Appl. Therm. Eng. 2010, 30, 2574–2583. [Google Scholar] [CrossRef] [Green Version]
  34. Congedo, P.M.; Lorusso, C.; Baglivo, C.; Milanese, M.; Raimondo, L. Experimental validation of horizontal air-ground heat exchangers (HAGHE) for ventilation systems. Geothermics 2019, 80, 78–85. [Google Scholar] [CrossRef]
  35. Choi, J.C.; Lee, S.R.; Lee, D.S. Numerical simulation of vertical ground heat exchangers: Intermittent operation in unsaturated soil conditions. Comput. Geotech. 2011, 38, 949–958. [Google Scholar] [CrossRef]
  36. Vaz, J.; Sattler, M.A.; Brum, R.D.S.; dos Santos, E.D.; Isoldi, L. An experimental study on the use of Earth-Air Heat Exchangers (EAHE). Energy Build. 2014, 72, 122–131. [Google Scholar] [CrossRef]
  37. Li, A.; Xu, X.; Sun, Y. A study on pipe-embedded wall integrated with ground source-coupled heat exchanger for enhanced building energy efficiency in diverse climate regions. Energy Build. 2016, 121, 139–151. [Google Scholar] [CrossRef] [Green Version]
  38. Benkert, S.; Heidt, F.D.; Scholer, D. Calculation Tool for Earth Heat Exchangers GAEA; Siegen University: Siegen, Gernany, 2011. [Google Scholar]
  39. Chiesa, G.; Simonetti, M.; Grosso, M. A 3-field earth-heat-exchange system for a school building in Imola, Italy: Monitoring results. Renew. Energy 2014, 62, 563–570. [Google Scholar] [CrossRef] [Green Version]
  40. Lee, K.H.; Strand, R.K. The cooling and heating potential of an earth tube system in buildings. Energy Build. 2008, 40, 486–494. [Google Scholar] [CrossRef]
  41. Darkwa, J.; Kokogiannakis, G.; Magadzire, C.; Yuan, K. Theoretical and practical evaluation of an earth-tube (E-tube) ventilation system. Energy Build. 2011, 43, 728–736. [Google Scholar] [CrossRef]
  42. Mihalakakou, G.; Santamouris, M.; Asimakopoulos, D.; Tselepidaki, I. Parametric prediction of the buried pipes cooling potential for passive cooling applications. Sol. Energy 1995, 55, 163–173. [Google Scholar] [CrossRef]
  43. St. Benkert, F.D. Heid, Chapter 380—Designing Earth Heat Exchangers—Validation of the Software GAEA. In Proceedings of the Energy for the 21st Century World Renewable Energy Congress VI, Brighton, UK, 1–7 July 2000; pp. 1818–1821, ISBN 9780080438658. [Google Scholar] [CrossRef]
  44. Mazzeo, D.; Matera, N.; De Luca, P.; Baglivo, C.; Congedo, P.M.; Oliveti, G. Worldwide geographical mapping and optimization of stand-alone and grid-connected hybrid renewable system techno-economic performance across Köppen-Geiger climates. Appl. Energy 2020, 276, 115507. [Google Scholar] [CrossRef]
  45. Chen, D.; Chen, H.W. Using the Köppen classification to quantify climate variation and change: An example for 1901–2010. Environ. Dev. 2013, 6, 69–79. [Google Scholar] [CrossRef]
  46. Available online: https://docs.rs-online.com/9cff/0900766b8144aa0d.pdf (accessed on 1 June 2021).
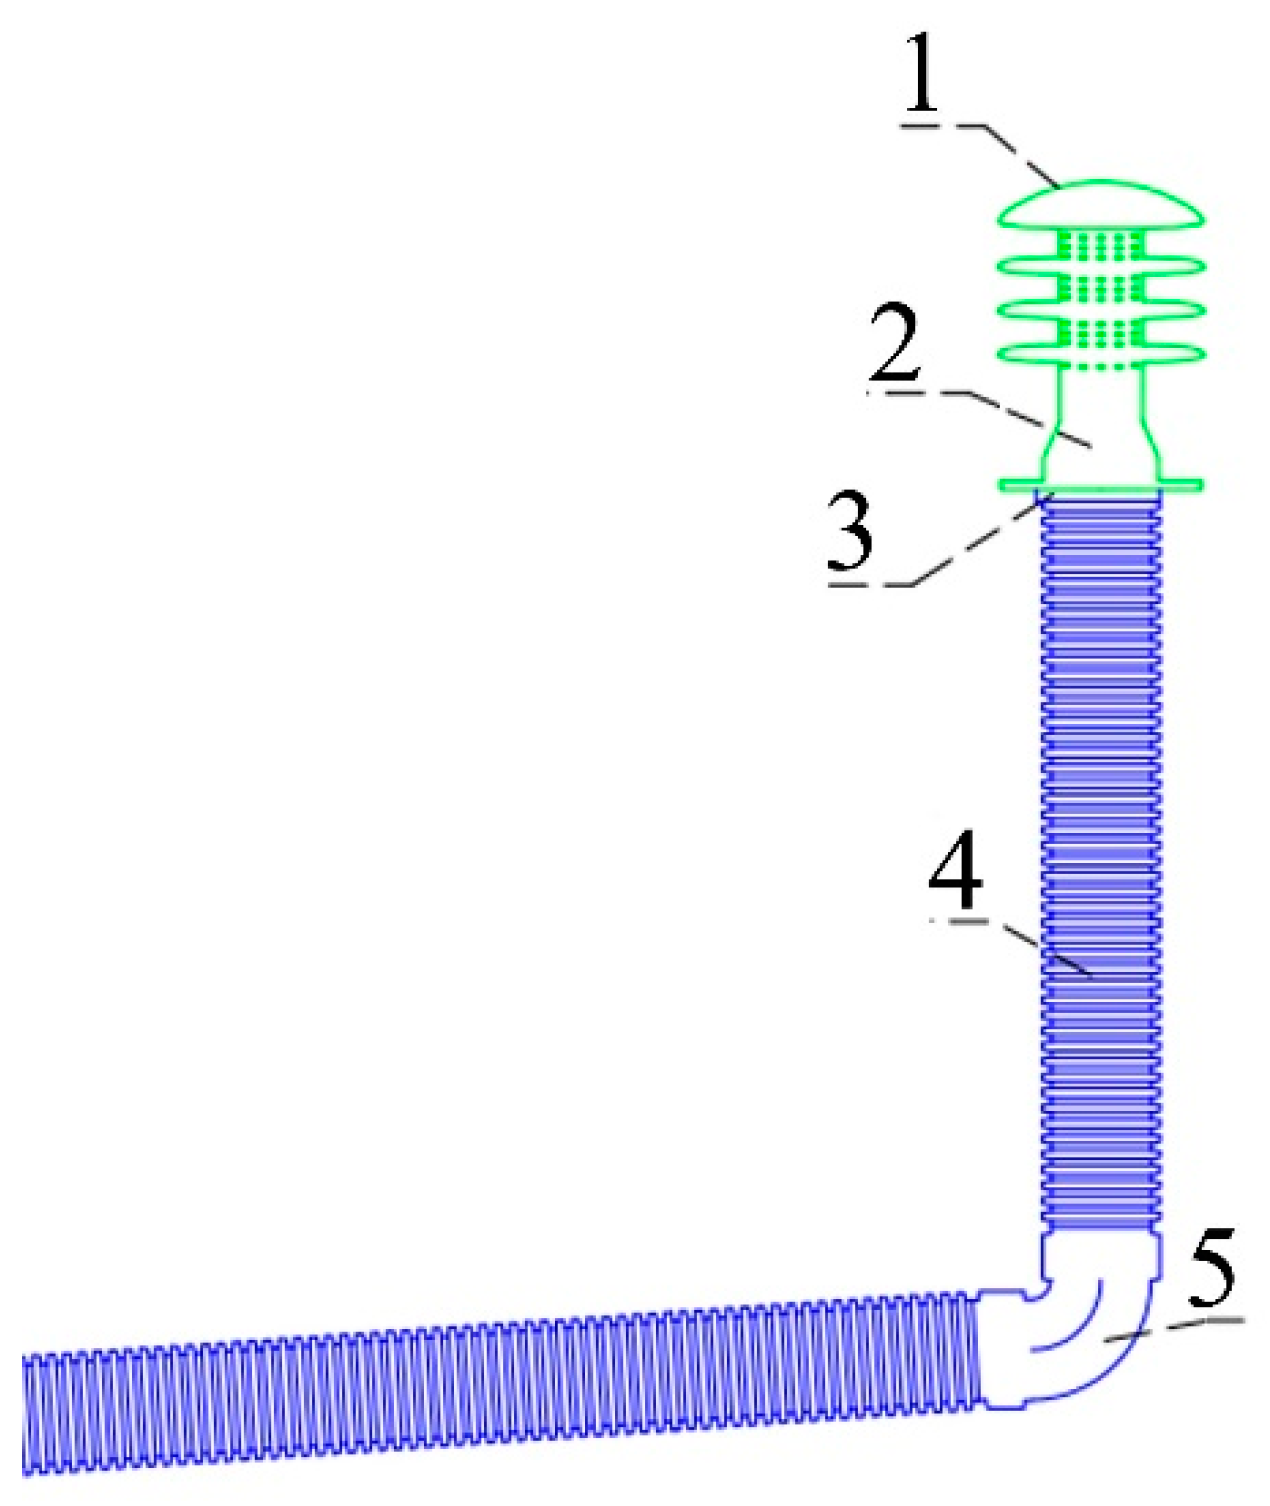
Figure 1. Details of the air intake.
Energies 14 04507 g001
Figure 2. Application of Peltier cells inside the pipe.
Energies 14 04507 g002
Figure 3. Tank for water collection: open grille (a) and closed grille (b).
Energies 14 04507 g003
Figure 4. The entire system: open grille (a) and closed grille (b).
Energies 14 04507 g004
Figure 5. Peltier cells.
Energies 14 04507 g005
Figure 6. Performance of the Peltier cell selected.
Energies 14 04507 g006
Figure 7. Trends of temperatures along the length of the pipe.
Energies 14 04507 g007
Figure 8. Transformation on the Ashrae Diagram (15 January).
Energies 14 04507 g008
Figure 9. Transformation on the Ashrae Diagram (15 August).
Energies 14 04507 g009
Figure 10. Annual overview of the total condensed water.
Energies 14 04507 g010
Table 1. Labeling used for the description of the components of the system and moist air conditions in Figure 1, Figure 2, Figure 3 and Figure 4.
System Components
1Air intake system
2Filter
3Fan
4EAHX
5Curved connecting element
6Pipe extension with Peltier cell placement
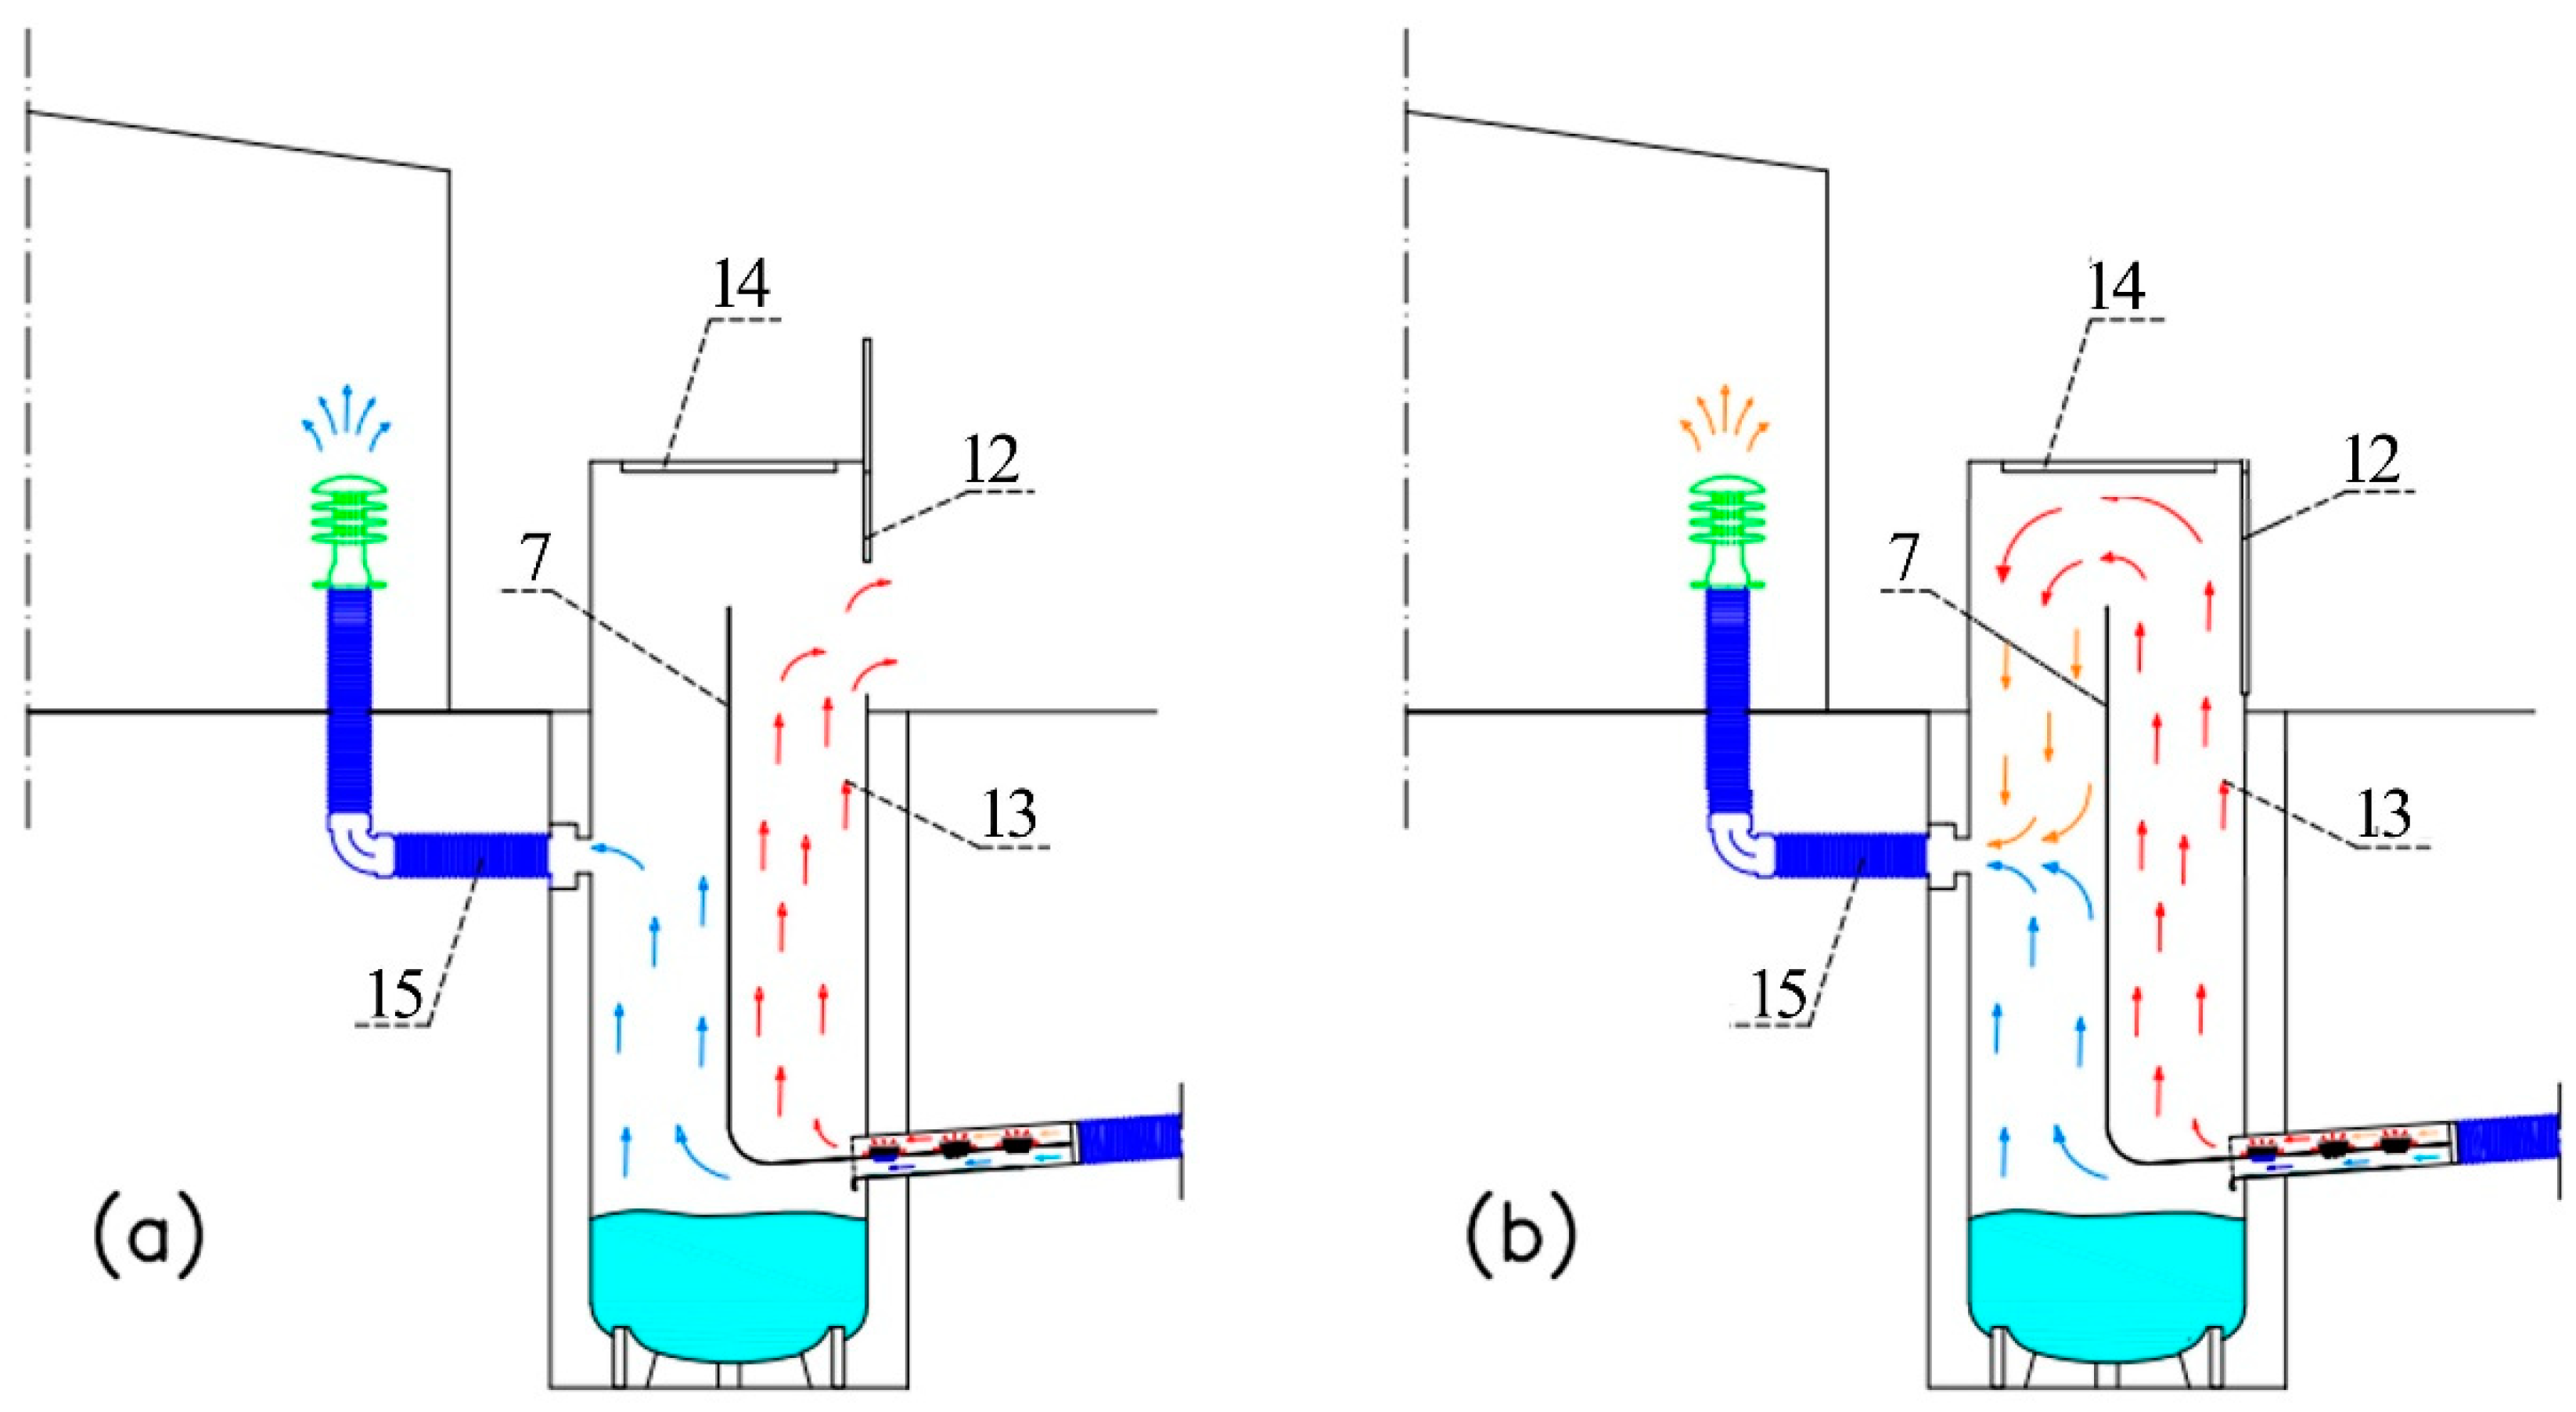
7Septum
8Peltier cell
9Hot side of Peltier cell
10Fan
11Cold side of Peltier cell
12Grille
13Tank
14Tank inspection chamber
15Extension of the pipe for supplying air treated in the environment
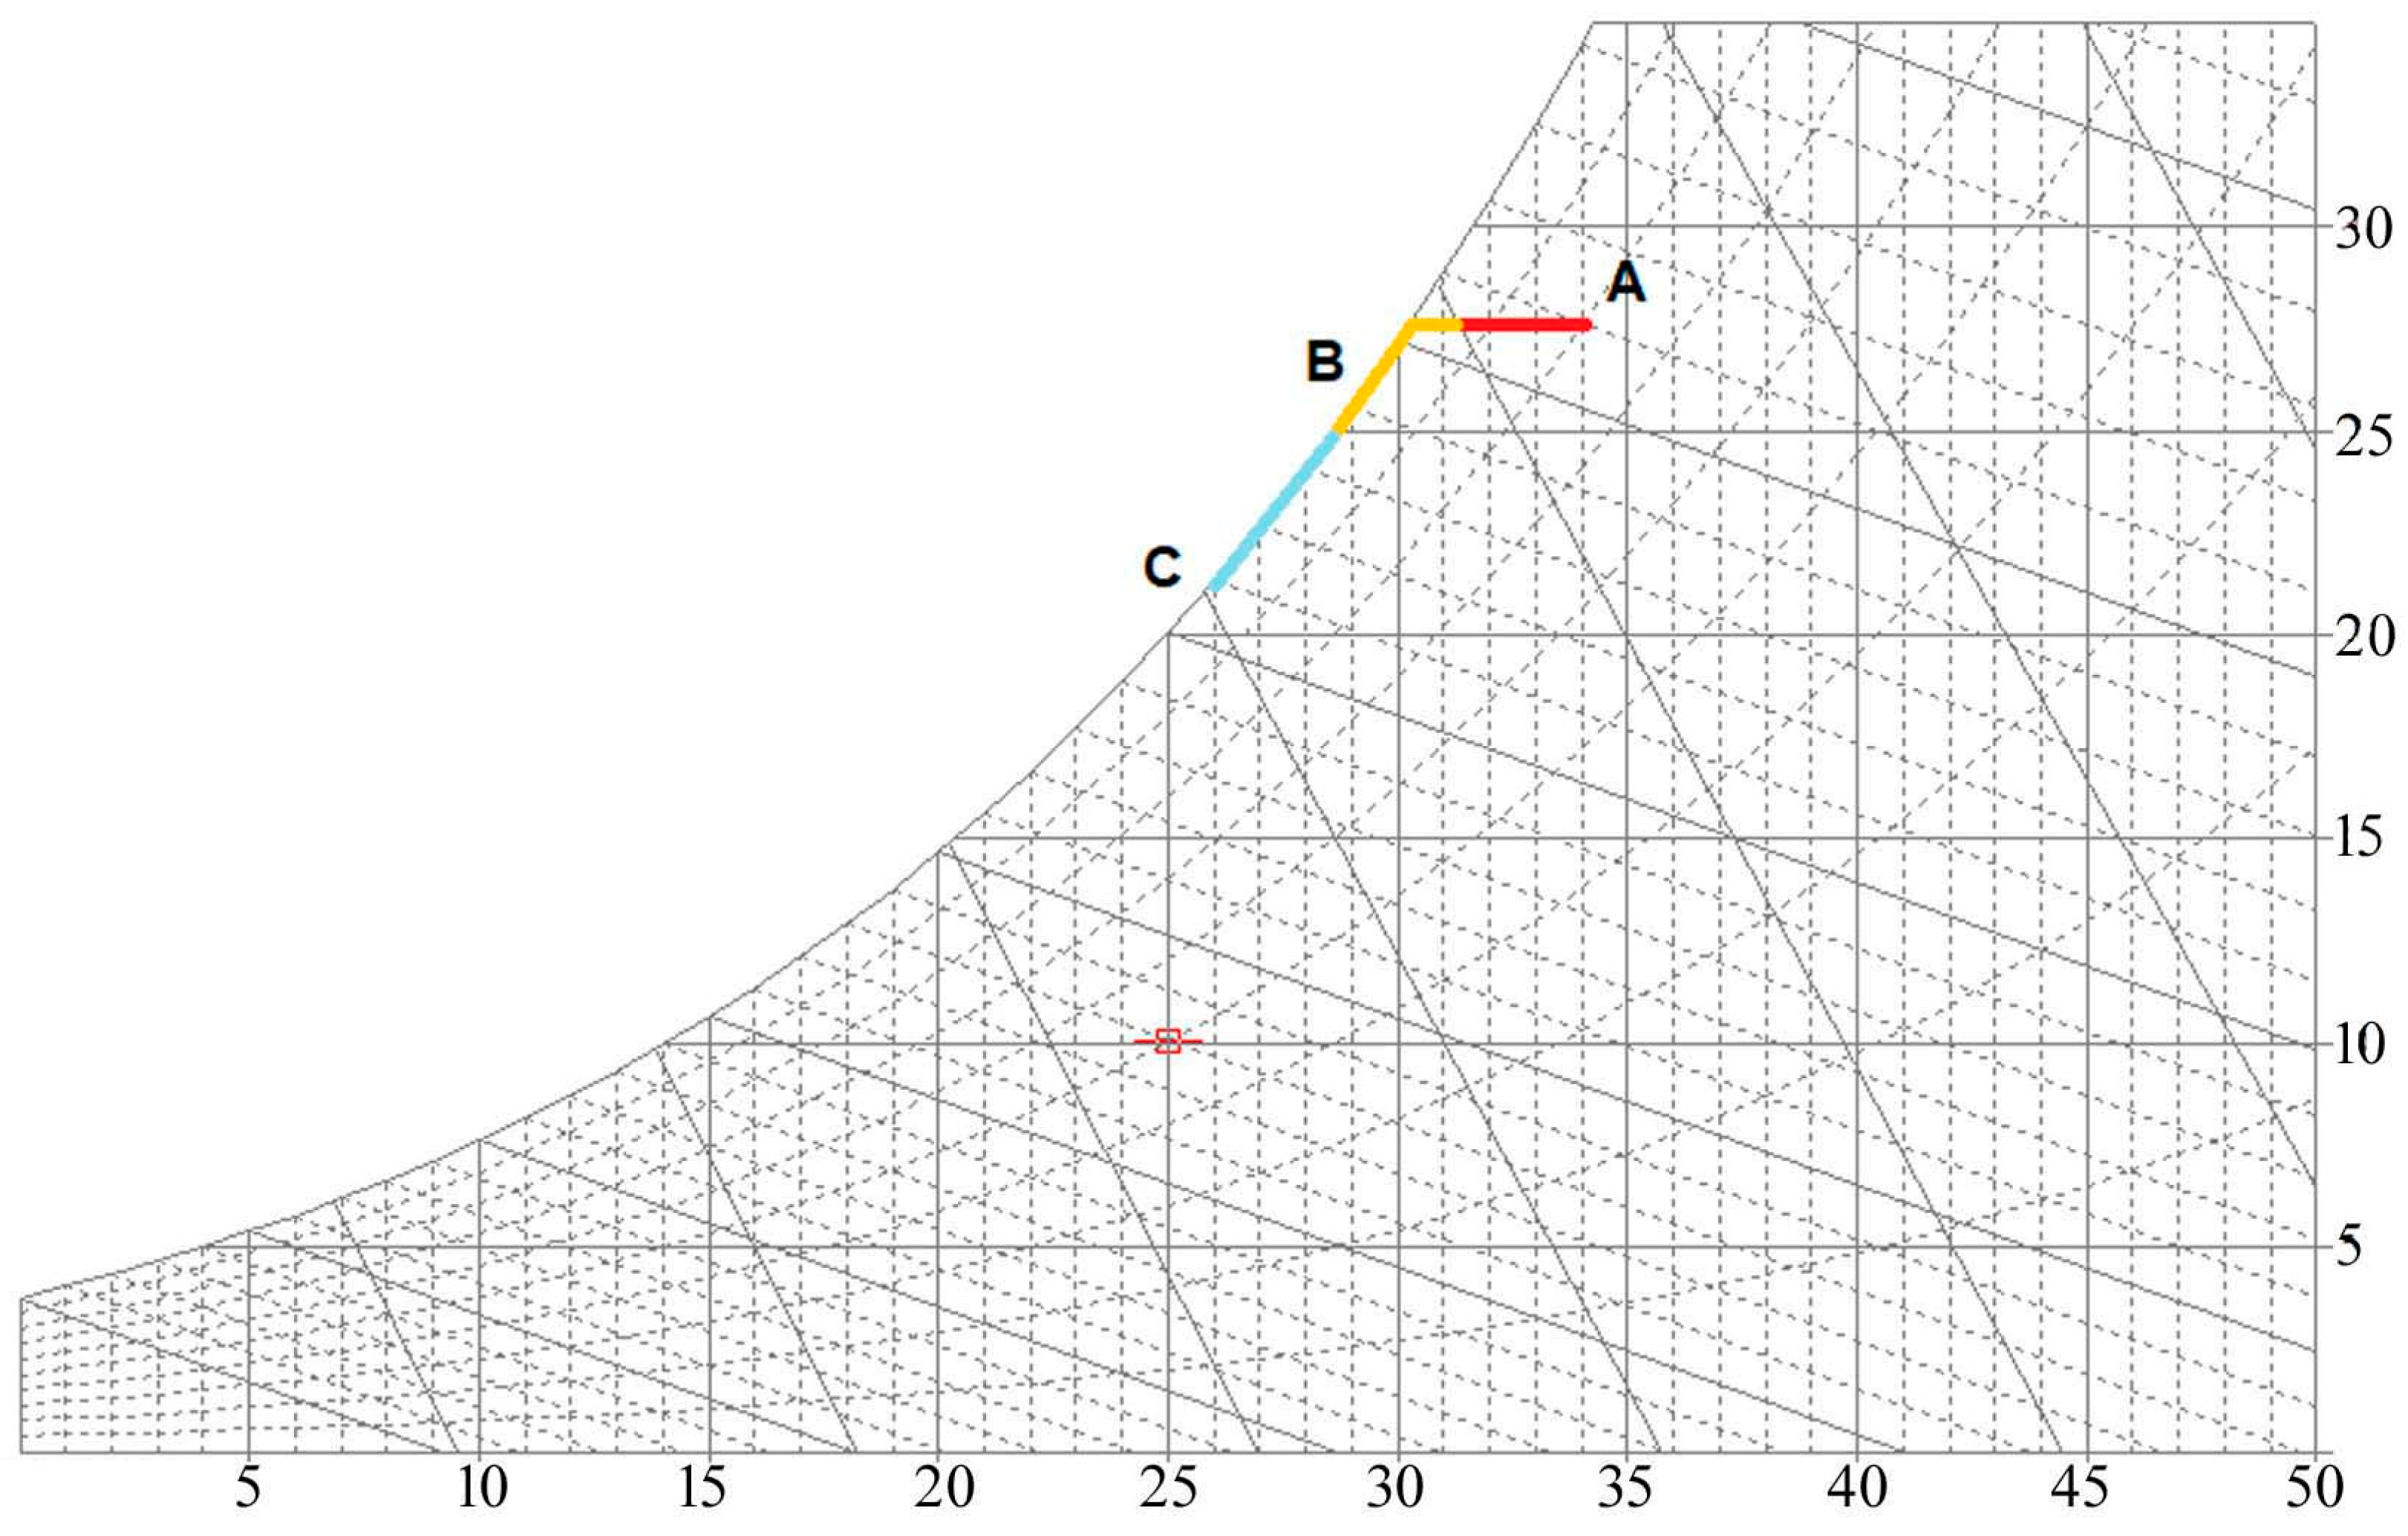
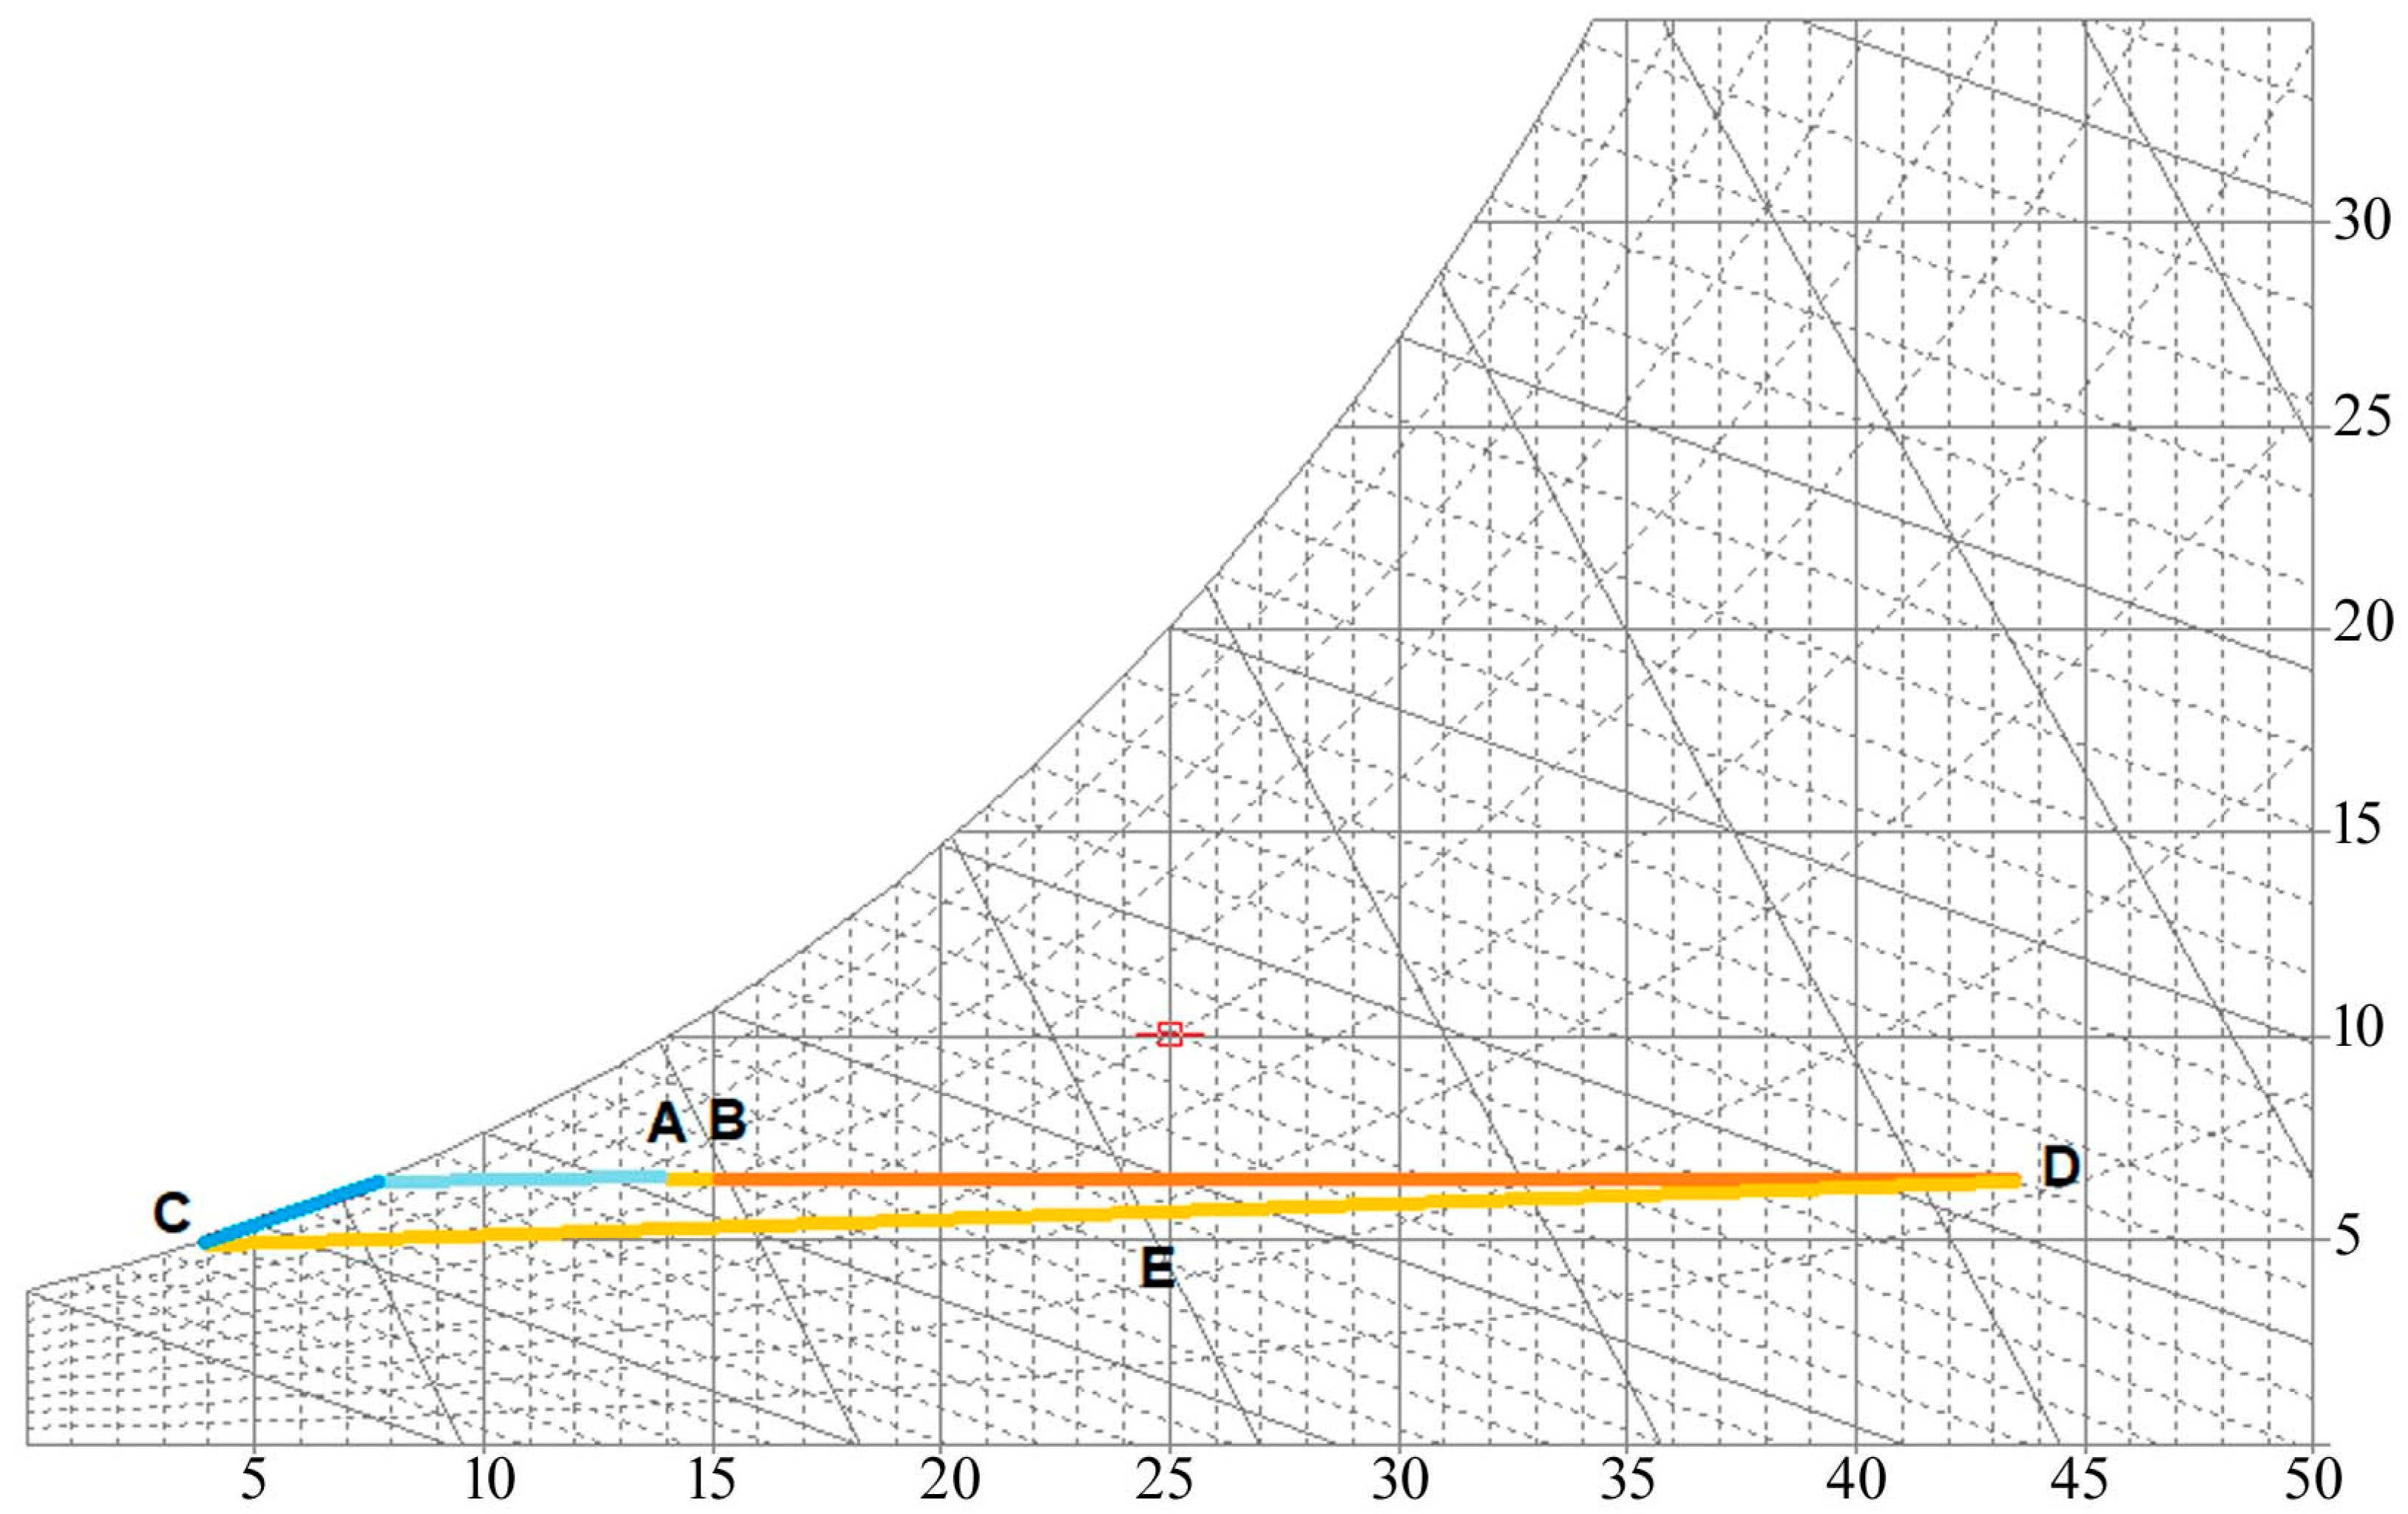
Moist air states
AExternal air entering the geothermal pipe
BAir exiting the geothermal before meeting the Peltier cells
CAir exiting from cold side of Peltier cell
DAir exiting from hot side of Peltier cell
EAdiabatic mixing of hot and cold air flows
Table 2. Technical parameters of the geothermal system.
ElementsDescriptionsValues
PipeNumber of pipes1
Length of pipes20 m
Diameter of pipes200 mm
Burial depth1.2 m
SoilType of soilClay
Density1500 kg/m3
Heat capacity0.88 kJ/kgK
Thermal conductivity1.28 W/mK
Soil water level20 m
External temperatureMax. monthly value32.4 °C
Yearly mean temperature20.9 °C
Min. monthly value9.4 °C
BuildingVolume100 m3
Air change rate2.34 1/h
Ventilation flow234 m3/h
System controlSet point temperature20 °C
Boundary value for heating18 °C
Boundary value for cooling25 °C
FlowConstant pressure drops50 Pa
Pressure drops in pipes0.47 Pa/m
Total pressure drops59.43 Pa
Fan efficiency0.4
Fan power9.66 W
Specific energy consumption0.041 Wh/m3
Geothermal parametersHeat gain678.6 kWh
Hear loss675.3
Yearly max. inlet air temperature 38.4 °C
Yearly max. outlet air temperature 33.6 °C
Yearly min. inlet air temperature 3.4 °C
Yearly min. outlet air temperature 8.0 °C
Efficiency factor heating2.65
Efficiency factor cooling5.86
Table 3. Peltier cell technical details.
Technical DataValues
Power (𝑃𝐶𝑒𝑙𝑙 𝑃𝑒𝑙𝑡𝑖𝑒𝑟)0.340 kW
Voltage≈25 V
Maximum absorbed current15.4 A
Maximum differential between hot and cold side temperatures68 °C
Maximum supply voltage35.9 V
Max hot side temperature90 °C
Size52 mm × 52 mm × 3.5 mm
Max mounting pressure1.5 MPa
Table 4. Calculation of condensed water in the geothermal system.
MonthTA (°C)RHA (%)XA (g/kg)TB (°C)RHB (%)ΔRH (%)XB (g/kg) q H 2 O . g e o (g/h) HB (kJ/kg)
15 January34.383.529.2830.2100.016.527.50510.2100.69
15 February36.673.529.4832.394.120.629.480107.38
15 March35.987.533.732100.012.530.62882.8110.58
15 April32.371.522.2829.682.911.422.28085.57
15 May27.079.017.9125.693.514.517.91075.22
15 June20.980.012.4320.980.0012.43052.42
15 July16.288.510.1817.184.2−4.310.18043.10
15 August13.864.56.3414.959.2−5.36.34030.68
15 September14.572.07.4115.268.2−3.87.41033.76
15 October18.092.011.8917.794.52.511.89048.09
15 November23.684.015.4621.994.310.315.46061.60
15 December29.487.522.9426.4100.012.521.86309.582.28
Table 5. Calculation of condensed water using 1 Peltier cell.
Month Cooling Power (kJ/kg)HC
(kJ/kg)
XC
(g/kg)
q H 2 O . P e l t i e r   c e l l
(g/h)
q H 2 O . t o t
(g/h)
TC (°C)RHC (%)TD (°C)RHD (%)TE (°C)RHE (%)
15 January6.70693.9825358.3868.529.8493.244.3346.5537.08565.18
15 February6.706100.6727355.4355.431.3392.245.8345.938.5864.45
15 March6.706103.8728.4318.21201.130.9698.7946.0647.0438.5167.39
15 April6.70678.8620.8212.1212.125.6799.5942.8241.6834.24562.98
15 May6.70668.5117.730.130.123.329843.7331.6233.52554.5
15 June6.70645.7111.5133.3133.316.598.1335.3633.8225.9357.23
15 July6.70636.399.26131.9131.912.9399.831.9134.5222.4257.6
15 August6.70623.976.48007.6399.9929.3825.1418.50548.6
15 September6.70627.057.1340.140.19.0599.8229.7228.6119.38552.1
15 October6.70641.3810.4213.6213.61597.8932.538.8923.7560.79
15 November6.70654.8913.9223.6223.619.5197.8436.7139.8328.1161.51
15 December6.70675.5719409.9719.526.9284.7540.7244.9233.8261.28
Table 6. Calculation of condensed water using 3 Peltier cells.
Month Cooling Power (kJ/kg)h3
(kJ/kg)
X3
(g/kg)
q H 2 O . P e l t i e r   c e l l
(g/h)
q H 2 O . t o t
(g/h)
TC (°C)RHC (%)TD (°C)RHD (%)TE (°C)RHE (%)
15 January20.11980.5721.0931.61441.826.8293.9472.7812.2349.831.23
15 February20.11987.2623.3885.7885.727.5999.2374.1512.3450.8732.12
15 March20.11990.4624.3905.81788.728.2199.7175.8612.752.03531.18
15 April20.11965.4516.9771.1771.122.3499.4571.5410.5346.9429.34
15 May20.11955.1014.0560.4560.419.4698.7772.698.1146.07525.12
15 June20.11932.308.3591.9591.911.3199.7464.628.0837.96525.25
15 July20.11922.986.2570.4570.47.3697.5761.317.7234.33524.45
15 August20.11910.563.9349.7349.70.897.62598.6429.919.75
15 September20.11913.644.5419.9419.93.5982.0259.276.231.4320.17
15 October20.11927.977.3657.9657.99.5498.9161.88.7935.6726.54
15 November20.11941.4810.5710.9710.914.8599.7765.89.4840.32527.73
15 December20.11962.1615.9854.21163.821.6297.9169.4611.3145.5430.41
Table 7. Calculation of condensed water using 5 Peltier cells.
Month Cooling Power (kJ/kg)h3
(kJ/kg)
X3
(g/kg)
q H 2 O . P e l t i e r   c e l l
(g/h)
q H 2 O . t o t
(g/h)
TC (°C)RHC (%)TD (°C)RHD (%)TE (°C)RHE (%)
15 January33.53267.1617.41447.61957.822.7699.7280951.3831.82
15 February33.53273.8519.31459.01459.024.5499.09809.6952.2732.85
15 March33.53277.0519.11651.12534.028.0999.538010.0554.04530.63
15 April33.53252.0413.21301.41301.418.4699.24807.449.2329.1
15 May33.53241.69101133.71133.716.2986.72805.9948.14525.9
15 June33.53218.895.451000.41000.45.1899.74804.1942.5922.35
15 July33.5329.573.79915.8915.80.3299.86803.4440.1619.8
15 August33.532−2.852.72629.2629.2−7.6599.28802.1636.17513.5
15 September33.5320.232.33728.1728.1−5.5499.52802.5237.2317.02
15 October33.53214.564.651037.71037.73.0298.15804.0241.5121.2
15 November33.53228.077.351162.41162.49.5199.74805.1944.75524.42
15 December33.53248.7512.31370.21679.817.4998.48807.2748.74528.42
Table 8. Calculation of condensed water using 7 Peltier cells.
Month Cooling Power (kJ/kg)h3
(kJ/kg)
X3
(g/kg)
q H 2 O . P e l t i e r   c e l l
(g/h)
q H 2 O . t o t
(g/h)
TC (°C)RHC (%)TD (°C)RHD (%)TE (°C)RHE (%)
15 January46.94553.7413.61992.22502.519.1398.03809.0749.56539.68
15 February46.94560.4315.52003.72003.720.9399.62809.8150.46540.52
15 March46.94563.6316.42038.12921.021.8199.748010.0550.90540.85
15 April46.94538.629.81788.71788.713.7899.86807.446.8938.71
15 May46.94528.277.41506.31506.39.5899.92805.9944.7938.1
15 June46.9455.473.111335.81335.8−2.2899.9804.1938.8637.86
15 July46.945−3.852.861196.81196.8−8.35100803.4435.82527.03
15 August46.945−16.271.55794.0794.0−17.5100802.1631.2516.72
15 September46.945−13.191.32918.7918.7−15.1100802.5232.4519.29
15 October46.9451.142.461351.61351.6−4.9699.45804.0237.5237.96
15 November46.94514.654.661547.91547.92.9699.84805.1941.4837.76
15 December46.94535.339.011841.72151.312.5299.84807.2746.2638.48
Table 9. Final electrical consumption of the system.
ConfigurationPeltier Cell Absorbed Power (W) (220 W Each One)Total Power Consumption of Two Fans (W) (9.2 W Each One)Total Power Consumption (W)
Only Geothermal system018.418.4
1 Peltier cell22018.4238.4
3 Peltier cells66018.4678.4
5 Peltier cells110018.41118.4
7 Peltier cells154018.41558.4
Publisher’s Note: MDPI stays neutral with regard to jurisdictional claims in published maps and institutional affiliations.

