1. Introduction
Waste heat is an inevitable byproduct generated during the process of energy conversion. An estimated 50% of the global primary energy production is dissipated as exhaust losses, with the main portion being relatively low-grade heat at temperatures below 100 °C [
1]. Thermal energy storage (TES) systems provide a possibility to harness this wasted heat and correct temporal phase differences between heat supply and demand in single buildings, as well as in large-scale district heating systems. One such system is borehole thermal energy storage (BTES), which uses the ground as a storage medium together with shallow vertical borehole heat exchangers (BHE). A heat transfer fluid is circulated through the BHE network, which exchanges heat with the surrounding subsurface. These systems have been used successfully for a couple of decades for storing and recovering heat, as well as cold, in residential and commercial buildings [
2]. Typically, these systems operate at temperatures that are relatively close to the undisturbed or natural temperate of the subsurface. Only a few high temperature BTES (HT-BTES) systems, which operate at temperatures significantly above ambient conditions, have been built [
3]. However, due to social, environmental, and economic drivers, interest in using HT-BTES systems for storing large amounts of waste heat at high temperatures (50 to 100 °C) is presently increasing. In such systems, the size, performance, and economic feasibility rely strongly on the capacity of the subsurface to store and transport heat.
This study investigates the potential to implement an HT-BTES system in the city of Linköping, Sweden. The average yearly temperature in Linköping is 7.4 °C, where the monthly average temperatures range between −1.9 °C in the winter and 17.9 °C in the summer [
4]. The number of yearly heating degree days (HDD) for the period 2011–2016 in the Linköping area is 3602, which is significantly higher in comparison to Central Europe, where the typical HDD value is less than 2500 [
5]. The relatively high HDD value results in a great need for heating of housing in Linköping, which is typical for urban areas in the Nordic countries. Presently, the heating demand in Linköping is met mainly by a district heating system powered primarily by energy from a waste incineration plant. This plant has a heat capacity of 510 GWh, which corresponds to the heating required for about 25,000 houses [
6]. Today most of the excess heat produced during electricity generation in the summertime cannot be utilized, and is, thus, wasted. During the wintertime, fossil-fueled plants are used to cover the peak heating demand.
Presently, Tekniska Verken in Linköping AB (a large energy company in Sweden) is assessing the option to store excess heat (about 70 GWh) from their combined heat and power (CHP) operation in an HT-BTES during the summer period and to utilize it during the peak-load periods in the winter. Such a system could increase the flexibility and efficiency of the energy system. In addition, it could make it possible to phase out the fossil-fueled plants, used to generate additional heat during the winter. If the geological, social, and techno-economical prerequisites are met for the site, it could become one of the largest HT-BTES systems in the world. Earlier modeling work of a potential HT-BTES system in Linköping is described in [
7], where the Precambrian crystalline bedrock is considered as the storage medium. According to that study, a heat pump-supported HT-BTES system consisting of 1300 to 1500 BHEs with 300 m depth shows a potential to store and extract up to c. 90 GWh annually. In this study, a system with up to 1400 BHEs, borehole depth of about 300 m, and well separation of five meters is assumed.
The design of an HT-BTES plant is a complex and challenging endeavor that involves social, environmental, techno-economical, and practical aspects. The design work involves calculations of the energy efficiency, as well as energy and exergy balance. Hence, as input to this process, it is important to understand the thermal properties of the bedrock, the amount of fracturing and its orientation, groundwater conditions and water chemistry, as well as the thermal impact on the system design [
8].
With regards to the potential storage site, there are several factors that would be desirable for the efficient operation of a potential HT-BTES system. Since the TES solution is based on the storage of sensible heat, a high volumetric heat capacity of the bedrock is desirable as this will ultimately lead to a higher thermal energy storage potential for the site. Furthermore, high thermal conductivity of the subsurface is beneficial, since it promotes rapid heat transfer within the storage, and will, thus, contribute to the higher short-term performance of the BHEs [
2]. It is, however, important to note that high rates of conductive heat transfer also promote heat losses to the surrounding subsurface, and consequently reduce the long-term performance of the storage [
9,
10]. In addition, HT-BTES systems in fractured rock can be subject to substantial advective losses in the presence of groundwater flow [
11]. Extensive fracturing in some cases can also complicate drilling and lead to well integrity problems. Hence, site conditions characterized by low-permeability bedrock combined with low hydraulic gradients are also desirable.
Often, there is uncertainty as to the best available methodology for assessing the suitability of a potential site for a large-scale HT-BTES. Historically, closed-loop shallow geothermal energy system development has primarily been driven as a subset of heating, ventilation, and air-conditioning (HVAC) research, focusing on energy performance, heat pump technology, and the design of mechanical devices, etc. As a result, the characteristics of the geological and hydrogeological environment surrounding the boreholes have typically been of lesser concern [
12,
13]. Presently, standard assumptions about bedrock composition, overburden thickness, and thermal properties are often made based on regional data from geological maps combined with thermal response test data from one or a few scattered test boreholes. Furthermore, most existing design methodologies assume the homogeneous rock mass [
14]. These general assumptions are often enough for the design of smaller and low temperature BTES. However, to optimally position, as well as better prognose the performance and reliability of large-scale high temperature systems that can hypothetically be connected to district heating production, better characterization of the bedrock storage medium is required. Concerns about the environmental impact of BTES systems are also increasing as subsurface resources are more exploited in parallel with population growth and urbanization. As pointed out by [
13], sustainable BTES development requires a profound understanding of the full range of concerns associated with the technical, geological, and hydrogeological aspects of the ground-coupled system and its interaction with subsurface processes. This could be achieved by deeper integration between mechanical and geosciences disciplines to use their combined expertise in the fields involved.
Immediately north of the city of Linköping, Sweden, a relatively large area (about 2 km
2), referred to as the Distorp site, has been identified within which a potential HT-BTES system could be situated. Based on the previously available geological information, both the type of bedrock and distribution of fractures is expected to vary significantly within the area. Heterogeneity within a storage medium, which has not been adequately characterized, is known to be a factor that can reduce the accuracy of modeling and design efforts. For example, [
15] shows that a better understanding of subsurface heterogeneity in the modeling of BTES systems can reduce uncertainty in energy balance calculations. Similarly, work by [
11,
16] showed that groundwater movement can also significantly impact the performance of a BTES facility. Therefore, to place investigation boreholes optimally and efficiently and subsequently locate and accurately model the performance of a full-scale HT-BTES system, improved knowledge of the subsurface geology across the study area is required.
In this study, a multidisciplinary approach is adopted to investigate the geology of the Distorp site and to provide information to help optimize future investigation work, as well as the design of a potential HT-BTES system. Surface-based geological and geophysical measurements, not typically included in pre-investigation surveys for BTES systems, are combined with more conventional, as well as state-of-the-art measurements in several boreholes. Finally, some of the merits and limitations of the different methods applied in this study are discussed in the context of pre-site investigation for an HT-BTES system. Hence, the aims for the study are: (1) To provide a case study of multidisciplinary pre-investigation work at the Distorp site to exemplify how this information can be used to reduce risk in the placement and planning of an HT-BTES system; (2) to test and evaluate the applicability of many different field methods, not typically applied in pre-investigation work for BTES systems, to guide as to what information can and should be collected during field study and design of HT-BTES.
2. Geological Setting at Distorp, Linköping
The site to be addressed in this study has previously been identified as a potential area for constructing a high temperature BTES. The site lies within a small region of farmland called Distorp, located a few kilometers north of Linköping. The terrain in Distorp can be characterized as a low-lying hilly landscape, which is like the terrain of much of the surrounding region.
The bedrock in Distorp is typically draped by less than ten meters of Quaternary deposits, consisting of clay, silty clay, and clayey till. The terrain altitude in the site area varies between 38 and 47 m above mean sea level. Relatively thick Quaternary clay-dominated deposits are mainly found in the lower parts of the terrain, while thin deposits of till are associated with topographic highs. In several places, the Quaternary deposits are absent, and the underlying bedrock is exposed. These bedrock outcrops often exhibit smooth and rounded geometries, due to glacial erosion, and can be observed at several locations within the Distorp site and surrounding area. In addition, the main N–S direction of the ice during the last glaciation has created a corresponding lineation of the landscape. The terrain also clearly portrays the presence of regional NW–SE- and NNW–SSE-oriented fracture and deformation zones that have been further contoured by Quaternary glacial erosion and deposition. These zones are related to a structural belt of folded and metamorphosed rocks affected by the Svecokarelian orogen (c. 1.86 Ga) [
17].
Overall, the bedrock is strongly affected by ductile deformation and amphibolite to locally granulite facies metamorphism. Metabasaltic rocks of amphibolite and gabbro, as well as diorite, are found within domains of variably gneissic and granitoid intrusive rocks. Besides these, a series of post-Svecokarelian (c. 1.85–1.65 Ga) variably porphyric, granulitic, and gneissic granites intrude the previous rock suites. Within the Linköping area there are also subordinate occurrences of Svecofennian supracrustal (c. 1.91–1.86 Ga) metamorphosed felsic rhyolitic volcanoclastics [
18]. Based on modal data presented in the description of the bedrock map of Linköping NE [
19], the average SiO
2 content (which largely influences the thermal conductivity of the rock) is 68–75% for the gneissic and granitoid rocks, and 45–52% for the metabasaltic rocks.
The predominance of NW–SE-oriented structures (fractures, faults, and deformation zones) is related to the Loftahammar–Linköping regional deformation zone (LLDZ) marking the boundary between the Bergslagen (to the NE) and Småland (to the SW) lithotectonic units [
17]. This 7–10 km wide zone includes, besides a break in the topography, a series of ductile and brittle deformation zones. The LLDZ is clearly visible in the Geological Survey of Sweden’s (SGU) geophysical data, as a broad NW–SE-oriented region with anomalously low values in the magnetic data. In the gravity data it appears as a region with a distinct N–S-oriented gradient with higher gravity values occurring in the north [
18]. Since the Distorp site is located within the LLDZ, adjacent to the N–E boundary, several NE–SW-oriented lineaments parallel to the main orientation of the zone are expected (
Figure 1).
The Distorp site also lies in the periphery of an area to the west with Lower Paleozoic platform cover strata [
20]. As the outer eastern part of this area is located immediately north of the site area (
Figure 1), scattered and thin deposits of Cambrian sandstone can be expected on top of the Precambrian bedrock.
The groundwater resources in the area are mainly associated with the bedrock, since the overburden is dominated by thin fine-grained deposits with low transmissivity and storage capacity. Data from the publicly available well information database at the Geological Survey of Sweden show that wells drilled in the granite-dominated areas give capacities between 1000 and 2000 L/h, while wells in metabasite and gabbroid bedrock areas show capacities <600 L/h [
21].
It is clear from the regional geological information that variations in the lithology and level of deformation of the crystalline basement are expected to occur across the area of the Distorp site. Furthermore, in some areas, the crystalline basement can be overlain by variable, albeit relatively thin sequences of Cambrian strata or Quaternary sediments. Hence, it is important to consider these anisotropic bedrock conditions when performing future appraisal investigations and during the design of the energy storage.
3. Methods
The primary aim for pre-investigation in any HT-BTES project is to evaluate the geological and thermal conditions of the subsurface with respect to their suitability for the potential development of an HT-BTES facility. In this study, we discuss and present exhaustive pre-investigation work which has been done at the Distorp site, Linköping.
Prior to selecting the Distorp site for more detailed investigations in this study, four different locations were selected as preliminary sites. The choice of these four sites was essentially based on the availability of accessible land areas at a suitable distance from Tekniska Verken in Linköping AB’s waste incineration plant Gärstadverket, i.e., the heat waste source for the possible HT-BTES. This first phase of the investigations was carried out in 2017 and started with the completion of one 300 m deep percussion borehole (115 mm Ø) in each of the four locations, i.e., Dikestriangeln, NetonNet, Distorp Åkern, and Distorp Hagen (
Figure 1). The work included collecting samples of drill cuttings, measuring drilling time per drilling rod, and monitoring groundwater levels. Furthermore, temperature measurements, hydraulic capacity tests, thermal response tests (TRT), and distributed thermal response tests (DTRT) were also performed [
22]. Two of the four preliminary locations were disregarded, due to the presence of relatively thick overburden, the occurrence of biogenic gas in the soil, and comparatively low thermal conductivity. The remaining two sites, referred to as Distorp Åkern and Distorp Hagen, were subsequently merged into one larger prospect site for further investigations in this study, i.e., the ca 2 km
2 large Distorp site (
Figure 1).
In the Distorp site, three investigation wells have been established [
22], including the two 300 m deep boreholes drilled during the first investigation phase in 2017 (Distorp Hagen and Distorp Åkern). In 2018, an additional investigation well (89 mm Ø) was drilled adjacent to the Distorp Hagen well using a water-driven down-the-hole (DTH) system to a depth of approximately 240 m [
23]. These two wells were selected for conducting field experiments intended for investigating and applying permeation grouting techniques as a means of reducing fluid loss in open-loop BHEs. With a surface distance of only around 2.5 m between the Distorp Hagen wells, the well configuration represents typical conditions in BTES construction where very dense drilling grids are common.
Figure 2 presents the various steps of the multidisciplinary investigations and methodologies used at the Distorp site as part of this study.
Figure 2 also presents the associated information or data obtained from applying these methods, which are relevant to evaluating the site and input to the HT-BTES design work.
The main objectives for the in-depth multidisciplinary studies in the Distorp site were: (1) To apply a range of different methods to obtain the best possible characterization of the Distorp site with the resources available to the project; and (2) to evaluate these methods with regards to their suitability and capacity to provide essential information required for optimizing the modeling, site selection, and design of the final HT-BTES system. This was done to improve the understanding of the applicability of these methods to future BTES projects.
The in-depth multidisciplinary studies started in late 2018, beginning with a detailed geological and geophysical survey of the boreholes. Initially, descriptions of the cuttings collected every three meters in the two 300 m deep boreholes Distorp Åkern and Distorp Hagen were made. Furthermore, geophysical wireline logging was also performed in the two boreholes. During 2019 and 2020, geological observations and ground geophysical measurements were performed. This included geological descriptions of the rock types at outcrop, sampling for petrophysical and measurements of the thermal conductivity on rock samples, as well as measurements of the natural gamma radiation and magnetic susceptibility. Additionally, magnetic field and VLF (Very Low-Frequency) measurements were collected across the study area. Some outcrops were photographed using a drone to generate high resolution orthographic images for fracture interpretation.
Figure 3 shows a map with the location of data acquired during this work. Note that the black dashed line highlights the study area in the figure.
Although this study addresses many methods, it is important to note that the data were collected across a range of projects with varying scopes and resources. Hence, the data collection strategy across the lifetime of the site investigation has been somewhat suboptimal. For example, the investigation wells and the TRT and DTRT were already performed prior to most of the surface measurements and analyses. As a result, the flow chart in
Figure 2 illustrates a parallel execution of the methods, which was the case in this study. Ideally, this would not be the case for an optimized pre-investigation strategy, where data from different methods would be acquired sequentially and used to inform and guide decisions throughout the workflow. Hence, ideally, the placement of the investigation wells would be decided and optimized based on the surface measurements, instead of being placed arbitrarily, as they were in this study.
A table summarizing the methods and equipment, as well as brief comments about accuracy and resolution, is provided in the
supplementary data (Table S1).
3.1. Ground Geophysics
Variations in subsurface composition or rock type are often associated with changes in physical properties. Through physical measurements (for example, the magnetic or gravitational field), ground-based geophysical methods aim to characterize these variations in physical properties, and hence, infer changes in the subsurface composition. Often these measurements can be performed relatively quickly across an area. Furthermore, they do not require the bedrock to be exposed. Hence, together with bedrock observations at outcrop and borehole data, ground-based geophysical methods can be a powerful tool to map the bedrock geology over an area.
Ground-based magnetic field measurements can be made to infer variations in the magnetic properties of the subsurface. Some rock types which are highly magnetized can give rise to anomalies in the total magnetic field, which can be measured and mapped across an area. In the case of induced magnetization, the strength of the observed anomaly is related to the magnetic susceptibility of the rock [
24]. The Very Low-Frequency method is an electromagnetic geophysical method that utilizes radio frequencies within the range of 3–30 kHz. If an electrically conductive subsurface structure exists, with an appropriate size and orientation to the incoming radio waves, an electrical field will be induced within the subsurface conductor. This electrical field, in turn, gives rise to a secondary magnetic field, which can, in turn, be measured. Hence, VLF measurements can be utilized to infer the presence of conductive subsurface structures, such as water-bearing fracture zones [
24].
Airborne magnetic field and VLF measurements are available from the study area, collected in 1999 and 2003 by SGU as part of bedrock mapping projects. These data indicate the presence of regional deformation zones, as well as variations in the magnetic susceptibility of the bedrock within and around the Distorp area. However, these data do not provide the level of resolution required for this study, hence, ground-based magnetic field and VLF measurements were collected over the study area.
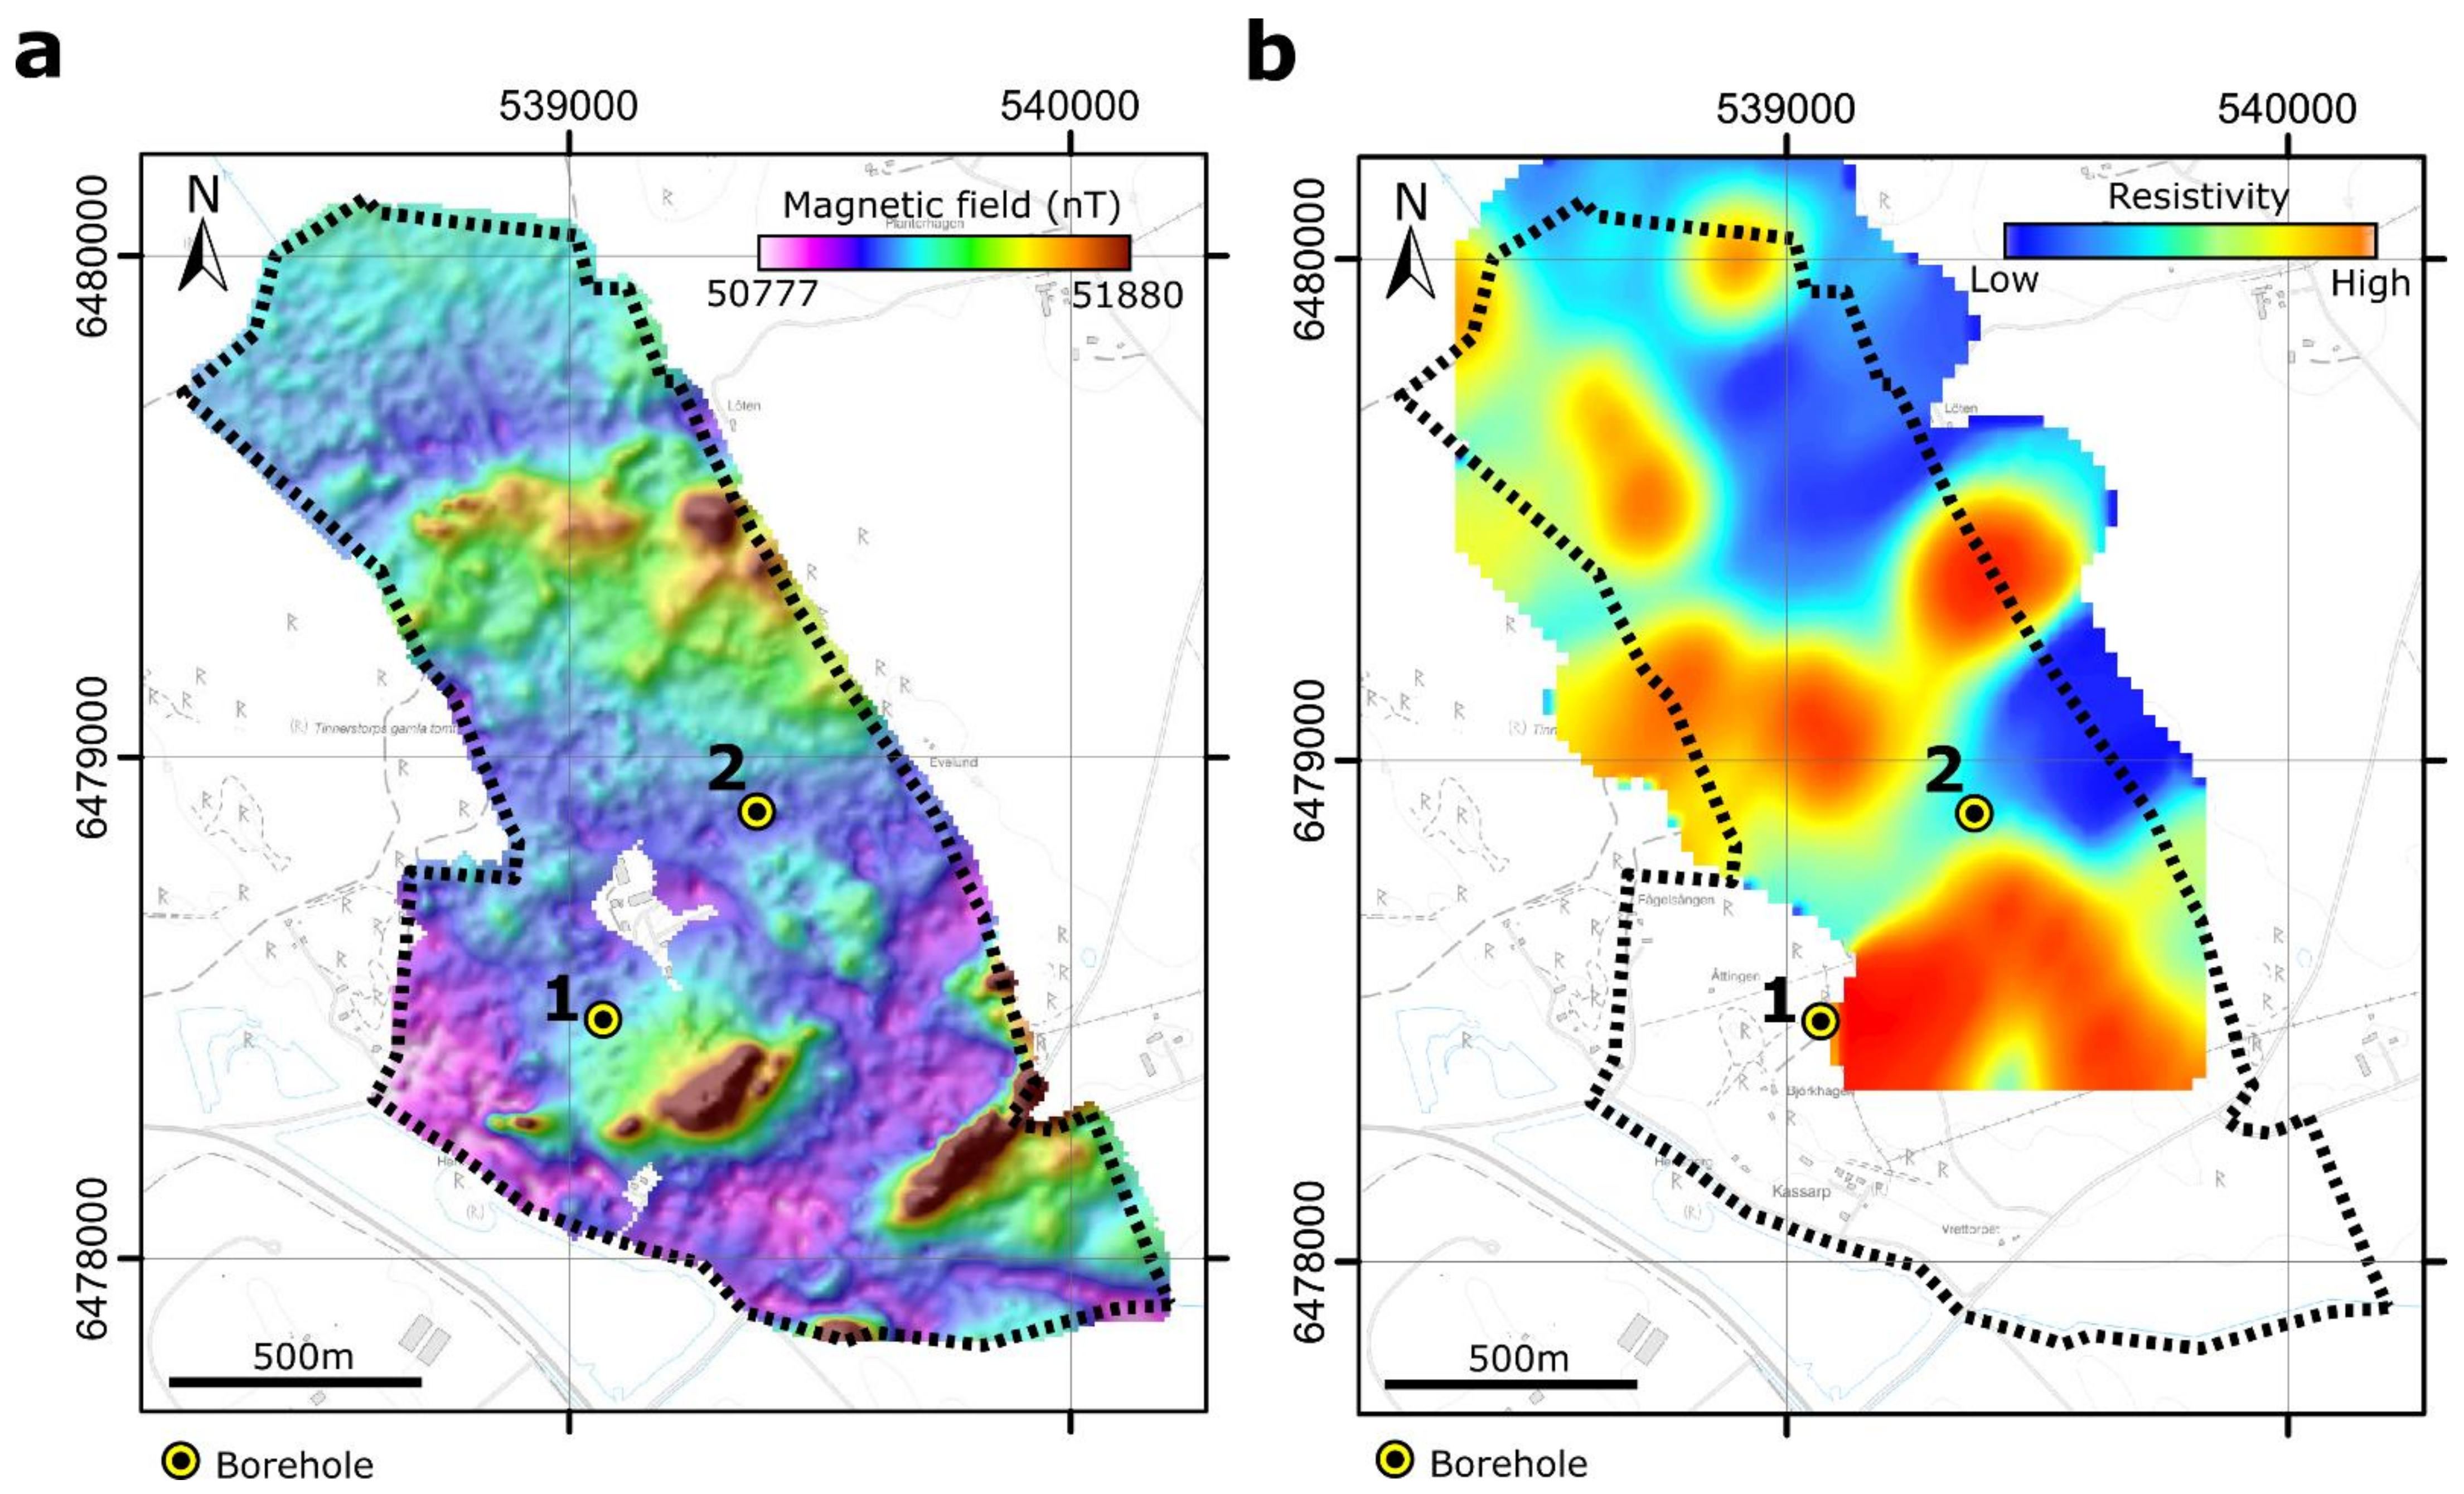
The ground-based magnetic field and VLF measurements were collected using a GEM GSMV-19 instrument. For the magnetic measurements, data points were collected continuously at one second intervals whilst walking along profiles with a nominal spacing of about 30 m (
Figure 3). After acquisition, the data were corrected for diurnal variations using base station measurements from SGU’s Fiby observatory. Minor line-leveling and filtering corrections were also then applied to the data.
VLF measurements were collected every 15 m along a series of profiles with a nominal spacing of 40 m. A profile azimuth of 30° and VLF frequencies of 19.6 and 24.0 kHz were used, to be sensitive to potential deformation zones with an NW–SE-orientation. A VLF frequency of 16.4 kHz was also measured to provide measurements from an approximately orthogonal direction to the first two frequencies. Power lines located in the southern part of the study area generated too much noise for data to be collected. Hence, VLF data was only acquired in the central and northern parts of the study area (
Figure 3). After acquisition, some simple filtering was applied to the data before it was inverted to generate a 3D resistivity model of the subsurface. As the terrain across the study area is primarily farmland, the magnetic and VLF measurements could be collected relatively quickly and efficiently over about 5–7 days.
In addition to the VLF and magnetic field measurements, natural gamma radiation was measured at several outcrop locations using a handheld RS-125/230 spectrometer. A minimum of three measurements was made for each rock type at the outcrops, which were investigated. Based on these measurements, the spectrometer estimates the amounts of potassium, uranium, and thorium in the different rock types.
Ground-based gravity surveying can be a powerful method for characterizing variations in bedrock geology. With this method, local anomalies in the earth’s gravitational field can be used to infer changes in subsurface density [
24]. Regional gravity data has previously been acquired across the Distorp area and is available from the Geological Survey of Sweden [
25]. However, the average spacing between measurement points for this part of Sweden is about 2.5 km. Hence, only one gravity measurement was performed within the study focus area. Therefore, the resolution of these regional gravity data is too low for detailed mapping of the geology at the Distorp site. Acquisition of additional ground gravity measurements likely would have contributed to our assessment of the site. However, due to limitations in resources and accessibility of the measurement equipment, this was not performed as part of this study.
3.2. Drone Photography of Outcrops
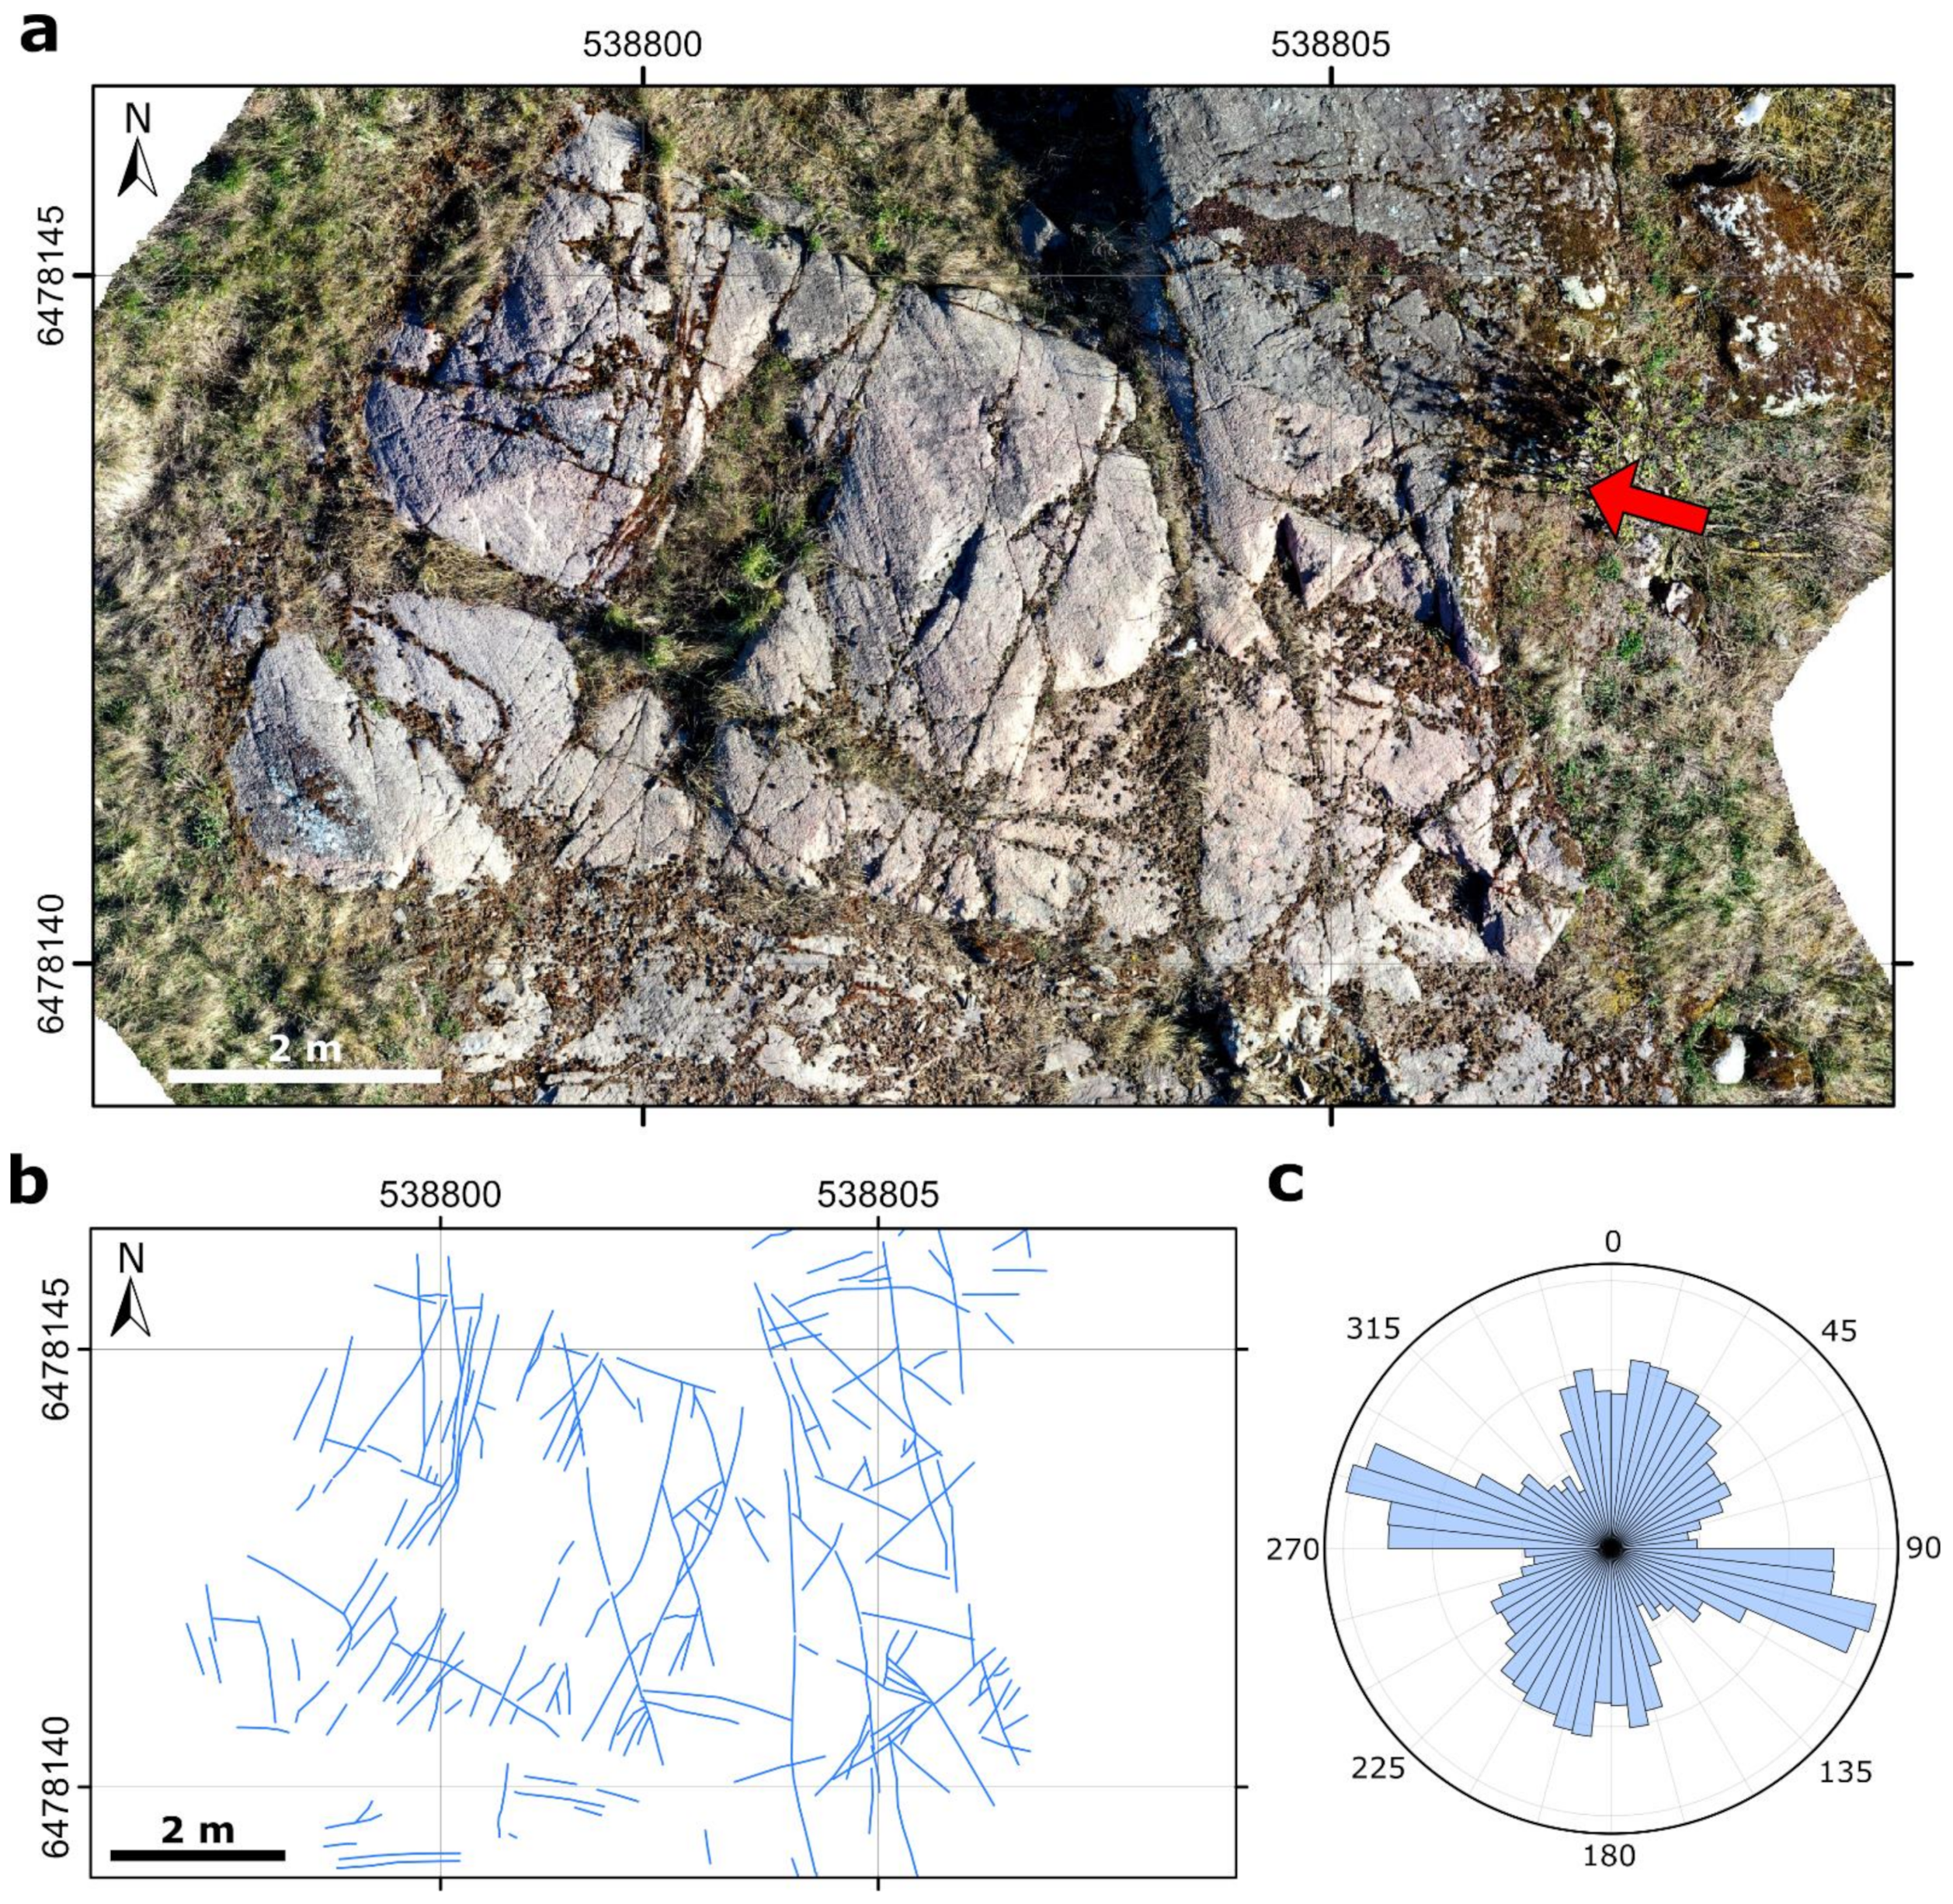
A Mavic 2 pro drone was used to take photographs of several outcrops within the study area for the purpose of generating detailed orthophotos (orthographic composite photos) for fracture interpretation. During acquisition, the drone was flown at a height of 10 m, and a series of pictures was collected over the outcrop of interest using a front overlap of 80% and side overlap of 60%. The images were later processed in photogrammetry software to generate georeferenced orthographic images. The orthophotos of each outcrop were then imported into GIS software (ArcMap 10.7.1) where the fractures were mapped. Subsequently, a custom MATLAB (R2020b) script was used to perform a statistical analysis of the interpreted fractures and generate diagrams for visualization of the results.
3.3. Thermal Conductivity Measurements
The thermal conductivity of the various rock types occurring in the investigated area has been measured by the Geological Survey of Sweden using a Thermal Conductivity Scanner (TCS). The equipment used is manufactured by Lippmann and Rauen GbR in Germany. In total, 17 rock samples from outcrops inside or in the proximity of the Distorp site were analyzed. In some cases, multiple measurements were performed on a single sample, to scan in different orientations. This led to a total of 23 measurements being made for the Distorp area. The TCS measures the thermal conductivity (TC) and thermal diffusivity (TD) by applying optical scanning technology to plane or cylindrical surfaces (along the cylinder axis) of rock or core specimens. The TCS uses a focused, mobile, and continuously operated heat source in combination with infrared temperature sensors [
26]. These sensors measure the sample temperature before and after heating. Typically, two reference probes with known thermal properties are analyzed together with the sample. TC and TD are determined by comparing the temperatures assessed from the certified standard samples with temperatures measured on the rock sample.
During operation, individual TC measurements are made along a scan line at a specified sampling rate across the rock sample. From these measurements, a mean average, as well as maximum and minimum TC values are calculated for the sample. Thermal diffusivity TD can also be measured together with the TC measurements.
3.4. Petrophysical Measurements on Rock Samples
During the project, measurements of both magnetic susceptibility and density were performed on 14 samples collected from outcrops in the Distorp area, in SGU’s petrophysics laboratory. The density was calculated by comparing measurements of weight and volume. The weight of the samples was measured using a precision scale (FX-3200) and the volume using the Archimedes principle (displacement of water). The magnetic susceptibility was measured using a GTK K4/GSF-93 instrument, built by the Finnish Geological Survey (GTK). Here the magnetic susceptibility is measured using the deviation method, utilizing an AC bridge. Based on repeat measurements of a typical bedrock sample, of standard size and relatively low susceptibility, the standard deviation of these instruments is about 5 kg/m3 and 20 × 10−6 SI for density and magnetic susceptibility, respectively. In addition to these lab measurements, magnetic susceptibility was measured at outcrop locations using a hand susceptibility meter (SM20). To assess the variability and obtain a representative average value, at least 10 measurements were made at different points across each outcrop location.
Furthermore, pre-existing petrophysical data and outcrop magnetic susceptibility measurements from the Distorp site and surrounding area were extracted from SGU’s databases. These pre-existing data were combined with the newly acquired data to form a petrophysical database for use in this study.
3.5. Wireline Logging
The wireline logging was performed by Engineering Geology at Lund University with equipment from Robertson Geologging Ltd. Two runs were performed in each borehole, the first with Natural Gamma, Temperature, Long and Short Resistivity, Single Point Resistance, and the second with Acoustic Televiewer (ATV).
The Natural Gamma log is the most widely used log for lithological characterization of successions within boreholes. The log is a passive radiometric log that uses a scintillation counter that detects the natural gamma radiation coming from the rocks in the borehole wall [
27]. The radiation originates from the potassium-40, radium–uranium, and thorium series. For crystalline rocks like granites and metabasites there is a significant difference in the potassium content, which can be detected in the Natural Gamma log. The relatively potassium-rich granites (high in mica and feldspars) will consequently result in a higher gamma-ray level in comparison to the generally potassium-poor mafic rocks [
28]. The purpose of this log was, with the support from descriptions of the rock cuttings, to get a detailed picture of the rock type distribution in the boreholes. The gamma-ray results can also indirectly be used as a measure of the thermal properties of the rocks within the borehole, since most in situ heat production are related to the amount of naturally occurring radioactive elements mentioned above [
29].
The Single Point Resistance tool measures the electrical resistance of the subsurface in the immediate vicinity of the borehole. The tool operates by measuring the difference in voltage between two electrodes using a constant current. Single-point logs are sensitive to the resistivity of the lithology adjacent to the electrodes, regardless of electrical influences caused by varying thicknesses and composition of beds; thus, they have, in general, a very high vertical resolution.
The Short and Long Resistivity tool measures (as opposed to resistance) the resistivity of the formation volume (rock and formation fluids) outside the immediate proximity of the borehole. The vertical resolution is less than for the Single Point Resistance tool. The tool works best in sedimentary bedrock with relatively thick beds where the focus lies on determining the thickness of the mud invaded zone in porous rocks, as well as properties of any reservoir fluids present.
Several properties affect the resistivity of a rock volume, for example, porosity, the resistivity of the fluid within fractures and pores, mineral composition, and the texture of the rock. Granitic rocks have, in general, slightly lower resistivity compared to mafic rocks. Although, it should be noted that there is a significant variation in the resistivities of mafic and felsic intrusive rock types [
30].
The Acoustic Televiewer generates an acoustic image of the borehole wall by detecting the arrival time for a reflected sound wave generated by a rotating piezoelectric source. Besides the arrival time, the log registers the amplitude of the measured acoustic wave. The measurement gives a continuous, 360 degrees image of the borehole wall, which is geographically orientated. After processing, fractures and variations in the density of the borehole wall can clearly be identified. A major advantage of the Acoustic Televiewer is that it can be run in boreholes where the drilling fluid is opaque, for example drilling mud. Within this project, Acoustic Televiewer data has been used to map the in-situ fractures to assess the hydraulic properties, borehole integrity and to determine the deviation and direction of the investigation boreholes. Vertical boreholes with minimal deviation are essential in a multiwell HT-BTES where the distance between the individual boreholes is commonly only a few meters. Too much deviation can cause undesirable thermal interaction between boreholes, as well as increase the risk of collision between boreholes during drilling operations [
31].
3.6. Thermal Response Tests
Thermal measurements, including thermal response tests and distributed thermal response tests, were performed. Conventional TRT is a relatively simple and well-established pre-investigation method in the shallow geothermal industry. It is utilized for quantifying effective underground properties, and thereafter, provides input for system design [
32].
TRTs are commonly performed by injecting the heat into the borehole at a constant rate by circulating a heated secondary fluid through a closed-loop borehole heat exchanger. The effective thermal conductivity (λ*) and effective borehole thermal resistance (Rb*) are estimated through an inverse modeling procedure. During this process, measurements of the heat exchanger inlet- and outlet temperature in response to the heat injection over time are matched with the equivalent temperature response obtained from a parameterized model. For this purpose, under the common assumption of pure conduction heat transfer in a homogeneous medium, the infinite line source (ILS) model was used [
33]. This test procedure implies that the experimental data and the best-fit parameter values obtained only represent spatially averaged predictions of the thermal characteristics of the subsurface and BHE performance. In other words, no information about subsurface heterogeneity is provided.
Application of distributed temperature sensing (DTS) technology, based on Raman optical time-domain reflectometry allows for downhole temperature measurements to be recorded along the full length of the borehole during the response test. One or multiple fiber optic cables may be installed in the test borehole, while performing a TRT. The processed temperature data acquired from the DTS system consist of discrete (averaged) representations of the continuous temperature distribution over a sampling interval. The sampling resolution, i.e., the sampling interval spacing over which signals are collected and averaged along the fiber, can be as low as 0.125 m for high performance devices [
34]. Distributed temperature measurements can also be carried out with other types of sensors, but optical fiber cables, when properly used, offer significant advantages [
35]. This type of TRT is often referred to as a Distributed Thermal Response Test.
In contrast to conventional TRT, based on BHE inlet- and outlet temperature measurements, the DTRT permits evaluation of λ* and Rb* locally along the borehole using time series of downhole temperature profiles acquired from DTS data as input to the response model [
36]. The DTS instrument used in this study has a sampling resolution of 203 cm, which enabled TRT evaluation at around 150 sample intervals along the two 300 m deep investigation wells. Temperature profiles are also obtained during the test phases before and after heat injection, which allow for evaluating additional factors that affect the temperature conditions in the borehole, such as vertical groundwater movement and the presence of water-bearing fractures. Passive DTS measurements taken under undisturbed ground conditions can be used for characterizing near-surface seasonal temperature propagation effects, and at greater depths, the geothermal gradient.
3.7. Hydraulic Tests
Hydraulic tests were performed in connection with an experimental grouting project conducted in parallel with the present study [
23]. The aim of the field experiments was to explore the use of permeation grouting techniques to implement open-loop BHEs. The primary objective of the hydraulic tests was to characterize near-borehole hydraulic conditions in the rock mass.
In the 240 m and 300 m deep Distorp Hagen wells, the hydraulic testing procedure involved the performance of single-hole, short-duration water loss measurements, which were carried out by injecting water into the test section under a constant pressure of 200 kPa. The pressure was maintained until the injection flow rate had stabilized (i.e., reached quasi-stationary condition), which typically occurred within time periods of the order of minutes. The pressure and flow data were evaluated through steady state flow analysis using Moye’s formula to estimate a transmissivity value for the test section [
37].
A double-packer system was used to isolate sections of interest within the borehole to perform the investigation. Measurements using 50 m section lengths were performed at regular intervals between about 10 m depth and the base of the borehole. Additional measurements were also carried out using a smaller packer spacing of 5 m in four sections within the shallowest 50 m of the borehole. These sections were selected based on the wireline logs, which indicate intervals with a high fracture density or the occurrence of single conductive water-bearing fractures.
5. Discussion
It is known that the investment cost associated with multiwell HT-BTES systems is substantial. As such systems may be designed and built for large scale installations, an arbitrary assessment of design and placement, based on limited data, can lead to high risks regarding performance, longevity, and impact on the surrounding environment. Anisotropic geological conditions are especially common in a crystalline rock mass, like the conditions in the Distorp site. When considering sites with sedimentary strata, a certain degree of predictability in the geological conditions parallel to bedding is reasonable to assume, despite variability perpendicular to the bedding direction. However, the anisotropy observed in crystalline rocks is, in comparison to sedimentary rocks, often considerably greater. As a result, the anisotropy in thermal properties anticipated within crystalline rocks is also typically higher than in sedimentary rocks. The frequency and predominant orientation of fractures and fracture zones are also important factors that can have an impact on the groundwater flow, and hence, the size and shape of the rock mass thermally affected during the operation of an HT-BTES system. Hence, a strategy relying only on single investigation wells for appraisal and design of a large-scale HT-BTES facility in an anisotropic crystalline bedrock setting is unlikely to provide accurate information required to assess potential performance, longevity, and environmental impact.
To fully characterize the anisotropic geological conditions (i.e., to obtain a more solid base for design), a multidisciplinary approach in the pre-investigation phase is recommended, especially for HT-BTES systems that utilize large well clusters.
However, characterization of anisotropic conditions in a crystalline rock mass on a local scale is challenging and can be resource-demanding. Thickness and composition of the soil cover, petrophysical properties of the rock mass, groundwater conditions, and the accessibility of outcrops all govern the possibility to collect information, as well as the methods that can be applied. The approach in this study has been to test and evaluate a comprehensive range of methods that may be appropriate for improving the empirical data set on various properties in a crystalline bedrock domain. It is not recommended that all the methods addressed in this study should be applied in all pre-site evaluations. In fact, it is important to emphasize that several aspects of the data collection and investigation strategy within this study are suboptimal. This is largely because the data in this study have been collected across various separate and sequential projects, which have had varying individual scopes and objectives. For example, in this study, the boreholes were drilled prior to the surface geophysical and geological investigations. Ideally, the results of the relatively quick and resource effective ground geophysical and geological investigations should have been available to optimize the location of the relatively expensive boreholes. Furthermore, in this study, many methods have been tested in parallel to investigate various aspects of the HT-BTES site. It is recommended, however, that in future investigations, a more sequential and integrated data acquisition and analysis strategy be adopted. Hence, it is not suggested that the workflow presented in this study be considered best practice for a pre-investigation study for an HT-BTES system. Instead, we aim to showcase and exemplify a range of available methods which, if appropriate, can be selected to form part of an HT-BTES investigation strategy.
It is important to highlight that the choice of methods should be tailored to the scenario being assessed. When designing an investigation strategy, it is important to consider the physical characteristics of the bedrock, as well as the anticipated level of subsurface uncertainty when selecting methods. The limitations of the different methods should also be considered. Furthermore, the investigations should be of an appropriate scale, bearing in mind the resources available for the project and the eventual size of the HT-BTES system. Finally, the investigations should form part of an integrated and sequential site evaluation strategy.
In the following discussion, the performance and limitations of the different methods applied at the Distorp site are discussed, with the aim of providing information that can be useful for the design of pre-site investigations strategies for future HT-BTES systems within crystalline bedrock.
At the Distorp site, regional bedrock maps and petrophysical data from SGU indicate that the bedrock is dominated by granitoids, which typically have low magnetic susceptibilities and relatively high thermal conductivities. Within these granitic rocks, occurrences of more mafic gabbroid rock types can occur, which can have higher magnetic susceptibilities and typically have significantly lower thermal conductivities (cf.
Figure 1 and
Figure 4). Hence, in the case of the Distorp site, the magnetic survey proved to be the most useful ground geophysical tool for pre-investigation. Firstly, it allowed regions with more mafic rocks to be mapped in more detail, as these rocks often exhibit relatively high magnetic susceptibility values. The magnetic data also allowed several local deformation zones to be interpreted based on linear discontinuities in the measurements. Updates to the bedrock geology map for the Distorp site, although based on all the available data from the study, relied heavily on the newly acquired ground magnetic data (
Figure 8a).
The VLF-survey gave complimentary information on the occurrence of deformation zones which appear as low resistive features in the data. In the Linköping area, a single potential water-bearing deformation zone was interpreted. Although there is uncertainty in the interpretation of this data, it is beneficial to avoid such potential features when planning an HT-BTES well-cluster. The ground-based geophysical investigations, which required only a fraction of the time and resources required to drill an investigation well, can therefore be considered relatively efficient tools for assessing the lateral anisotropy of the bedrock across the Distorp site. However, it is important to note that interpretation of these ground geophysical data is to some degree subjective, and hence, uncertain. Furthermore, to interpret the ground geophysical data effectively, a good understanding of the petrophysical properties of the rock types in the study area is required. A limitation of ground magnetic and VLF measurements is that they are affected by the presence of infrastructure. Hence, due to the presence of powerlines, it was not possible to acquire VLF data in the entire southern part of the study area. Furthermore, magnetic measurements close to infrastructure or large metallic objects (such as farming machinery or fences) could not be used. Therefore, ground geophysical methods are likely to be most effective as a pre-investigation tool when there is some flexibility in the placement of the HT-BTES system within a larger investigation area with anisotropic bedrock conditions and sparse infrastructure.
Ground gravity measurements were not collected as part of this investigation, due to limitations with resources and equipment availability during the project. However, based on the petrophysical data, there is a clear difference in density values between the mafic and felsic rocks in the study area (
Figure 4). Hence, the regions with mafic rocks would likely have generated a series of gravity anomalies which could have been mapped by a grid of gravity measurements across the study area. Therefore, the acquisition of gravity measurements would be recommended for further geophysical investigations at the Distorp site or for pre-site investigations of other HT-BTES projects within similar geological settings.
Outcrop studies have also provided valuable information during the investigations at the Distorp site and have proven to be essential for the interpretation of the ground geophysical data and revision of the bedrock geology map. The use of drone photographs to image and map outcrops proved to be an efficient method for generating a statistical assessment of the primary fracture orientations in the study area, which is valuable data for subsequent modeling work. During the study, lab measurements of thermal conductivity and petrophysical properties, such as density and magnetic susceptibility, have provided highly valuable information which can be useful for calibrating subsequent modeling efforts, as well as interpreting other data collected in the project. A downside of these observations is that measurements are often constrained to specific outcrop locations, which are not evenly distributed across the study area. Hence, this can lead to bias in the subsequent analysis of these data.
The updated geological map for the study area (
Figure 8) is assessed to be an improvement from the pre-existing geological map (
Figure 1). This is primarily because the more regional map shown in
Figure 1 is based on relatively few geological observations and relatively low resolution airborne geophysical measurements. The more detailed map in
Figure 8 incorporates and is consistent with additional outcrop observations. Furthermore, some of the geological boundaries have been re-interpreted to be consistent with the detailed ground magnetic data.
However, it is important to note that this geological interpretation could be further improved with additional modeling and analysis of the data. In this project, the results from the different geophysical methods were largely used separately to update the geological map of the study area. This was mainly due to resource constraints during the project. However, in other studies, it has been shown that more accurate and consistent geological interpretations can be achieved if the ground geophysical data is combined, with the available borehole and outcrop data to generate a single 3D geological model [
46,
47]. In such approaches, it is also possible to process (invert) the data from various geophysical methods together to obtain a more robust result [
48,
49]. Hence, additional 3D modeling work and joint processing of the data could lead to improvements in the assessment of the site geology and hence, better placement of a potential HT-BTES system.
The use of percussion-drilled investigation wells is not the best way to collect measurements of the subsurface properties. Although data from TRT and DTRT measurement and geophysical wireline logging provide valuable information, there is a problem in correlating the precise rock type to the geophysical and thermal properties. Hence, it is challenging to combine the well results with the ground geophysical measurements. Acquisition of drill core, along with measurements of the susceptibility and analyses of the thermal conductivity coupled to rock type, would greatly enhance the understanding of how the lithological and physical properties of the bedrock are related. Although it is a relatively expensive method, the quality of the information justifies that at least one fully cored borehole is drilled in pre-investigations for larger HT-BTES projects. Wireline logging of the cored borehole could then be used as a reference to interpret log data acquired in additional (relatively cheap) percussion boreholes strategically placed within the site area.
The wireline log data were important, together with the cuttings, to interpret the lithology in the wells. However, they were also used to identify fracturing, water-bearing zones, and assess the orientation of the boreholes. Furthermore, if spectral gamma-ray measurements are used in percussion drilled boreholes, this would enable calculations of heat productivity and more clearly distinguish potassium-poor mafic rock types, such as gabbro, from potassium-rich granitoids.
The geological prerequisites play an important role in the borehole design. Vertical wells are important as the intersection between wells can cause problems when installing the well collector tubing. Strongly deviated wells will also typically not reach the designed depth and bottomhole temperature. A foliated and fractured rock may increase the risk of deviation.
Within the site selection and the BTES design process, the use of conceptual and simulation models is central in assessing the thermal performance and environmental impact of the system. In this context, data collected from extensive field observations provide a useful base for selecting appropriate model parameters, as well as for model validation purposes. In particular, the validity of the common assumptions made in system modeling (e.g., conduction-only heat transfer in homogeneous porous media) can be assessed. Furthermore, it allows for evaluating the applicability of conventional field investigation methods (e.g., TRT) typically employed for collecting data to determine requisite model input parameters.
In this study, the geophysical and geological observations indicate that substantial lateral heterogeneity in the subsurface thermal properties occurs on a scale smaller than that of a typical large-scale BTES facility (
Figure 8). It is also the case that a typical-duration TRT only samples a small portion of the storage volume. Given these factors, there is a high probability that a homogeneous model based on TRT data alone, with limited spatial coverage, would not be capable of accurately representing the global characteristics of the large-scale system. The potential limitation of assuming a single TRT-based thermal conductivity estimate to be representative at storage-scale was demonstrated by [
15]. Here [
15] compared the long-term prediction accuracy of a homogeneous TRT-based finite element model with that of a vertically layered heterogeneous model with material properties inferred from inverse modeling of long-term soil temperature observational data.
The use of ground geophysical and outcrop studies in the early stage of the pre-investigation process could provide useful information on storage-scale heterogeneity for optimization of subsequent borehole investigations (e.g., DTRT and thermal core analysis, wireline logging, etc.). The combined storage- and borehole-scale data could ultimately be used for parameter estimation, e.g., by geostatistical analysis (see for example [
50,
51,
52]). Furthermore, the use of hydraulic testing and fracture mapping techniques (e.g., borehole televiewer, outcrop, and core studies) for hydrogeological characterization could provide valuable model input data in the design and environmental assessment processes.
In the final part of this section, the optimal placement of a potential future HT-BTES system at the Distorp site is discussed, considering the available data. The potential HT-BTES in Linköping would involve drilling approximately 1400 wells, with an equidistance of five meters, which would take up an area of approximately 0.04 km
2 (200 × 200 m). Thus, this would require considerably less space than the entire site area of approximately 2 km
2, presenting the opportunity to optimize the proposed location of the HT-BTES system. Ideally, such a facility would be located within granitic rocks (with high thermal conductivity) and within a region with relatively few fractures. Therefore, based on the updated bedrock geology map of the study area (based on a range of measurements collected in this study), a location approximately 500 m north of the Distorp Hagen well can be suggested (
Figure 8a). The specified area is interpreted to consist of relatively homogeneous granite. In the VLF data, this location lies within a region of relatively high resistivity, which could indicate that it is relatively unfractured. This location is also characterized by relatively low magnetic field values, which likely indicate more granitic rocks. Hence, this area would be a good potential target for further investigation. However, due to uncertainty in the bedrock geology map and the potential for heterogeneity at depth, additional investigation wells at this location are required to further assess the suitability of this location.


