1. Introduction
There is an extensive academic literature that discusses what may be required for attainment of affordable and clean energy for all, i.e., Sustainable Development Goal 7 (SDG7). Much of this literature contends that attaining SDG7 will require investment in clean energy infrastructure that is high cost compared with incomes of the populations that currently lack affordable clean energy supplies. Analyses in these studies often take current clean energy supply costs as a given, and then build projections of how many people can attain different levels of clean energy supply given different investment and affordability assumptions [
1,
2,
3,
4,
5,
6,
7,
8].
Recent studies have provided a wide range of estimates of the cost of distributed microgrid solar electricity. USAID provides an estimate in a 2018 report of USD 1.0/kWh to USD 1.6/kWh for PV-only microgrids and USD 0.70/kWh to USD 0.85/kWh for combined PV/diesel microgrids [
9]. A 2021 study of PV system costs in Nigeria estimates a cost of electricity ranging from 0.387–0.475 USD/kWh [
10]. A 2020 study focused on Rwanda estimates of PV/battery microgrid electricity costs of USD 1.82/kWh [
11]. Meanwhile, a 2020 study that provides projections of microgrid electricity costs as a function of supply reliability provides a projection that the costs can be as low as USD 0.30/kWh by 2025 [
12]. This relatively low estimate is for systems that can provide 90% of demand, have a PV array that lasts 20 years and an electrical energy storage system that lasts 10 years, and have an amortization discount rate of 6%. The per-kWh cost of solar home systems can be an order of magnitude higher than microgrids because of the shorter lifetime, low system capacity utilization, and decreased economies of scale [
13].
Will such relatively high-cost clean off-grid electricity systems be affordable enough to provide for the needs of hundreds of millions of people living in low-income households? Given that the vast majority of household energy in SSA is used for cooking, the key to answering this question lies in addressing cooking energy needs.
For billions of people in the lower income areas of the globe, the primary household energy use is for cooking. Many studies have detailed the health and environmental problems associated with approximately three billion people using biomass fuels for cooking [
14,
15]. From a humanitarian perspective, the impact of a disease burden from cooking smoke that may cause nearly four million deaths per year globally makes the transition from biofuels to clean cooking fuels particularly urgent [
16].
In sub-Saharan Africa (SSA), a clean energy transition hinges on making clean cooking affordable relative to biomass-based cooking. In energy units, the amount of household fuel consumption for cooking is an order of magnitude larger than the amount of consumption for other uses. Yet typically, cooking energy expenditures are not ten times larger than energy expenditures for lighting, cell phone charging, and other energy applications [
17].
How do hundreds of millions of households use ten times as much cooking fuel compared with energy for other uses, yet spend only half of the household energy budget on cooking? The answer is that typically such households obtain cooking fuels at prices that are more than ten times lower per unit energy than the energy prices they obtain for lighting electricity, lighting kerosene, cell phone charging, etc. One way they lower the cost of wood fuel is by gathering much of the fuel necessary for cooking with uncompensated household labor [
18,
19].
Several studies have recently tried to bridge the cost gap between cheap biomass cooking fuels and expensive, cleaner, and more modern fuels by increasing the efficiency of the devices used for cooking and by focusing on charcoal cooking, which is more expensive than wood [
20,
21,
22]. If, for example, households can cook using electricity at efficiencies that are five times higher than typically cooking with charcoal, then households can afford to pay five times as much per unit of electric energy than they pay per unit of charcoal fuel energy, and still be able to afford the switch from charcoal to electric cooking. This approach works for households that use charcoal which is the more expensive, resource intensive biomass fuel and which is predominant in many urban areas. However, in energy units, it typically takes approximately four megajoules of wood to make one megajoule of charcoal, so wood tends to be at least four times less expensive than charcoal per unit of energy. While efficiency often appears to bridge the affordability gap between clean cooking methods and cooking with charcoal, to date it appears that efficiency alone fails to close the affordability gap between off-grid electric cooking and wood.
This study examines the additional strategy of making the electricity used in cooking dramatically cheaper through technical design and distribution cost innovation in order to help bridge the affordability gap between wood-based and electricity-based cooking.
This study provides a detailed comparative marginal cost analysis between wood-based cooking and select off-grid solar electric cooking technologies. The study characterizes a wide range of cooking energy costs for wood and also characterizes costs for two alternative off-grid solar electric cooking (SEC) supply technologies. The comparison is intended to characterize the conditions under which off-grid SEC energy can be less costly than wood-based cooking (WC) energy. Since wood is the least expensive cooking fuel generally available to low-income households in developing countries, this study presumes that if SEC energy is less expensive than wood, then it will also be less expensive than the higher quality and more expensive alternative fuels such as charcoal and liquefied petroleum gas (LPG). Charcoal and LPG are occasionally used by low-income households when either wood is not readily available, or when households have sufficient disposable income to use fuels that are cleaner and more convenient than wood.
2. Materials and Methods
The analysis methods chosen for this study are selected with the purpose of helping reveal technologies and innovations in SEC that can allow SEC energy to out-compete WC in low-income SSA.
One reason that WC is so common in SSA is that it is not only inexpensive, but it requires almost no capital investment to utilize. Any time that one can find a few sticks to burn and three stones to hold a cooking pot, one can cook some food with wood. In contrast, SEC requires significant capital investment which is paid off either explicitly in terms of periodic payments or implicitly in terms of cost savings that accrue over the months and years during which the SEC system is used.
Tens of millions of SSA households operate at least partially in a subsistence economy [
23] where due to a shortage of cash income, household members work without pay to produce the food, housing, and other essentials that the household needs. These households with very low cash incomes are often the same households that use wood fuel for cooking since such wood fuel can be obtained without cash expenditure when needed. Even though many households may acquire cooking wood fuel at no cash cost, such “free” fuel still has an opportunity cost which is a non-market value that generally can be estimated [
24,
25]. This opportunity cost may either be the potential cash value of selling wood in local markets that is gathered with household labor, or it can be the market value of the labor that is expended to gather the wood. Using either method, it is possible to quantify an opportunity cost of wood fuel.
This means that adoption of a SEC system results in real and tangible economic savings for households operating under subsistence economy conditions. This is true even when such households are currently gathering wood with no cash expenditure. The net benefit of an SEC system is the present value of the wood savings value created by the SEC system minus the initial cost of the SEC system and the present value of any replacement and operating costs.
To compare the investment cost of SEC versus the continuing fuel supply cost of WC, we use the analytical tool of the “Levelized Cost of Energy” (LCOE) [
26].
2.1. Levelized Cost of Energy (LCOE)
One of the widest applications of the LCOE concept is in evaluating the conditions for grid parity for renewable energy supplies relative to more traditional energy supplies for utility scale electricity procurement [
27]. In many applications of the LCOE concept, researchers consider grid parity to be obtained when the LCOE of the new technology drops below the marginal cost of electricity supply for non-renewable electricity.
Specifically, following Bilal et al. [
28], the relevant cost comparison metric for small stand-alone systems is the levelized cost of
consumed energy. In both the biofuels case and the solar electricity supply case, much of the energy supplied to a household is wasted through inefficiencies. In the case of biofuels, much of the energy contained in the fuel is wasted by the inefficiencies of the biofuel cooker or the cooking process. Traditional wood cooking typically is done with cookers and methods that are only 10% to 20% efficient [
29,
30]. Meanwhile, in the solar electricity case, much of the electricity that is produced by the solar panel is “wasted” either through losses in the solar electric cooker or by not utilizing energy that can be produced by the solar panel.
To compare the cost of solar electric and wood-based cooking, we use the levelized cost of energy (LCOE) delivered to the food for cooking. The LCOE is expressed both from the customer perspective and from a perspective that includes environmental impacts of emissions. For the customer perspective, this study measures LCOE with respect to the incremental impact of the energy system on the household resources. To address the portion of the environmental impacts that are more easily quantified, the study estimates the value of wood use reduction in climate change impacts. Given additional environmental health and deforestation impacts of wood consumption, the environmental cost estimates used in this study are conservative underestimates of the total environmental benefits of reduced wood consumption.
2.1.1. LCOE for Wood Cooking
For a given household cooking energy requirement, the LCOE for wood-based cooking is simply:
where
LCOEWC is the LCOE of wood cooking,
Pwoodfuel is the cost of wood fuel in units of currency per kilogram (kg),
EIwoodfuel is the energy intensity of fuel in energy units per kg, and
EffWC is the efficiency of wood cooking measured as the energy delivered to the food divided by the energy content of the wood fuel consumed. Energy delivered to food does not include energy delivered to the cooking pan or pot.
To estimate a distribution of wood fuel costs that can be representative of rural SSA, we model the opportunity cost in terms of a cost of labor, a labor per unit of wood gathered, and a kilograms of wood per unit gathered plus the environmental cost in terms of greenhouse gas (GHG) emissions.
Table 1 presents the ranges for the different inputs to the cost model. For a relatively low per-capita income in SSA of USD 1/capita/day, the model assumes that the labor of adult women in a household is substantially more productive than the labor of children, so it selects USD 2/day as the wood collecting labor cost (i.e., twice average per-capital income). The median labor cost is twice as large as the low value, and the high labor cost is assumed to be twice the median. Wood in rural SSA is commonly gathered in units of “head load”, where an average head load (i.e., amount carried on the head when returning from gathering fuel) in SSA is estimated at approximately 25 kg [
31]. The labor necessary for collecting and processing a head load of wood for cooking depends sensitively on the distance needed to travel to collect wood. The model assumes that the labor for collecting and chopping a head load of wood can range from 1.5 h to 5 hours because the distance traveled to collect wood can range up to several kilometers in rural SSA [
32]. The range of emissions factors are derived from evaluation of the results of Bailis et al. [
33]. Note that the lower emissions impact corresponds to a case where much of the fuel wood consumed is harvested sustainably from local forests.
The environmental cost of the wood depends on the net GHG emissions impact associated with wood use, and the effective value of GHG climate impacts. The analysis assumes three cases. The high cost case assumes that the social cost of carbon is USD 56 per ton of CO
2-equivalent emissions (tCO
2e) [
34], the medium cost case assumes a value of USD 20/tCO
2e (equivalent to a moderately high market value for cook stove carbon offsets), and the low cost case assumes an environmental cost of USD 0.
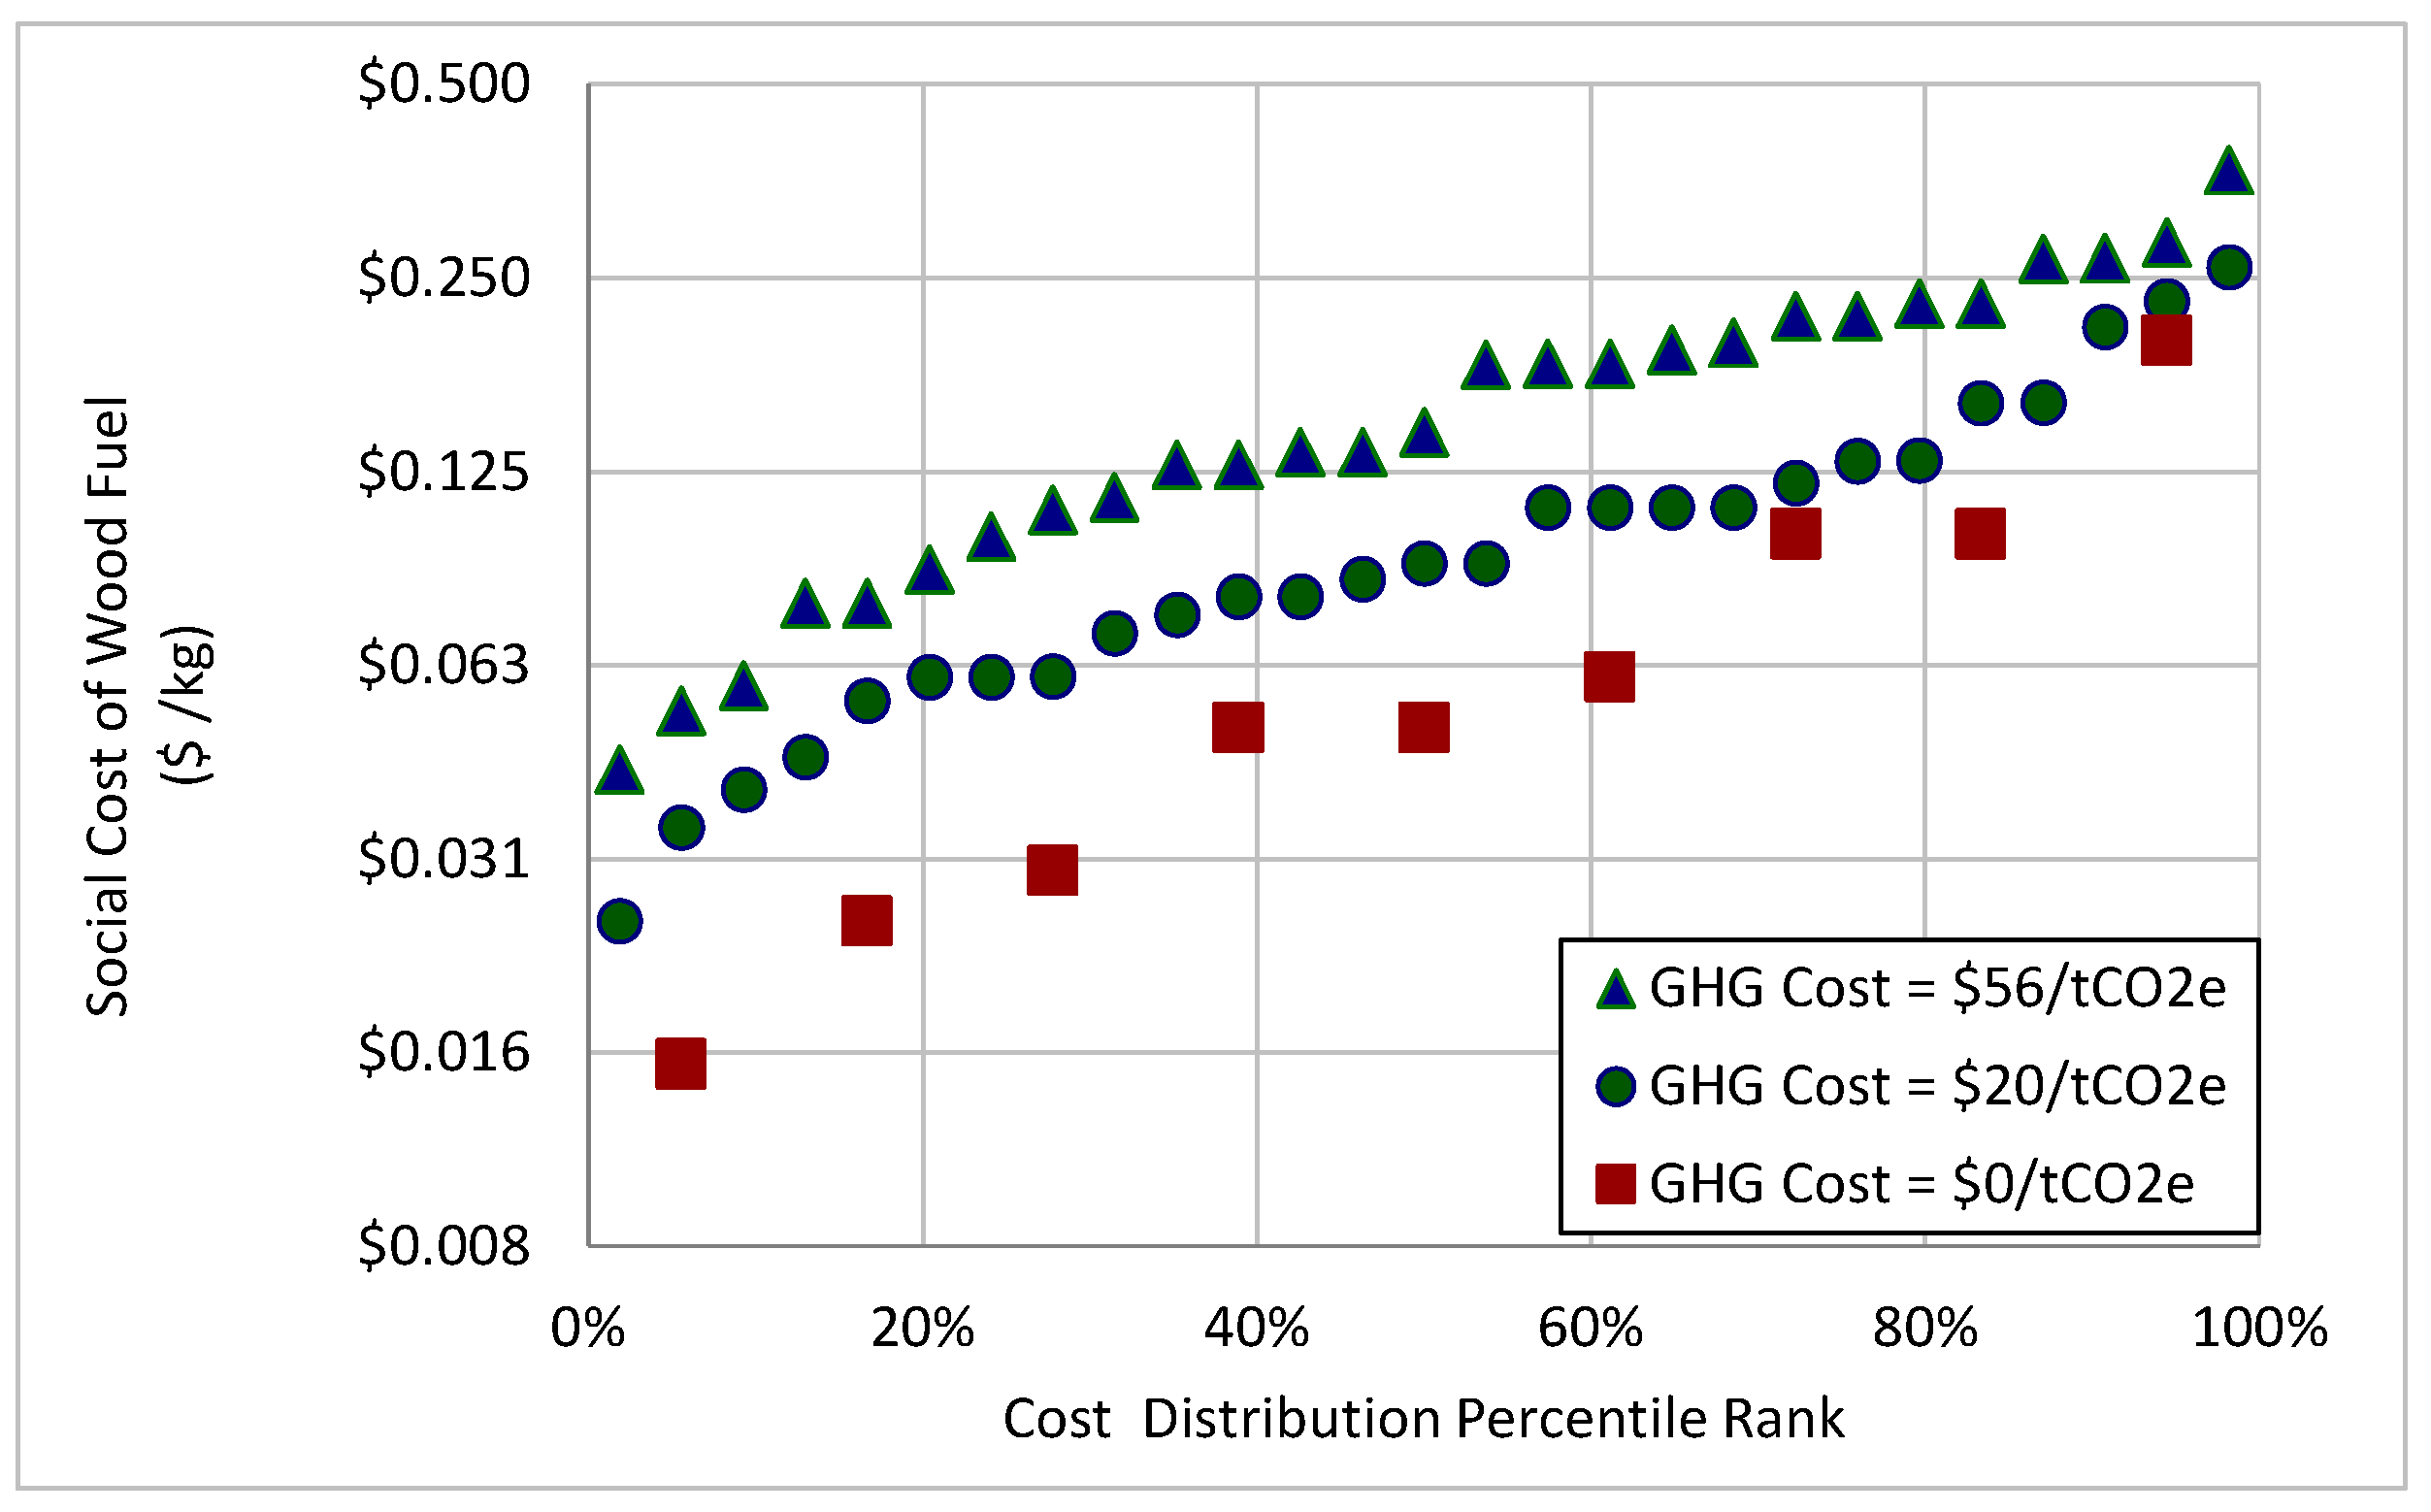
Figure 1 illustrates the distribution of wood costs that results from the opportunity cost model described above. Wood costs have a wide range from USD 0.016/kg to USD 0.37/kg. This study separately analyzes three components of this distribution that represent different ranges for different values of environmental costs: a low distribution with a wood cost ranging from USD 0.02/kg to USD 0.15/kg, a high wood cost distribution of USD 0.07/kg to USD 0.25/kg, and a middle wood cost distribution ranging from USD 0.05/kg to USD 0.17/kg. The three cost ranges are selected in this study to correspond to the different environmental impact values per kg of net CO
2-equivalent emissions arising from wood combustion as described in the caption of
Figure 1. Different clean energy development financing policy strategies may provide different valuations for climate benefits. The ranges overlap because of the variability in non-environmental costs, especially the time needed to collect wood and the opportunity cost of the labor used to collect wood.
2.1.2. LCOE for Solar Electric Cooking
The LCOE of a DDS solar electric system without a battery is primarily a function of solar panel capacity. This means that the equation for the LCOE of solar electricity used for cooking in a DDS system and sourced from a solar panel is:
where
LCOESEC_panel is the LCOE of solar electric cooking energy sourced from the solar panel in USD/kWh,
PSEC is the price of solar system in USD per watt,
Wp is the peak watt capacity of the solar system watts,
NPESS is the “net present energy” produced by one peak watt of solar system capacity in kWh,
Effutil is the “utilization efficiency” or the fraction of the solar system energy that is actually used by the household which is unitless, and
EffSEC is the efficiency of a solar electric cooker measured as the energy delivered to the food divided by the net energy input into the solar electric cooker by the solar system.
The
NPESS is a product of the annual solar resource [
35],
SPVPP, the uniform series present worth factor,
PWF, and a solar panel derating factor,
Fdgrade:
Details of the calculation of the “present worth factor” that characterizes the number of years over which an investment is economically amortized, and the “de-rating factor” that accounts for the decrease in output from a solar panel over time is provided in a online report: “A simplified method for calculating the levelized cost of energy (LCOE) using amortization factors” [
36]. We note that the present study takes the perspective of maximizing social welfare for customer households which tends to lead to a choice of lower discount rates in the calculation of the present worth factor.
For solar electricity sourced from a battery rather than a solar panel, we can calculate the battery storage component of the LCOE with an equation that is similar to Equation (2):
where
LCOESEC_battery is the LCOE of solar electric cooking energy sourced from the battery,
Pbattery is the incremental price of the battery,
Wh is the watt-hour capacity of the battery,
PWF is the present worth factor that converts the annual energy estimate in the denominator to a “net present energy” that represents the total energy produced by the battery over the system lifetime,
Effbatt_util is the “utilization efficiency” which is the utilized output energy of the battery subsystem per unit of battery capacity per day, and
EffSEC is the efficiency of a solar electric cooker that uses the battery electricity. Note that the total efficiency,
Effbatt_util ×
EffSEC, is measured as the energy delivered to the food divided by the total energy diverted from the solar panel to the battery-subsystem. This total efficiency accounts for energy losses from the solar panel to the battery, energy loss that occurs in the process of charging and discharging the battery, and energy that is lost as the electricity output of the battery is transferred to the food being cooked.
2.1.3. Definition and Rationale for a Marginal LCOE (MLCOE) Analysis
As noted in Equations (1), (2) and (4), the LCOE depends sensitively on the efficiency of energy utilization. Especially considering a variable solar resource that can change from day-to-day, the sizing of the SEC system greatly affects both the efficiency and reliability of an off-grid solar electric system [
37].
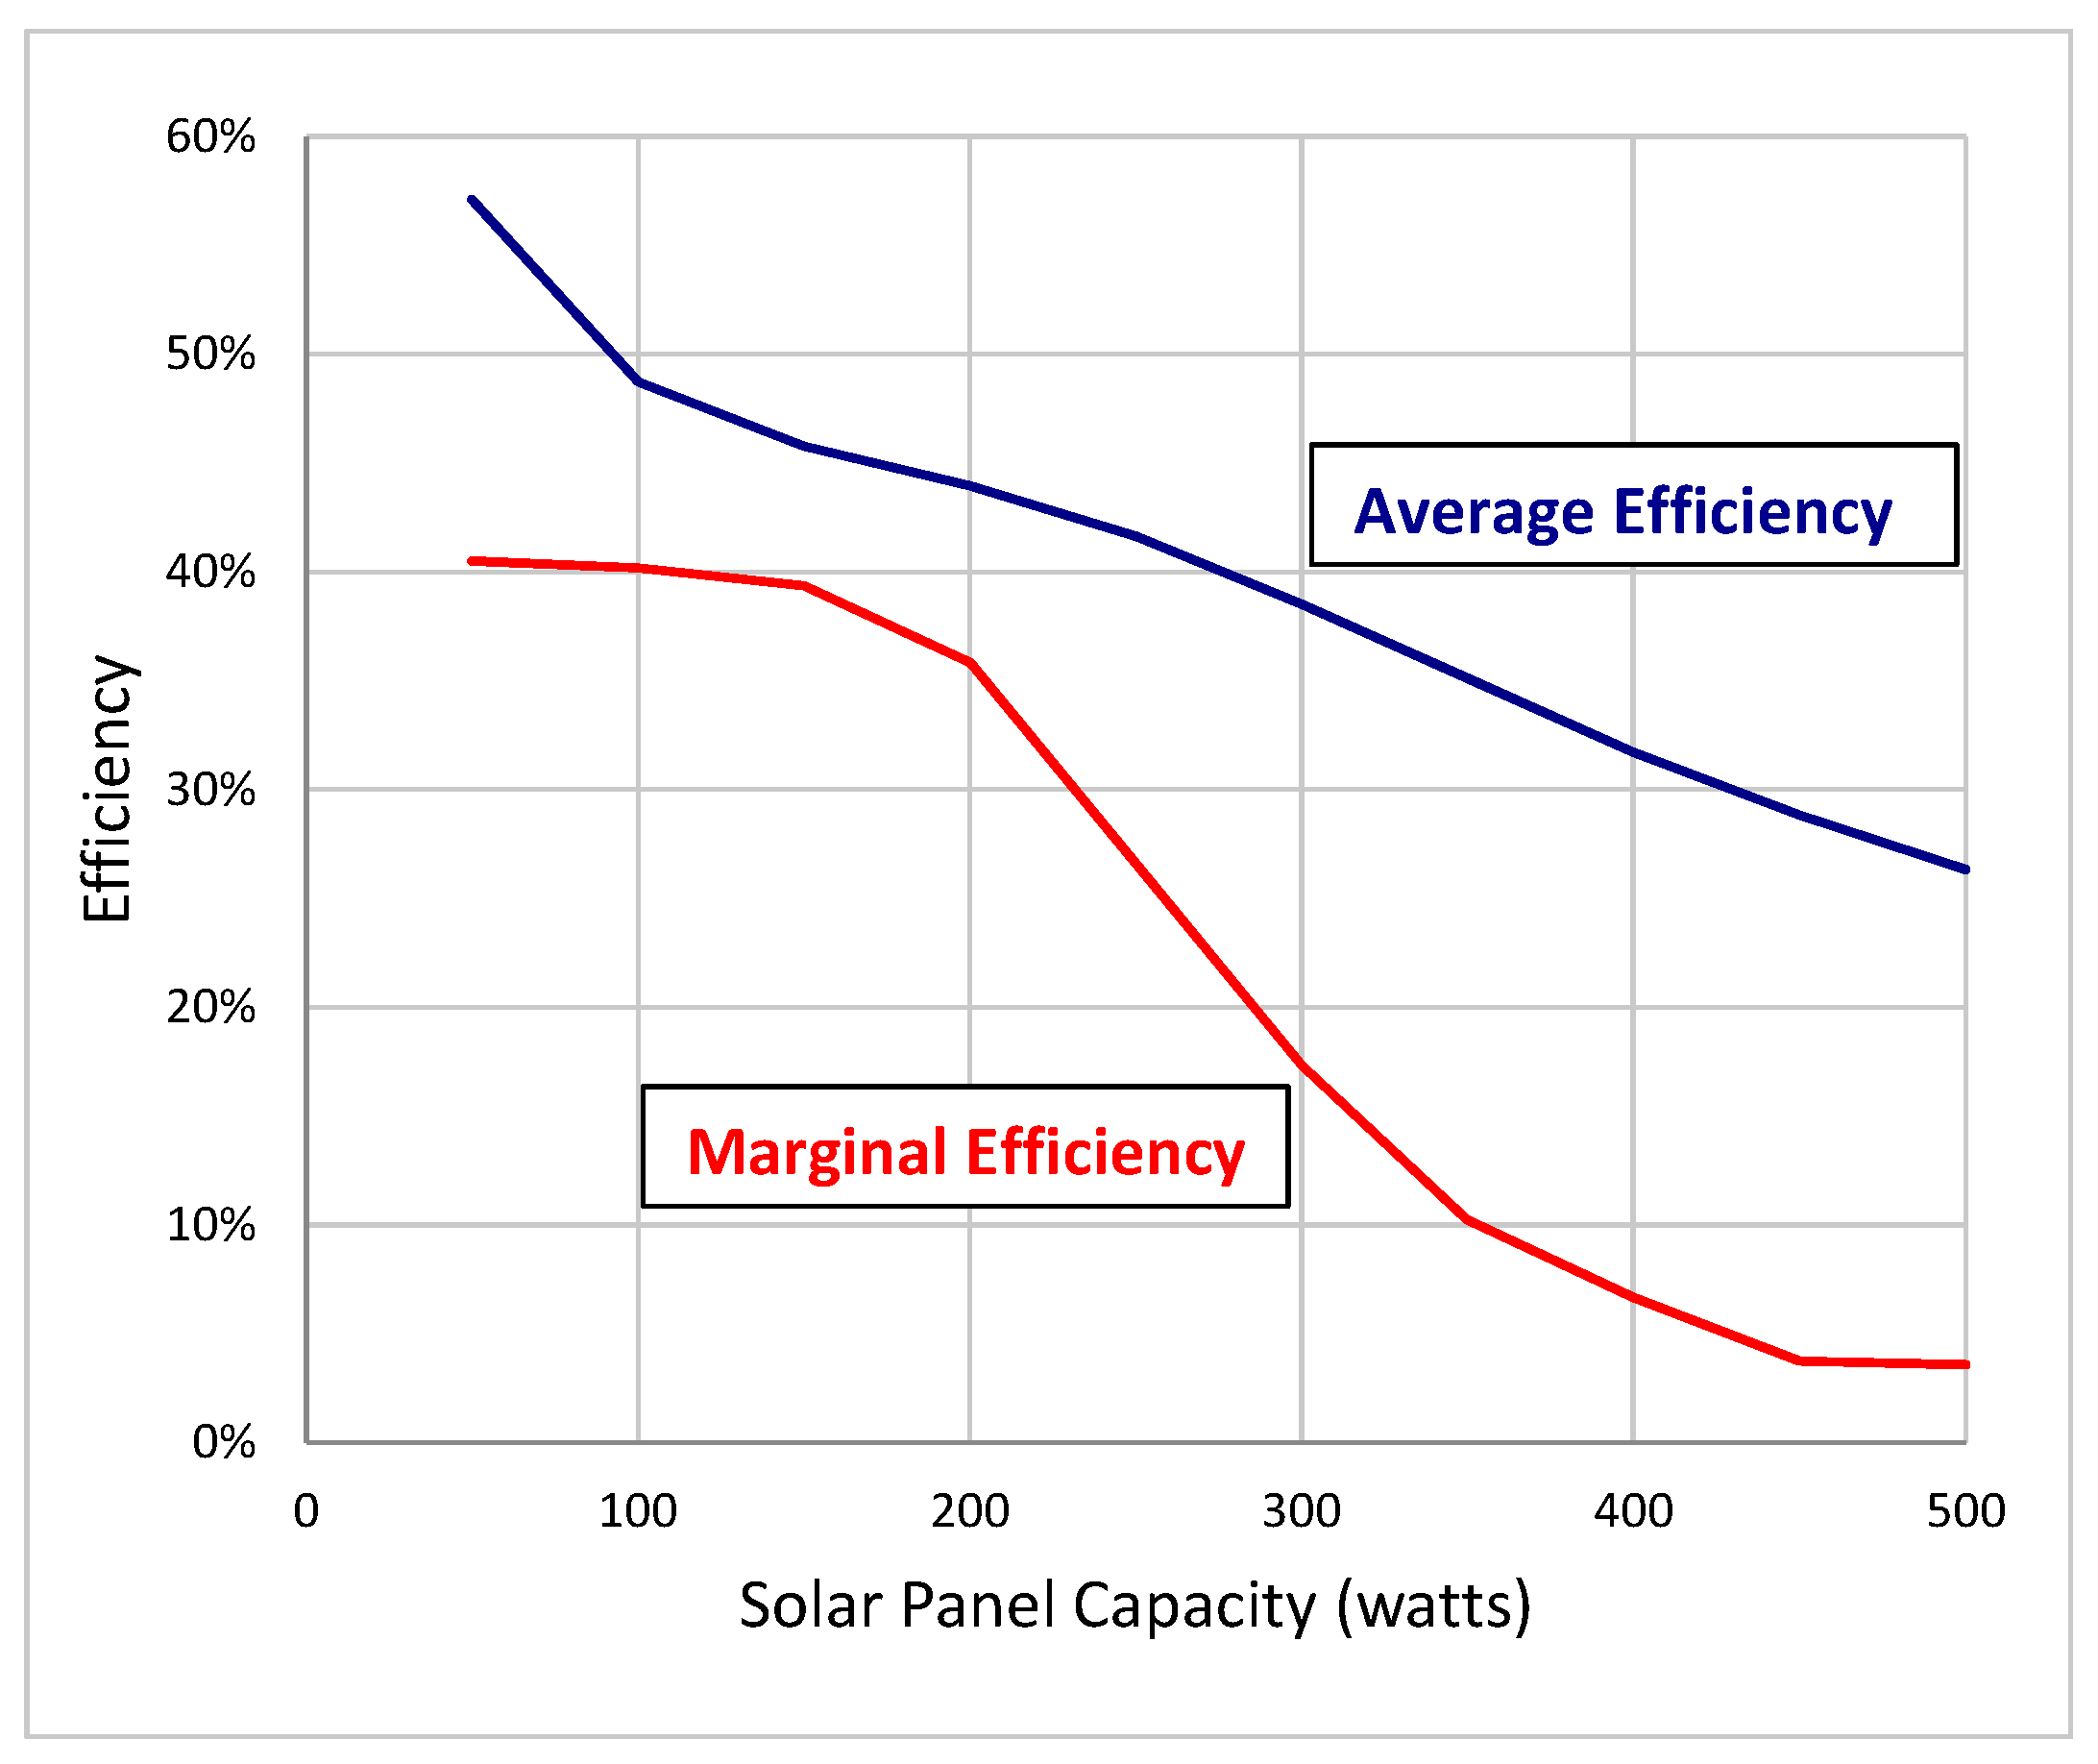
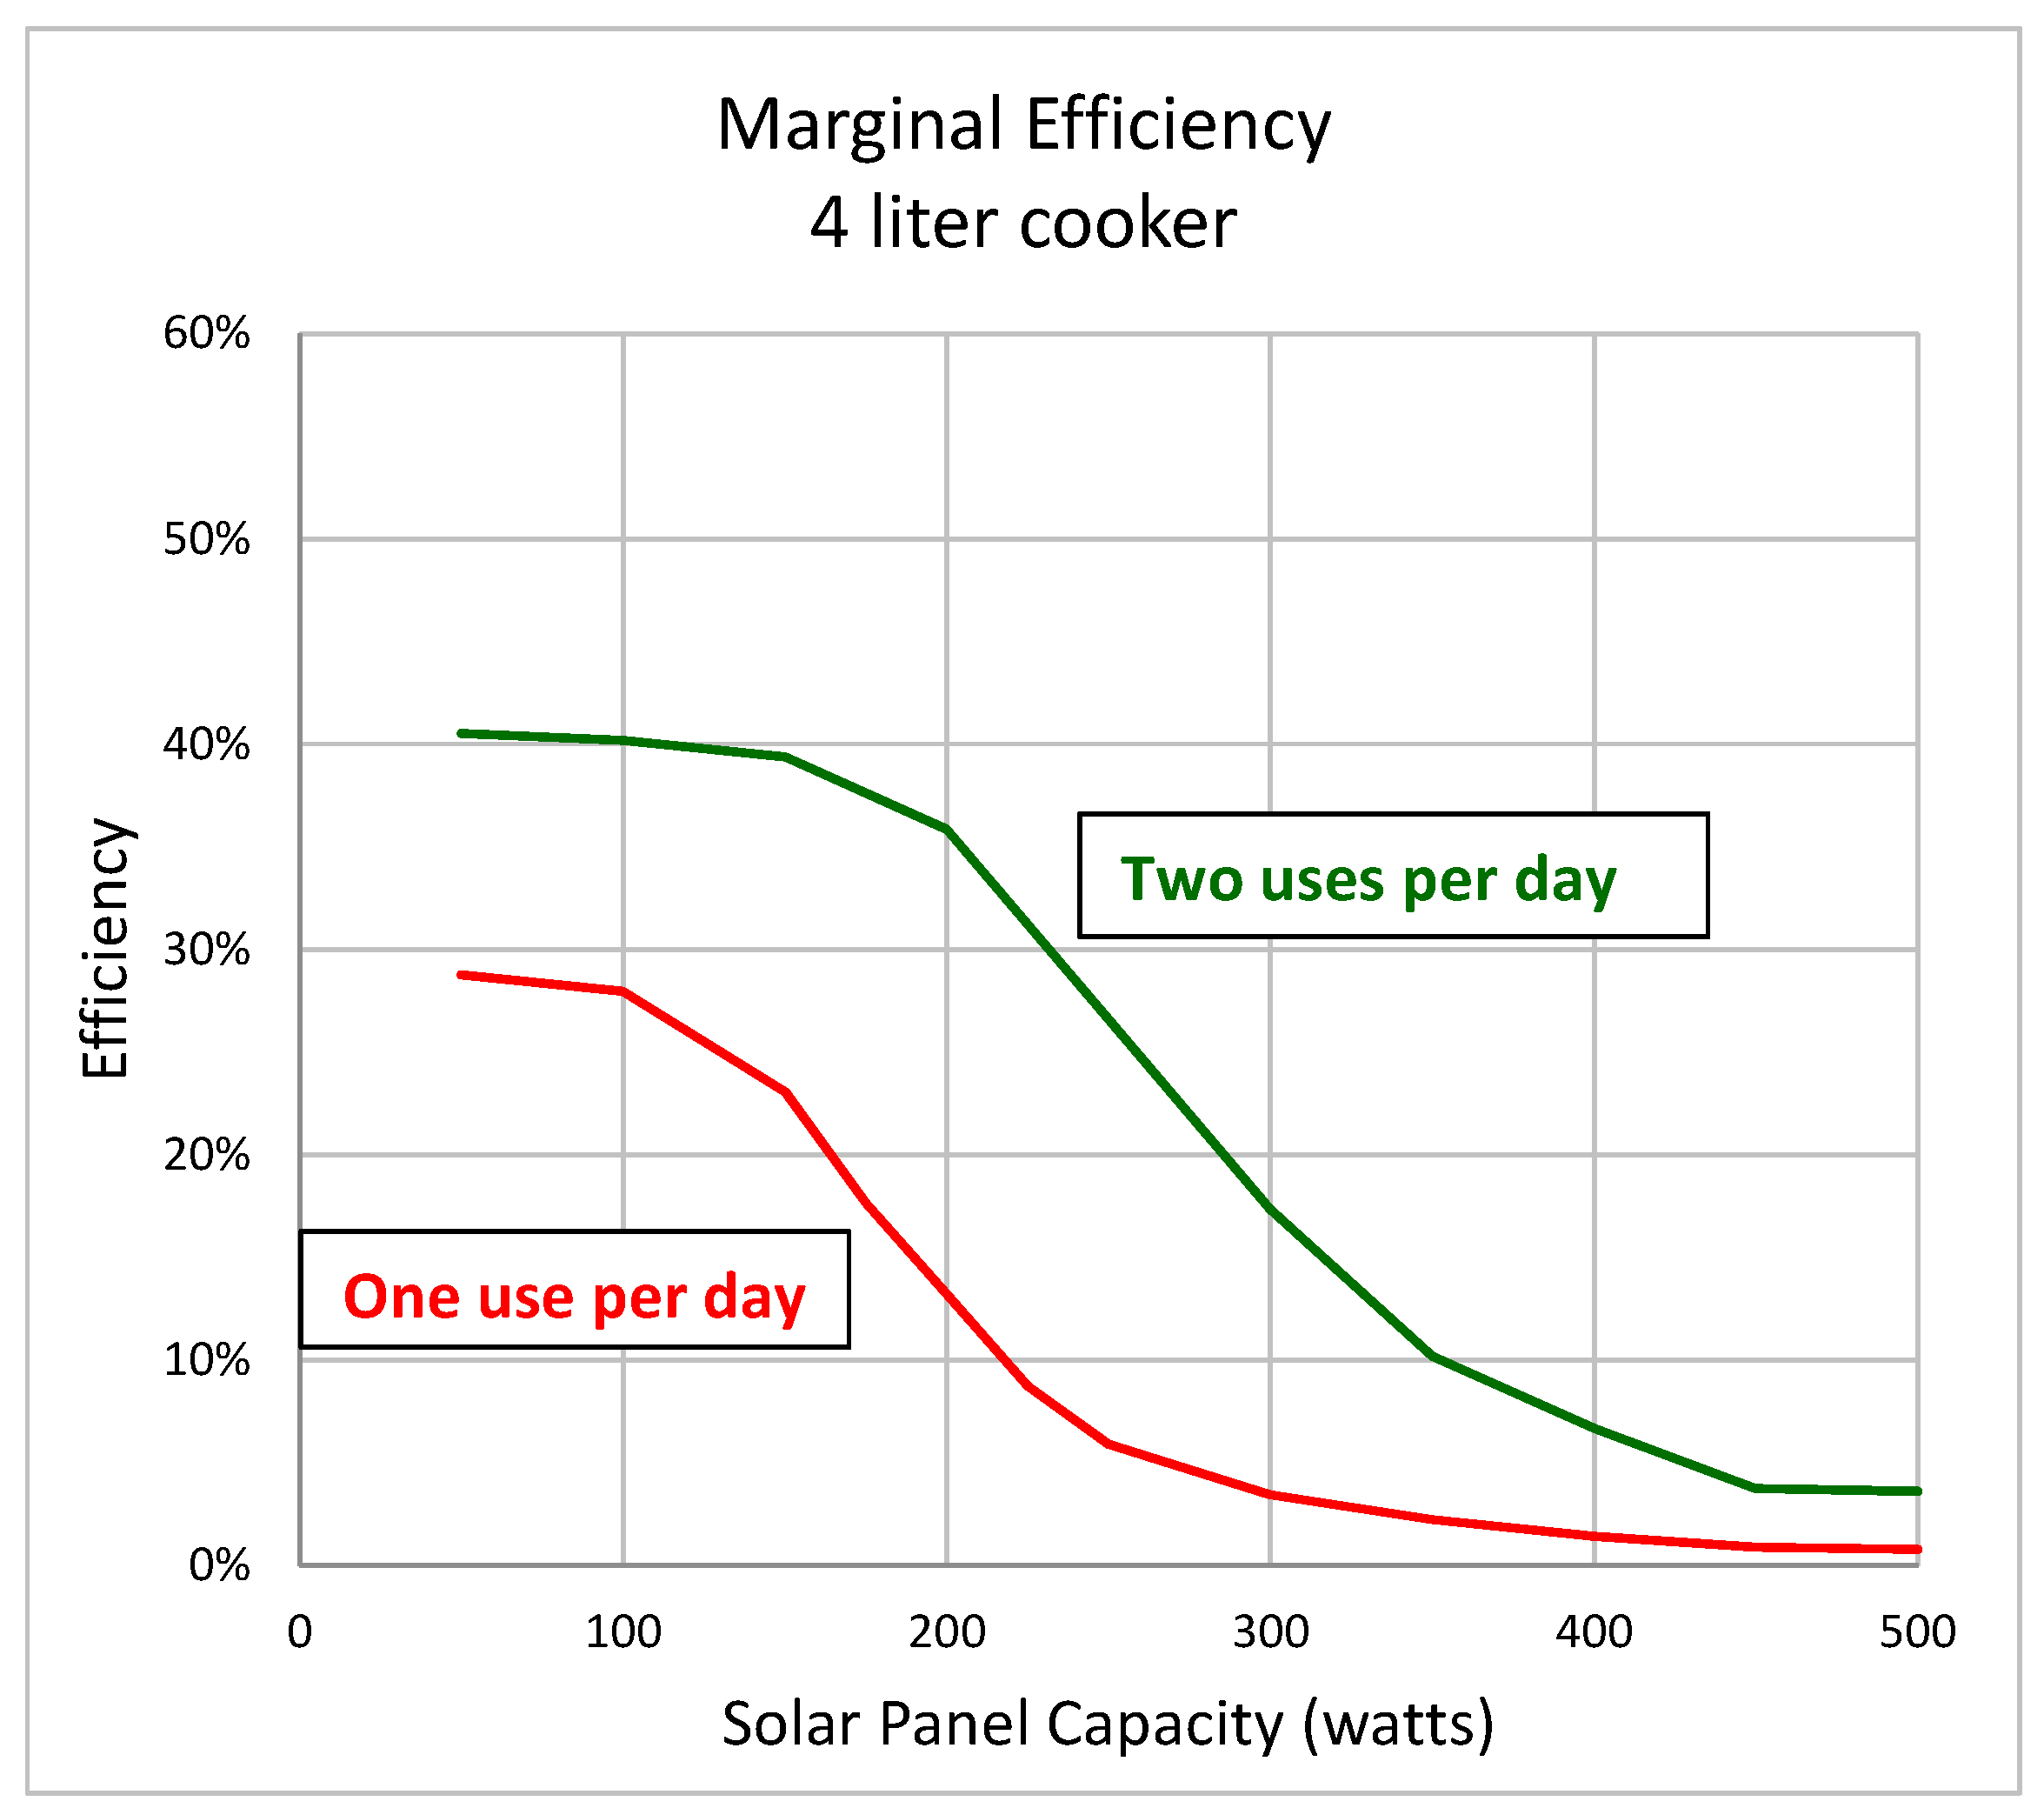
Figure 2 illustrates both the marginal and average efficiency of a DDS cooking system that is used to heat 4 L of water for cooking twice per day as detailed in
Section 3.2. Average efficiency is the ratio of the total energy delivered to food divided by the total potential output of the solar panel. Marginal efficiency is the incremental energy delivered to food divided by an incremental potential output of a solar panel for an incrementally larger solar panel.
While the efficiency decreases gradually with an increase in system capacity, there is a fairly dramatic decrease in marginal efficiency of the SEC system when the solar panel size is large relative to average cooking demand.
The data in
Figure 2 also illustrates how a fairly wide range of efficiencies are possible with off-grid solar electric cookers. A relatively small SEC system will tend to be utilized more fully—relative to capacity—than “over-sized” systems that are designed to reliably provide sufficient energy on cloudy days. This is because large capacity systems tend to have components that are that not fully utilized on sunny days Having capacity that is infrequently utilized increases the LCOE of high-reliability SEC systems that are designed to work well on cloudy days.
Thus, small-capacity, high-utilization SEC systems tend to produce lower LCOE electricity than larger, high-reliability systems that have substantial capacity that is only occasionally utilized.
Considering that utilization efficiency decreases with system capacity, then the optimum size of an SEC system occurs when the marginal LCOE from an increase in capacity is equal to the marginal benefit of wood savings (i.e., equal to the LCOE of WC). Increases in SEC system capacity beyond this point will result in incremental costs that exceed incremental benefits and will decrease the net benefits produced by the SEC system.
Therefore we focus on the marginal LCOE (MLCOE) which is calculated as the marginal cost of incremental consumption that is enabled by an increase in system capacity.
2.2. Selection of Solar Electric Cooker Technologies with Minimum MLCOE
Because wood fuel can be relatively inexpensive, discovering SEC technologies and systems that can compete with WC requires focusing on technologies that can provide very low-cost solar electric energy. Equations (2) and (3) show that this requires technologies that have a long lifetime (i.e., large PWF) and high efficiency.
2.2.1. DDS Cookers
Direct-use DC solar (DDS) electricity is defined as solar electricity that is output directly by a solar panel with little or no intervening electricity storage and with a minimum of electricity conversion and control infrastructure [
38]. In DDS systems, the primary cost of the solar electricity supply is the solar panel.
DDS cookers have been field tested in rural Malawi [
39] where approximately one third of customers operated the cookers more than once every two days, with some subset of those customers using the cooker twice per day. Efforts are currently underway to selectively distribute DDS cookers to high utilization customers and incrementally increase the capacity of the DDS systems over time based on customer system utilization.
2.2.2. LTO Battery-Powered SEC
For extremely low-cost DDS cookers to be effective, users must have the flexibility and patience to consistently utilize the cooker even though the output of the cooker can vary from day-to-day with variations in the solar resource. If a portion of the electricity in a DDS SEC system is used to charge a lithium titanate (LTO) battery, then that electricity becomes available for cooking applications during any time of day. LTO is a new battery technology that can discharge rapidly, cycle several times per day, and still theoretically last 10 years or more [
40].
This study focuses on LTO battery technology because it can have five to ten times of the cycle life of other lithium chemistries, and because batteries are usually not properly disposed of in much of SSA. Thus, LTO has the potential to generate much less e-waste over the long term than other battery chemistries when e-waste is measured as battery waste mass per unit of energy cycled through the battery over the battery lifetime.
If battery-regulated electricity is used with an electric pressure cooker (EPC), then it is possible to cook a meal using less than 250 Wh [
22], which is small compared with the typical total daily energy produced by a DDS SEC system.
Thus, if one adds an LTO battery to a DDS SEC system, it becomes possible to cook one to several meals per day with on-demand regulated electricity in addition to heating water and/or cooking food in the DDS cooker. The LTO battery can discharge to any type of electric cooker including an electric pressure cooker (EPC). The question that we address in this study is: What is the MLCOE of the LTO-mediated electricity that is used to operate the on-demand cooking appliances?
Note that the battery subsystem of the DDS LTO SEC obtains its input electricity from two sources. One source is electricity that is diverted from the DDS cooker to the battery that is no longer available to the DDS cooker. The second electricity source for the battery subsystem is electricity from the solar panel that is not utilized by the DDS cooker. The marginal investment cost of the unutilized solar panel electricity is zero because no additional solar panel capacity need be purchased to provide the electricity. Thus, the incremental cost of the LTO battery system incremental output results from only the marginal investment needed for the battery when the LTO battery is added to an existing DDS system.
Meanwhile, the source electricity that is diverted from the DDS cooker has a source cost which is the marginal cost of the DDS cooker electricity. This study takes the conservative approach of analyzing the MLCOE of LTO electricity in terms of amortizing incremental electricity supply costs with respect to net newly utilized electricity output of the solar panel that is enabled by the battery subsystem. If the design parameters of the LTO DDS cooker system are properly optimized to compete with WC costs, then both the solar panel and the battery will be each sized such that all marginal costs are equal: MLCOEDDS = MLCOELTO = MLCOEWC.
2.3. Estimating DDS Marginal Cooker Efficiency
For this study, a heat balance simulation model was developed to estimate the efficiency of DDS SEC systems under a variety of conditions and user behavior. The online report: “A model-based methodology for estimating the efficiency of a diode-based solar electric cooker” details the efficiency estimation model and calculations [
41].
2.4. Characterizing MLCOE Variability and Uncertainty
A key difficulty in comparing the MLCOE of different, competing energy technologies is that the MLCOE of different technologies can vary by large factors depending on variations in input costs and parameters. To address this innate variability and uncertainty in MLCOE, we compare the full distribution of the estimated cost between cooking energy technologies rather than comparing single point values. By characterizing the full distribution of potential costs, we gain insights into which input cost parameters can be used or modified to create cost innovations that can help make clean energy technologies more cost-competitive relative to WC.
2.4.1. Creating a Matrix of MLCOE Inputs
This study constructs the cost distribution by first characterizing the variability of the cost function inputs in Equations (1), (2) and (4) above. For example, the MLCOE cost equation for WC energy has three key inputs into the cost equation: (a) the local market or total cost (i.e., opportunity cost + environmental cost) of wood in units of USD/kg, (b) the energy intensity of wood fuel, and (c) the thermal efficiency of wood cooking. Each of these three inputs can vary by a wide margin depending on local conditions. The local market cost of wood varies by the nature of supply, population density, and cost of labor. The energy intensity of wood can vary by the type of wood and wood water content (i.e., how green the wood is). The thermal efficiency of wood cooking can vary depending on cooking behaviors (i.e., is the fire large relative to the cookpot size) and the degree to which household use improved cook stoves.
We construct the input cost matrix by picking three different possible values for each cost equation input: (A) a “high” value of an input parameter that is meant to represent values that are in the 84th percentile of the potential distribution of values (i.e., one standard deviation above the mean for a normal distribution), (B) a medium value that represents the median of potential values, and (C) a low value which represents the 16th percentile value of a distribution of inputs. All three parameters are assumed to be independent, and thus all combinations of values are explored, leading to 3 × 3 × 3 = 27 output values.
2.4.2. Construction and Comparison of MLCOE Distributions
After creating a matrix of input values for MLCOE inputs, we assume each set of three values are statistically independent, and then calculate the MLCOE for each combination of cost input values. The statistical independence assumption is valid if the correlation between cost input parameters is weak across SSA.
Given the set of MLCOE results from each combination of input values, we rank order the MLCOE values assuming that each value has equal probability in the MLCOE distribution. This rank ordering produces a cumulative distribution of potential MLCOE values, given the range of values defined by the matrix of input values.
3. Results
3.1. MLCOE Distributions for Wood Cooking
Relatively small changes in the input parameters of the MLCOE equation for WC can lead to very substantial changes in the distribution of WC costs. Therefore, in evaluating WC MLCOE distributions the analysis defines three cost scenarios, a high WC cost case, a low WC cost case, and a medium WC cost case. It is especially true that the total cost of wood collection varies widely across SSA, so rather than modeling a full distribution of input wood costs, the wood fuel costs are analyzed separately in these three ranges.
Table 2 presents the input parameters for the high WC cost case. In this case, the thermal efficiency of cookers is low (i.e., households are not using improved efficiency stoves), the opportunity cost plus environmental cost of wood is relatively high, and the heat content of the fuel is low which happens when people use wood that is not thoroughly dry or cook with low quality fuels such as dried dung.
Table 3 presents the input parameters for the low WC cost case. In this case, the thermal efficiency of cookers is high (i.e., many households are using improved efficiency stoves), the opportunity cost of wood is relatively low (with no accounting for climate costs) which corresponds to the case of readily available fuel supplies and sustainable wood fuel harvesting, and the heat content of the fuel is high which happens when people use wood that is thoroughly dry and of high quality.
Table 4 presents the input parameters for the medium WC cost case. In this case, the thermal efficiency of cookers corresponds to the standard efficiency range from 10% to 20%, and the cost of wood corresponds to a middle range of the estimated value of labor needed to collect and manage the fuel wood. The environmental cost assigned to wood consumption is equivalent to a moderately high carbon offset price (i.e., USD 20/tCO
2e) for cookstove project emissions reductions sold in voluntary carbon markets. This wood fuel cost range also corresponds to the approximate global price range for wholesale supply of bulk wood fuel, wood chips, and wood pellets. This middle WC MLCOE case also corresponds to the medium heat content case where the fuel is reasonably high quality, i.e., reasonably dry but not bone dry.
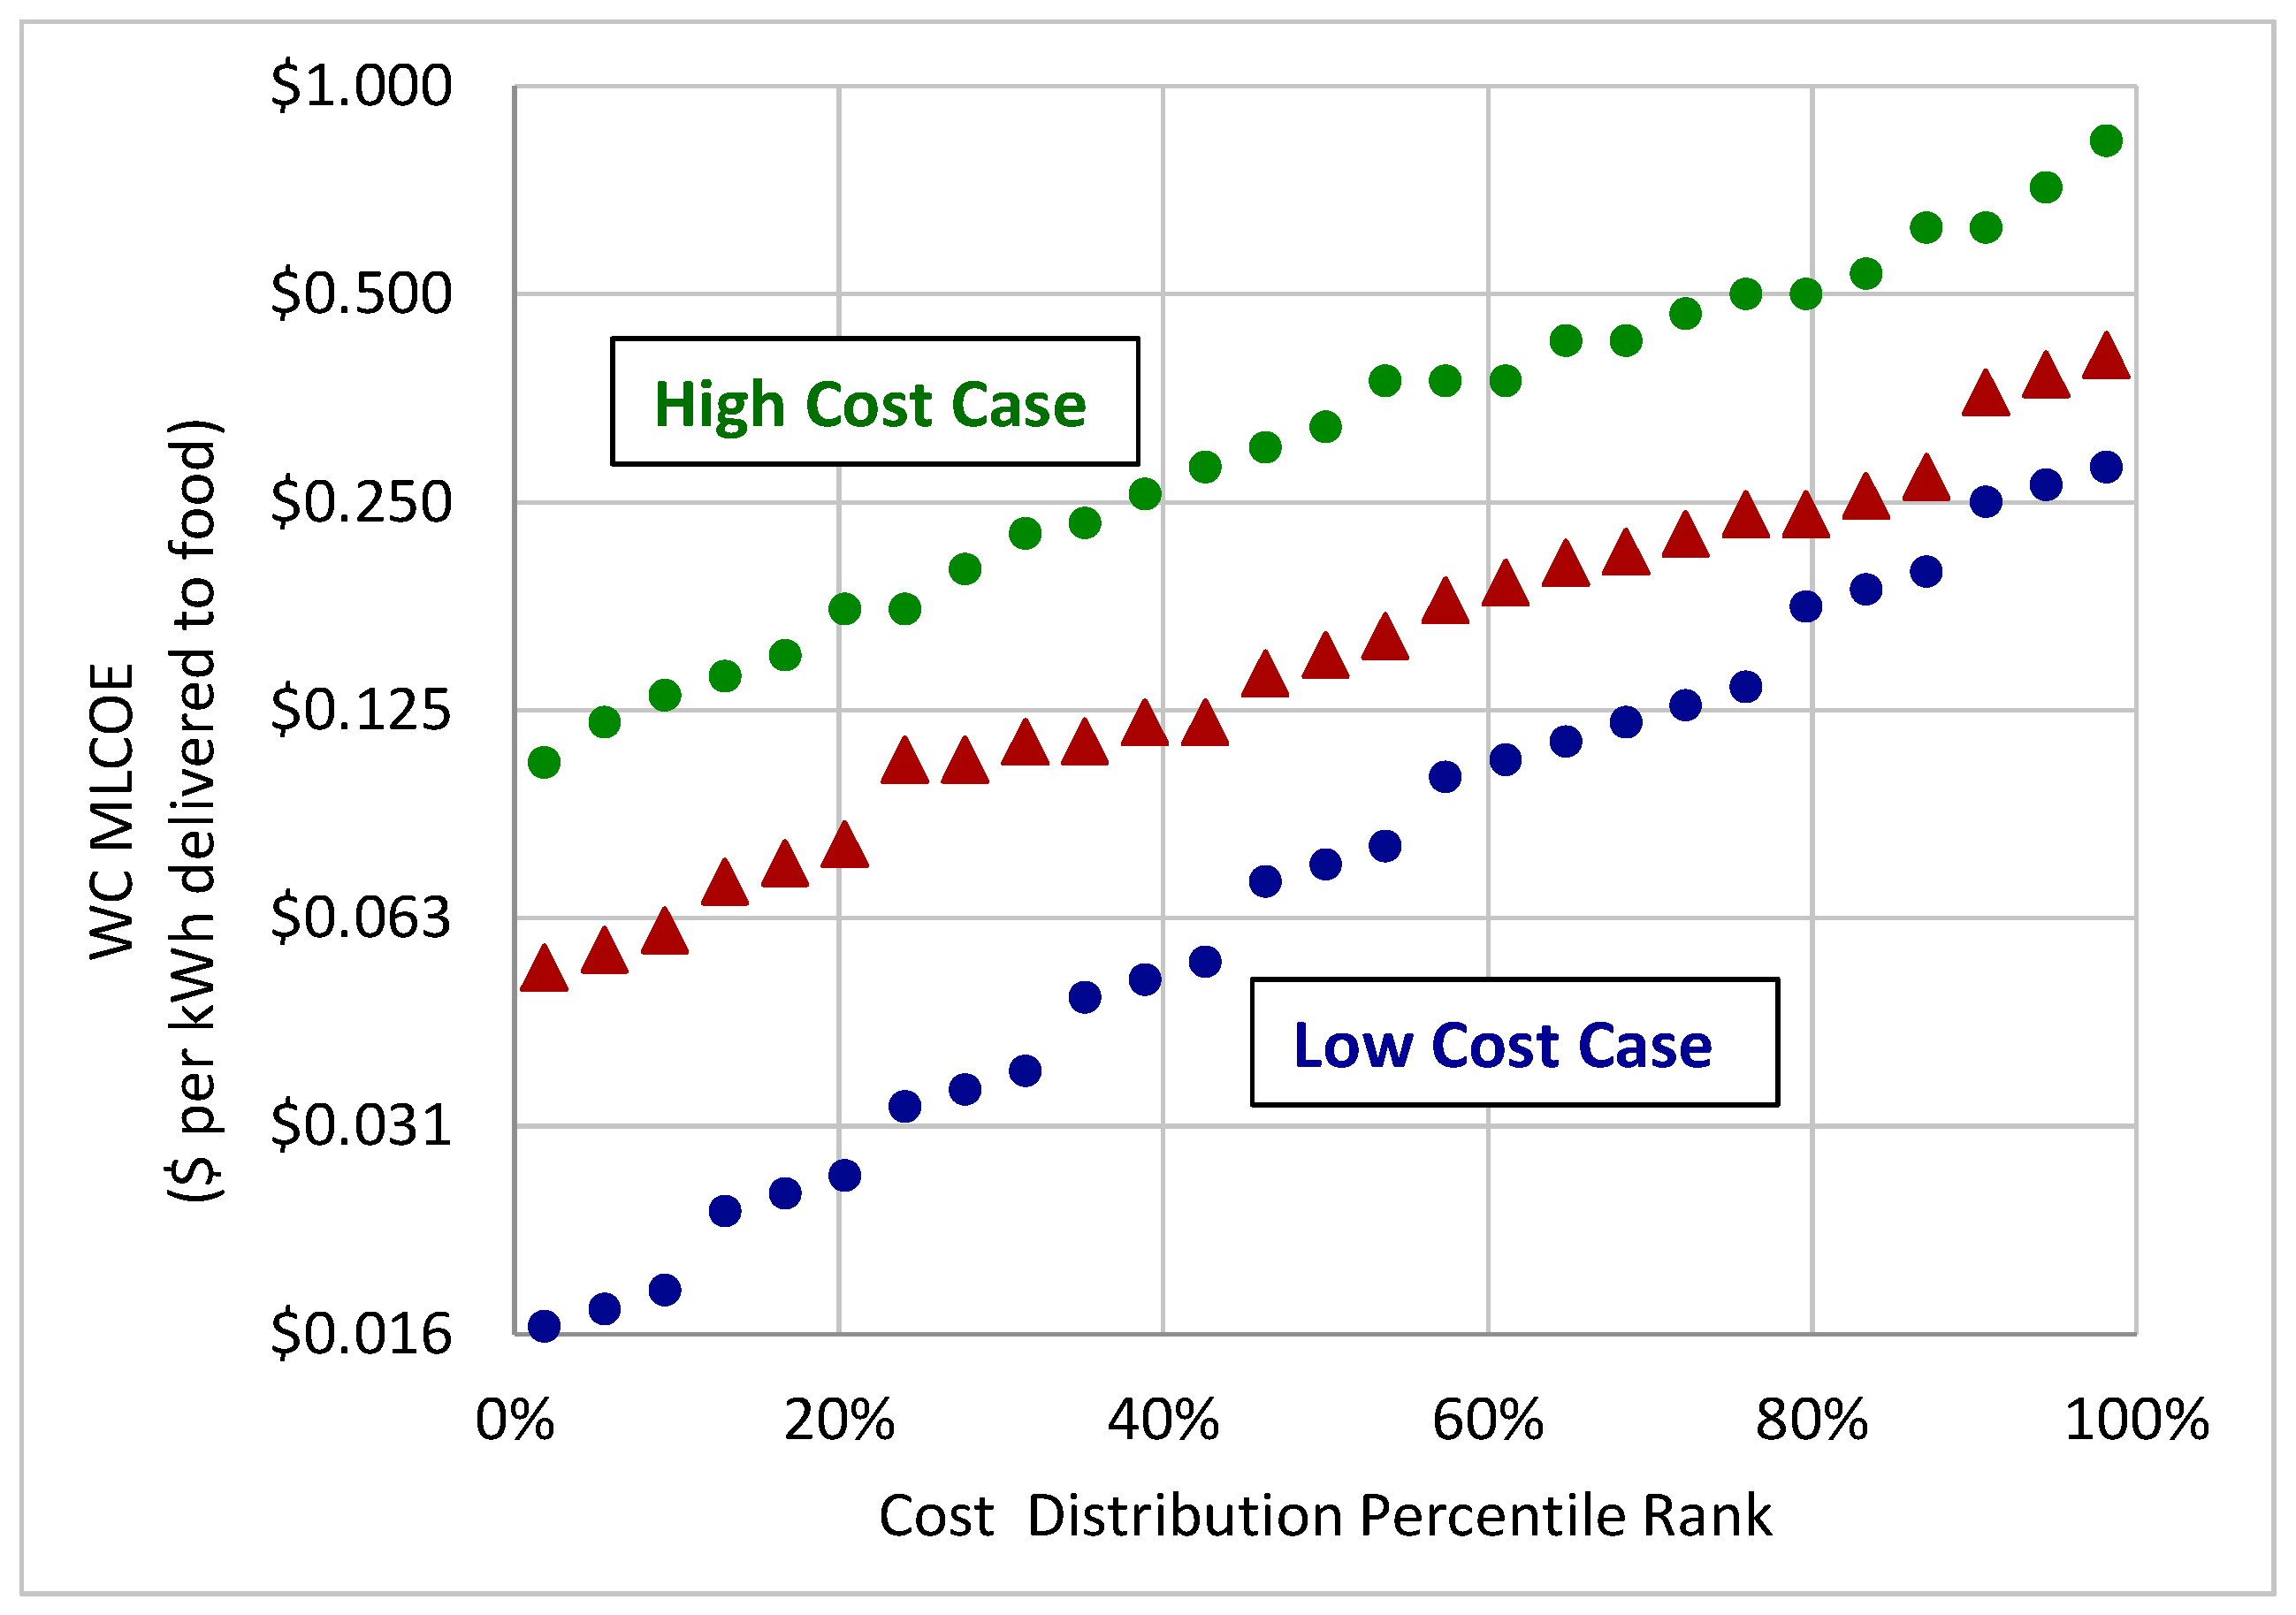
Figure 3 illustrates the distributions for WC cost in units of USD per kWh of energy delivered to food for the three different cost cases. The high cost case occurs where existing cooking practices are very inefficient and where fuel costs are high because the full environmental impact of fuel use is included. In that case, when the cost of electrical energy delivered to food is in a price range from USD 0.105 to USD 0.83 per kWh, then electricity can compete with wood cooking on a cost basis. However, in the low cost case, solar electricity needs to have a MLCOE of less than USD 0.28/kWh to compete with wood fuel at all. Because the estimated median MLCOE of WC is USD 0.15/kWh, SEC MLCOE needs to be less than this value to be cost-competitive for more than half of the WC cost-parameter scenarios.
3.2. Efficiency Estimates for Solar Electric Cooking
One of the most important input parameters for calculating the MLCOE for SEC is the marginal efficiency of solar panel utilization. If the solar system capacity is not fully utilized, then the system costs associated with that under-utilized capacity is amortized over a relatively small number of kWhs. This can make the per-kWh cost of the electricity relatively expensive. For a low-cost DDS SEC system, the solar panel costs are the key system capacity cost.
The details of the method for calculating system efficiency are provided in Ref. [
41]. In summary, a heat balance model is formulated for a DDS cooker. In the heat balance model, the energy input to the DDS cooker is tracked as it flows to the cooker heating element, and then to the food or water contained within the cooker with some energy being lost to the environment. Energy losses come in two forms, one form of loss occurs as heat flows from the heating element to the sides of the cooker, and the other form of loss arises from evaporation that occurs when the food or water in the cooker is near boiling temperature. The amount of energy that flows to the cooker or water in the cooker is then compared with the total energy input from the solar panel to estimate the efficiency. This calculation is performed for two solar panel capacities that are slightly different. The difference in energy use and energy consumption between the two simulations with different system capacities is used to calculate the incremental efficiency of utilization that comes from a small increase in system capacity, where marginal efficiency is the incremental increase in energy to food or water divided by the incremental output increase from having a larger solar panel.
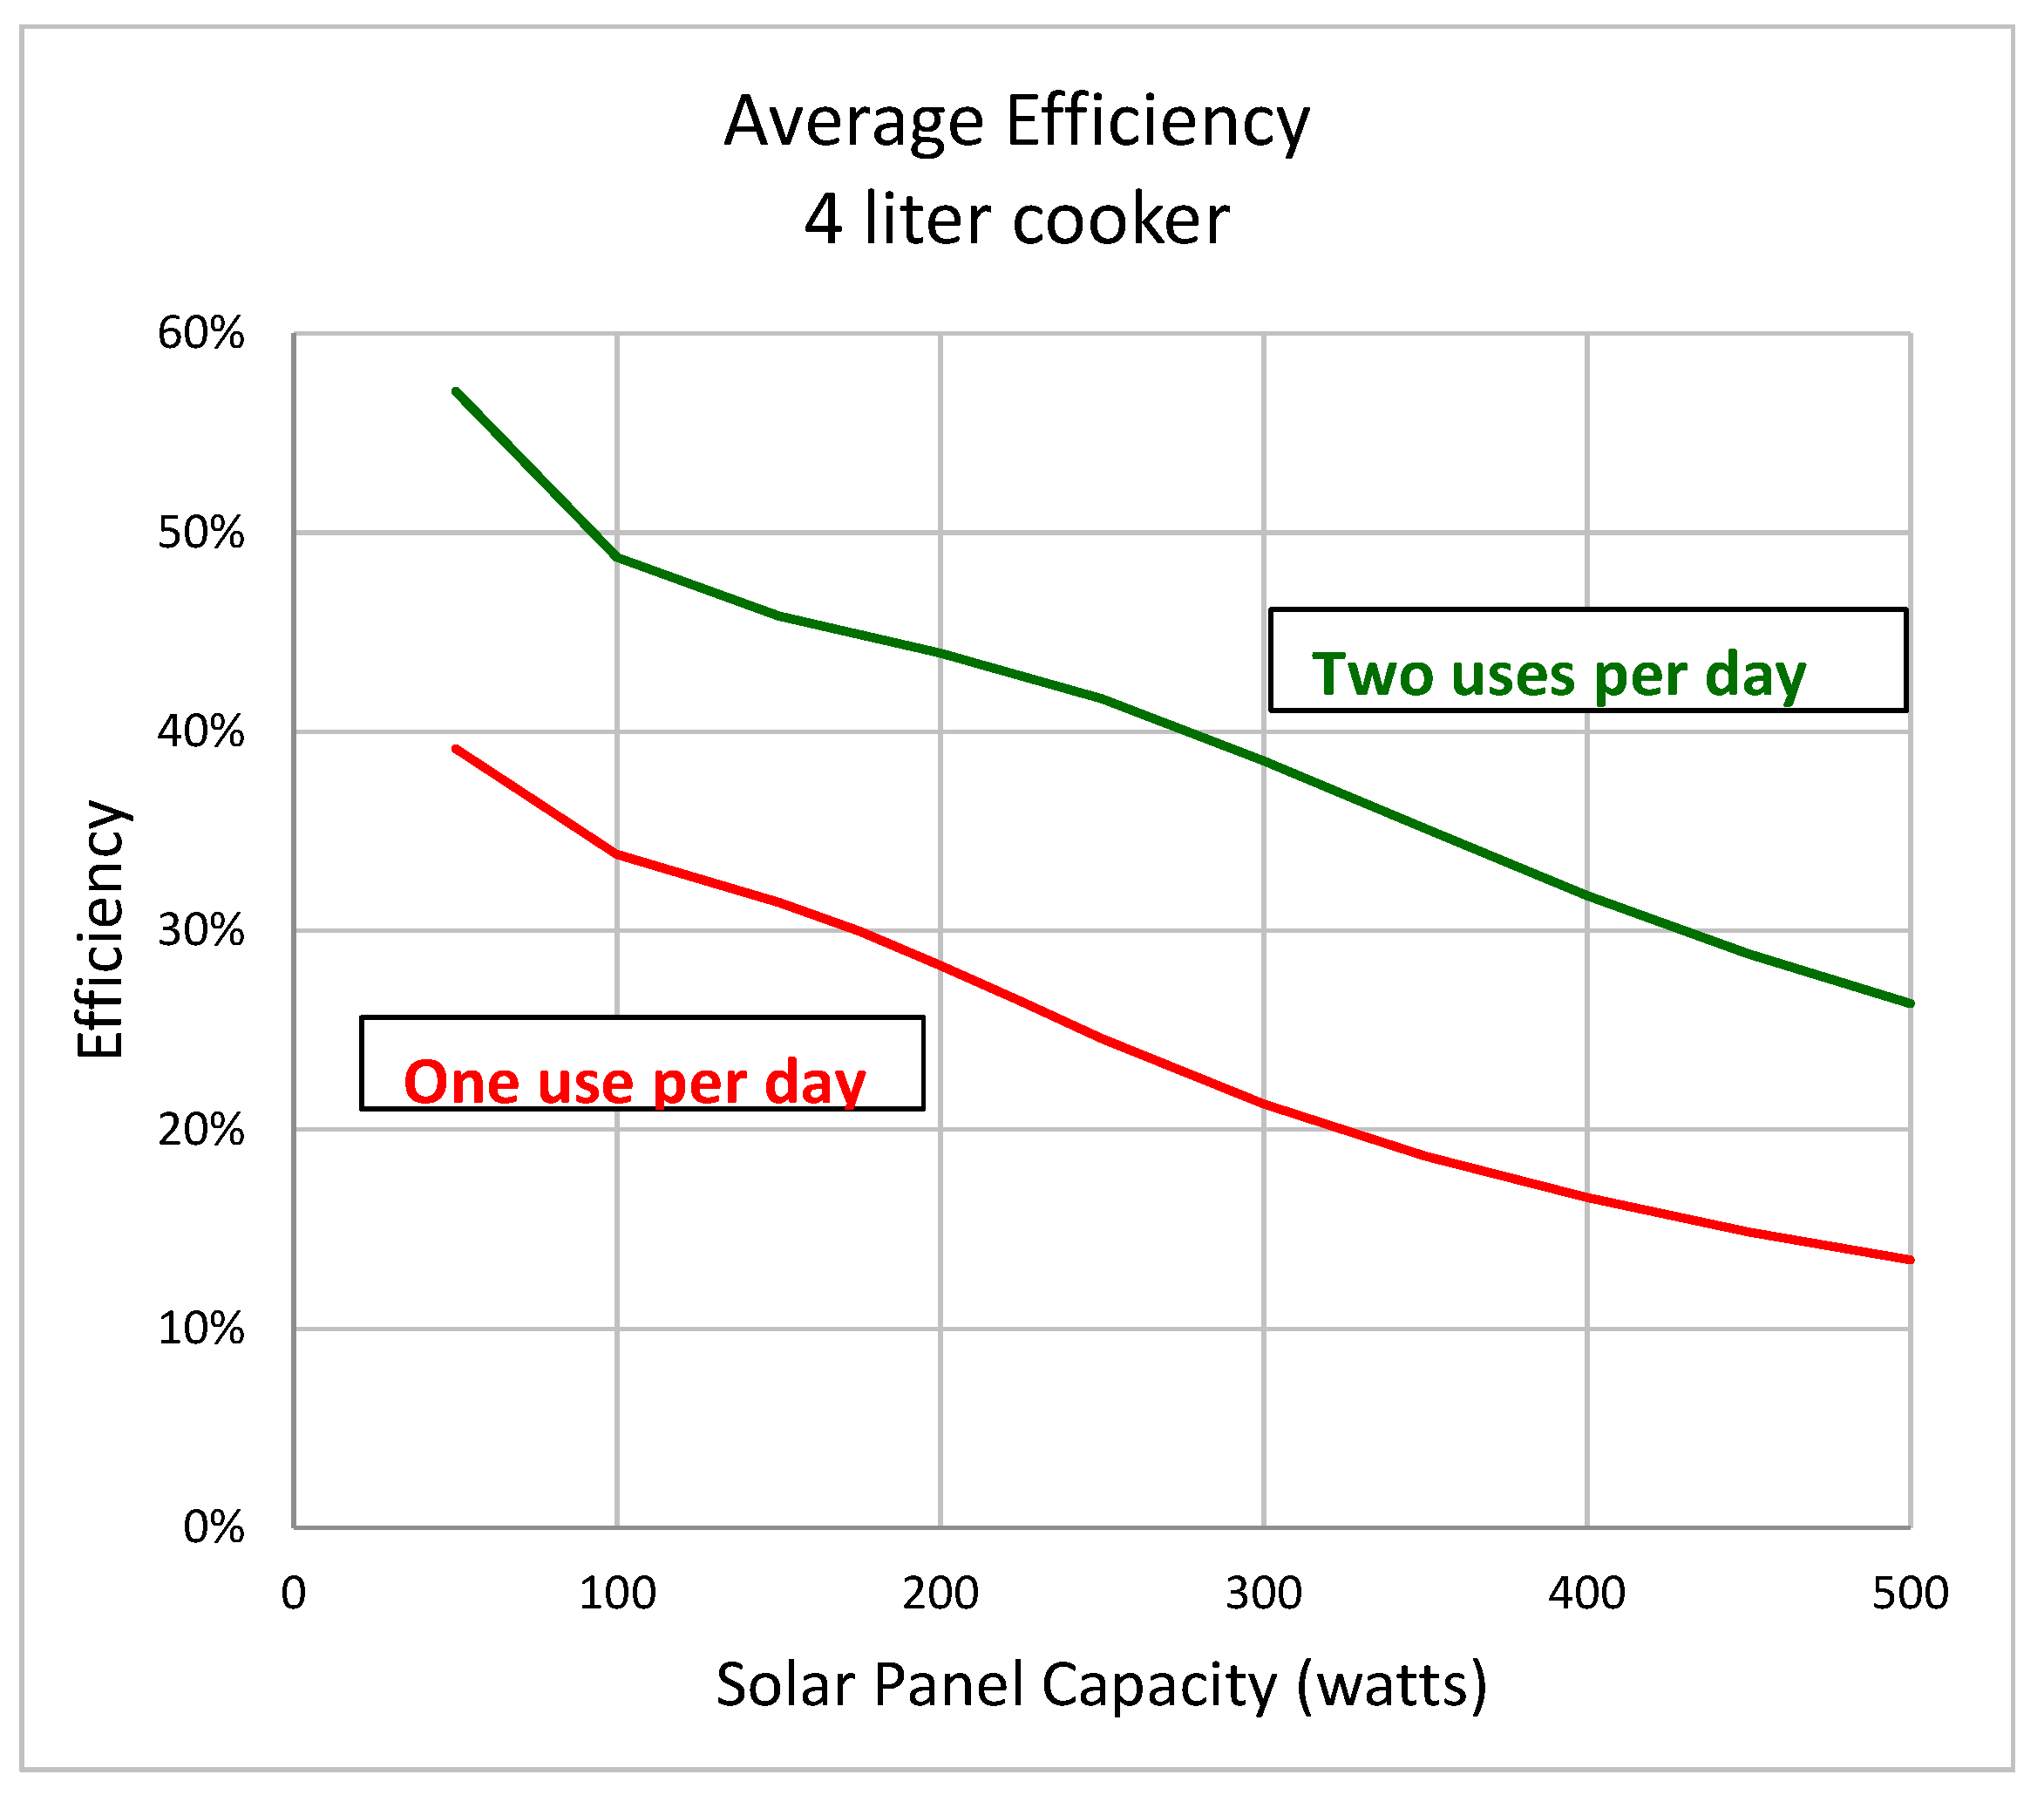
Figure 4 and
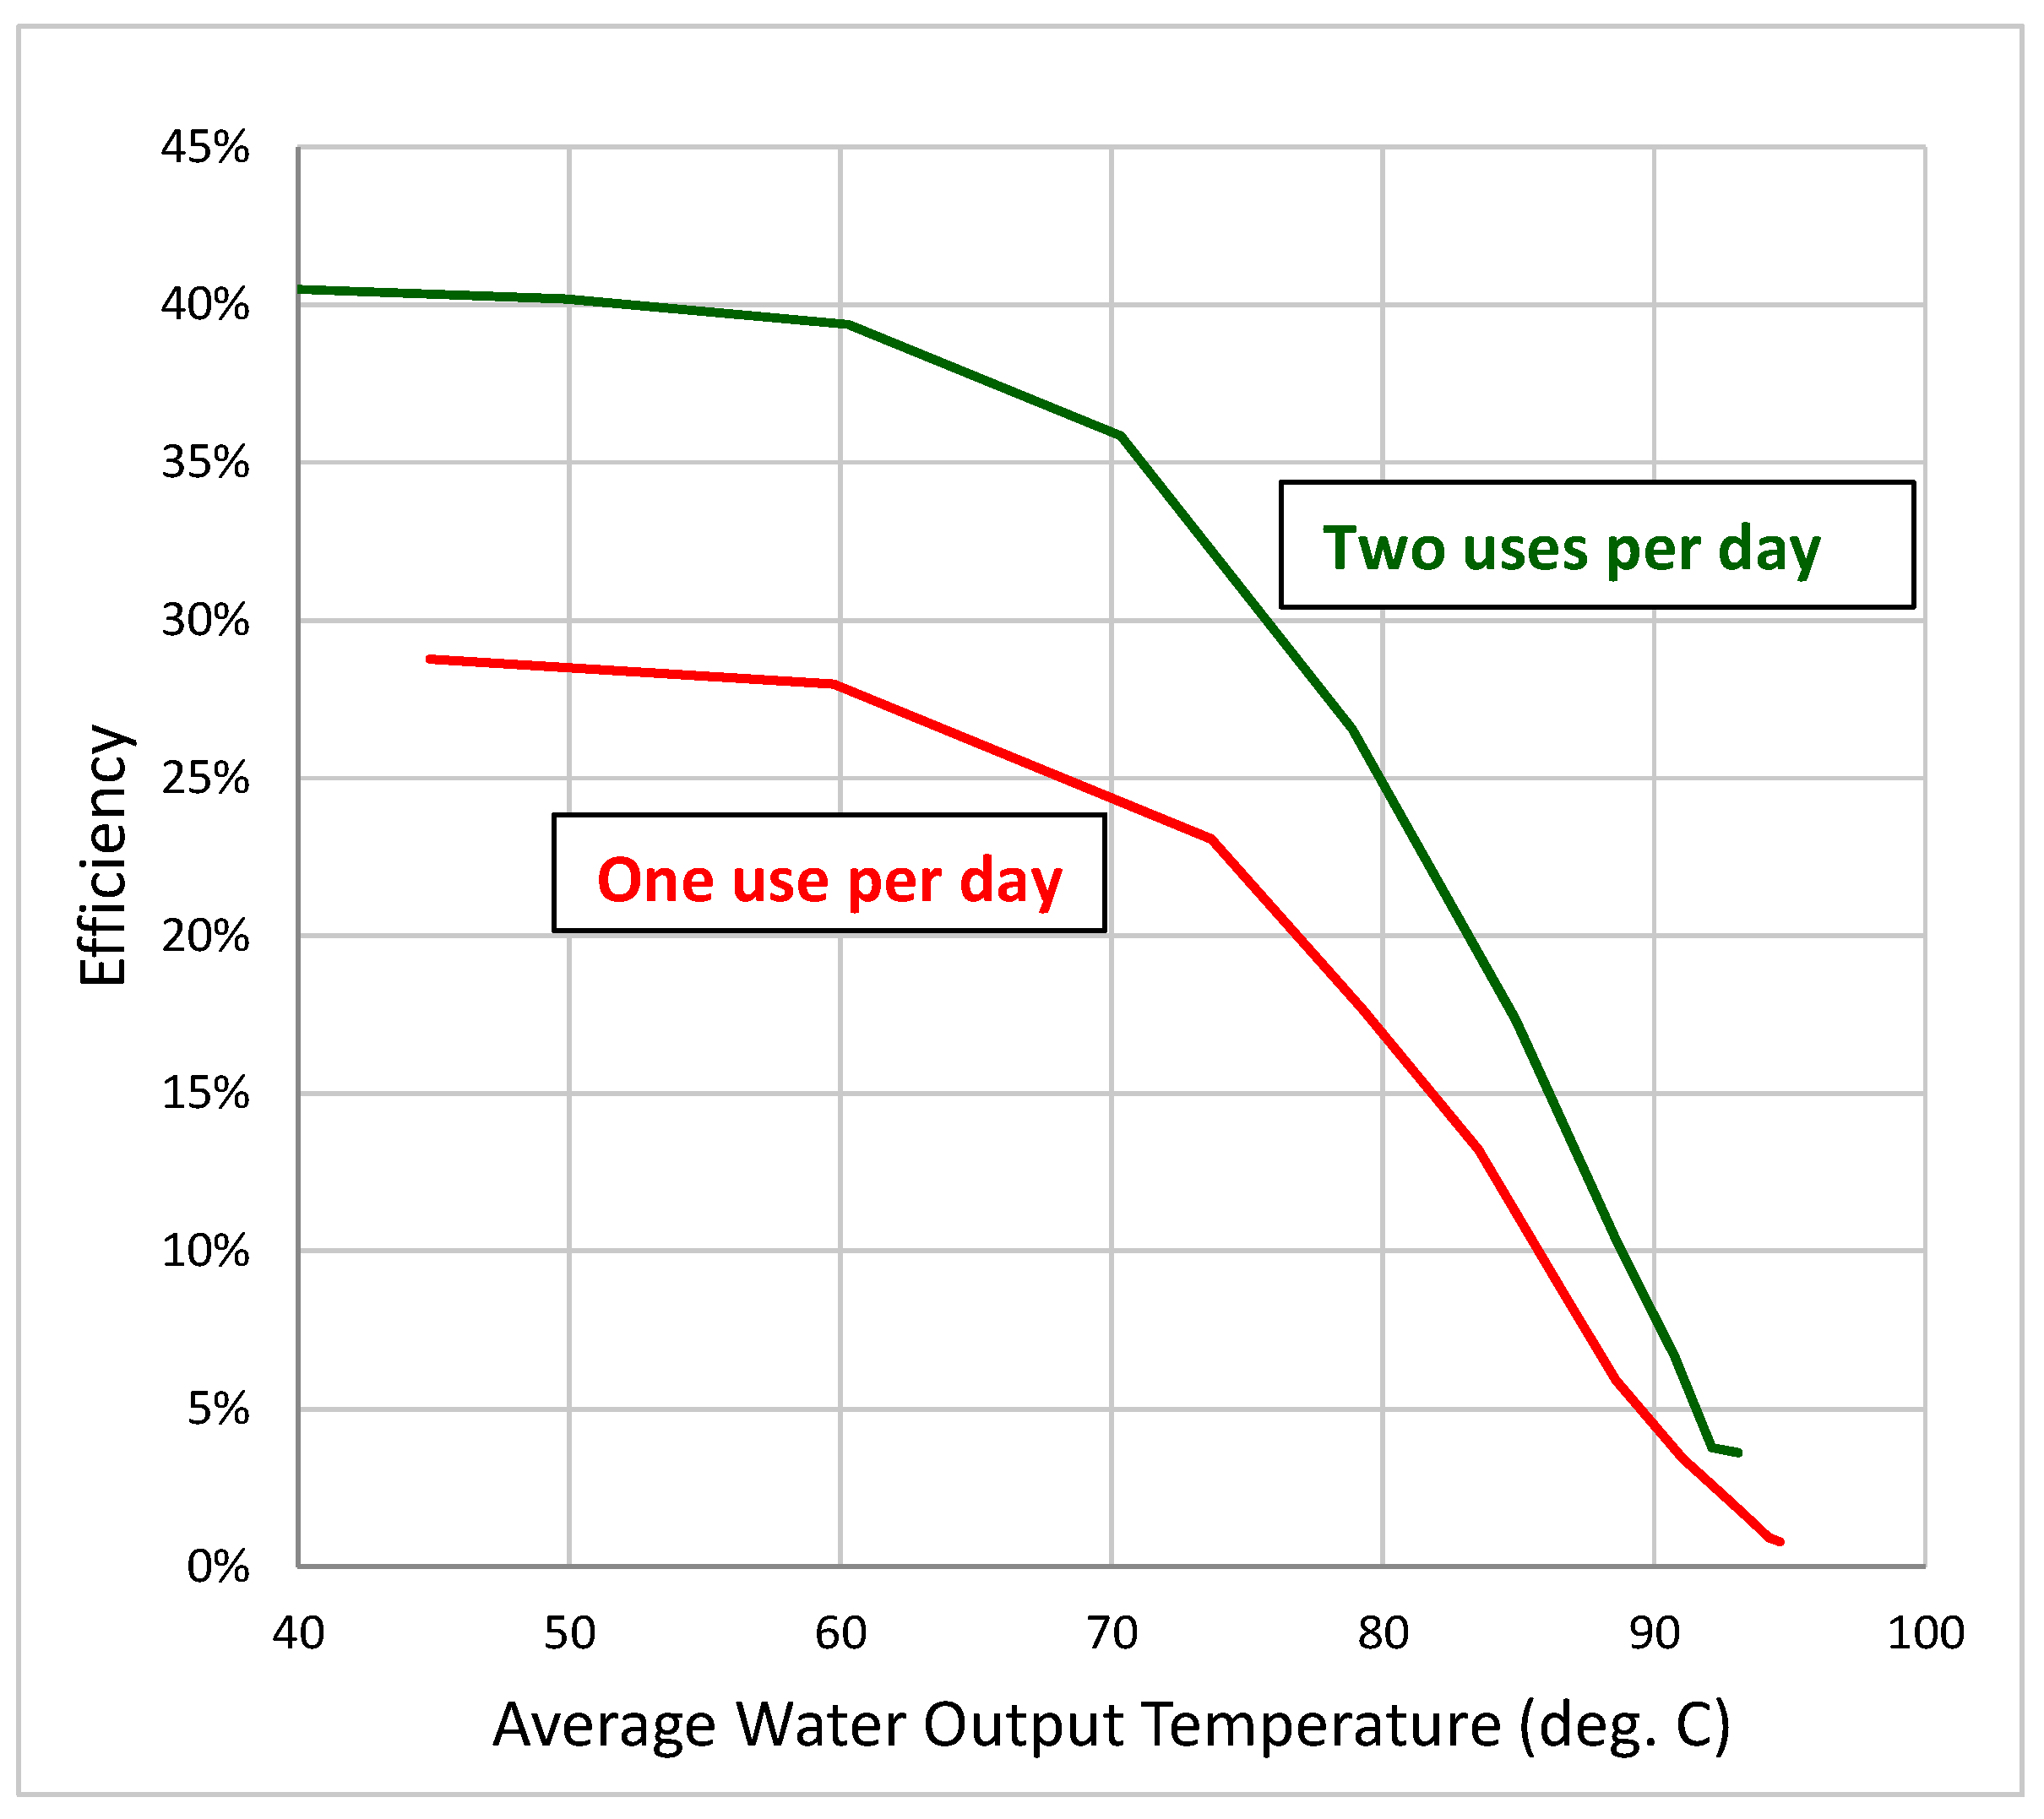
Figure 5 illustrate the efficiency values of a four-liter DDS cooker system as a function of solar panel capacity. Efficiency is fairly sensitive to use behavior. Meanwhile,
Figure 6 illustrates the relationship between marginal efficiency and cooker performance in terms of output temperature of the heated water. Designing a cooker that has high output temperature on all days requires a large solar panel that can provide sufficient energy output even on cloudy days, which leads to low marginal efficiency. Thus, for the output temperature to average higher than 90 degrees C requires a marginal efficiency of less than 10%. Being able to access very inexpensive DDS cooking electricity requires households to adjust to a measure of variability and unreliability of SEC energy supply and performance. A household will sometimes need to transfer partially heated water or food from the solar cooker to a wood stove to complete boiling the water or cooking the food, or they use the partially heated water as an input to wood cooking to decrease the amount of wood fuel needed for cooking.
3.3. MLCOE Distributions for Solar Electric Cooking
The key parameters that determine the marginal cost of solar electric cooking are the efficiency, the solar equipment capacity cost, the present worth factor (which depends on discount rate and system lifetime), and the solar resource. The following sections present results for both DDS SEC systems without battery storage and for SEC systems that include long-lasting LTO battery technology to provide electricity for on-demand cooking applications.
3.3.1. MLCOE Distribution for Solar Electric DDS Cooking
Table 5 presents the input parameter values that are used to estimate the distribution of MLCOE for DDS cooking. As described above, the marginal efficiency can range from less than 10% to above 40%. Low values of marginal efficiency correspond to a system with a relatively large solar panel that reliably heats water above 80 degrees C. A 40% marginal efficiency represents a system with a relatively small solar panel that is used twice per day and that can heat water to about 60 degrees C on average.
A online report: “Estimating and projecting solar panel costs for Sub-Saharan Africa” [
42] explains in detail the estimates for the range of solar panel supply costs for SSA that can be possible. The present worth factors presented in
Table 5 represent the high, median, and low values that are obtained when the lifetime of the SEC system ranges from 5 to 20 years and when the real discount rate that is used for calculating present values ranges from 1% to 8%. The range of solar resource values are obtained from solar resource maps provided by Solargis [
43] and represent values from southern West Africa for the low solar resource value, the desert margins of SSA for the high value, and an average of the two values as the medium value.
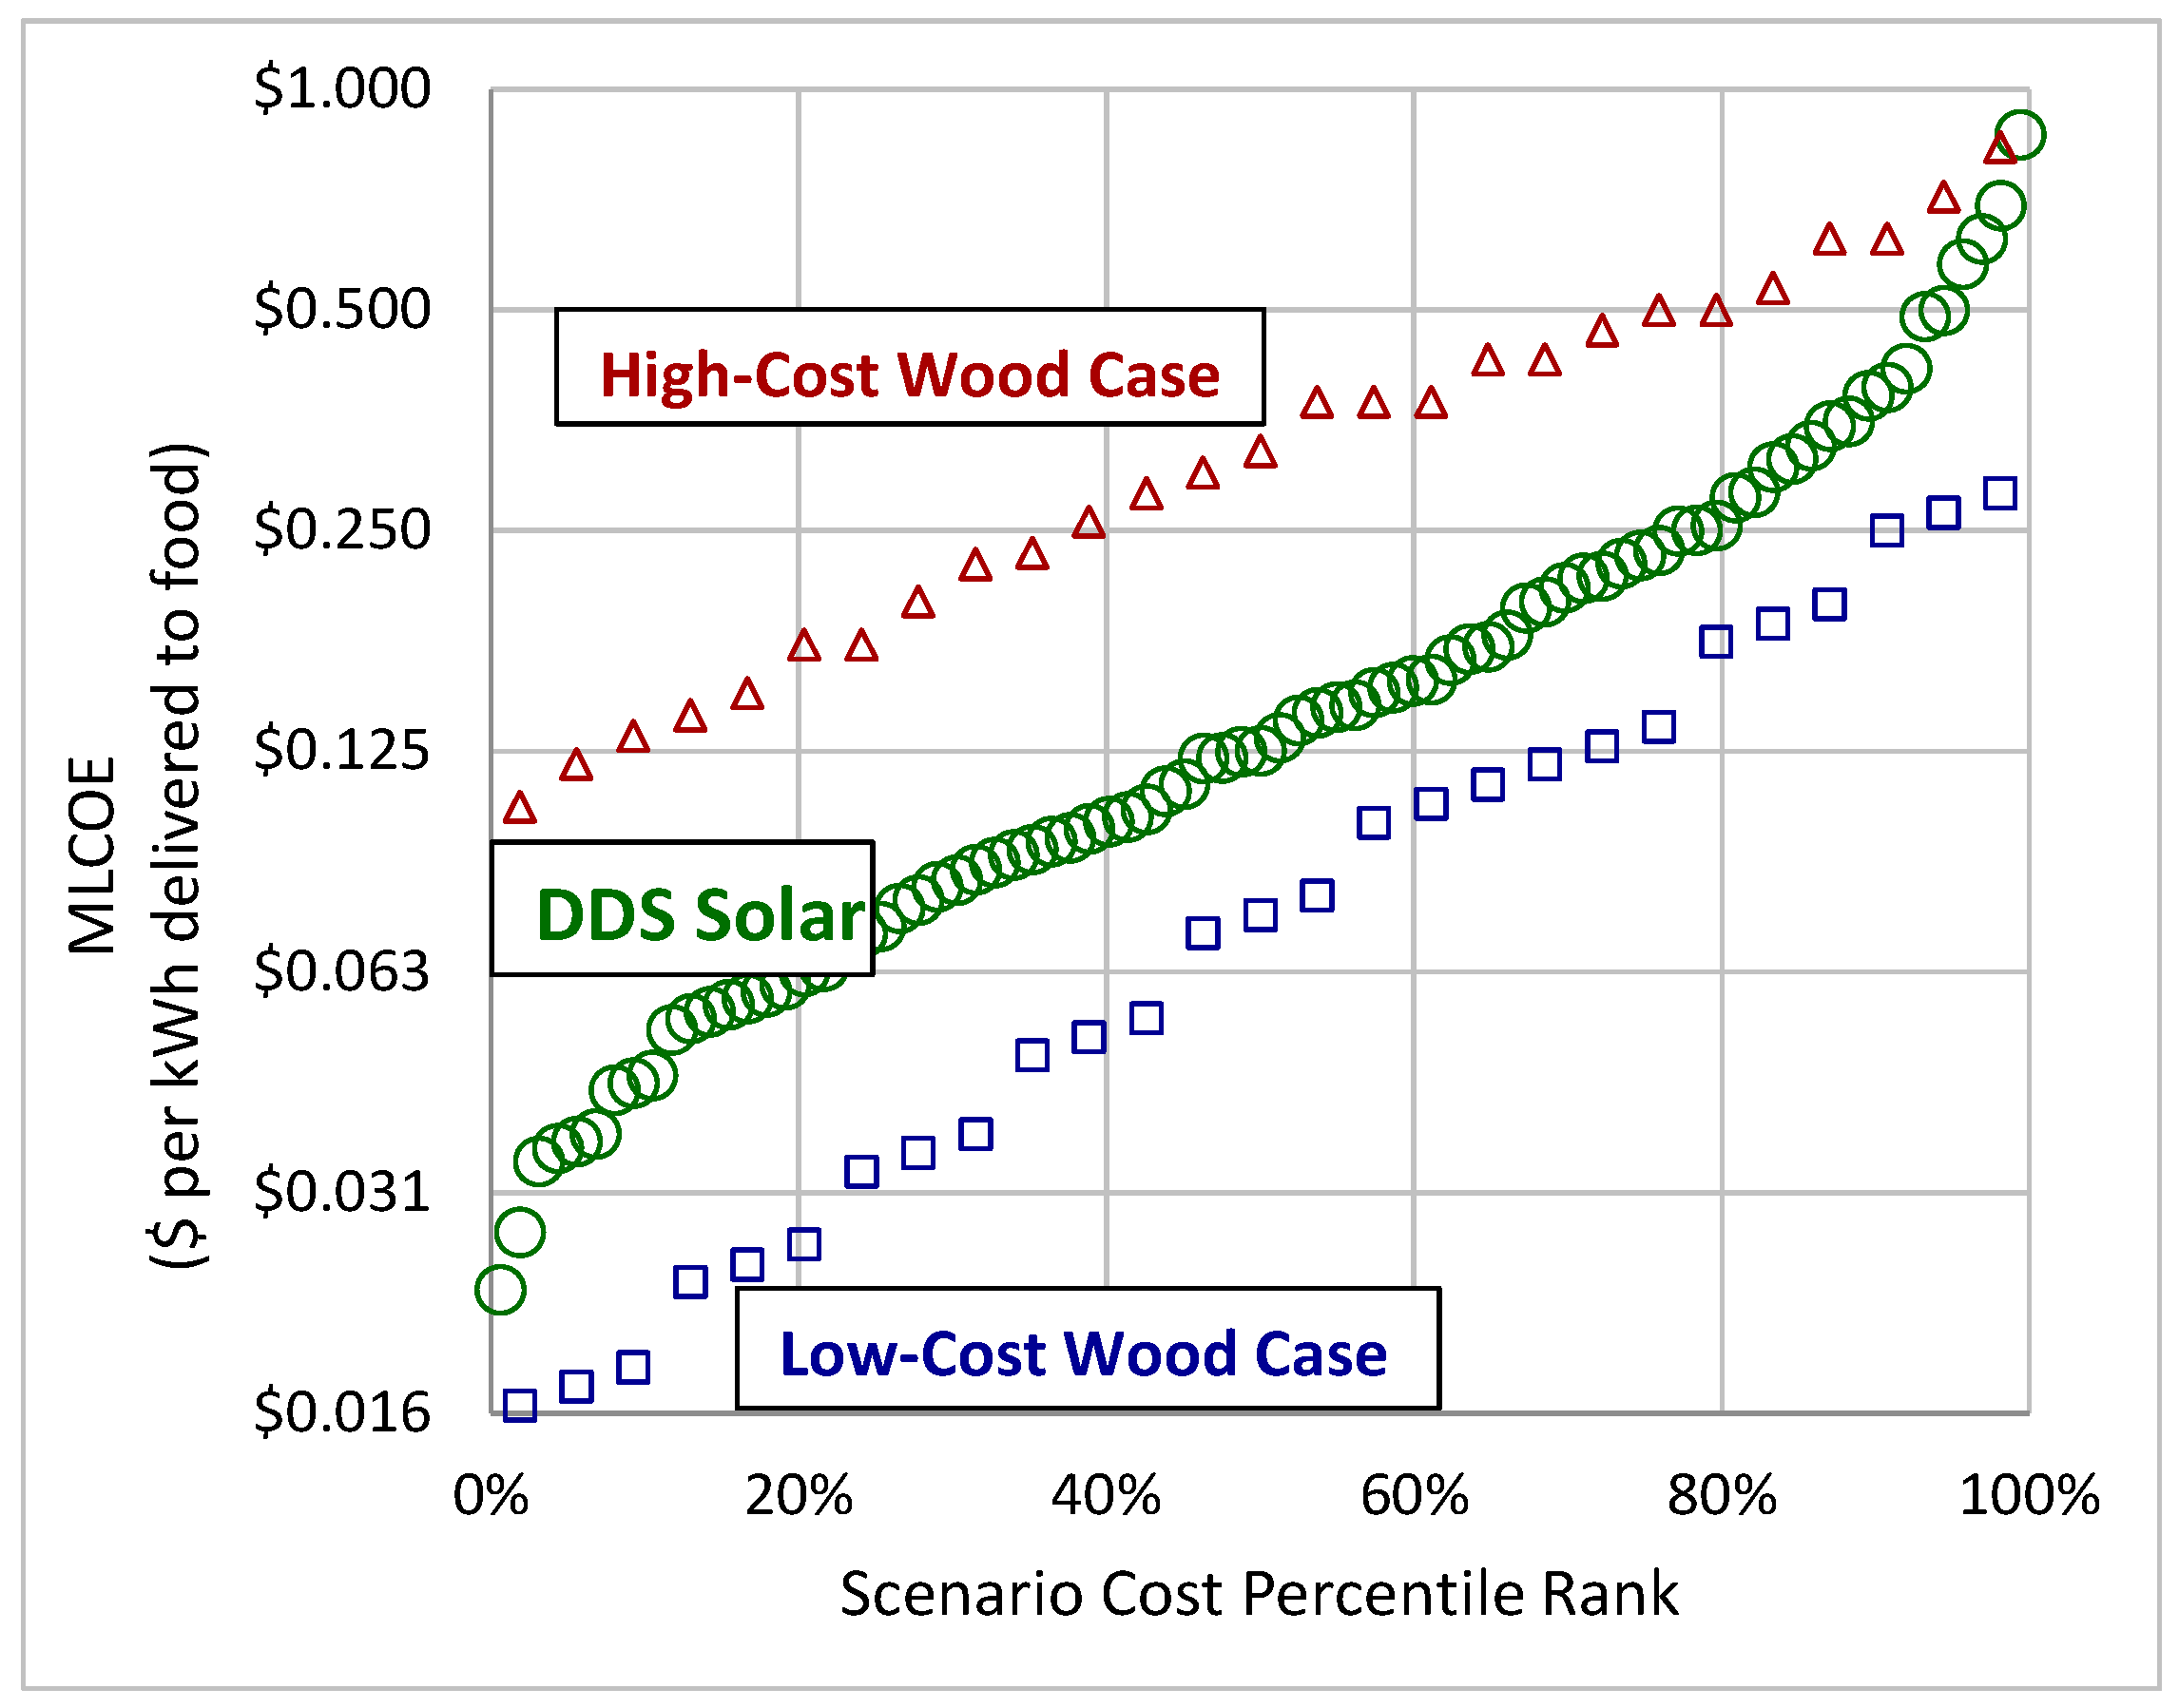
Figure 7 illustrates the cost distribution for the MLCOE of DDS SEC that results from the parameter input values provided in
Table 5. The figure illustrates that DDS SEC energy costs are within the range of WC energy costs. This means that given the potential range of the input cost parameters, DDS solar will be sometimes less expensive and sometimes more expensive than WC. The fact that the DDS distribution lies somewhat below the middle of the distribution of WC costs indicates that DDS energy should be cost-competitive with WC energy in more than half of the cases.
These results highlight the fact that when a DDS SEC system is designed for high reliability and thus low marginal efficiency, and/or it has a lifetime of less than five years, and/or has a marginal cost of solar panel capacity of USD 0.50/W or higher, then solar electric DDS cooking will not be cost-competitive with wood-based cooking for the vast majority of the time. Because DDS cooking technology is one of the least expensive solar electric cooking technologies [
38], this may have implications for when off-grid solar electric cooking can be competitive with WC in general.
3.3.2. MLCOE Distribution for Solar Electric LTO-Battery-Regulated Cooking
A DDS electric cooker system can easily allow the addition of an LTO battery for electric cooking. LTO batteries are easy to add because they can be discharged regularly at high discharge rates (i.e., 4C or more). In addition, LTO batteries can have a long lifetime (and thus a high PWF) because the cycle life can be greater than 10,000 cycles, even when discharged quickly [
40]. Thus, relatively small batteries can be added incrementally to serve a load that can have relatively large peak power requirements. Similar to solar panels in a DDS system, incremental battery capacity is not used with high efficiency when battery capacity is large relative to demand.
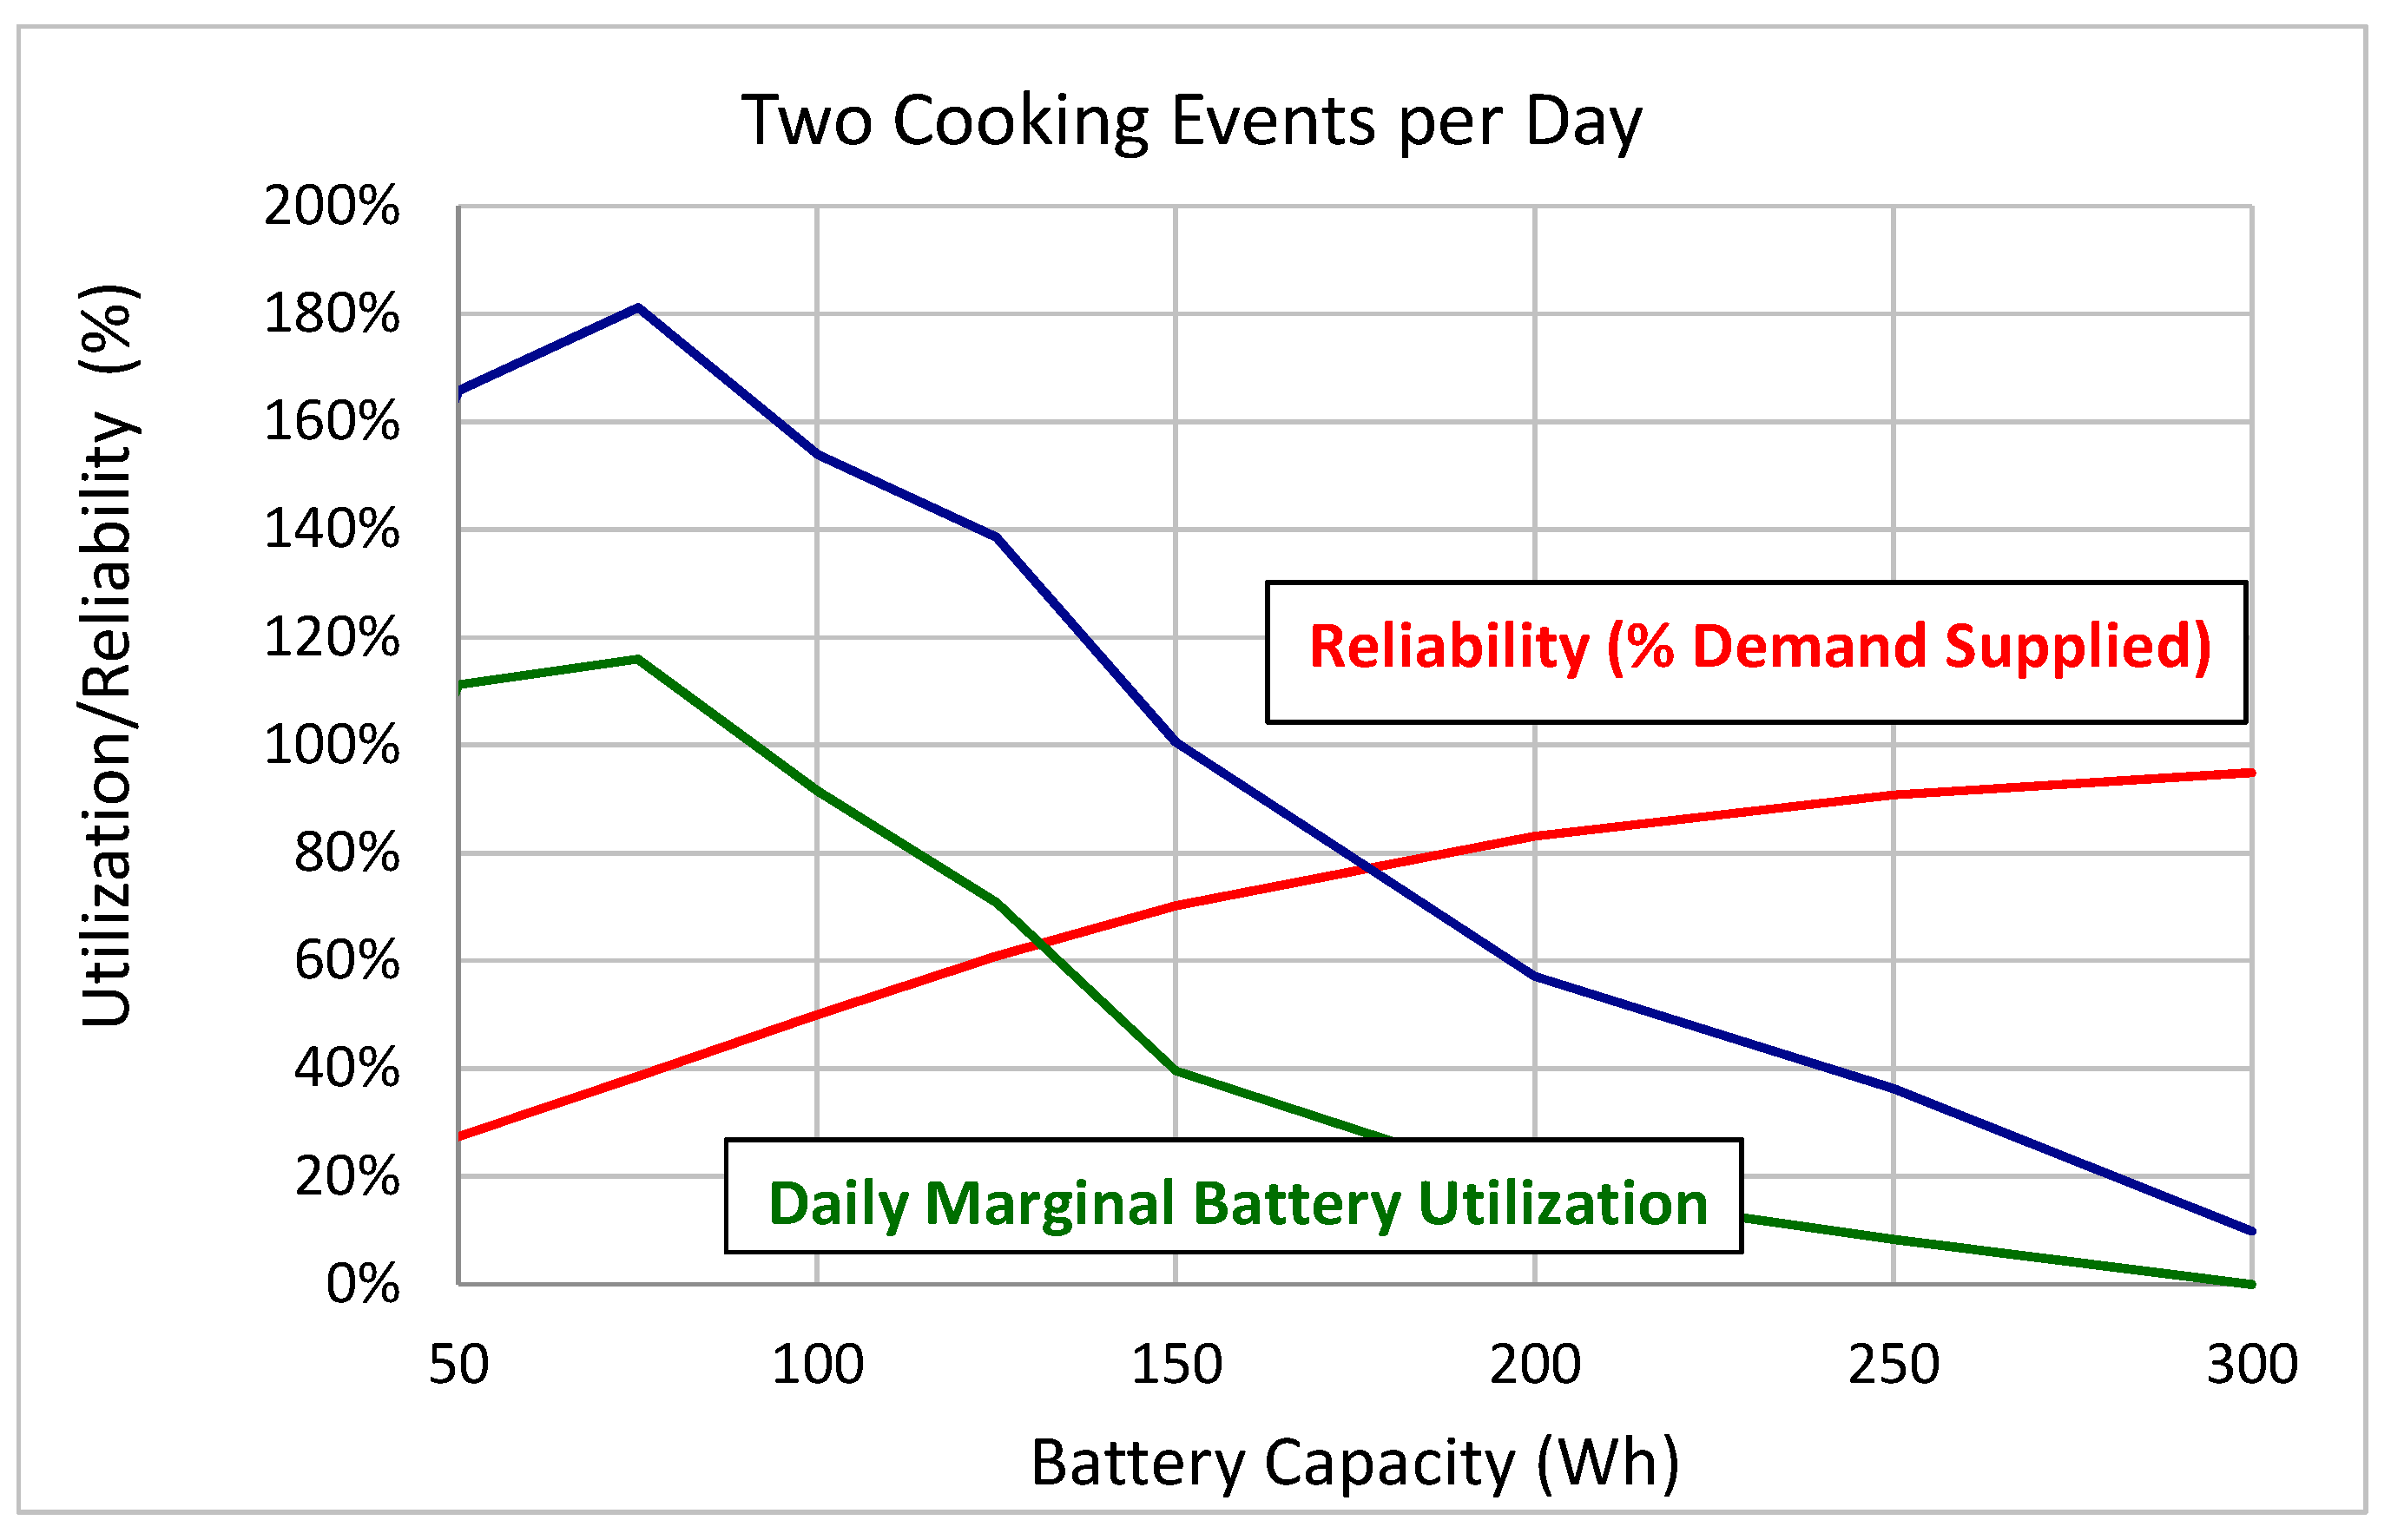
Figure 8 illustrates both reliability and two types of marginal battery capacity utilization for a 4-L DDS system with a 300-watt solar panel and a LTO battery subsystem that draws 250 Wh per cooking event. We chose 250 Wh for the energy requirement of a cooking event because this corresponds to a typical cooking requirement for a meal cooked in an EPC.
The supply of the 250 Wh/event demand (i.e., 500 Wh/day) is 80% reliable when the battery capacity is above 200 Wh.
Note that for DDS solar system configurations with a relatively large solar panel, the addition of an LTO battery subsystem does not divert much energy from the DDS cooker. Instead, the LTO battery subsystem uses solar panel electricity that otherwise would not be utilized. This study refers to this electricity as “newly utilized” electricity.
This study analyzes the incremental cost of the battery MLCOE in terms of the quantity of newly utilized electricity that the battery consumes in the DDS LTO SEC system. Such newly utilized electricity does not incur an investment cost for increases in solar panel capacity.
Table 6 provides the range of LTO electricity MLCOE inputs. As illustrated in
Figure 8, marginal utilization efficiency can reasonably range from 20% to 120%, battery cost can range from USD 0.25/Wh to USD 0.50/Wh as described [
44], and the present worth factor can range from 4.8 to 13.3 for long lasting systems. Details of the modeling are contained in an online report [
41].
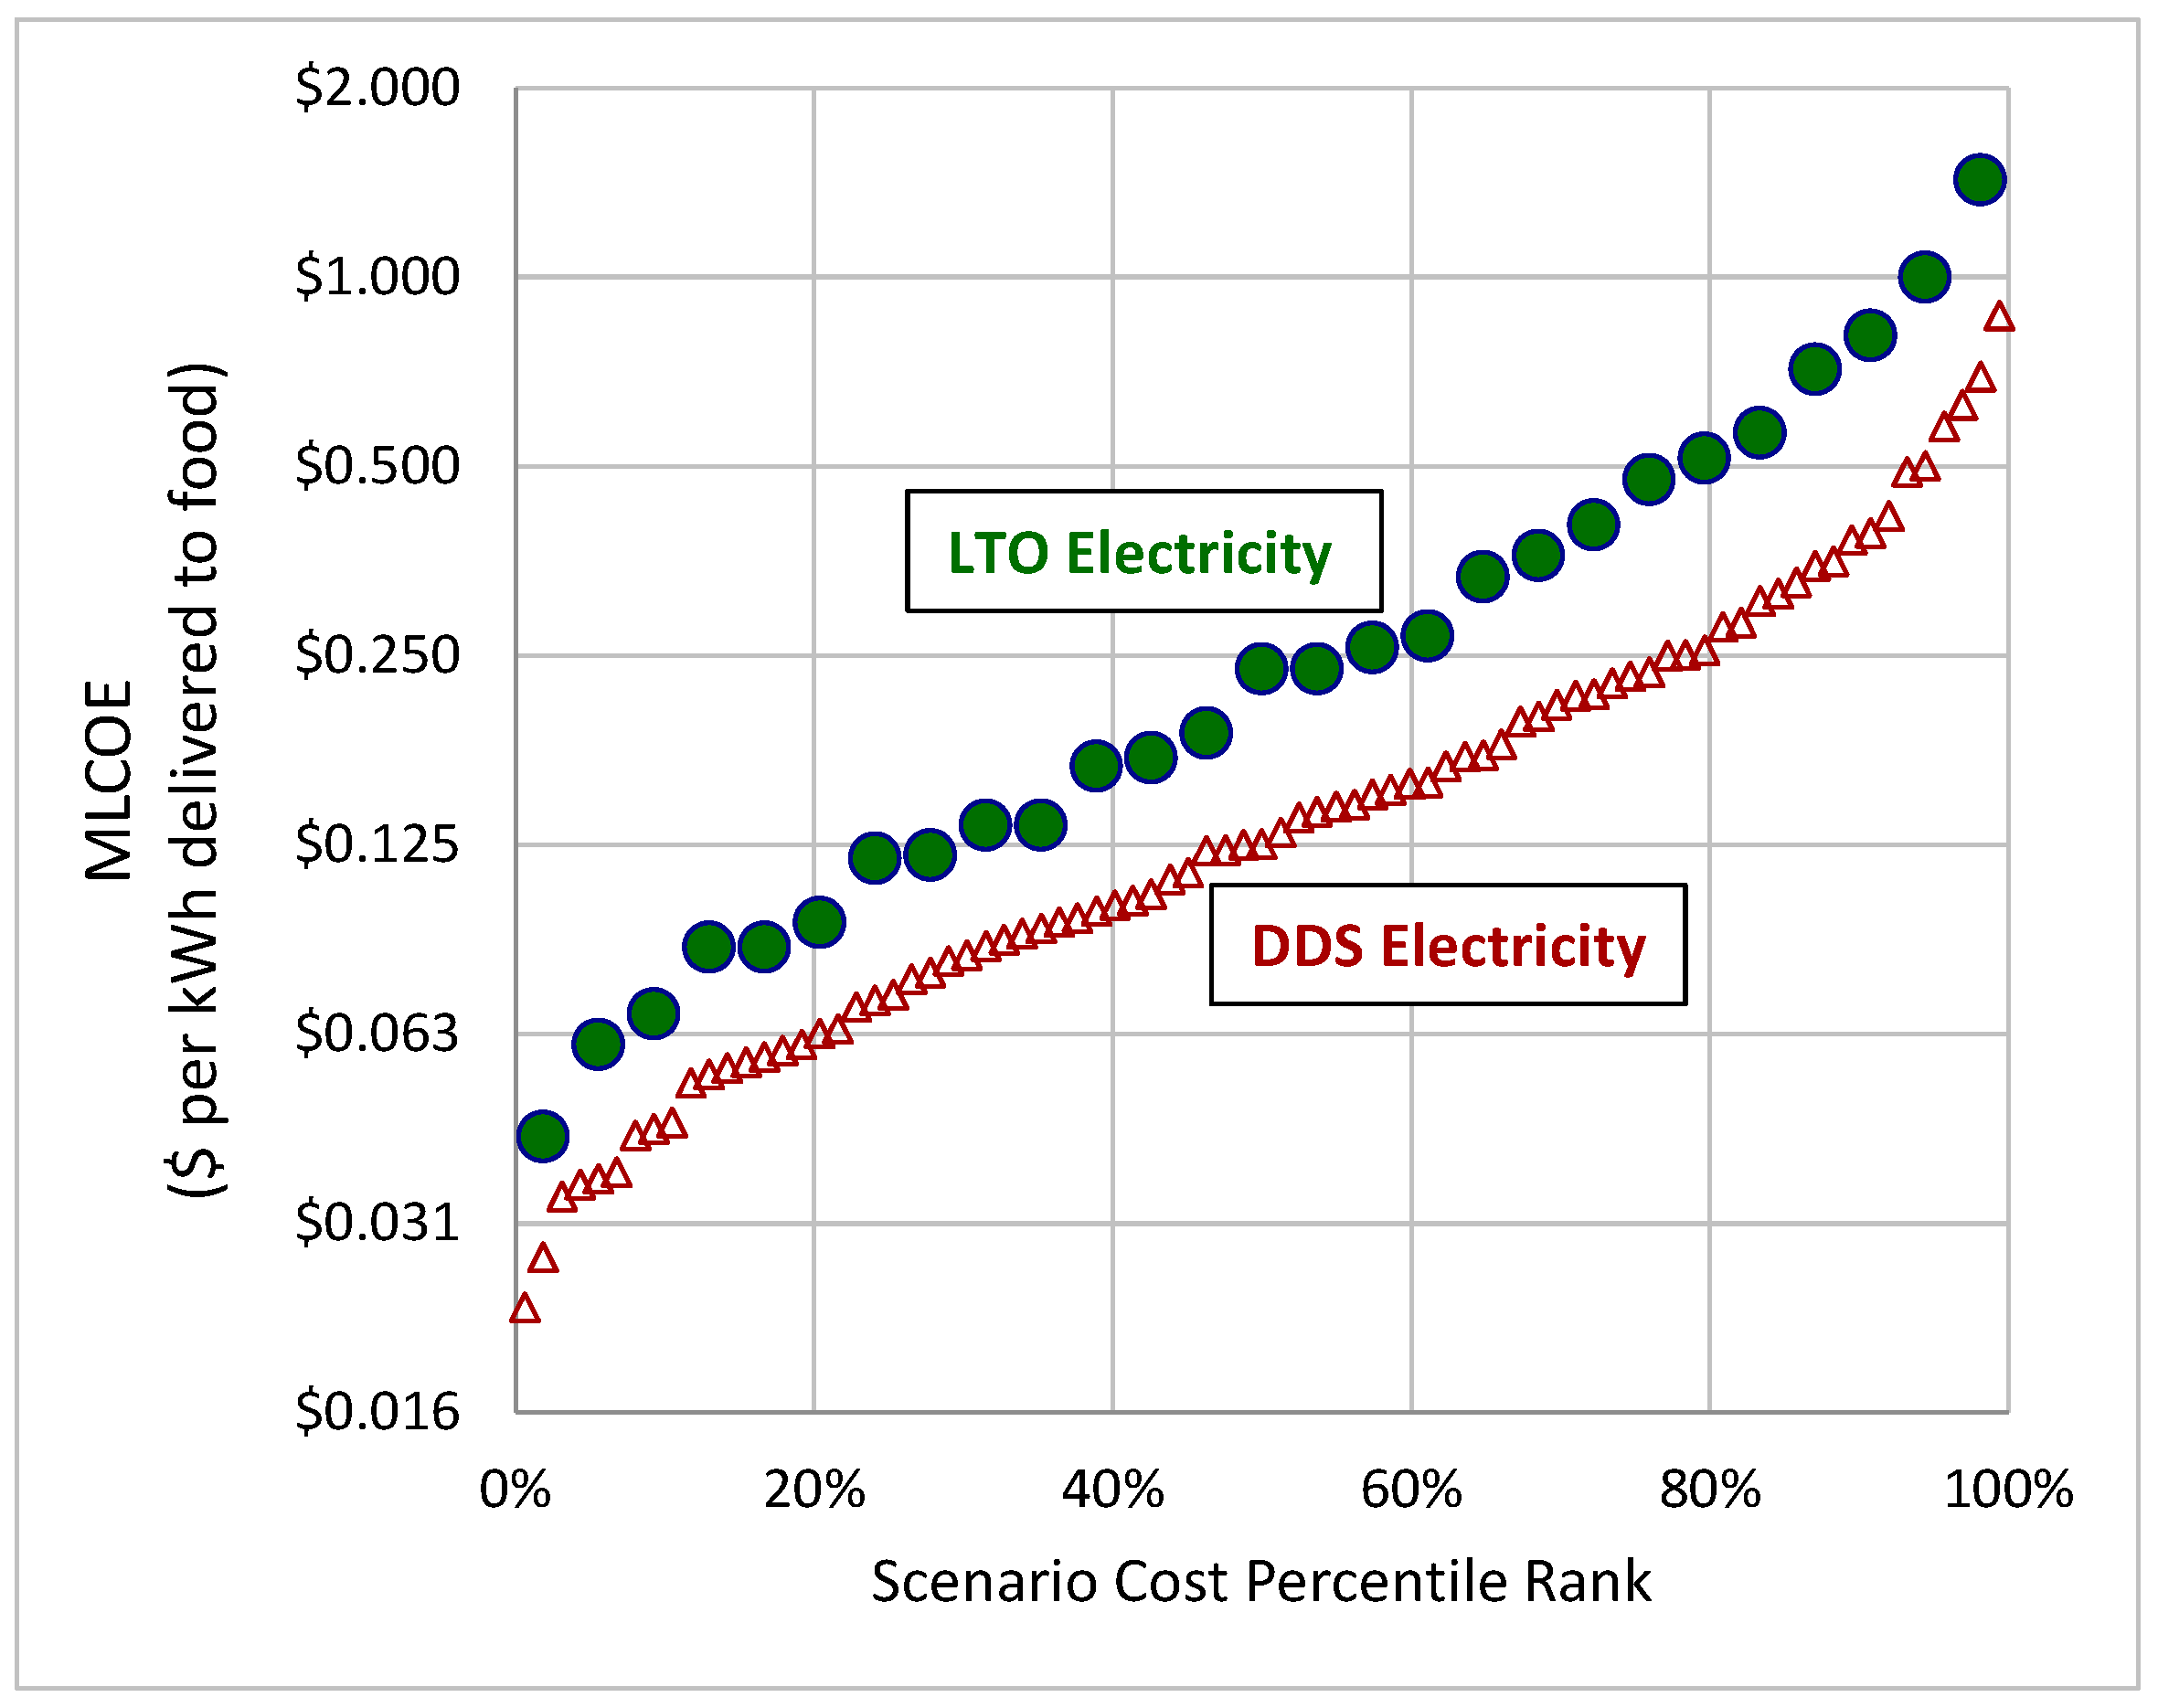
The MLCOE analysis results illustrated in
Figure 9 suggest that the marginal costs of unregulated DDS electricity in a system without a LTO battery tends to be 40 to 50% less expensive than the marginal costs of LTO-regulated electricity. At the low-cost portion of this distribution, LTO-regulated electricity competes with medium to high WC costs. Perhaps more important in terms of creating cost-efficient and affordable solutions for SEC access in SSA is the fact that if a household can obtain an initial cost-effective DDS SEC for addressing initial clean cooking energy demand, then increasing amounts of more convenient battery-regulated SEC energy can be added to the system by simply adding a LTO battery subsystem. The LTO subsystem provides convenient, on-demand cooking electricity for a discrete set of cooking events that occur during the course of the day. Much of the LTO electricity can also be used for other non-cooking household uses.
Note that because the LTO subsystem can last as long as the solar panel and the rest of the solar system, replacement costs do not have to be included in the MLCOE of the battery subsystem. For relatively small battery capacities and rural households, the transaction cost of battery replacement is relatively high, and the lack of replacement creates a substantial advantage of LTO chemistries relative to other battery chemistries.
3.3.3. MLCOE Distribution for Electricity Savings Costs for an Electric Pressure Cooker (EPC)
A LTO battery system can easily power an electric pressure cooker (EPC). It is possible to adapt the methods for calculating marginal LTO electricity costs to calculating the marginal cost of saving a kWh of electricity with an EPC. The input cost parameters used for calculating the distribution of EPC MLCOE for saved electricity are provided in
Table 7.
To calculate the MLCOE, the investment cost for an EPC is divided by the net present value (NPV) of the energy saved, where the NPV energy savings is the product of three parameters: (1) the watt-hours saved per day, (2) the number of days in the year, and (3) the present worth factor associated with the EPC lifetime. The PWF is assumed to correspond to a lifetime of between 4 to 12 years with discount rates ranging from 1% to 8%. The watt-hours saved per day depend mostly on how much the EPC is used. It is assumed that the EPC can save approximately 100 to 300 Wh per cooking event compared with a non-pressure-cooking electrical appliance with an average savings of 200 Wh/day. The low savings number corresponds to an average cooking event savings occurring once every two days. The high savings number corresponds to an average cooking event occurring 2.5 times per day on average.
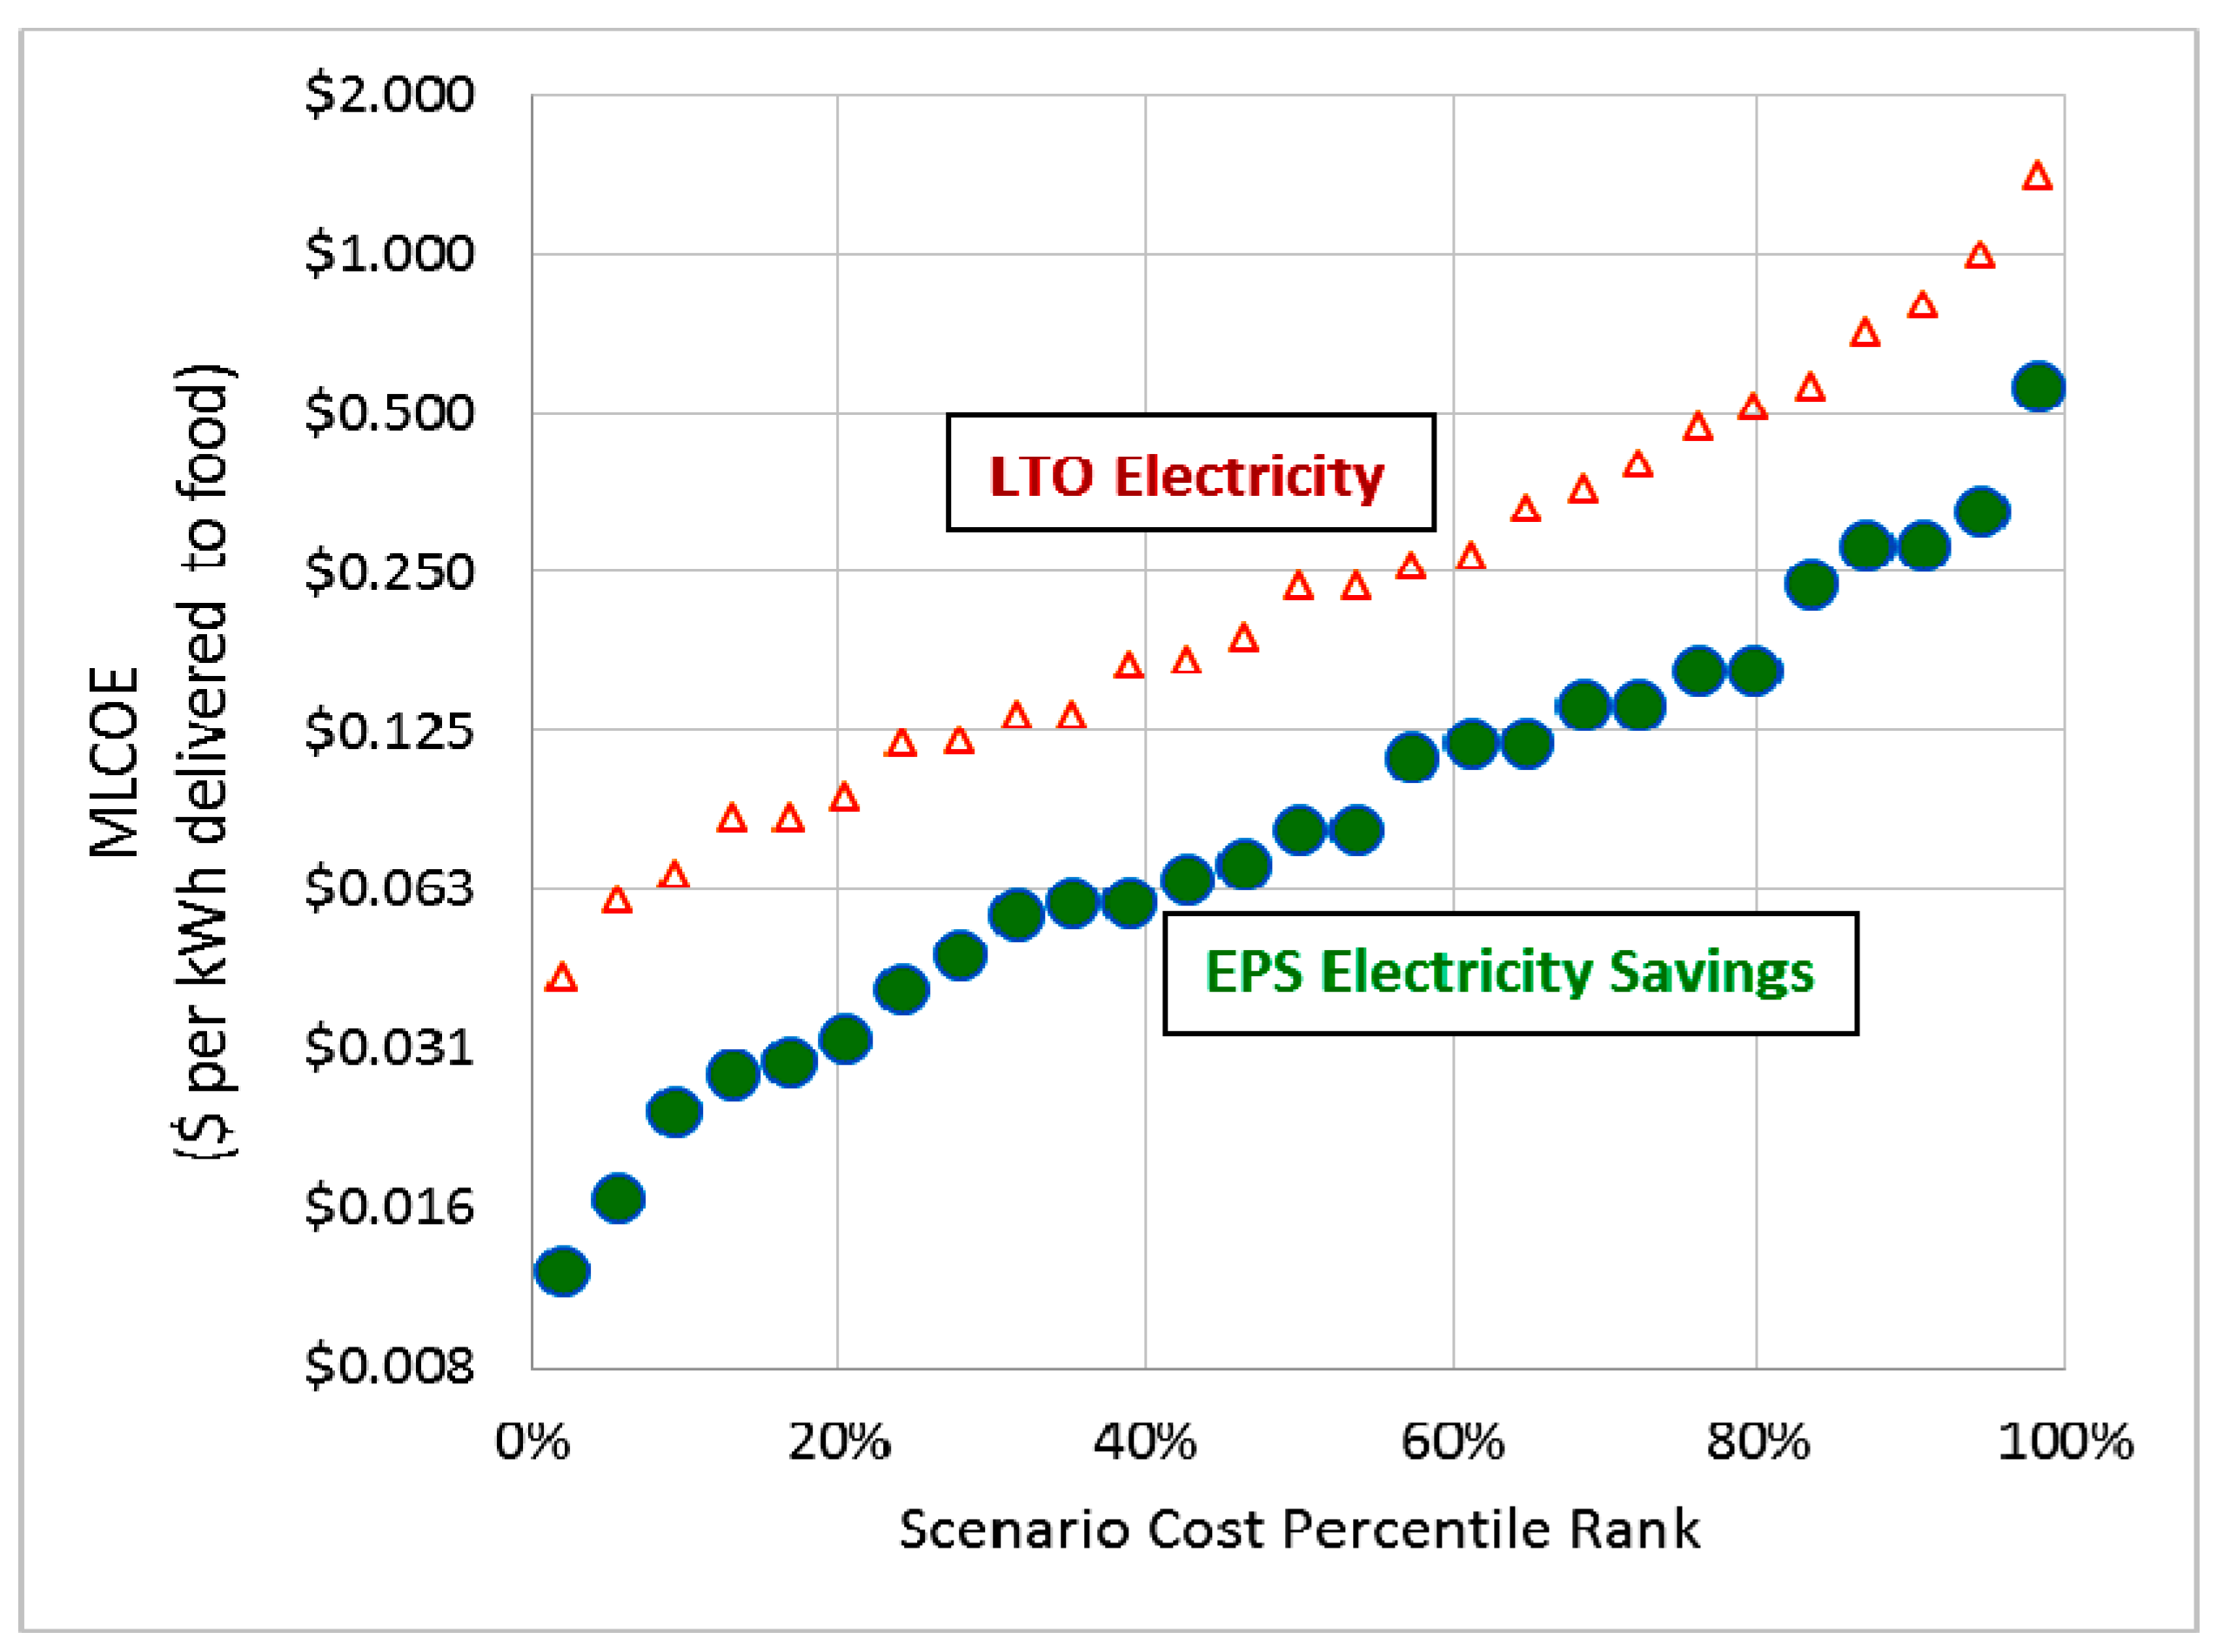
The MLCOE analysis illustrated in
Figure 10 illustrates the marginal costs of EPC electricity savings (sometimes referred to as “negawatts”). EPC electricity savings is the least expensive source of electricity for an off-grid solar cooking system that has on-demand cooking electricity supplies. The caveat is that in order to attain these low-cost energy savings, an off-grid SEC needs to have battery-regulated electricity that can deliver the relatively high power that is needed by an EPC (i.e., 300 W to 1000 W). Using median MLCOE values, the average effect of obtaining 50% of cooking energy as LTO-electricity and 50% of cooking “energy” as EPC savings gives an average marginal cost of (USD 0.082/kWh + USD 0.238/kWh) = USD 0.16/kWh, which is moderately higher than the DDS median MLCOE of USD 0.125 and only slightly higher than the USD 0.15/kWh estimated median cost of WC.
4. Discussion
The long-lasting SEC technologies of DDS electricity and LTO battery storage have a wide range of potential levelized energy costs. A key reason that these technologies are low cost is because the infrastructure for solar electricity supply can be long-lasting. Solar panels that provided DDS electricity can last 20 years or more, and LTO batteries have a cycle life of 10,000 cycles or more.
If these low-levelized-cost solar electric technologies are going to play a substantial role in the transition to clean cooking in rural SSA, then they need to be competitive with the equivalent levelized cost of wood cooking. WC MLCOE can range from relatively high when the cooking is inefficient, the fuel is expensive, the energy content of the wood fuel is low, and/or the full environmental impact cost of the wood use is included. In the high-cost scenario, the MLCOE of wood energy delivered to cooking can range from USD 0.10/kWh to nearly USD 0.83/kWh. In that case, it is fairly straight-forward to develop DDS and LTO SEC systems that have a marginal cost that is cost-competitive with WC.
The low-cost WC scenario is where wood cooking efficiencies are high, the fuel wood is inexpensive with no environmental impacts, and the wood is high quality and dry. In this scenario, it is very difficult for SEC to be cost-competitive with WC. Even with low-cost DDS and LTO SEC systems.
However, in the more typical case of moderate wood fuel costs and moderate efficiencies, the MLCOE of SEC is slightly lower than WC if the SEC system can be designed to last 10 years or more, and when the SEC system can be designed and operated at relatively high efficiency. In the mid-range scenarios, SEC is competitive with WC even though the health harms from WC smoke are not included in the WC cost model. Considering the health costs of WC makes SEC even more competitive.
These analysis results provide a very clear path for innovating to make SEC more cost-competitive with WC in the near to medium-range future. Accelerated innovations to make SEC systems more competitive with WC should help accelerate the transition to clean cooking for low-income households in SSA over the coming decades.
However, there are several well-known market failures that are likely to be barriers to creating the economic conditions that allow low-cost SEC access in SSA.
Akerloff’s “market for lemons” asymmetric information market failure [
45] makes it difficult for long lifetime, high quality SEC systems to compete with lower cost, short lifetime, low quality SEC products. A market-based solution to this market failure is for particular brands of SEC system providers to develop long-term relationships with their customer base so that customers can distinguish between suppliers of long-lasting products and suppliers of short-lasting products. A regulatory solution to this market failure might be to set product durability standards, but then enforcement can become problematic. A more “carrot-like” policy solution to this failure is for government or development agencies to provide incentives and subsidies for sales of products that meet standards of durability and long lifetimes on a “pay-for-performance” basis.
Global environmental externalities are not currently reflected in most local wood fuel markets in SSA. This means that the operating costs of WC systems are underpriced relative to SEC systems which are over-priced in the context of market-based distribution. There is a key positive environmental externality that arises when households in SSA convert from WC to SEC. This positive externality is the value of the emissions reductions which benefit the future global economy. Ecosystem emissions reduction and carbon sequestration in SSA helps mitigate the climate change impact created by the historical emissions of richer countries [
46,
47]. Philanthropy, aid financing, and certain types of carbon financing can potentially correct this externality by subsidizing purchases of SEC systems to the extent that they produce climate mitigation benefits to the global economy as a whole.
Liquidity constraints and present bias [
48] also makes it difficult for SSA households to make investments that can be paid back over many years. This means that low-income households can likely afford to pay only a fraction of the initial costs of high-benefit SEC systems [
49]. The fraction that they can afford to pay corresponds to near-term benefits of the system, while long term benefits cannot be financed by low-income purchasers: especially for systems that last 10 years or more. To the extent that the long-term externalized environmental benefits of SEC systems can be financed by philanthropic organizations or aid organizations from richer continents, then it may be possible to pay a large fraction of the up-front SEC system investment cost with co-financing from such sources. This may help resolve liquidity constraints.
5. Conclusions
This study has presented an analysis of how solar electric cooking can be cost-competitive with wood-based cooking in SSA.
The key to making SEC cost-competitive relative to WC is four-fold: (1) assuring long lifetimes for solar panels and batteries, (2) arranging a low marginal cost of capacity by efficiently importing and distributing batteries and solar panels at scale to keep overhead costs low, (3) utilizing the solar panel and battery capacity in the SEC system with high efficiency, and (4) accounting for climate impact externalities in the existing cost of wood.
Approximate targets for each of these cost parameters for SEC are roughly as follows: (1) >10 years for solar panels and battery subsystem lifetime, (2) solar panel costs below USD 0.36/Wp and LTO battery subsystem costs below USD 0.35/Wh, (3) solar panel utilization efficiencies of greater than 25% (i.e., portion of solar panel potential output delivered to food), and (4) a valuation or subsidization of climate benefits that exceeds USD 20/tCO2e. By meeting all four targets, it should be possible to have off-grid solar electric cooking compete with wood-based cooking in SSA.
In summary, solar electric cooking technologies exist that are cost-competitive with wood-based cooking under the right conditions. If the climate benefits of solar electric cooking use are accounted for at full value, then this study indicates that DDS and LTO SEC systems can usually out-compete wood-based alternatives. However, in order for the transition to SEC systems to be economical in practice, several market failures have to be addressed including: (1) asymmetric information market failures, (2) environmental externalities, and (3) liquidity constraints. To the extent international collaboration can address these failures in SSA cooking energy markets, the SSA transition from wood-based cooking to off-grid solar electric cooking can now proceed in earnest.
Author Contributions
Conceptualization, data curation and formal analysis, R.V.B.; investigation and validation, G.R., R.K., C.G. and J.M.; methodology, R.V.B.; resources, L.K., C.G. and R.V.B.; writing—original draft, R.V.B.; writing—review & editing, R.V.B.; project administration, L.K.; funding acquisition; L.K. and R.V.B. All authors have read and agreed to the published version of the manuscript.
Funding
This work was supported by funding from UK DFID Modern Energy Cooking Services Programme, Project Number 300123-101, through a contract with Loughborough University and by matching resources from Kachione, LLC, Malawi, and Medicine from Heaven, Inc., USA.
Data Availability Statement
Acknowledgments
Note that Lawrence Kachione provided administration and funding acquisition. Gilbert Robert with the assistance of Rachel Kanyerere, James Majoni, and Christina Gilbert conducted validation and investigation through the construction and performance measurement of DDS cooker prototypes. This work would not have been possible without the continuing philanthropic support of Eric Selvin, concessionary credit line financing from Craig Harmer, periodic donation support from Paul Selvin and more than a dozen other individual donors, and helpful technical input from Skyler Selvin. This work has also benefitted from the technical collaboration with Pete Schwartz and his “Radically inexpensive solar electricity project”:
http://sharedcurriculum.peteschwartz.net/direct-dc-solar-research/ (accessed on 14 July 2021).
Conflicts of Interest
The authors are involved in philanthropic and business activities related to the distribution of off-grid solar electric cooking systems in rural Malawi which are the subject of this study. The funders of this study are involved in the promotion of clean cooking technologies in SSA.
References
- Brew-Hammond, A. Energy access in Africa: Challenges ahead. Energy Policy 2010, 38, 2291–2301. [Google Scholar] [CrossRef]
- Alstone, P.; Gershenson, D.; Kammen, D.M. Decentralized energy systems for clean electricity access. Nat. Clim. Chang. 2015, 5, 305–314. [Google Scholar] [CrossRef]
- Barasa, M.; Bogdanov, D.; Oyewo, A.S.; Breyer, C. A cost optimal resolution for Sub-Saharan Africa powered by 100% renewables in 2030. Renew. Sustain. Energy Rev. 2018, 92, 440–457. [Google Scholar] [CrossRef]
- Bazilian, M.; Nussbaumer, P.; Rogner, H.H.; Brew-Hammond, A.; Foster, V.; Pachauri, S.; Williams, E.; Howells, M.; Niyongabo, P.; Musaba, L.; et al. Energy access scenarios to 2030 for the power sector in sub-Saharan Africa. Util. Policy 2012, 20, 1–6. [Google Scholar] [CrossRef] [Green Version]
- Baurzhan, S.; Jenkins, G.P. Off-grid solar PV: Is it an affordable or appropriate solution for rural electrification in Sub-Saharan African countries? Renew. Sustain. Energy Rev. 2016, 60, 1405–1418. [Google Scholar] [CrossRef]
- Dagnachew, A.G.; Lucas, P.L.; Hof, A.F.; Gernaat, D.E.; de Boer, H.S.; van Vuuren, D.P. The role of decentralized systems in providing universal electricity access in Sub-Saharan Africa–A model-based approach. Energy 2017, 139, 184–195. [Google Scholar] [CrossRef] [Green Version]
- Mitra, S.; Buluswar, S. Universal access to electricity: Closing the affordability gap. Annu. Rev. Environ. Resour. 2015, 40, 261–283. [Google Scholar] [CrossRef]
- Dalla Longa, F.; van der Zwaan, B. Heart of light: An assessment of enhanced electricity access in Africa. Renew. Sustain. Energy Rev. 2021, 136, 110399. [Google Scholar] [CrossRef]
- Reber, T.J.; Booth, S.S.; Cutler, D.S.; Li, X.; Salasovich, J.A. Tariff Considerations for Micro-Grids in Sub-Saharan Africa; National Renewable Energy Lab (NREL): Golden, CO, USA, 2018.
- Diemuodeke, O.E.; Mulugetta, Y.; Njoku, H.I.; Briggs, T.A.; Ojapah, M.M. Solar PV Electrification in Nigeria: Current Status and Affordability Analysis. J. Power Energy Eng. 2021, 9, 1–25. [Google Scholar] [CrossRef]
- Nsengimana, C.; Han, X.T.; Li, L.L. Comparative Analysis of Reliable, Feasible, and Low-Cost Photovoltaic Microgrid for a Residential Load in Rwanda. Int. J. Photoenergy 2020, 2020, 1–14. [Google Scholar] [CrossRef]
- Benalcazar, P.; Suski, A.; Kamiński, J. The effects of capital and energy subsidies on the optimal design of microgrid systems. Energies 2020, 13, 955. [Google Scholar] [CrossRef] [Green Version]
- Mannes, M. End-User Evaluation of Solar Home System as a Viable Energy System for Rural Development in South Africa. Master’s Thesis, Norwegian University of Life Sciences, Ås, Norway, 2017. [Google Scholar]
- Bailis, R.; Ezzati, M.; Kammen, D.M. Mortality and greenhouse gas impacts of biomass and petroleum energy futures in Africa. Science 2005, 308, 98–103. [Google Scholar] [CrossRef] [PubMed] [Green Version]
- Grieshop, A.P.; Marshall, J.D.; Kandlikar, M. Health and climate benefits of cookstove replacement options. Energy Policy 2011, 39, 7530–7542. [Google Scholar] [CrossRef]
- World Health Organization. Burden of Disease from Household Air Pollution for 2016; World Health Organization: Geneva, Switzerland, 2018. [Google Scholar]
- Winkler, H.; Simões, A.F.; La Rovere, E.L.; Alam, M.; Rahman, A.; Mwakasonda, S. Access and affordability of electricity in developing countries. World Dev. 2011, 39, 1037–1050. [Google Scholar] [CrossRef]
- Heltberg, R. Household Energy Use in Developing Countries: A Multicountry Study; ESMAP Technical Paper; The World Bank: Washington, DC, USA, 2003. [Google Scholar]
- Bacon, R.; Bhattacharya, S.; Kojima, M. Expenditure of Low-Income Households on Energy: Evidence from Africa and Asia; The World Bank: Washington, DC, USA, 2010. [Google Scholar]
- Batchelor, S.; Brown, E.; Scott, N.; Leary, J. Two birds, one stone—reframing cooking energy policies in Africa and Asia. Energies 2019, 12, 1591. [Google Scholar] [CrossRef] [Green Version]
- Batchelor, S. Solar Electric Cooking in Africa in 2020: A synthesis of the possibilities. Evid. Demand. 2015, 10, 12774. [Google Scholar]
- Energy Sector Management Assistance Program. Cooking with Electricity: A Cost Perspective; The World Bank Group: Washington, DC, USA, 2020. [Google Scholar]
- Sibhatu, K.T.; Qaim, M. Rural food security, subsistence agriculture, and seasonality. PLoS ONE 2017, 12, e0186406. [Google Scholar] [CrossRef] [Green Version]
- Muriithi, M.K.; Mutegi, R.G.; Mwabu, G. Counting unpaid work in Kenya: Gender and age profiles of hours worked and imputed wage incomes. J. Econ. Ageing 2017, 17, 100120. [Google Scholar] [CrossRef]
- Office of Management and Budget. Guidelines and Discount Rates for Benefit-Cost Analysis of Federal Programs (tech. rep. No. A-94). 1992. Available online: https://www.whitehouse.gov/sites/whitehouse.gov/files/omb/circulars/A94/a094.pdf (accessed on 31 May 2021).
- Hansen, K. Decision-making based on energy costs: Comparing levelized cost of energy and energy system costs. Energy Strategy Rev. 2019, 24, 68–82. [Google Scholar] [CrossRef]
- Breyer, C.; Gerlach, A. Global overview on grid-parity. Prog. Photovolt. Res. Appl. 2013, 21, 121–136. [Google Scholar] [CrossRef]
- Bilal, B.O.; Sambou, V.; Kébé, C.M.; Ndiaye, P.A.; Ndongo, M. Methodology to Size an Optimal Stand-Alone PV/wind/diesel/battery System Minimizing the Levelized cost of Energy and the CO2 Emissions. Energy Procedia 2012, 14, 1636–1647. [Google Scholar] [CrossRef] [Green Version]
- Jetter, J.; Zhao, Y.; Smith, K.R.; Khan, B.; Yelverton, T.; DeCarlo, P.; Hays, M.D. Pollutant emissions and energy efficiency under controlled conditions for household biomass cookstoves and implications for metrics useful in setting international test standards. Environ. Sci. Technol. 2012, 46, 10827–10834. [Google Scholar] [CrossRef] [PubMed]
- De Decker, K.; Collett, J. Well-tended fires outperform modern cooking stoves. Available online: https://www.lowtechmagazine.com/2014/06/thermal-efficiency-cooking-stoves.html (accessed on 14 July 2021).
- Food and Agriculture Organization of the United Nations. Wood Fuel Surveys; FAO: Rome, Italy, 1983; pp. 194–202. [Google Scholar]
- Wodon, Q.; Mark Blackden, C. (Eds.) Gender, Time Use, and Poverty in Sub-Saharan Africa; The World Bank: Washington, DC, USA, 2006. [Google Scholar]
- Bailis, R.; Pennise, D.; Ezzati, M.; Kammen, D.M.; Kituyi, E. Impacts of Greenhouse Gas and Particulate Emissions from Woodfuel Production and End-Use in Sub-Saharan Africa; University of California: Berkeley, CA, USA, 2004. [Google Scholar]
- Interagency Working Group on Social Cost of Carbon. Technical Support Document: Social Cost of Carbon, Methane, and Nitrous Oxide Interim Estimates under Executive Order 13990. 2021. Available online: https://www.whitehouse.gov/wp-content/uploads/2021/02/TechnicalSupportDocument_SocialCostofCarbonMethaneNitrousOxide.pdf (accessed on 14 July 2021).
- Šúri, M.; Cebecaur, C.; Skoczek, A. SolarGIS: Solar data and online applications for PV planning and performance assessment. In Proceedings of the 26th European Photovoltaics Solar Energy Conference, Hamburg, Germany, 5–9 September 2011. [Google Scholar]
- Van Buskirk, R. A Simplified Method for Calculating the Levelized Cost of Energy (LCOE) Using Amortization Factors. Available online: https://www.researchgate.net/publication/351853971_A_simplified_method_for_calculating_the_levelized_cost_of_energy_LCOE_using_amortization_factors (accessed on 15 July 2021).
- Lee, J.T.; Callaway, D.S. The cost of reliability in decentralized solar power systems in sub-Saharan Africa. Nat. Energy 2018, 3, 960–968. [Google Scholar] [CrossRef]
- Gius, G.; Walker, M.; Li, A.; Adams, N.J.; Van Buskirk, R.; Schwartz, P. Hot diodes!: Dirt cheap cooking and electricity for the global poor? Dev. Eng. 2019, 4, 100044. [Google Scholar] [CrossRef]
- Kachione, L.; Roberts, G.; Gilbert, C.; Majoni, J.; Kanyerere, R.; Van Buskirk, R. Customizing Malawi-Made Solar Electric Cooking Technology and Business Models to Provide Access to Very Low Income Villagers; Loughborough University: Loughborough, UK, 2020. [Google Scholar] [CrossRef]
- Hall, F.; Touzri, J.; Wußler, S.; Buqa, H.; Bessler, W.G. Experimental investigation of the thermal and cycling behavior of a lithium titanate-based lithium-ion pouch cell. J. Energy Storage 2018, 17, 109–117. [Google Scholar] [CrossRef]
- Van Buskirk, R. A Model-Based Methodology for Estimating the Efficiency of a Diode-Based Solar Electric Cooker. Available online: https://www.researchgate.net/publication/351867144_A_model-based_methodology_for_estimating_the_efficiency_of_a_diode-based_solar_electric_cooker (accessed on 15 July 2021).
- Van Buskirk, R. Estimating and Projecting Solar Panel Costs for Sub-Saharan Africa. Available online: https://www.researchgate.net/publication/351853878_Estimating_and_projecting_solar_panel_costs_for_Sub-Saharan_Africa (accessed on 15 July 2021).
- Solargis. Available online: https://solargis.com/maps-and-gis-data/download/africa (accessed on 1 June 2021).
- Van Buskirk, R. Estimating Lithium Titanate (LTO) Battery Costs for Sub-Saharan Africa. Available online: https://www.researchgate.net/publication/353261371_Estimating_lithium_titanate_LTO_battery_costs_for_Sub-_Saharan_Africa (accessed on 15 July 2021).
- Akerlof, G.A. The market for “lemons”: Quality uncertainty and the market mechanism. In Uncertainty in Economics; Academic Press: Cambridge, MA, USA, 1978; pp. 235–251. [Google Scholar]
- Höhne, N.; Blum, H.; Fuglestvedt, J.; Skeie, R.B.; Kurosawa, A.; Hu, G.; Lowe, J.; Gohar, L.; Matthews, B.; De Salles, A.C.; et al. Contributions of individual countries’ emissions to climate change and their uncertainty. Clim. Chang. 2011, 106, 359–391. [Google Scholar] [CrossRef]
- Müller, B.; Höhne, N.; Ellermann, C. Differentiating (historic) responsibilities for climate change. Clim. Policy 2009, 9, 593–611. [Google Scholar] [CrossRef]
- Beltramo, T.; Levine, D.; Blalock, G. The effect of marketing messages, liquidity constraints, and household bargaining on willingness to pay for a nontraditional cookstove. Technology 2014, 44, 4426–4432. [Google Scholar]
- Bensch, G.; Grimm, M.; Peters, J. Why do households forego high returns from technology adoption? Evidence from improved cooking stoves in Burkina Faso. J. Econ. Behav. Organ. 2015, 116, 187–205. [Google Scholar] [CrossRef]
Figure 1.
Distribution of opportunity and environmental costs of wood fuel based on cost input parameters provided in
Table 1. The upper curve represents a social cost of carbon of USD 56/tCO
2e, the middle curve represents a GHG cost of USD 20/tCO
2e, and the lower points represent no environmental cost of wood use.
Figure 2.
Both marginal and average cooking system efficiency for a 4-L cooker analyzed in this study where water is drawn from the cooker two times per day.
Figure 2.
Both marginal and average cooking system efficiency for a 4-L cooker analyzed in this study where water is drawn from the cooker two times per day.
Figure 3.
Three potential MLCOE distributions for the cost of wood cooking energy. For each case, WC MLCOE is calculated for all combinations of input parameters and then given a percentile rank relative to the set of all value combinations. Note that the vertical axis has logarithmic scaling.
Figure 3.
Three potential MLCOE distributions for the cost of wood cooking energy. For each case, WC MLCOE is calculated for all combinations of input parameters and then given a percentile rank relative to the set of all value combinations. Note that the vertical axis has logarithmic scaling.
Figure 4.
Average efficiency vs. solar panel capacity for a DDS cooker and water heater for two different use cases. In the more efficient use case, water is drawn from the cooker twice per day at noon and 5 p.m. In the less efficient use case, water is drawn once per day at 4 p.m.
Figure 4.
Average efficiency vs. solar panel capacity for a DDS cooker and water heater for two different use cases. In the more efficient use case, water is drawn from the cooker twice per day at noon and 5 p.m. In the less efficient use case, water is drawn once per day at 4 p.m.
Figure 5.
Marginal efficiency vs. solar panel capacity for a DDS cooker and water heater for two different use case. In the more efficient use case, water is drawn from the cooker twice per day at noon and 5 p.m., and in the less efficient use case, water is drawn once per day at 4 p.m.
Figure 5.
Marginal efficiency vs. solar panel capacity for a DDS cooker and water heater for two different use case. In the more efficient use case, water is drawn from the cooker twice per day at noon and 5 p.m., and in the less efficient use case, water is drawn once per day at 4 p.m.
Figure 6.
Marginal efficiency vs. average water output temperature for a DDS cooker used as a water heater. Here, we measure performance reliability in terms of the average temperature of the water heated in the cooker when it is drawn from the cooker. On cloudy days, the DDS cooker does not heat its contents to boiling temperature by the time the water is drawn. A system with a large solar panel (and low utilization efficiency) reliably heats the cooker contents to near-boiling temperature.
Figure 7.
MLCOE distribution of DDS SEC compared with WC MLCOE. The SEC MLCOE is the central distribution illustrated with the green circles. The high cost WC case is illustrated with the triangles, while the low-cost WC case is illustrated with the squares. Note that the vertical axis has logarithmic scaling.
Figure 8.
Marginal battery utilization efficiency and demand reliability as a function of battery capacity in a DDS LTO SEC system. Two types of battery utilization efficiency are illustrated. The upper curve is the incremental Wh of total daily battery output divided by the incremental Wh of battery capacity. The lower curve is the incremental of newly utilized solar panel output (i.e., total output minus the Wh diverted from DDS loads) divided by the incremental Wh of battery capacity. Net newly utilized electricity represents additional DDS LTO SEC energy consumption that is enabled by the incremental increase in battery capacity with no increase in solar panel capacity.
Figure 9.
MLCOE distribution for LTO-battery-regulated electricity in a DDS SEC compared with the MLCOE distribution for unregulated DDS electricity. The LTO MLCOE is the distribution illustrated with the green circles. The DDS electricity cost is illustrated with the triangles. DDS electricity tends to be about 45% less expensive than LTO-regulated electricity. Note that the vertical axis has logarithmic scaling.
Figure 10.
MLCOE distribution for EPC electricity savings in a DDS LTO SEC compared with the MLCOE distribution for regulated LTO electricity. The MLCOE of EPC electricity savings is approximately 1/3 of the cost of LTO-regulated electricity and is about 35% less costly than DDS electricity. The median EPC savings MLCOE is USD 0.08/kWh. Note that the vertical axis has logarithmic scaling.
Table 1.
Input parameter ranges for estimating the opportunity cost of wood fuel. One head load is 25 kg.
Table 1.
Input parameter ranges for estimating the opportunity cost of wood fuel. One head load is 25 kg.
| Parameter Value Scenario | Opportunity Cost of Labor 1 (USD/Day) | Labor per Head Load 2 (Hours) | CO2-Equivalent Emissions Impact per kg of Wood Use (kg/kg) |
|---|
| Low | USD 2 | 1.5 | 0.5 |
| Medium | USD 4 | 2.5 | 1.5 |
| High | USD 8 | 5 | 3.0 |
Table 2.
WC MLCOE input parameters for calculation of the cost distribution in the WC high-cost case.
Table 2.
WC MLCOE input parameters for calculation of the cost distribution in the WC high-cost case.
| Parameter Value Scenario | Cooker Efficiency | Fuel Cost * (USD/kg) | Fuel Heat Content (kJ/kg) |
|---|
| Low | 9% | USD 0.07 | 12 |
| Medium | 12% | USD 0.15 | 14 |
| High | 15% | USD 0.25 | 16 |
Table 3.
WC MLCOE input parameters for calculation of the cost distribution in the WC low-cost case.
Table 3.
WC MLCOE input parameters for calculation of the cost distribution in the WC low-cost case.
| Parameter Value Scenario | Cooker Efficiency | Fuel Cost * (USD/kg) | Fuel Heat Content (kJ/kg) |
|---|
| Low | 12% | USD 0.02 | 16 |
| Medium | 17% | USD 0.06 | 17 |
| High | 25% | USD 0.15 | 18 |
Table 4.
WC MLCOE input parameters for calculation of the cost distribution in the WC medium-cost case.
Table 4.
WC MLCOE input parameters for calculation of the cost distribution in the WC medium-cost case.
| Parameter Value Scenario | Cooker Efficiency | Fuel Cost * (USD/kg) | Fuel Heat Content (kJ/kg) |
|---|
| Low | 10% | USD 0.05 | 15 |
| Medium | 15% | USD 0.10 | 16 |
| High | 20% | USD 0.17 | 17 |
Table 5.
MLCOE input parameter ranges for calculation of the cost distribution for DDS SEC.
Table 5.
MLCOE input parameter ranges for calculation of the cost distribution for DDS SEC.
| Parameter Value Scenario | Marginal Efficiency | Solar Panel Cost (USD/W) | Present Worth Factor | Solar Resource (Wh/Year)/W |
|---|
| Low | 10% | USD 0.22 | 4.8 | 1200 |
| Medium | 25% | USD 0.36 | 8.5 | 1500 |
| High | 40% | USD 0.50 | 13.3 | 1800 |
Table 6.
MLCOE input parameter ranges for estimating LTO-regulated electricity costs in a DDS SEC.
Table 6.
MLCOE input parameter ranges for estimating LTO-regulated electricity costs in a DDS SEC.
| Parameter Value Scenario | Battery Combined Daily Efficiency & Utilization ([WhToFood/Day]/Whbatt) | Battery Cost (USD/Wh) | Present Worth Factor |
|---|
| Low | 20% | USD 0.25 | 4.8 |
| Medium | 60% | USD 0.35 | 8.5 |
| High | 120% | USD 0.50 | 13.3 |
Table 7.
MLCOE input parameter ranges for estimating EPC electricity savings costs in a DDS LTO SEC.
Table 7.
MLCOE input parameter ranges for estimating EPC electricity savings costs in a DDS LTO SEC.
| Parameter Value Scenario | EPC Savings (WhToFood/Day) | EPC Cost (USD/ea) | Present Worth Factor |
|---|
| Low | 100 | USD 20 | 3.9 |
| Medium | 200 | USD 40 | 6.7 |
| High | 500 | USD 80 | 9.2 |
| Publisher’s Note: MDPI stays neutral with regard to jurisdictional claims in published maps and institutional affiliations. |
© 2021 by the authors. Licensee MDPI, Basel, Switzerland. This article is an open access article distributed under the terms and conditions of the Creative Commons Attribution (CC BY) license (https://creativecommons.org/licenses/by/4.0/).


