
Environmental Hotspot Assessment for a PV Mini-Grid Design: A Case Study for Malawi

Centre for Environment and Sustainability, University of Surrey, Guildford GU2 7XH, UK
Energies 2021, 14(14), 4227; https://doi.org/10.3390/en14144227
Submission received: 24 May 2021
/
Revised: 28 June 2021
/
Accepted: 7 July 2021
/
Published: 13 July 2021
(This article belongs to the Special Issue Clean Energy Innovations: Challenges and Strategies for Low and Middle Income Countries)
Abstract
:The United Nations Sustainable Goal 7, access to affordable and clean energy, is unlikely to be achieved, with an estimated 600 million people still without access to electricity by 2030. One potential route to support this goal is through the use of mini-grids to provide electricity in densely populated rural areas for which grid connection is not possible. This paper presents the results of a life cycle assessment of a mini-grid, designed for construction in Malawi. It analyses the cradle to end of use for this mini-grid configuration, for a grid sized for lighting, refrigeration and phone charging, and for a grid sized for electric cooking (e-cooking). The results suggest that for lighting configuration, the main contributors to environmental impact are the poles, the overhead cabling, and the PV panels. The use of a chromium-based preservative is the main issue for the poles, and a switch to concrete poles can deliver significant benefits. When the grid is sized for e-cooking, the PV panels become the greatest contributor. Adding a diesel generator to the mini-grid configuration can reduce number of panels required and hence the environmental impact, but only if the generator is used for no more than 2 h per day.
1. Introduction
The United Nations Sustainable Development Goal 7 [1] targets access to affordable, reliable, sustainable, and modern energy by 2030 and to date, good progress has been made in recent years towards achieving electrification across the globe. The number of people without access dropped from 1.2 billion in 2010 to 789 million in 2018, equating to an increase in access from 83% to 90% [2]. However, under current policies, and taking into account the effect of the Coronavirus pandemic, it is estimated that more than 600 million people will remain without access to electricity by 2030. The vast majority of these people will be in Sub-Saharan Africa.
The health benefits of electric cooking (e-cooking) over traditional fuels such as firewood and charcoal has been well established [2]; reduced exposure to household air pollution and reduced time and effort for cooking fuel collection, and recent work has also shown that the costs associated with e-cooking are now comparable to traditional fuels and Liquified Petroleum Gas (LPG) in some cases. [3]. However, the environmental benefits of this transition are highly dependent on location, fuels used, and foods traditionally cooked. For urban locations, connection to existing grid systems is a sensible way forward, although again dependent on the capacity of the grid to provide the necessary higher loads to support e-cooking in a robust and consistent manner. In rural areas, grid electricity may not be an option, and thus local generation systems are of key interest. Community mini-grid or Solar Home System (SHS) offer the two routes to achieve this.
Mini-grids offer a potential solution to electrification for rural areas with reasonably high population density and demand. They are a cheaper option to expanding main grids because of the significant infrastructure requirements necessary for main grids, and capital costs for mini-grids have been and are expected to continue to decline [4]. Photovoltaic (PV) and PV hybrid mini-grids also have the potential to achieve positive environmental benefits, through avoided carbon dioxide (CO2) emissions.
Estimation of the environmental benefits of mini-grid systems (PV, PV/hybrid, PV/Wind) has been a topic of interest in recent years, and attention has tended to focus on the power producing aspects of the systems and energy storage aspects, examples of which can be seen in references [5,6,7,8,9,10,11]. What is clear from these studies is that comparisons of the results generated are problematic, as the system boundaries (such as the inclusion or exclusion of the supporting equipment for a mini-grid system), choice of battery technology, efficiency of PV panels, etc., all vary. Additionally, data for batteries and PV panels vary in completeness and quality, as some of the technologies used are still developing, and in some cases, full data sets are not in the public domain [12]. Taken together, this suggests that the appropriateness of a mini-grid installation can only be assessed on a case-by-case basis.
This paper analyses the environmental impacts based on a mini-grid agreed for construction in Malawi. The mini-grid was originally designed to provide electricity for lighting and refrigeration for business applications, coupled with domestic connections for lighting and phone charging, and the initial assessment focused on the impacts associated with this configuration. To expand the analysis to understand the issues surrounding environmental impacts associated with mini-grid applications that include the capacity for e-cooking, greater PV and energy storage capacity was required, and further analysis has been undertaken with the battery and PV appropriately sized to accommodate this.
2. Materials and Methods
The study was conducted following the principles outlined in BS/EN ISO 14040 and 14044 [13,14]. The Simapro software (PRé Sustainability, Amersfoot, The Netherlands) and ecoinvent databases (ecoinvent, Zurich, Switzerland) were used to create the model of the mini-grid, and a bill of materials (BoM) for the mini-grid was provided by University of Strathclyde [15,16], see Table A1 for BoM. Component weights and component surface areas (for coatings) have been calculated from component dimensions, where direct weighing was not an option.
The study used a cradle to end of use approach, thus no end-stage impacts have been accounted for. Assumed lifetimes for the components of the mini-grid are provided in Table A2 in Appendix A. Details for the sub models built for the mini-grid assessment can be found in the Supplementary Materials. The functional unit for the study is one lifetime of the mini-grid, assumed to be 20 years.
The purpose of the assessment was to identify the key contributors, or hotspots, to the environmental impact for this mini-grid and to use these to draw some generalized conclusions with regard to the design of mini-grids. Scenario analysis was used to assess different options for those parts of the model that were associated with high impact.
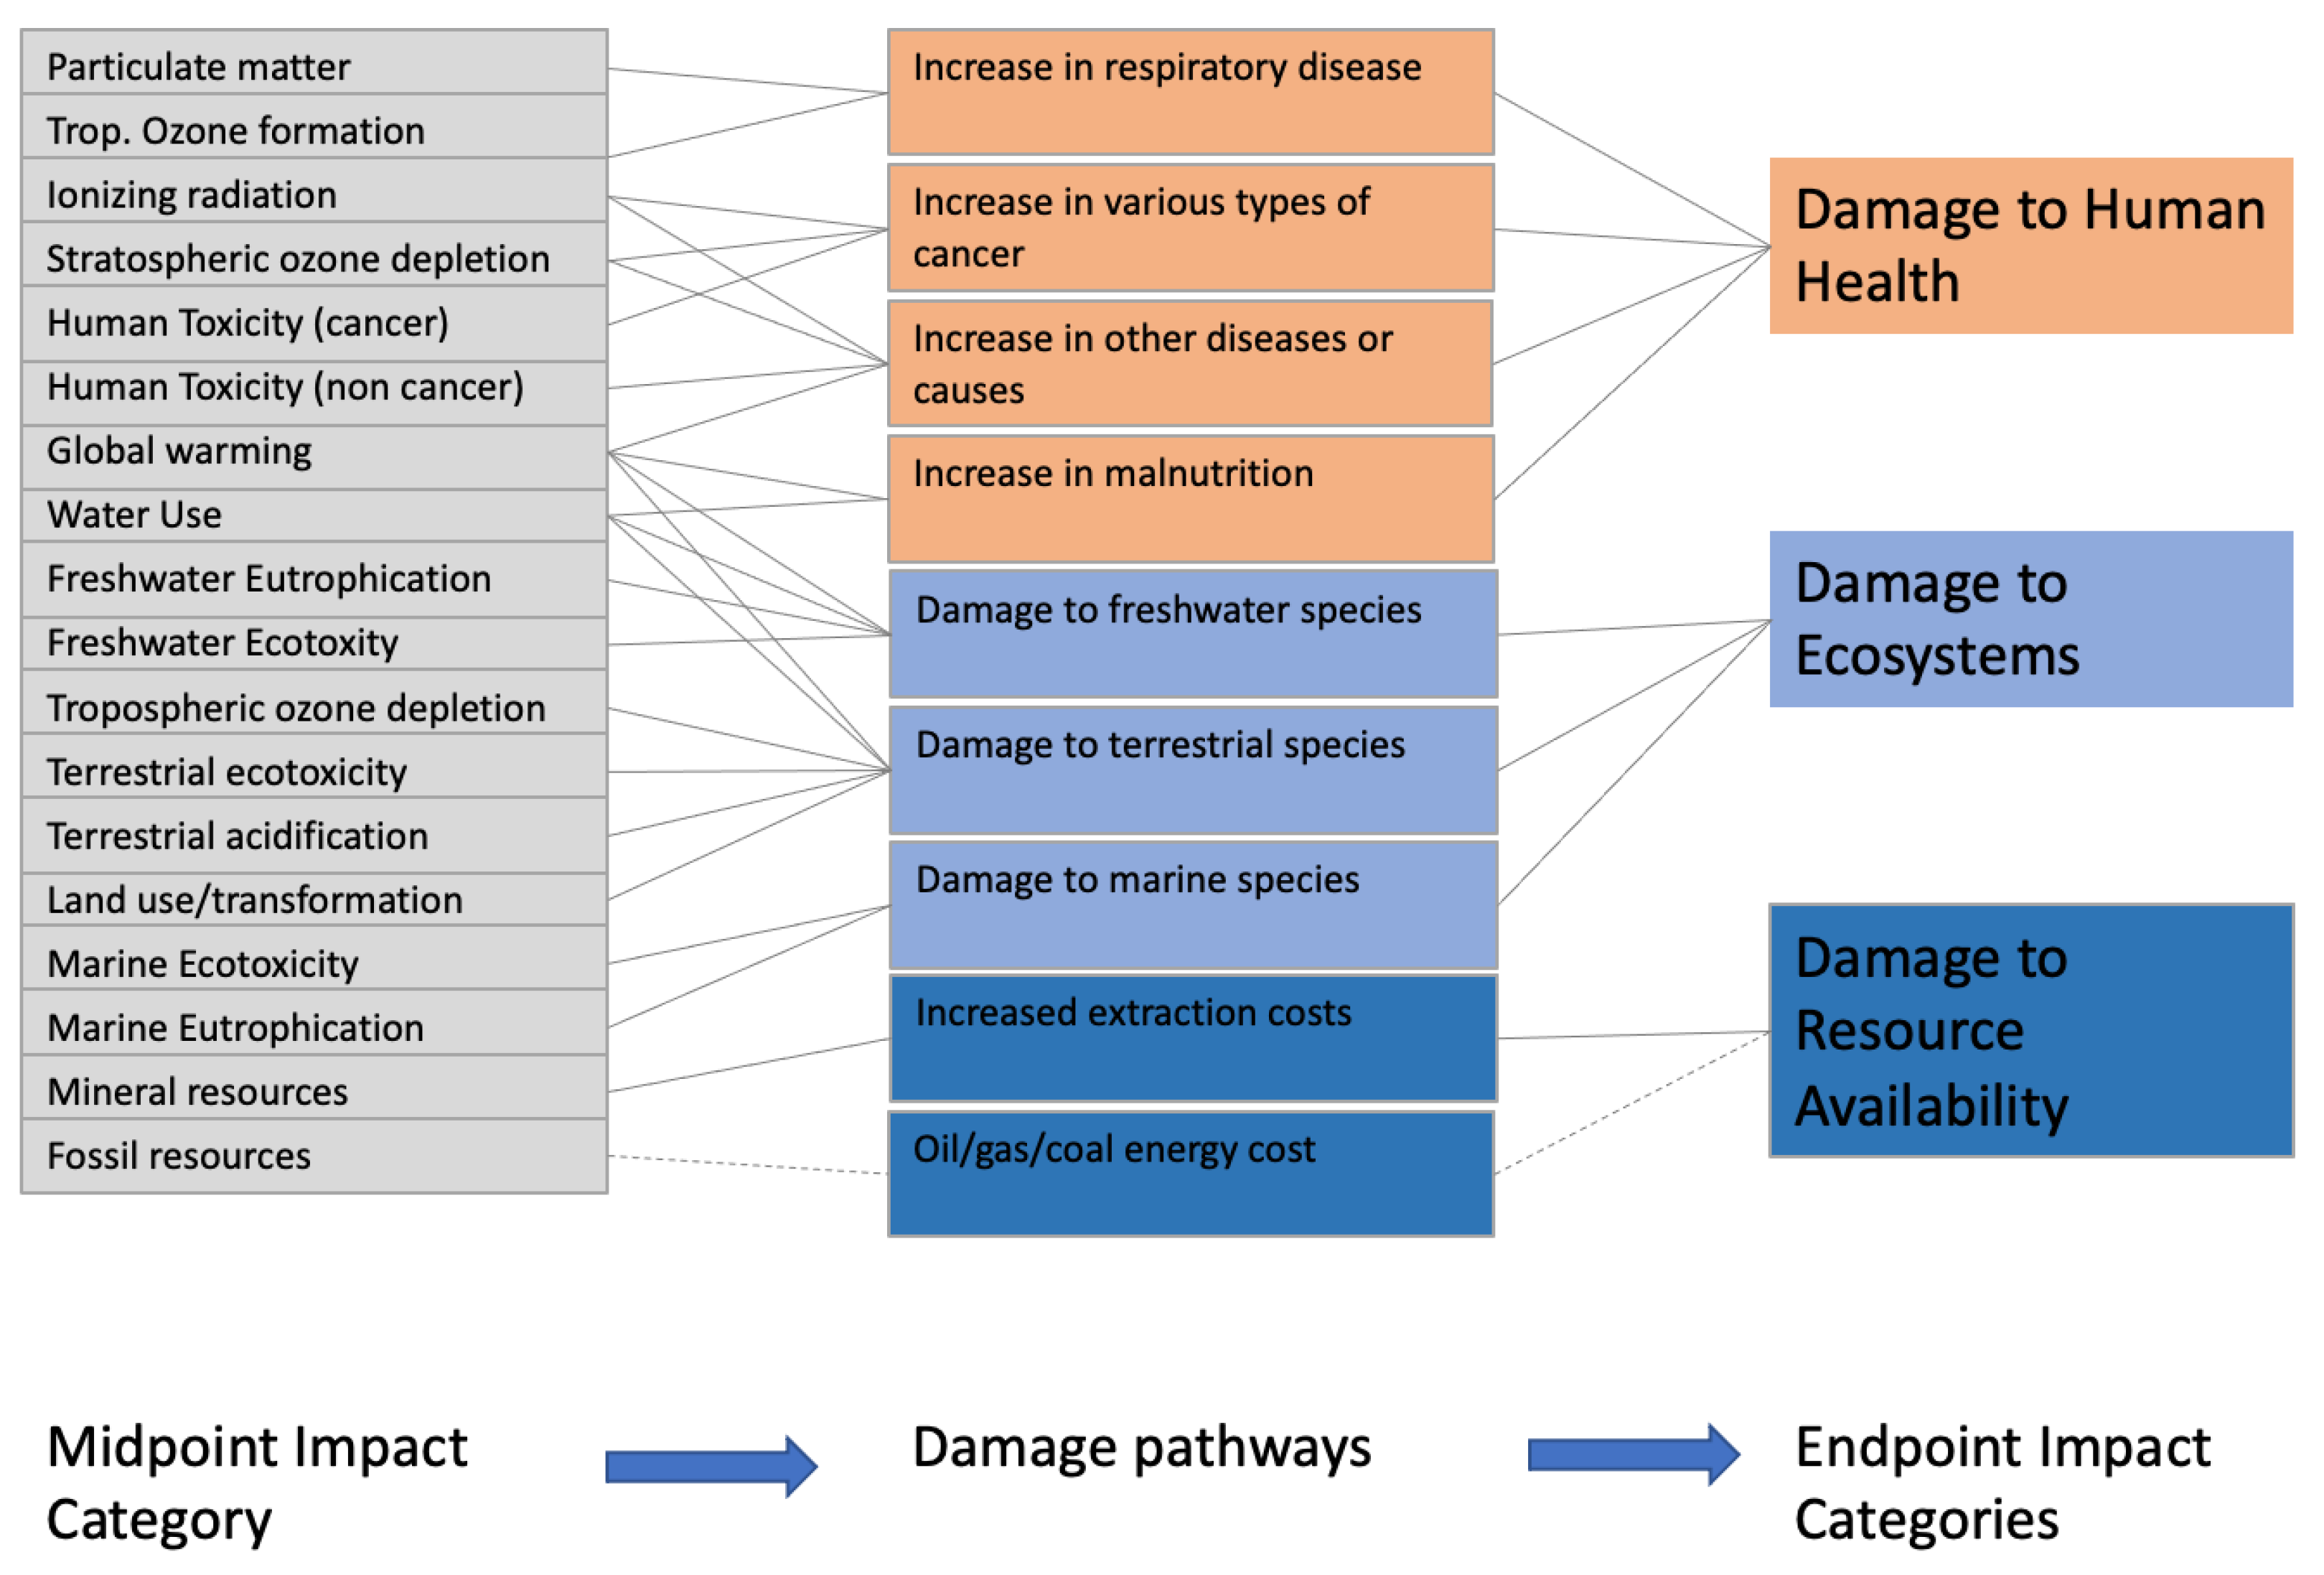
Currently, there are no environmental assessment systems that focus specifically on the output to impact pathways for the African continent. For global impacts, such as climate change, this was not a concern. However, for local pathways and associated impacts, the different regions can affect the potential impacts created. The ReCiPe system [17], (which was built on CML 2002 and Eco indicator 99 systems) can be used for global contexts and was thus used to assess the midpoint and endpoint environmental categories. The Hierarchist perspective was taken, understood to be the consensus model, and is based on the most common policy principles with regards to the timeframe for impacts and other issues. It is the default model. [18] The endpoint results are normalized to the global per capita impact for each category; damage to human health, damage to ecosystems, and damage to resource availability. Figure 1 shows the relationship between the 18 midpoint and three endpoint categories.
3. Results
This section details the results from the life cycle assessment study. The contribution analysis identifies which of the items in the construction of the mini-grid have the highest environmental impacts. The scenario analysis shows how these impacts may be reduced by utilizing alternative materials or components.
3.1. Contribution Analysis
3.1.1. Mini-Grid Sized for Lighting, Phone Charging, and Refrigeration
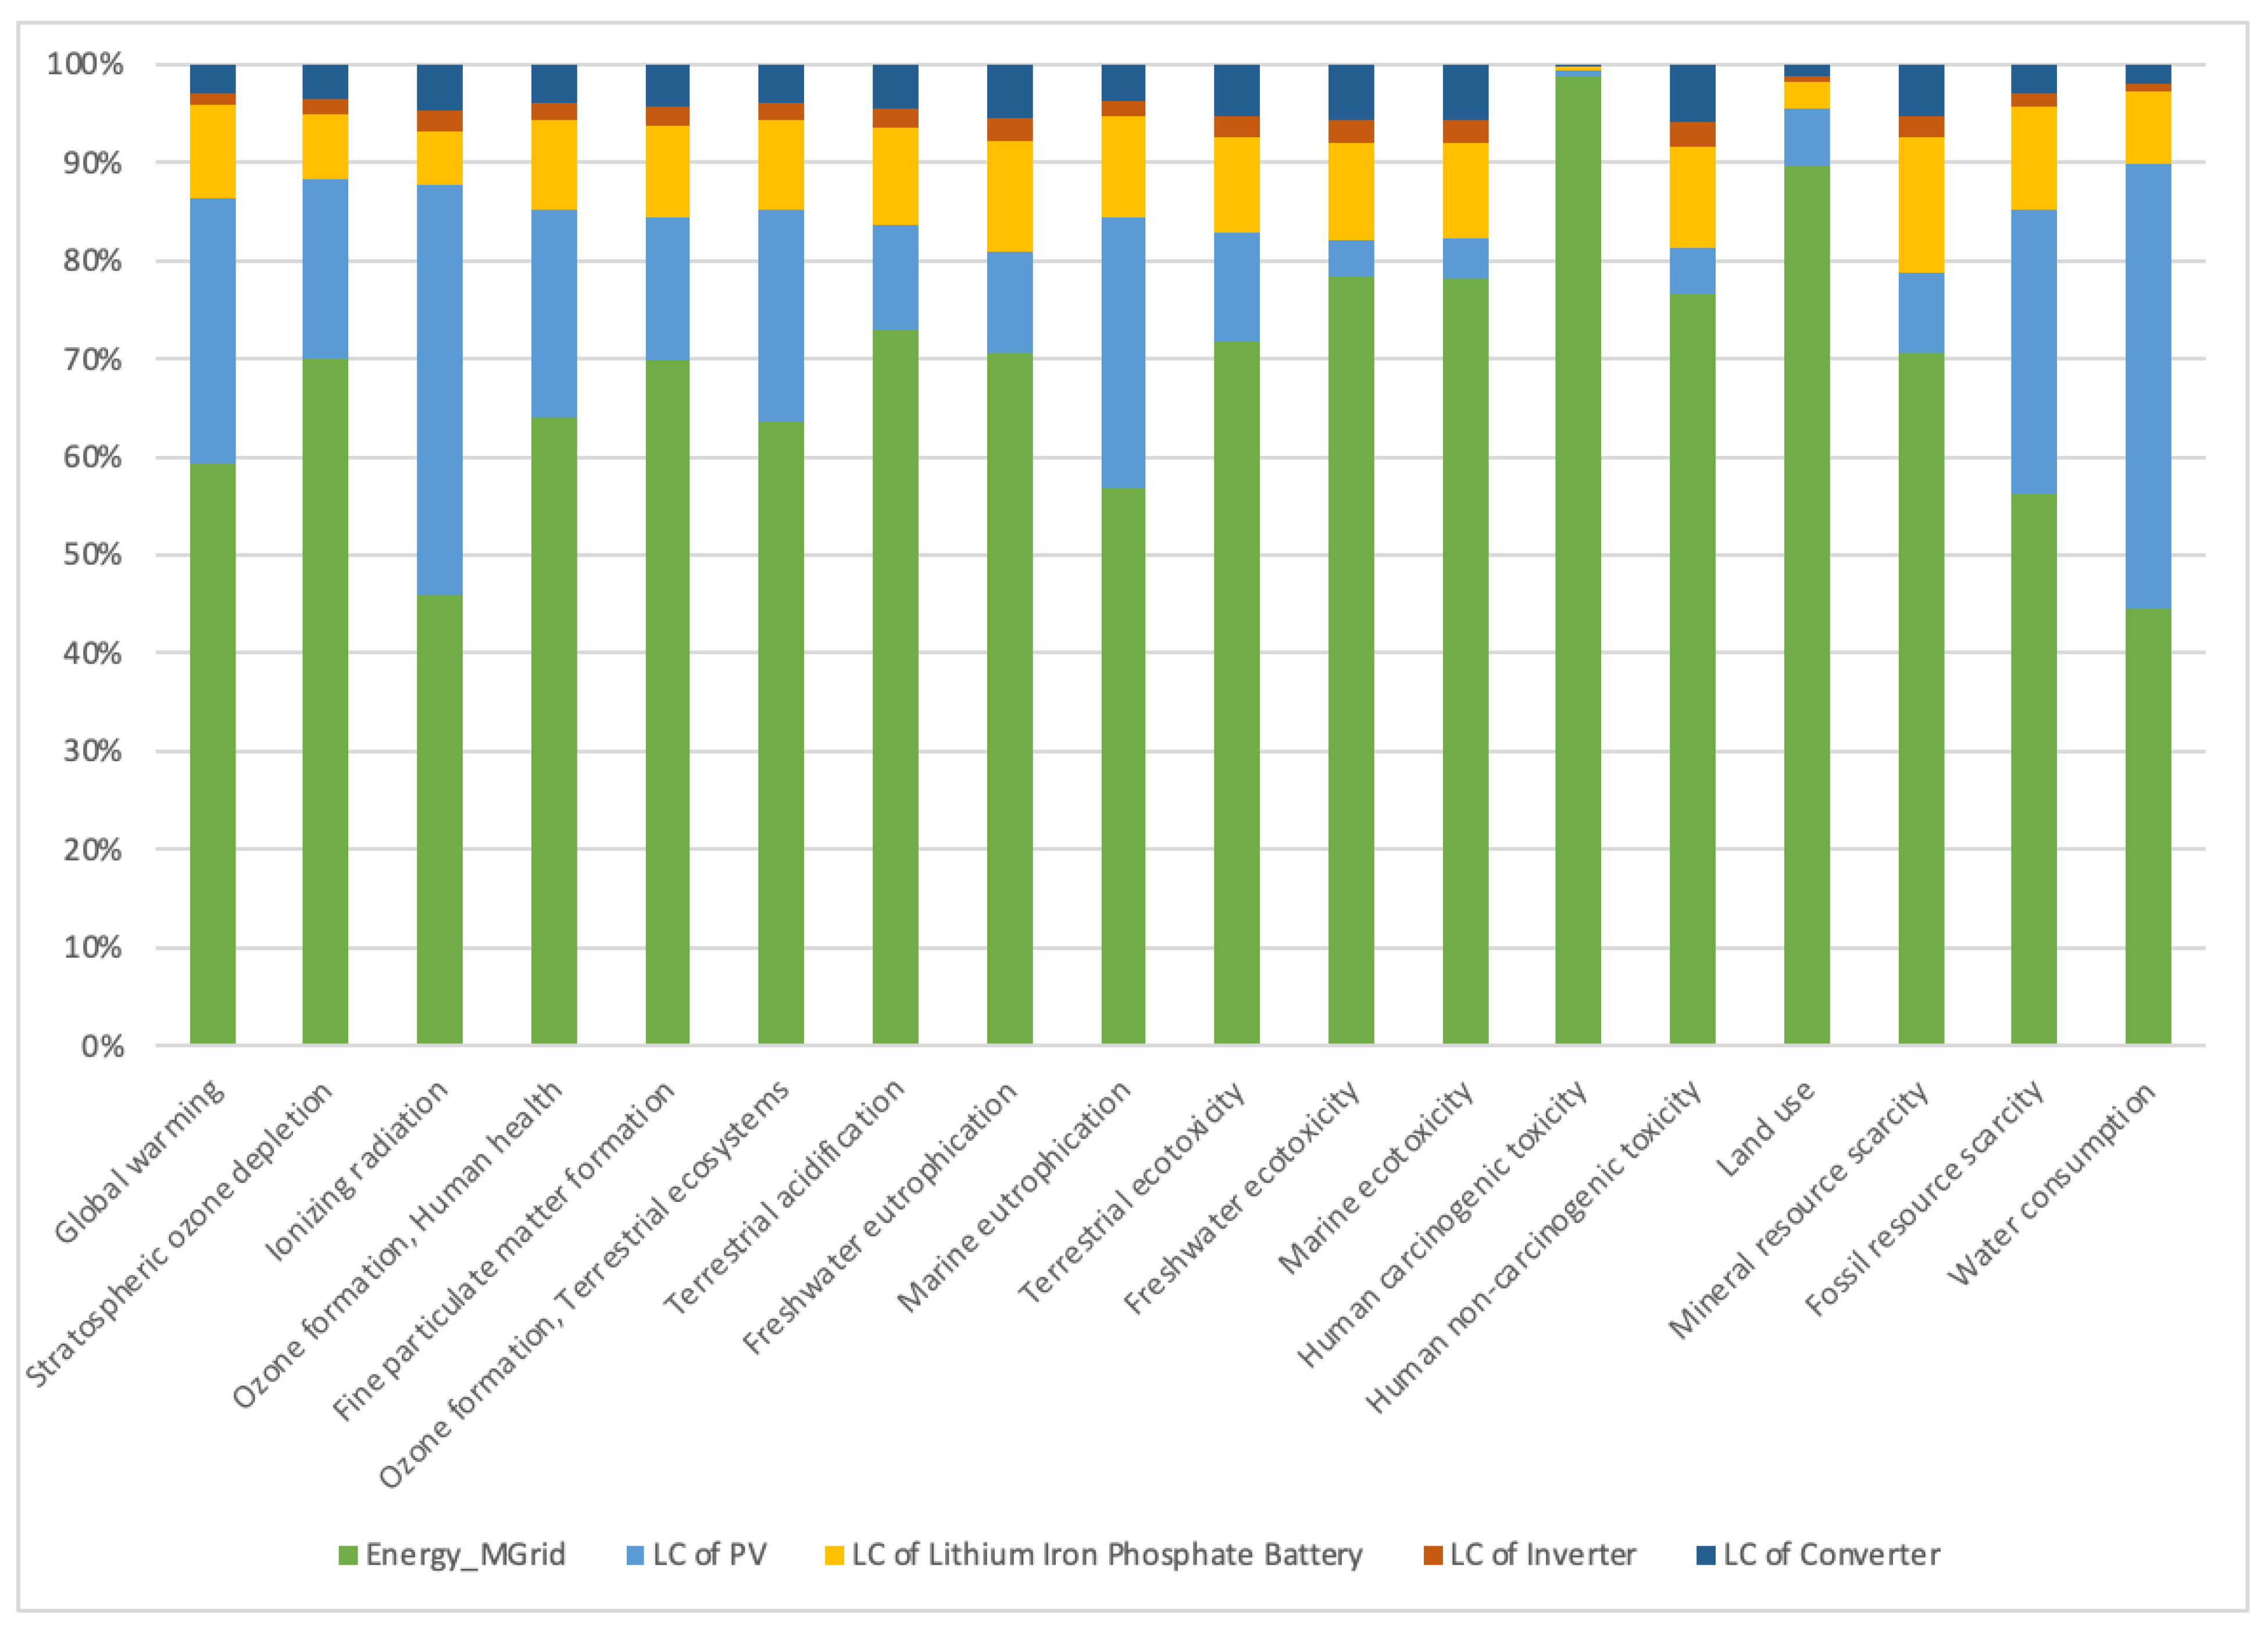
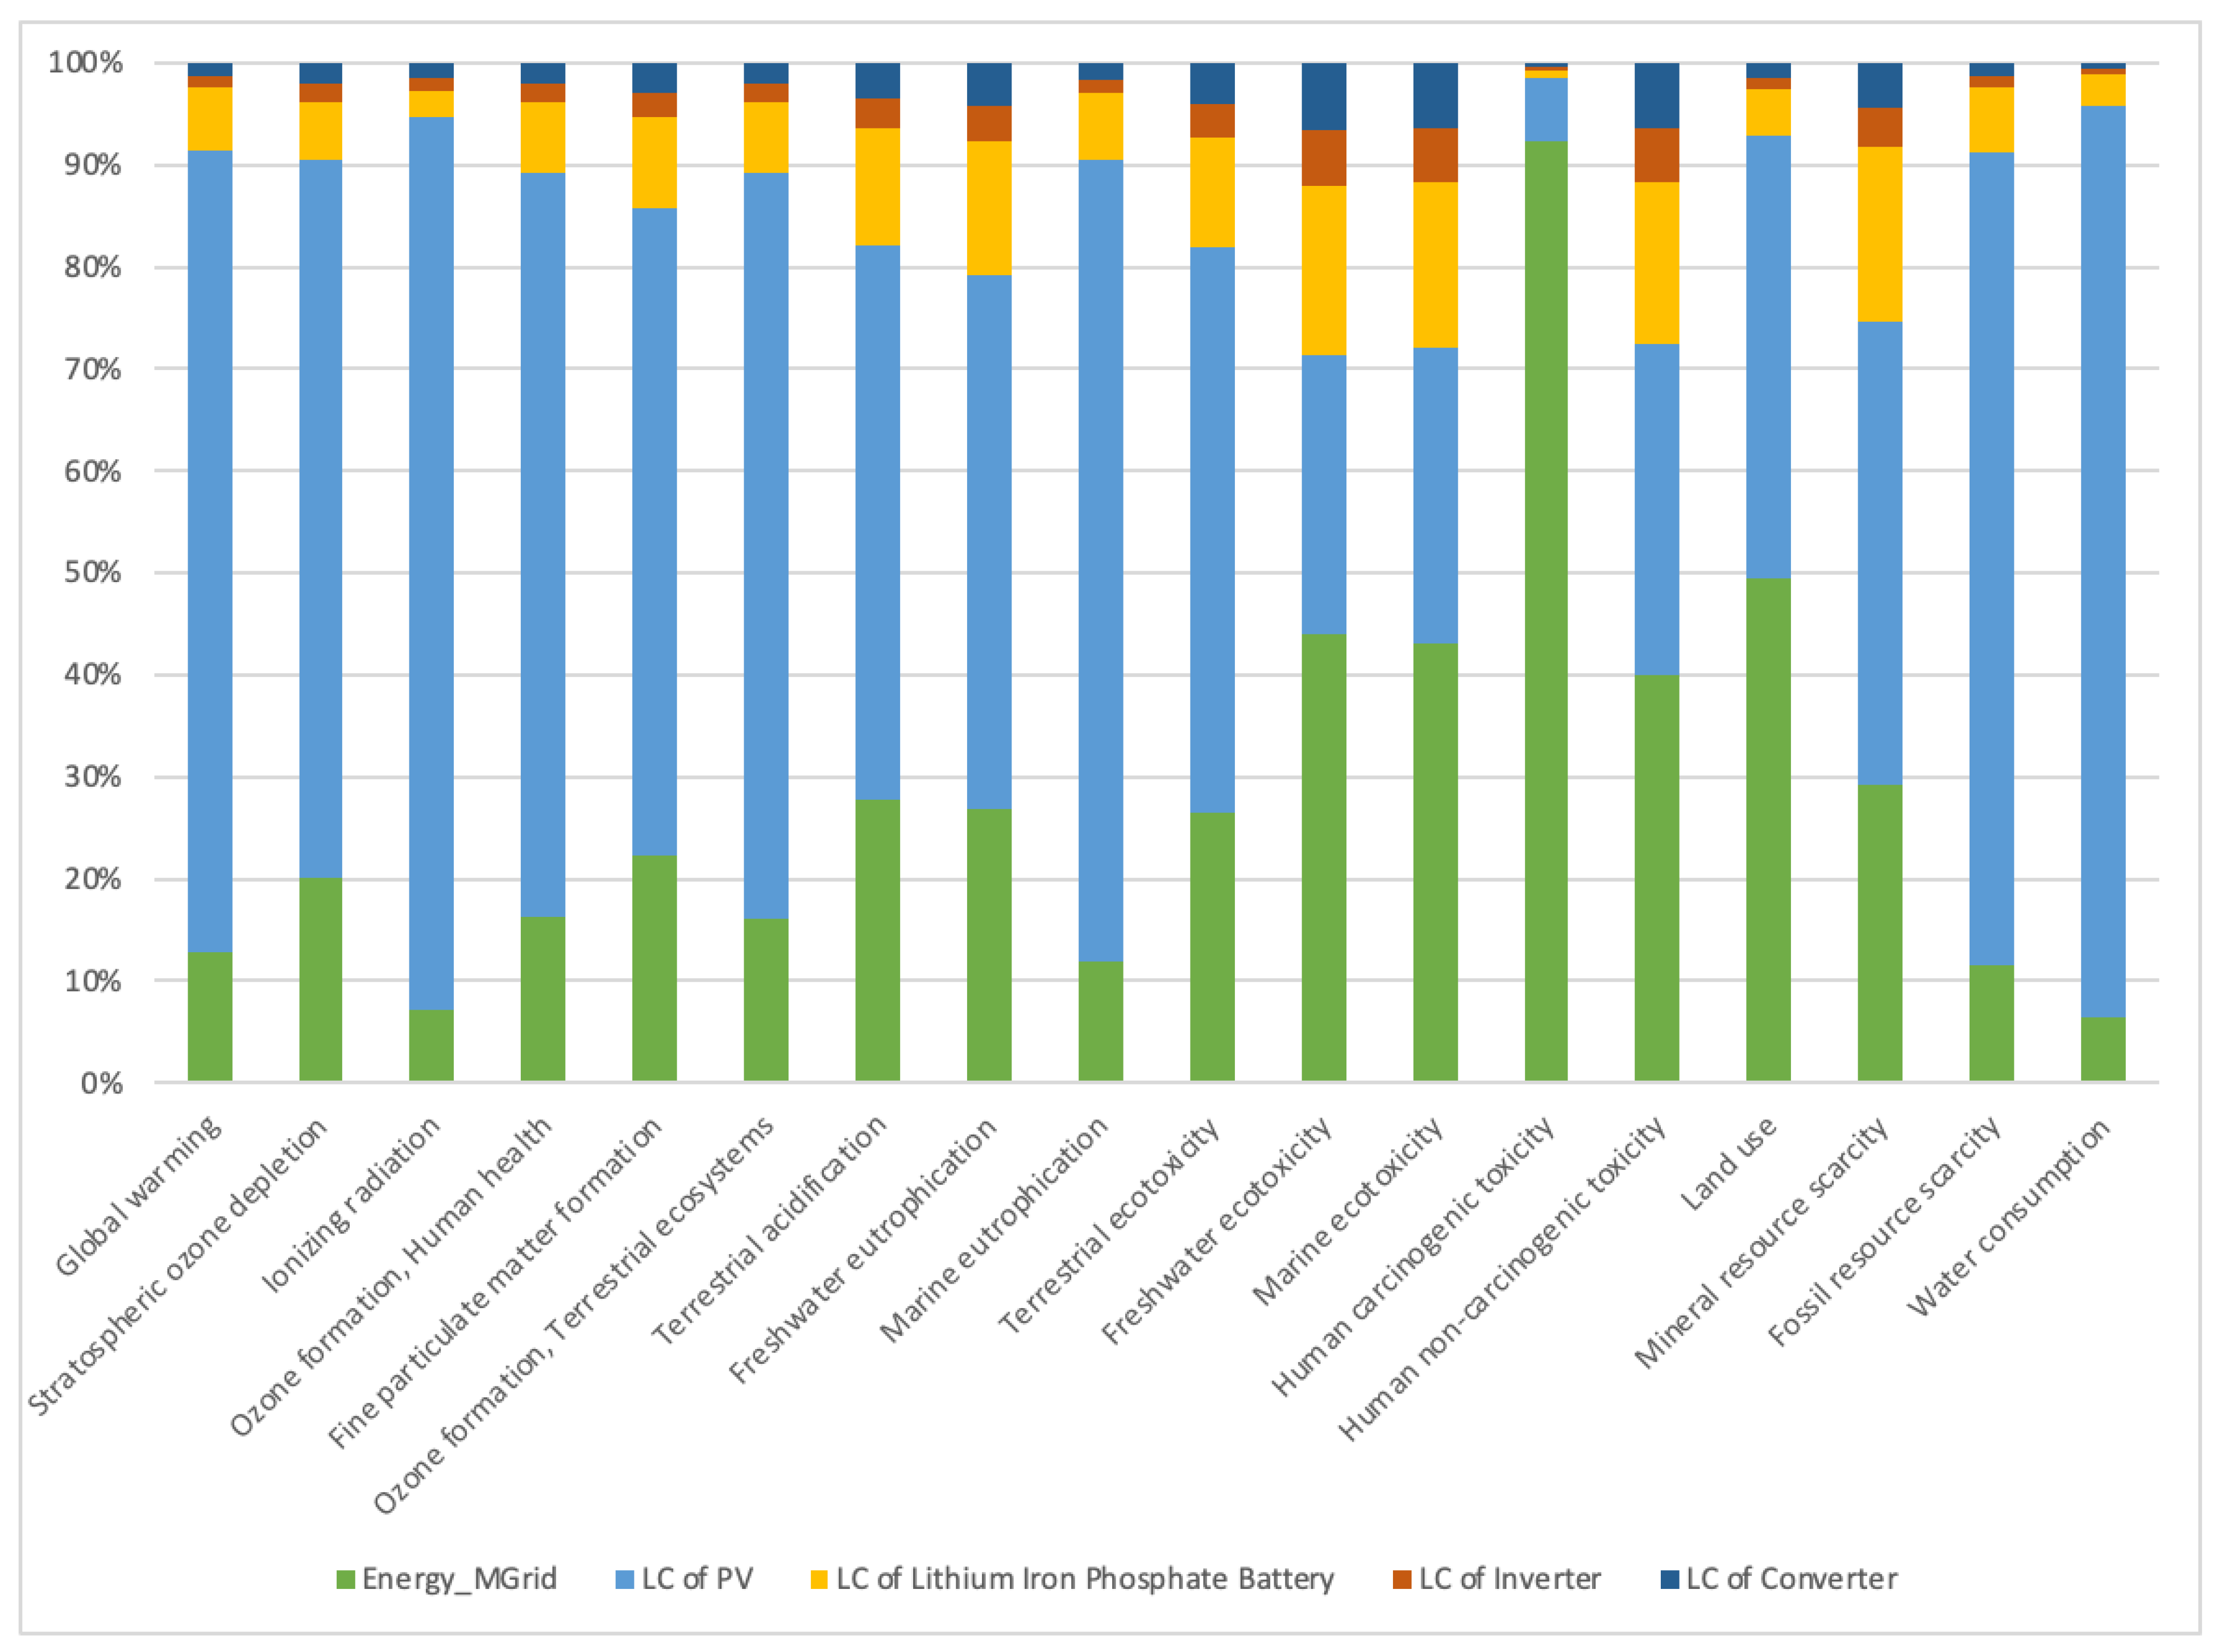
Figure 2 shows which main component groups contributed the most to the environmental impact. The Energy_MGrid (green), (which covers all equipment other than the power generating system) and the PV life cycle (light blue), were seen to have the greatest contribution to the midpoint environmental impact categories. Of particular note was the very high contribution of the human carcinogenic impact from the Energy_MGrid. The lithium iron phosphate battery (yellow), inverter (dark orange), and converter (dark blue), were seen to contribute relatively little by comparison. This is somewhat surprising, and the result could be attributed to a number of factors. Each mini-grid will have a unique configuration of component sizing, depending on its designed use. The battery size specified for this grid was small. There are many chemistries for lithium-ion batteries (LIB), and each chemistry has different charge/discharge profiles that can affect the sizing needed. There is also considerable variation in the literature with respect to the life cycle environmental impacts from lithium batteries. Ellingsen [19] demonstrated considerable differences in calculated GHG emissions (from 38–336 kg CO2 eq/kWh), and thus the choice of battery chemistry and assumptions made in evaluating the impacts could have a significant effect on these results.
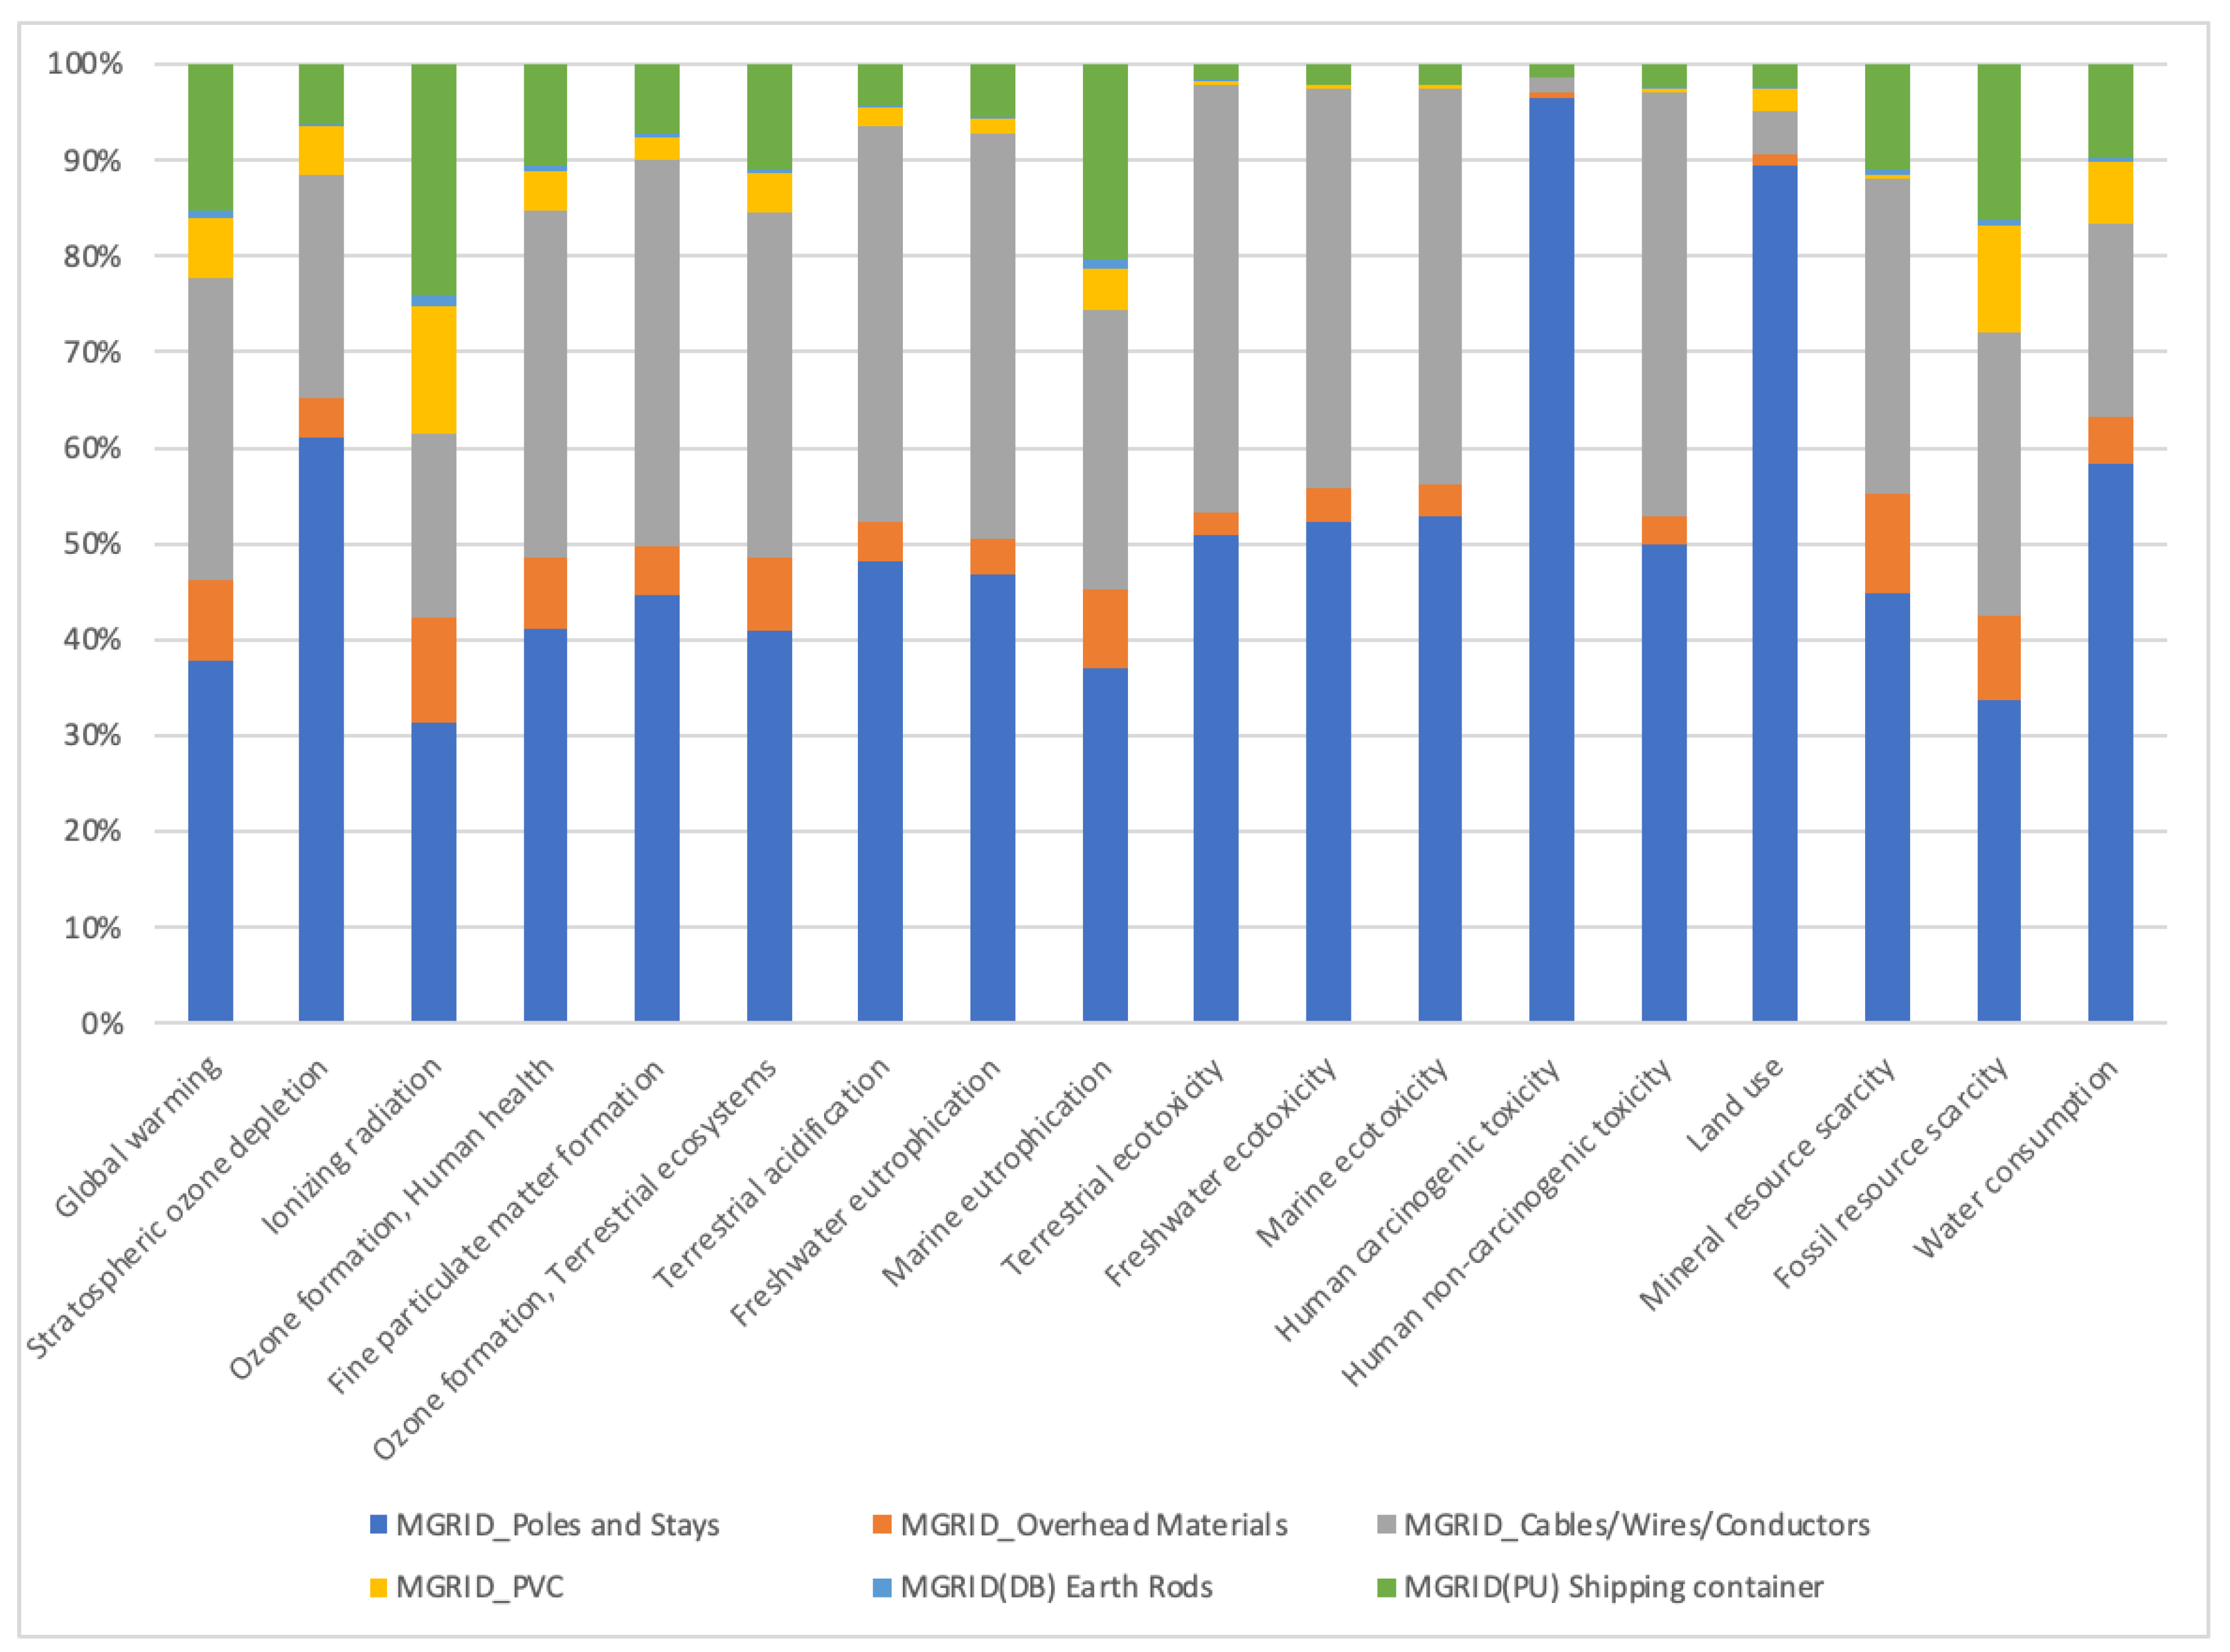
Analysing the Energy_MGrid system more closely, Figure 3 shows there were two sub groups of components of potential interest: the poles and stays and the cabling system. Between them, these two sub groups accounted for more than 70% of the impact across most of the midpoint categories. The overhead materials (not cables), PVC products, and earth rods contributed very little to the overall impact, and the shipping container (which houses the control equipment for the mini-grid) contributed more than 10% to only four midpoint categories. From Figure 3, it was seen that the high contribution to human carcinogenicity came from the poles and stays.
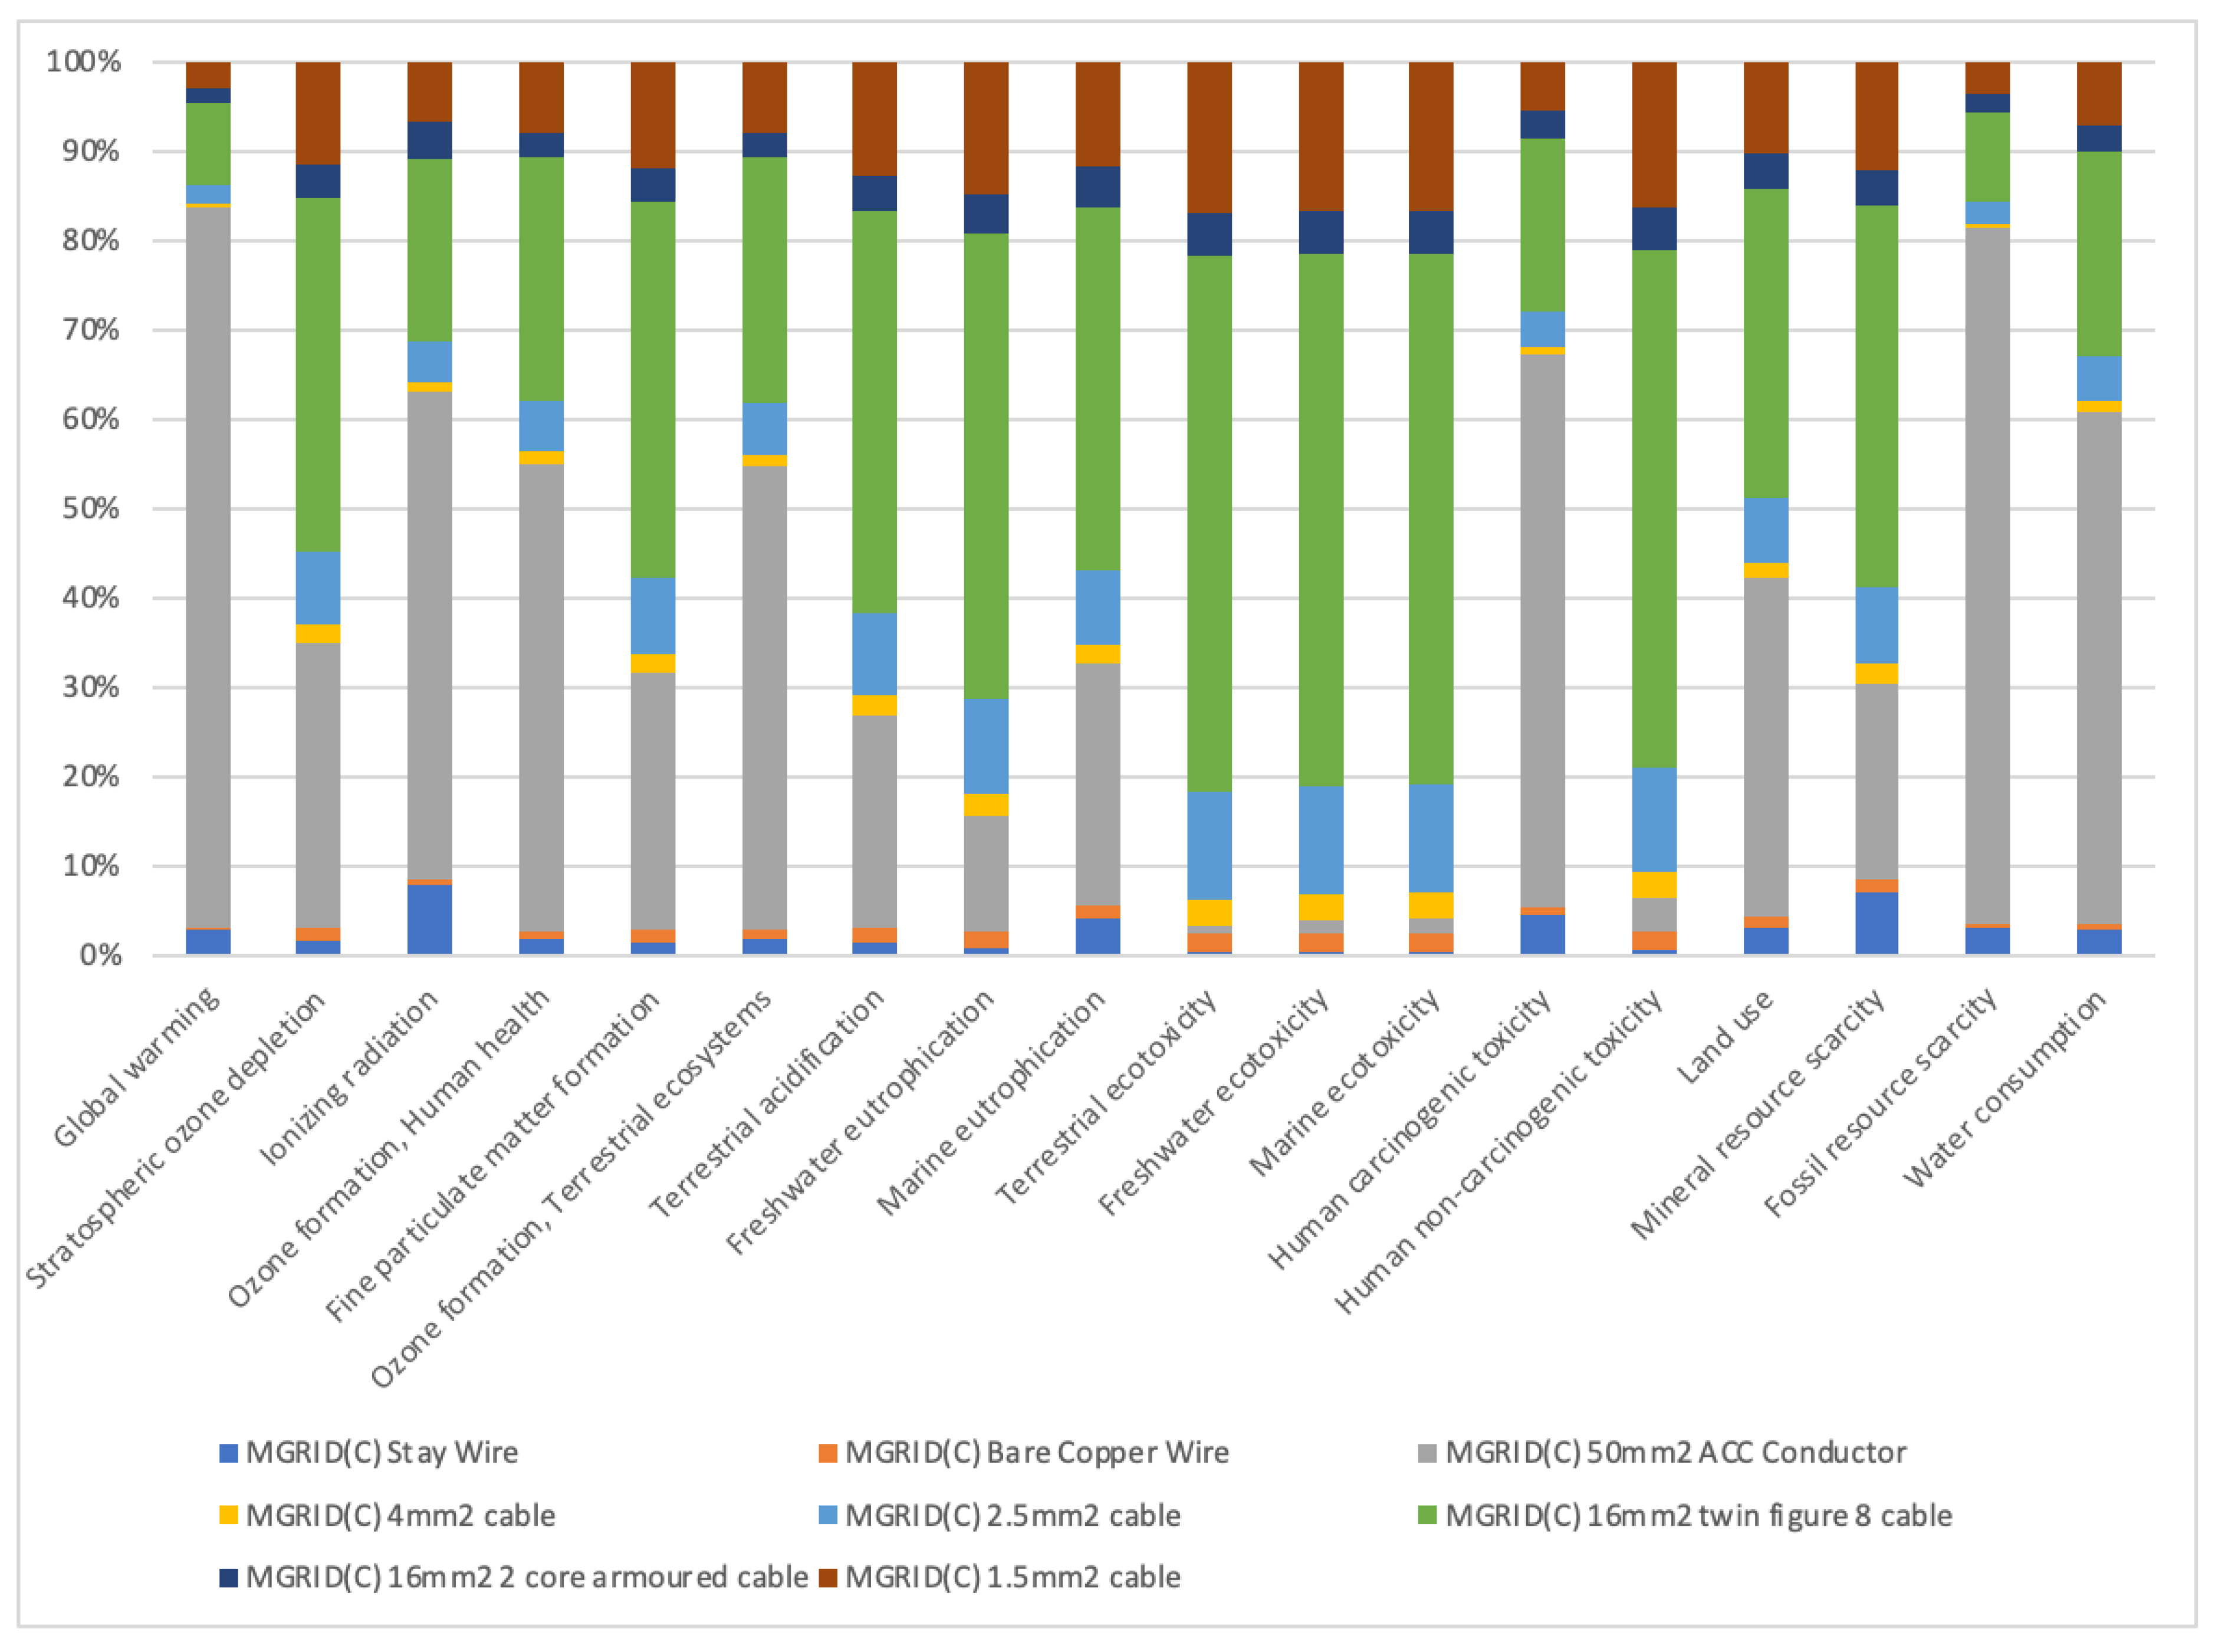
The poles and stays used essentially the same materials and processes and as such were considered a single component, but there are a range of cables used in the creation of a mini-grid, from heavy distribution cabling to domestic wiring. Based on this, further analysis of the cabling components was undertaken to identify which of the cabling used was of most concern. Figure 4 shows the contribution of the different cables used in the mini-grid. Two cables stand out as contributing the most; the AAC conductor (aluminium core), the main distribution cable from the PV power generating system (grey), and the twin figure 8 cable (copper core), used to connect to the buildings (green). The third cable of interest is the 1.5 mm2 cable (copper core), used within the home to connect various appliances/lights, etc. (brown).
As a result of the contribution analysis, the following component groups were further investigated to identify the cause of the impacts, and whether changes to materials or processes could reduce the environmental impact (see Section 3.2):
- Poles and stays
- Cabling components
- PV panels
3.1.2. Mini-Grid Sized for e-Cooking
The results above relate to a mini-grid that was sized for lighting and relatively low electricity consumption. However, transitioning to e-cooking has significant benefits, and mini-grids have the potential to contribute to this transition. Taking data from Keddar [20], a contribution analysis was undertaken for this mini-grid, but sized to support 100% e-cooking needs. Table 1 provides details on the size of PV, battery, inverter, etc., required. All other components to the mini-grid remained constant (cables, poles etc.).
Figure 5 shows the results from this analysis, and it can be seen that increasing the PV size (from 76.6 m2 for lighting to 1032 m2 to include e-cooking) increases their contribution to the total impact, whereas for the mini-grid sized for lighting, (see Figure 2), the supporting components (Energy_MGrid) were seen to contribute most to the environmental impact: for the e-cooking sized grid, the PV panels were seen to be the greatest contributor. This would suggest that for mini-grids, which utilise a relatively low PV area, the efficiency of the PV panels was less critical, and attention to reducing the impacts of the supporting system would be more effective in reducing the overall impact of the mini-grid. However, for those systems that required a large area of PV, the PV panel efficiency was considerably more important, and significant benefits would be found through the use of latest technology and high panel efficiency (although this would probably increase the economic cost of the system). It was also interesting to note that despite the battery requirements significantly increasing, they still did not contribute overly to the total environmental impact from cradle to end of use for this particular mini-grid design.
3.2. Scenario Analysis
This section reports the results of the in-depth analysis of the main contributing factors identified in the contribution analysis.
3.2.1. Poles and Stays
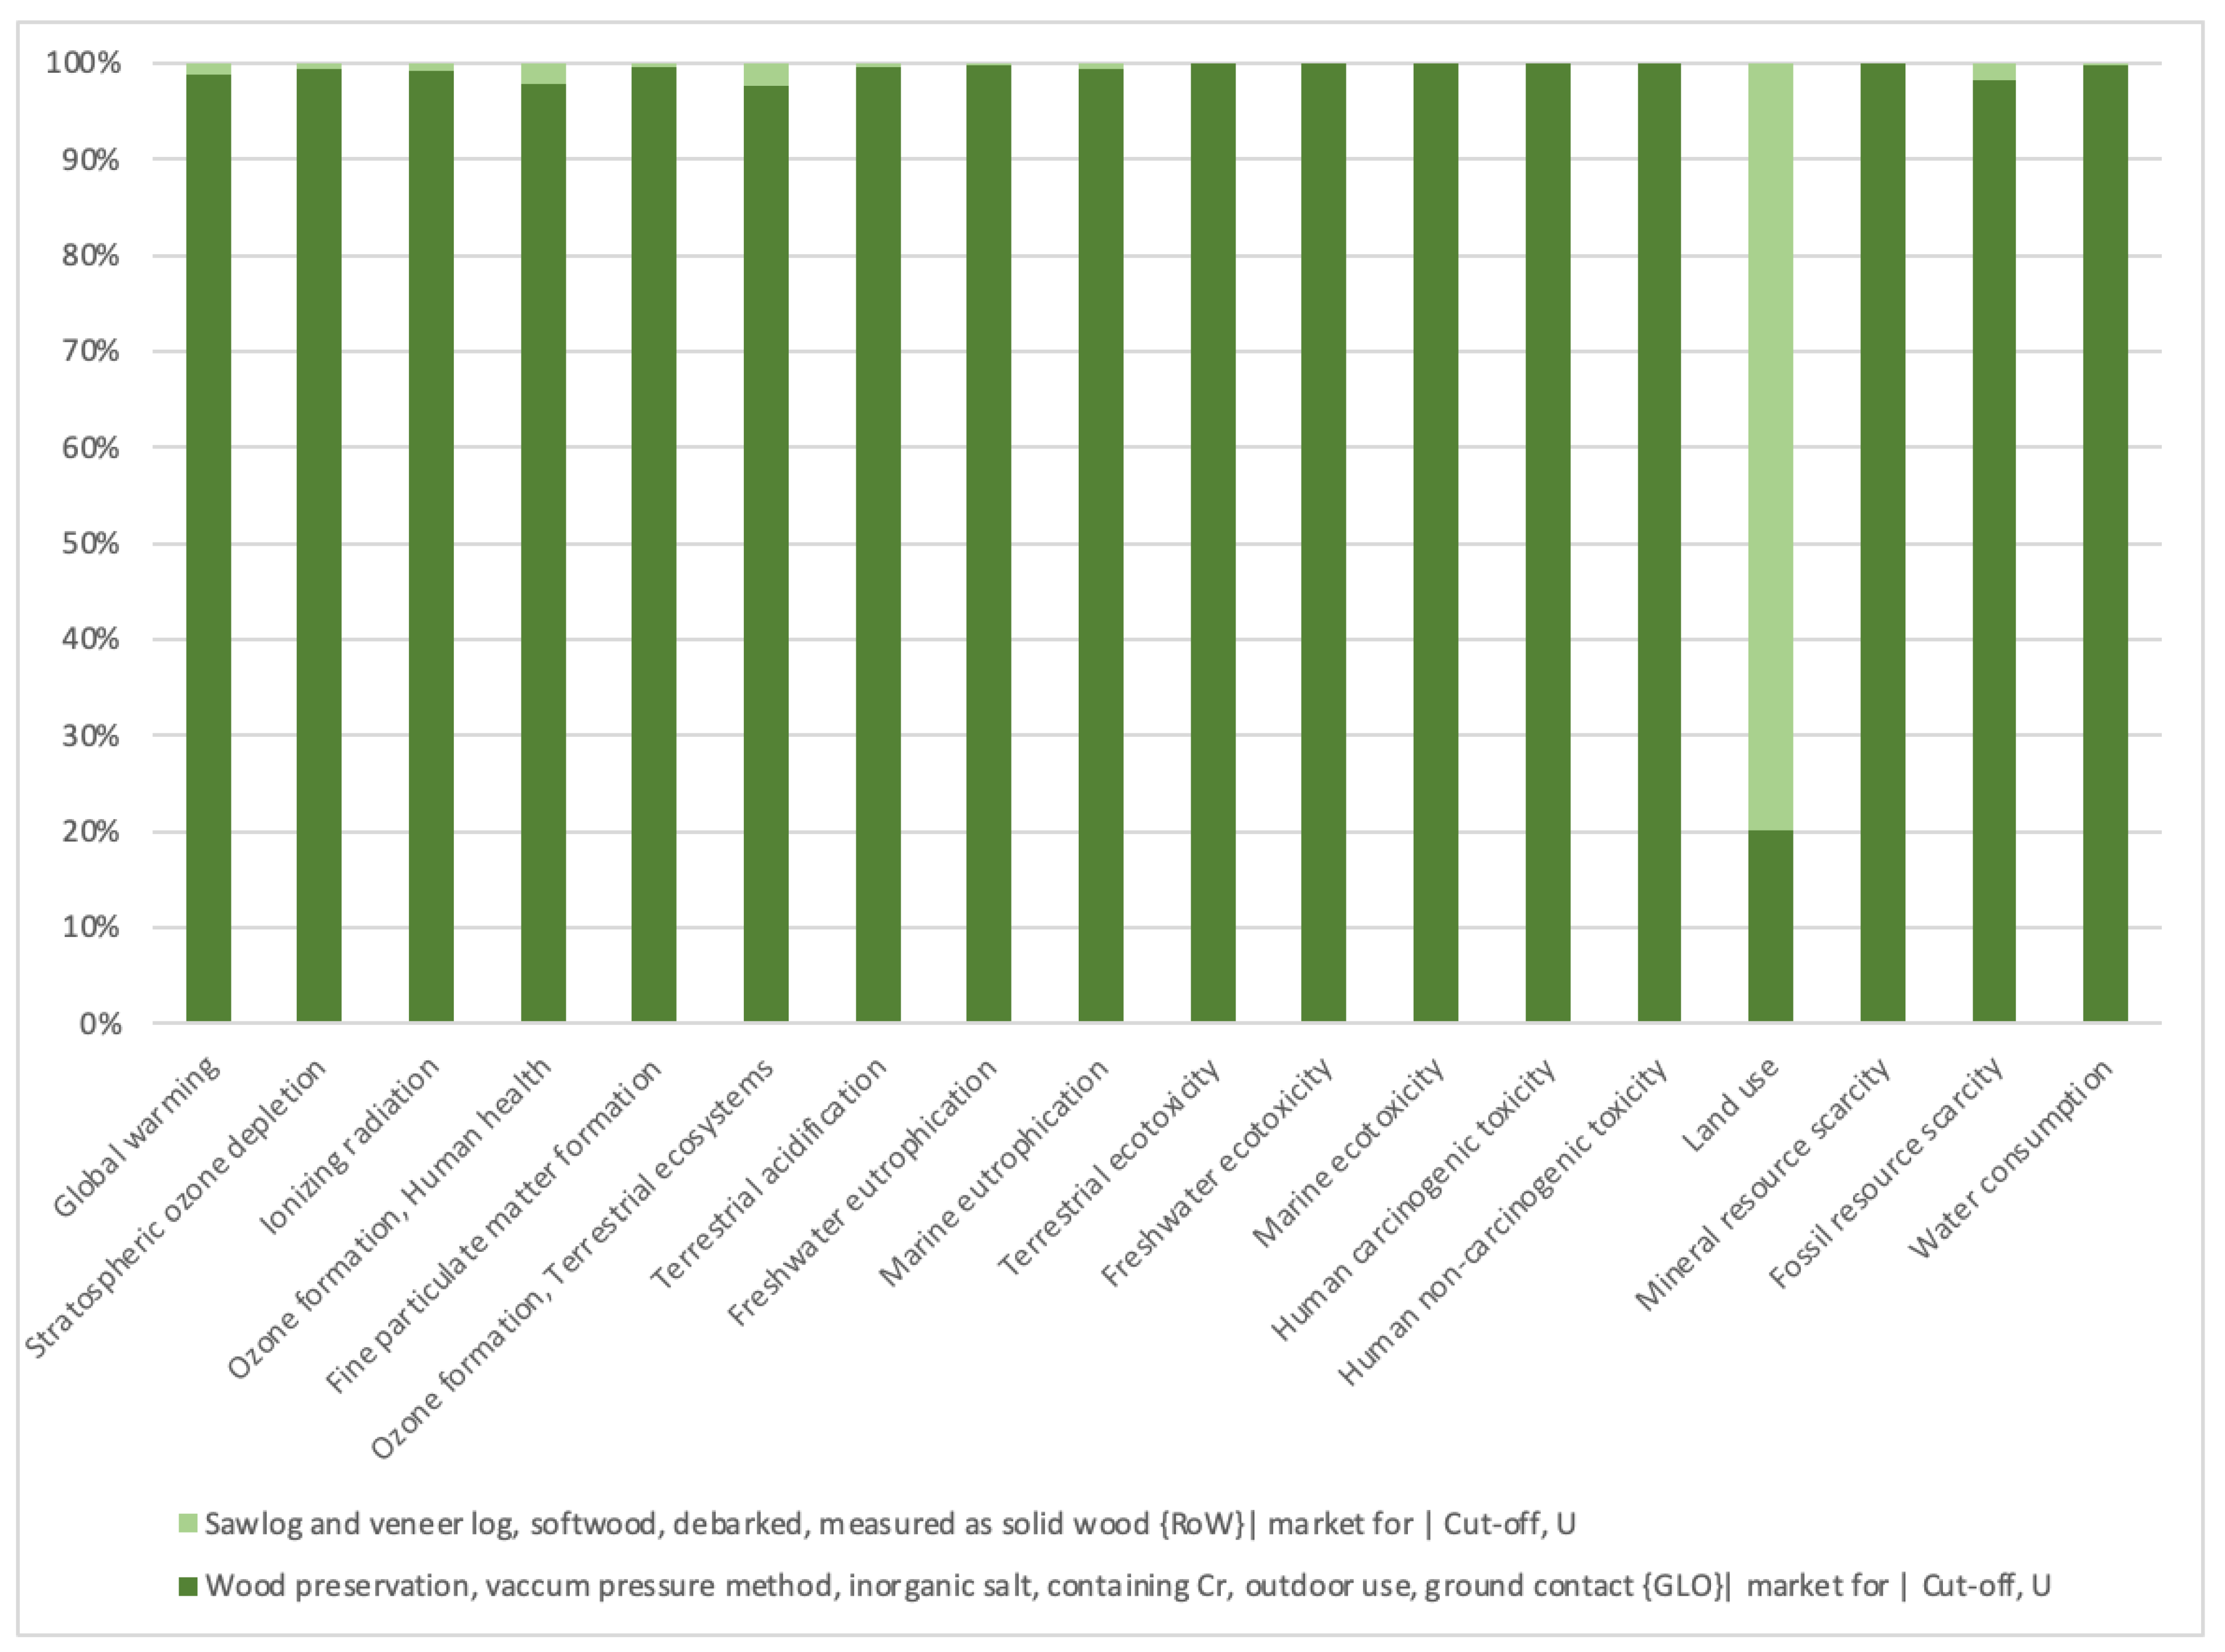
Looking at the poles and stays in more detail, Figure 6 shows just how much the environmental impact was overwhelmingly dominated by the wood preservative and process, rather than the production of the wood itself. The only category where this was not the case was land use. It was thus useful to compare alternative systems to try to reduce the impact from the choice of wood and preservative.
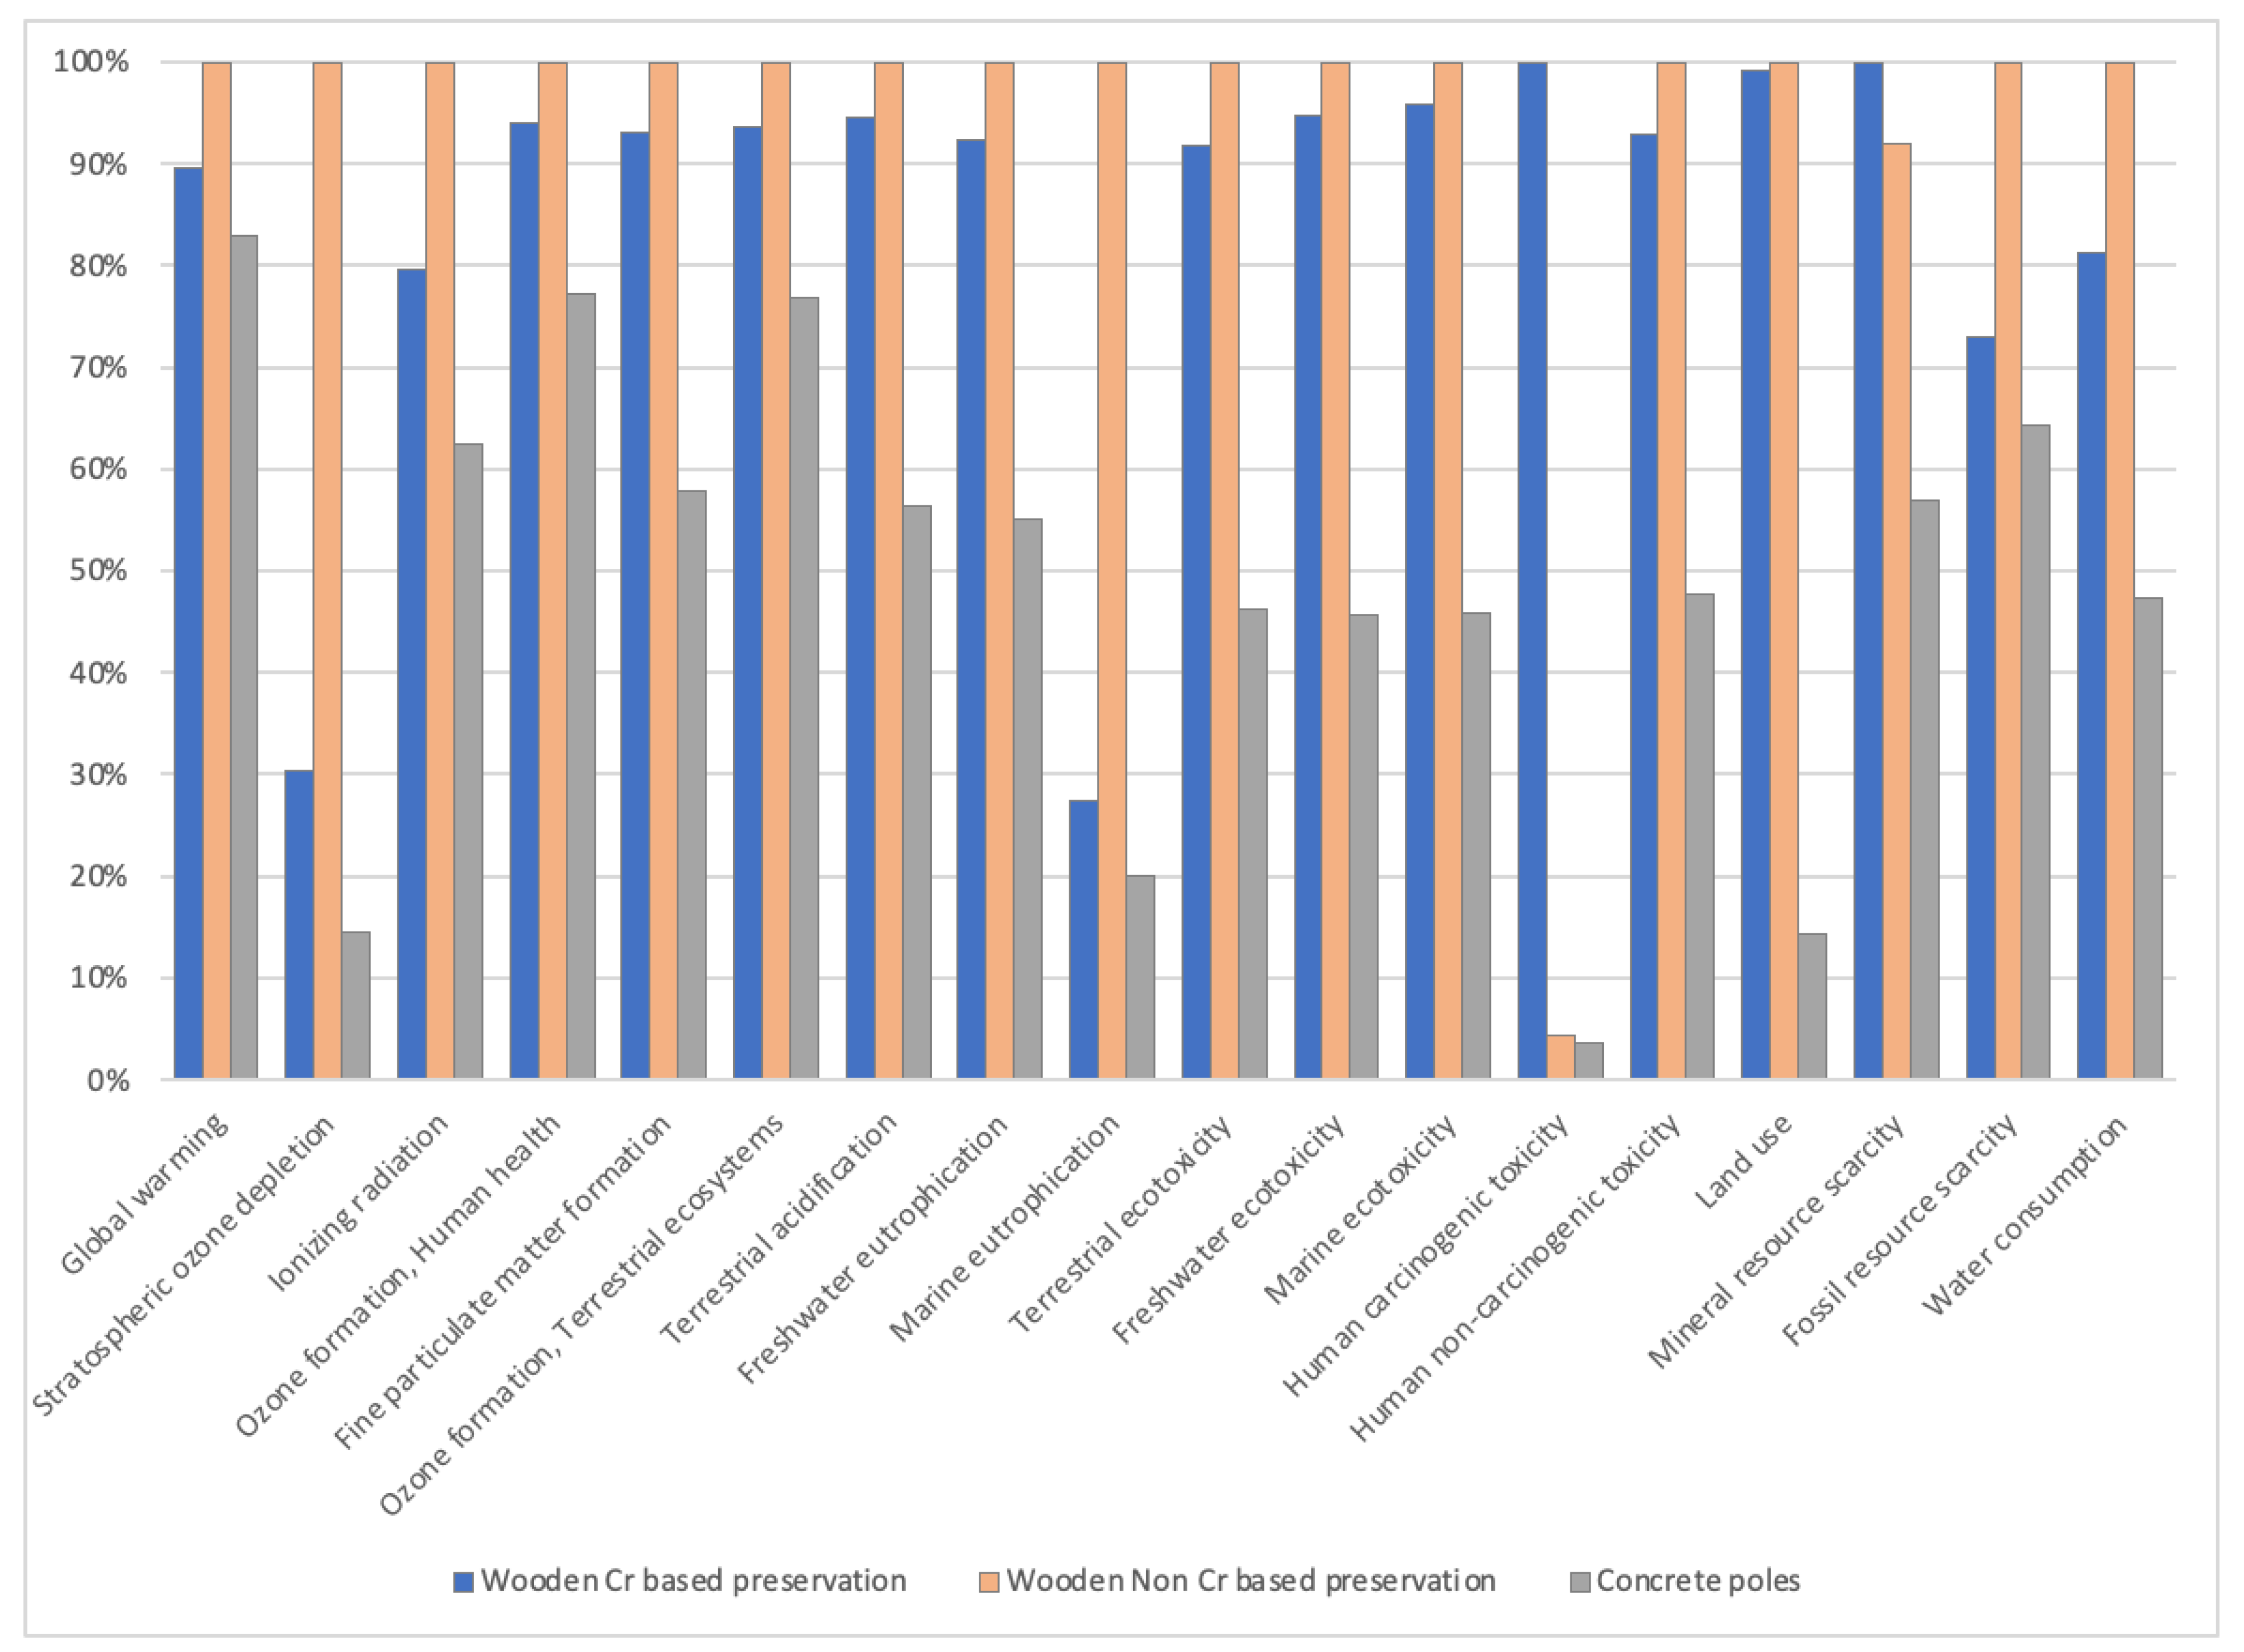
The original choice of preservative and preserving process was based on East African Standard 324: Copper/chromium/arsenic compositions for the preservation of timber [21]. Two alternatives were identified and modelled, one changing the process and one changing the base material. The first alternative maintained the use of wood but used a non-chromium-based liquid preservative applied using the same, vacuum pressure, application method. The second utilised concrete poles and concrete stays.
Figure 7 shows the results of this comparison for environmental impacts. It is interesting to see that for all impact categories, apart from human carcinogens, the non-chromium wood preservative had a higher impact, suggesting that the chromium-based preservative would be better than a non-chromium-based preservative. Concrete had a lower contribution across all impact categories. The high values for global warming potential for the chromium-based and alternative preservative were found to originate in the manufacturing of the preservative itself. These are seen to be higher than those for the concrete, which is a known contributor to global warming through the CO2 emissions in concrete production.
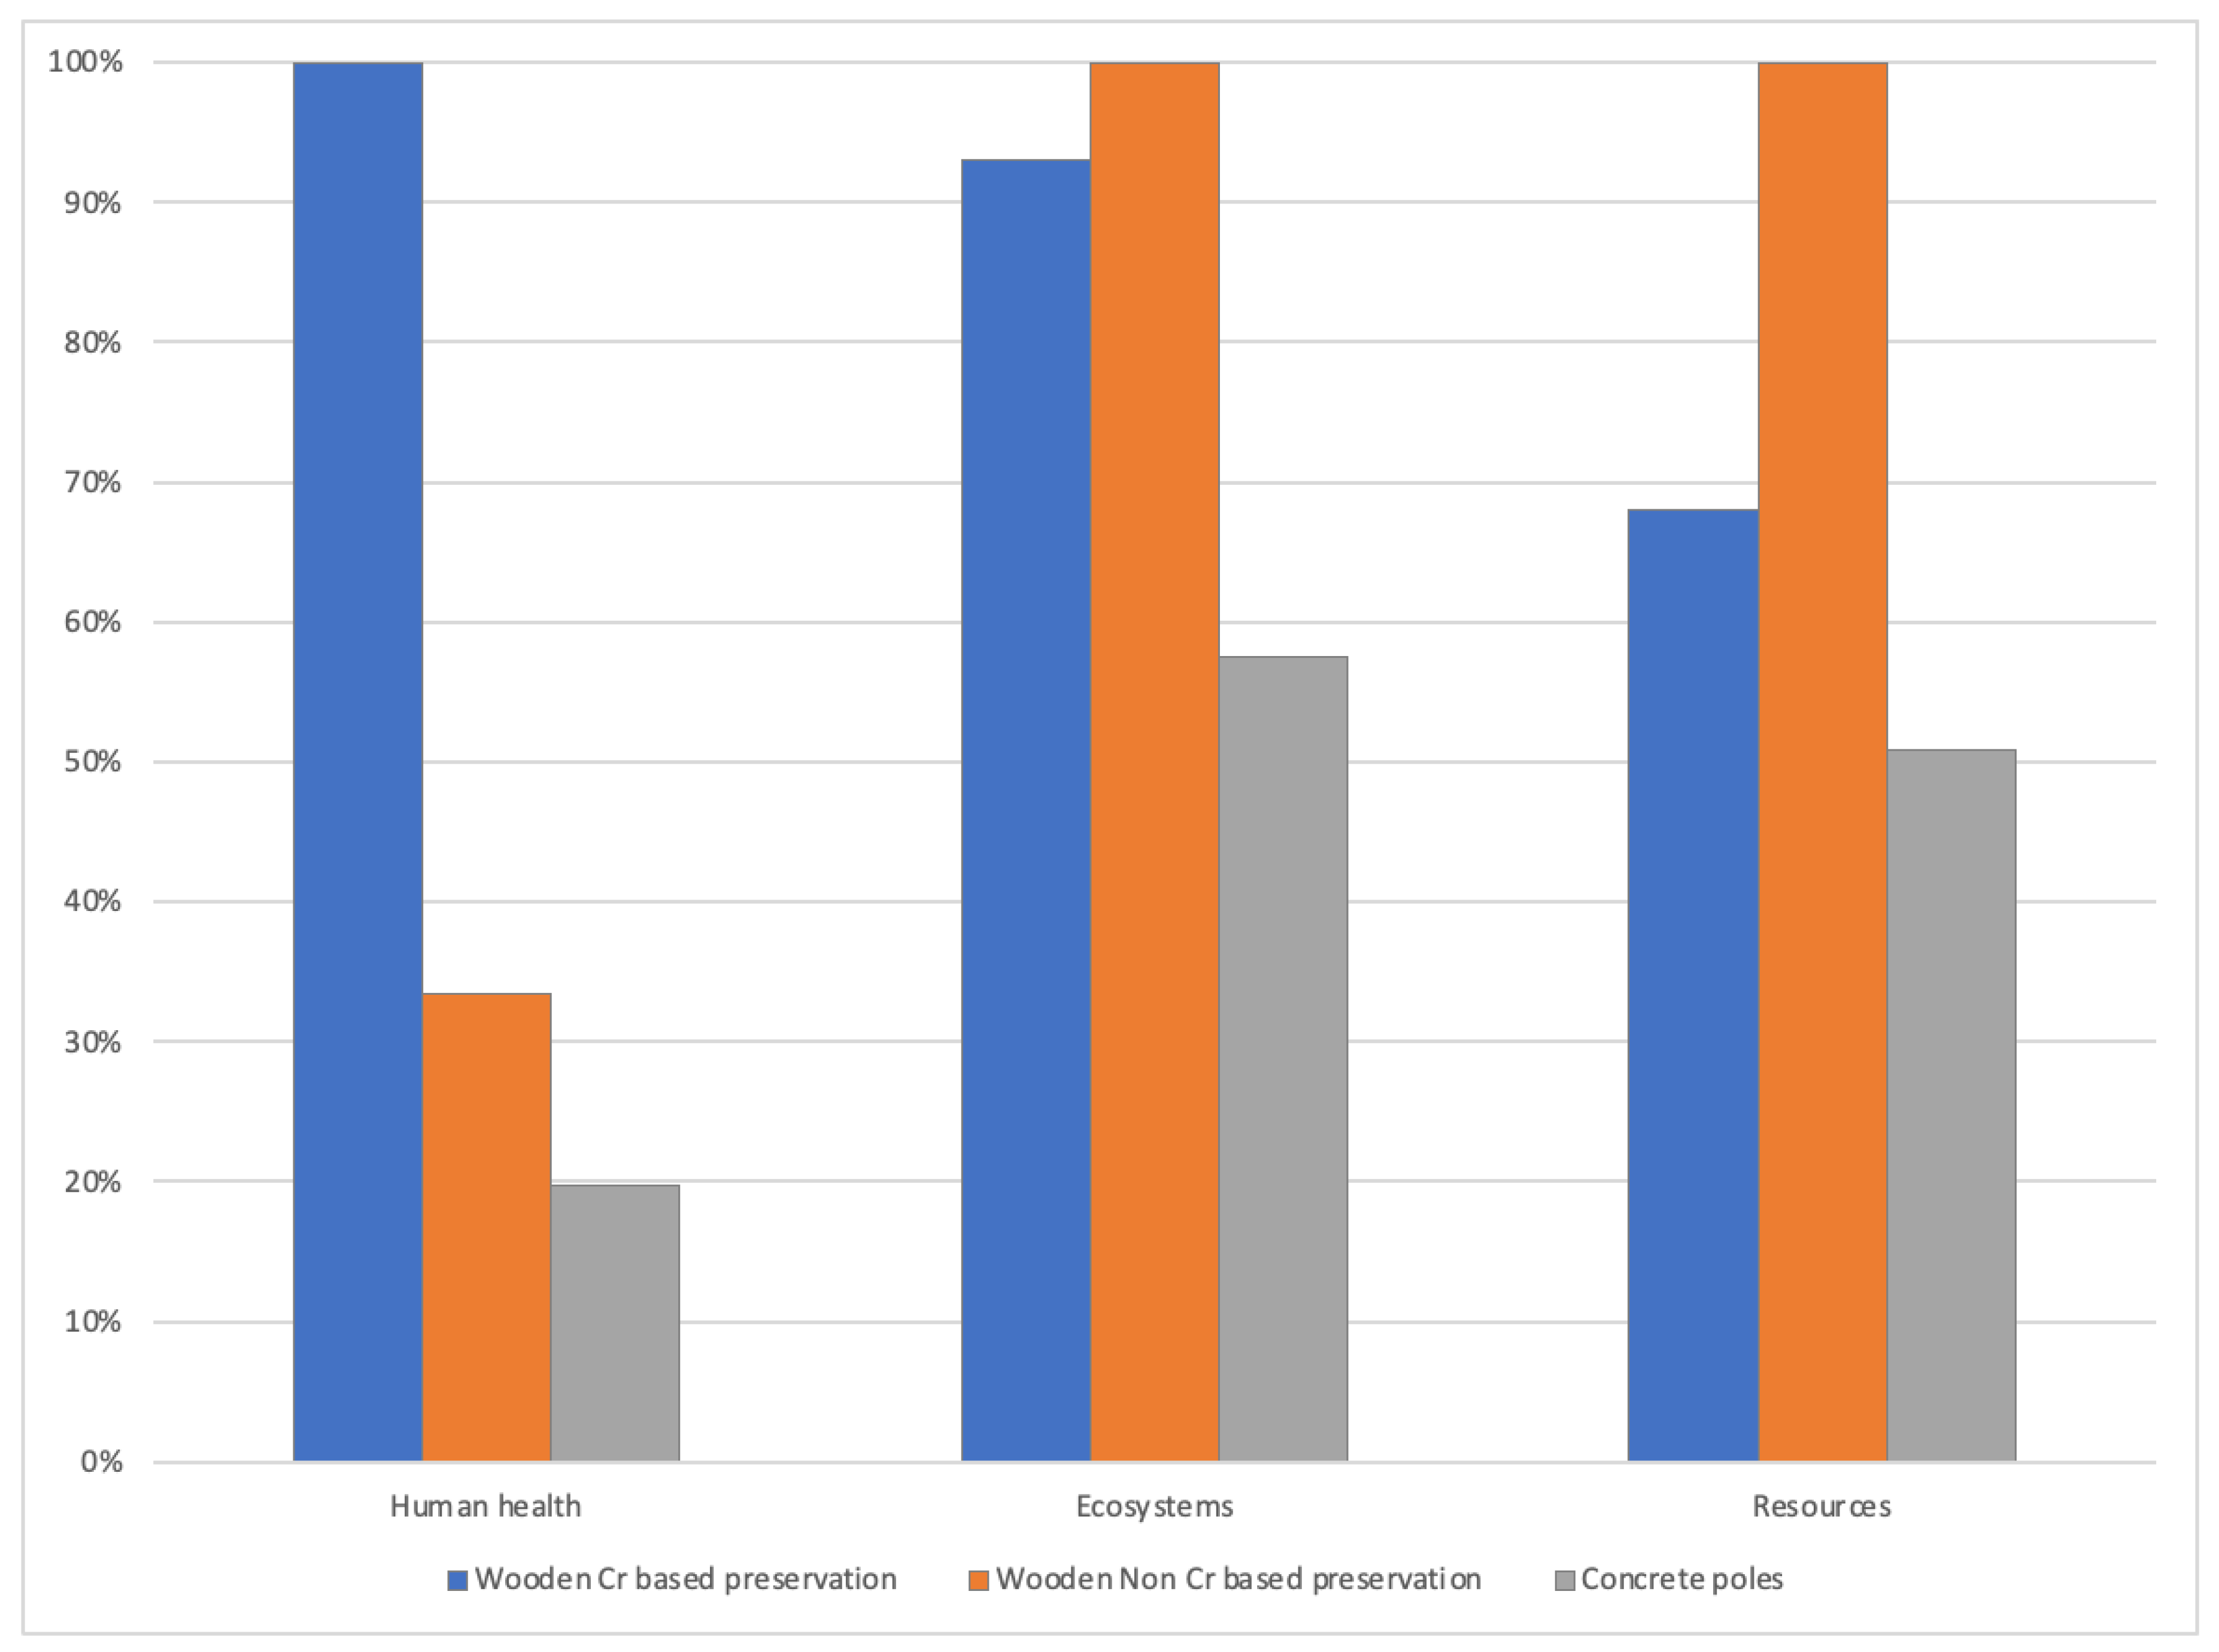
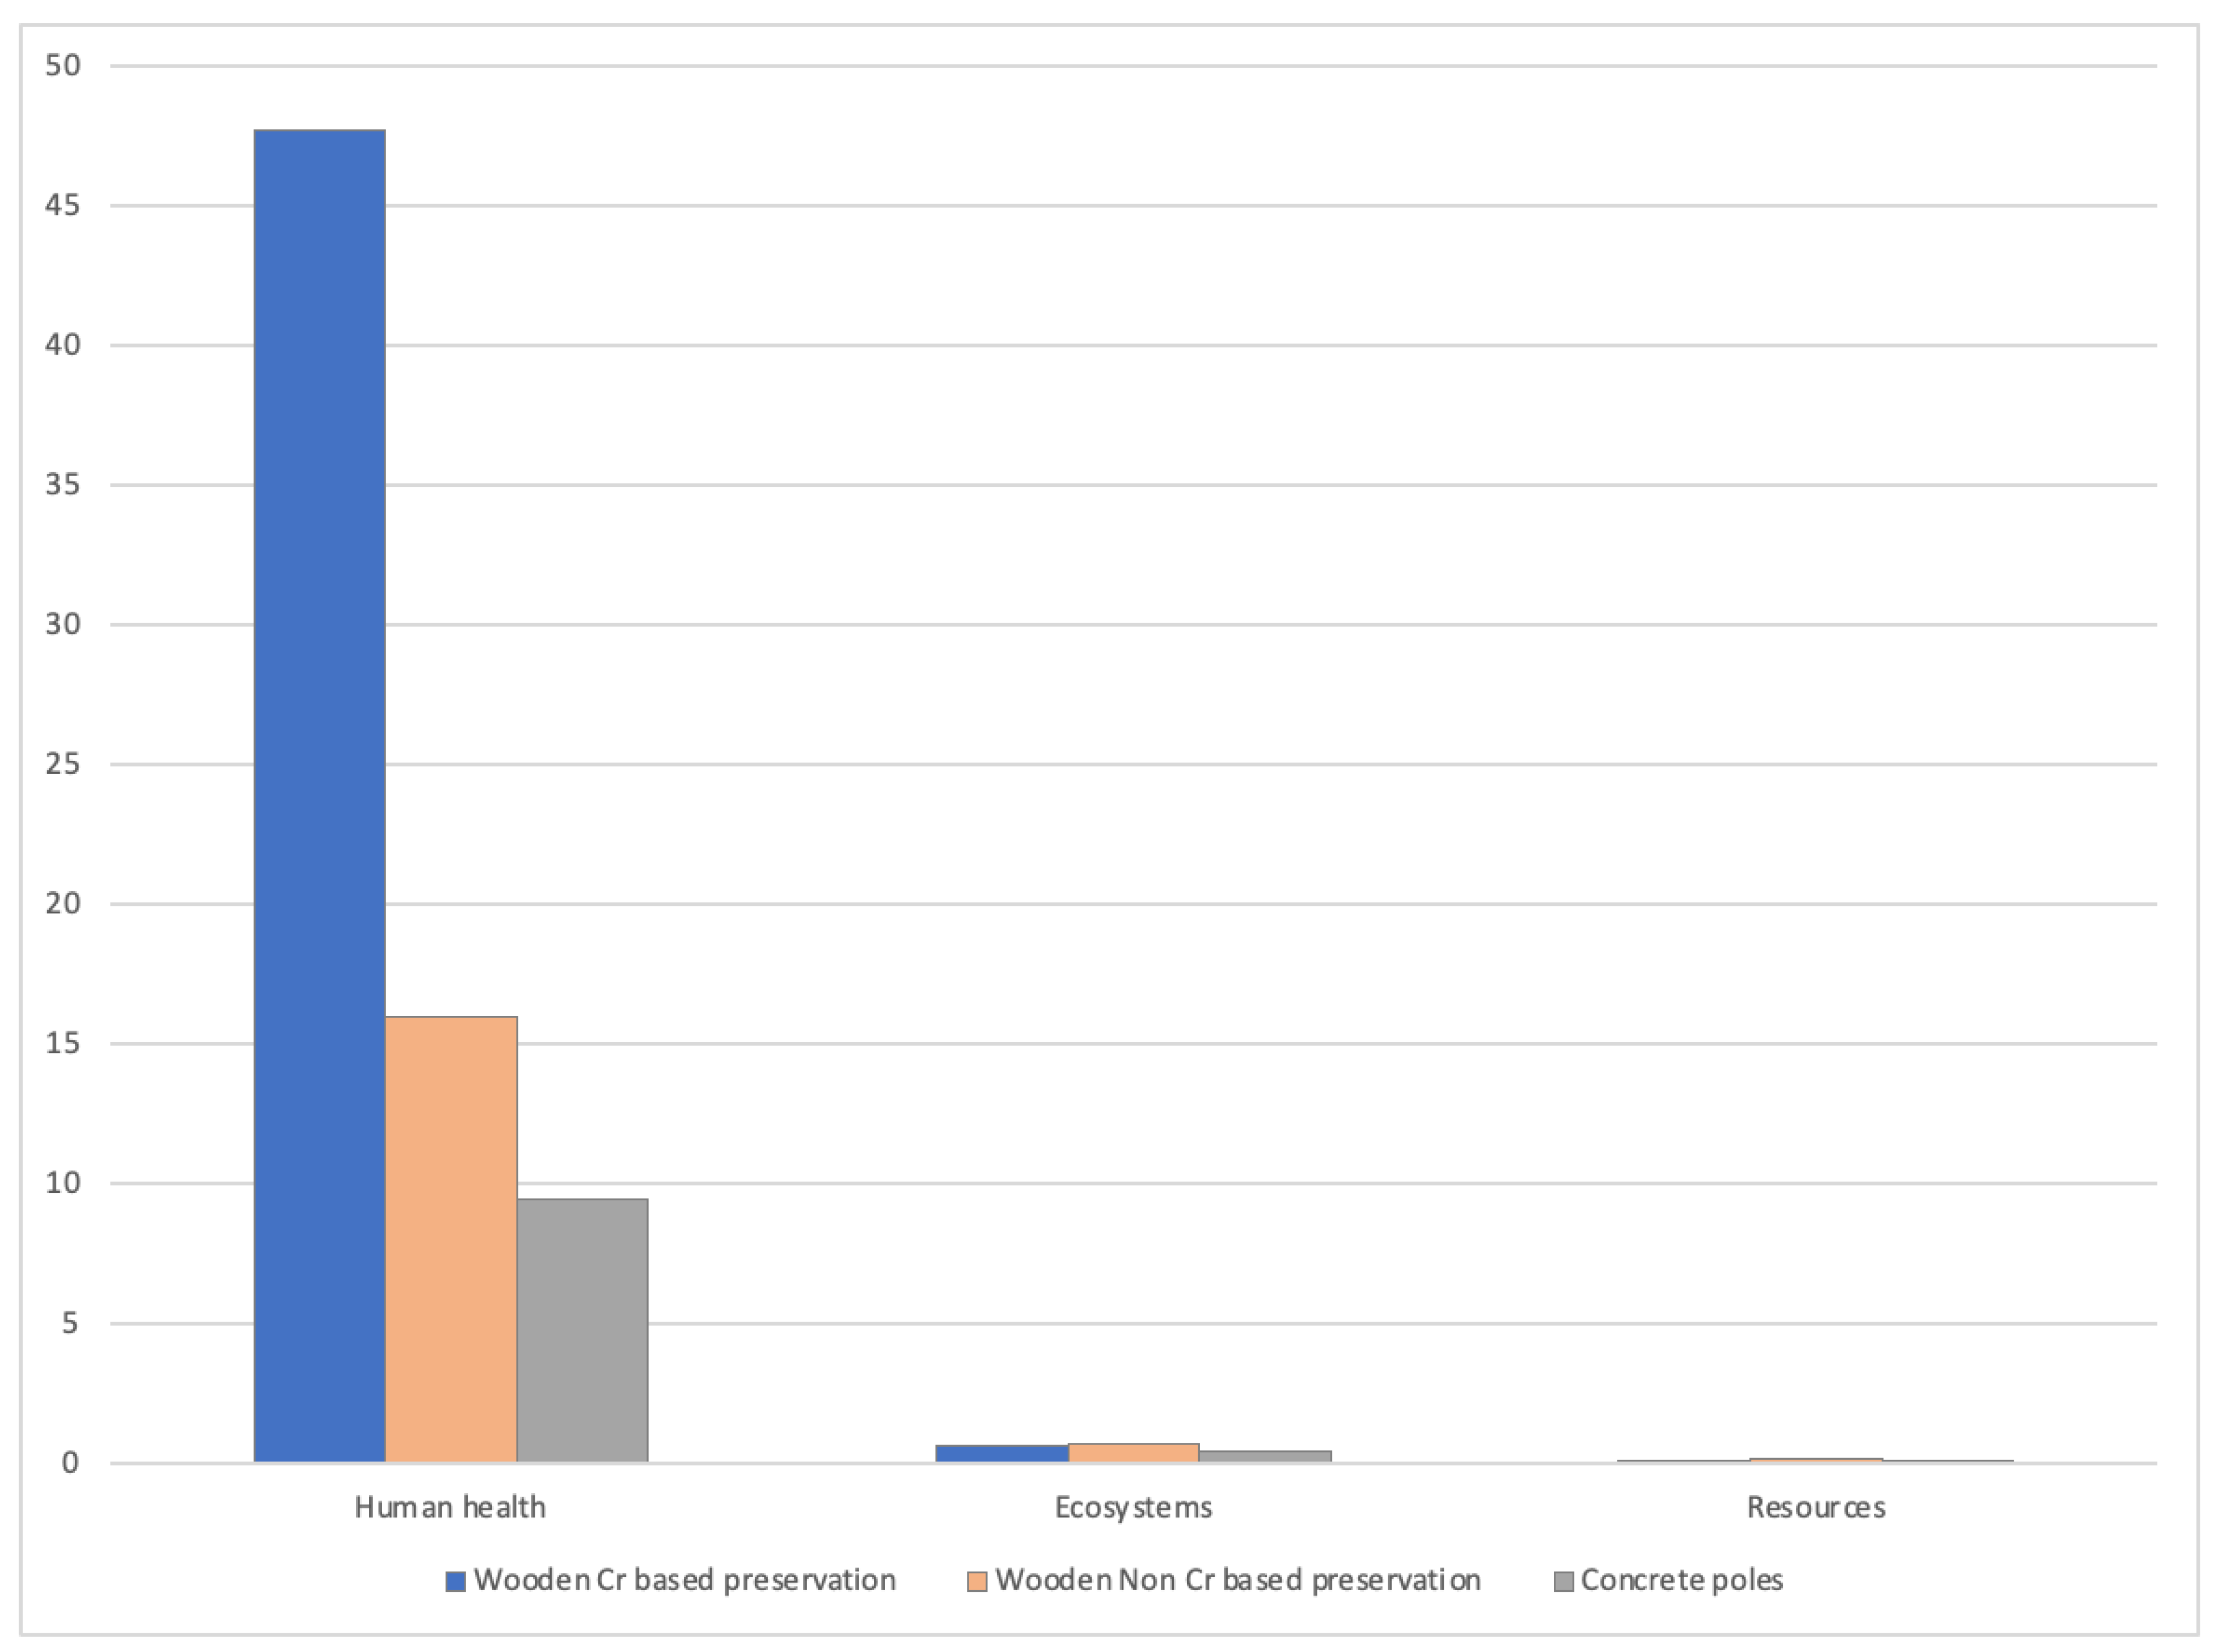
When examining the endpoint impacts, Figure 8 shows the damage assessment for the three alternative systems. It shows that it was only for the human health endpoint that the chromium-based preservative contributed more; for both ecotoxicity and resource use, the non-chromium version contributed more. This again suggested that the non-chromium preservative would deliver a worse environmental outcome. When human health, ecosystem, and resource damages were normalized, however, a different picture emerged.
Figure 9 shows the normalized endpoint results and emphasizes that, despite the non-chromium wood preservative having a higher environmental impact in all impact categories except human carcinogens, overall it had a significantly lower impact for all endpoint categories. This result confirmed the overwhelming dominance of the human carcinogen impact category for human health, and it was this issue with the chromium-based preservative that was of concern.
The results for the concrete poles and stays are shown in Figure 6, Figure 7, Figure 8 and Figure 9, which have a lower environmental impact and contribute less to the endpoint impacts than either of the wooden pole options.
The results from this suggest that if possible, using locally made concrete poles and stays would deliver the greatest environmental benefit, but failing that, moving to a non-chromium-based preserving solution would deliver nearly as good a level of environmental improvement.
3.2.2. Cable Options
From Figure 4 it could be seen that within the cable sub system, the 16 mm2 twin figure 8 cable with a copper core and the 50 mm AAC cable, with an aluminium core, stood out as having the greatest contribution to environmental impacts. In the majority of cases, the cables used have sheaths, made from flexible PVC. Analysis showed that it was the metals within the cables that contributed most to the environmental impact, and that the sheathing material(s) contributed a significantly smaller amount.
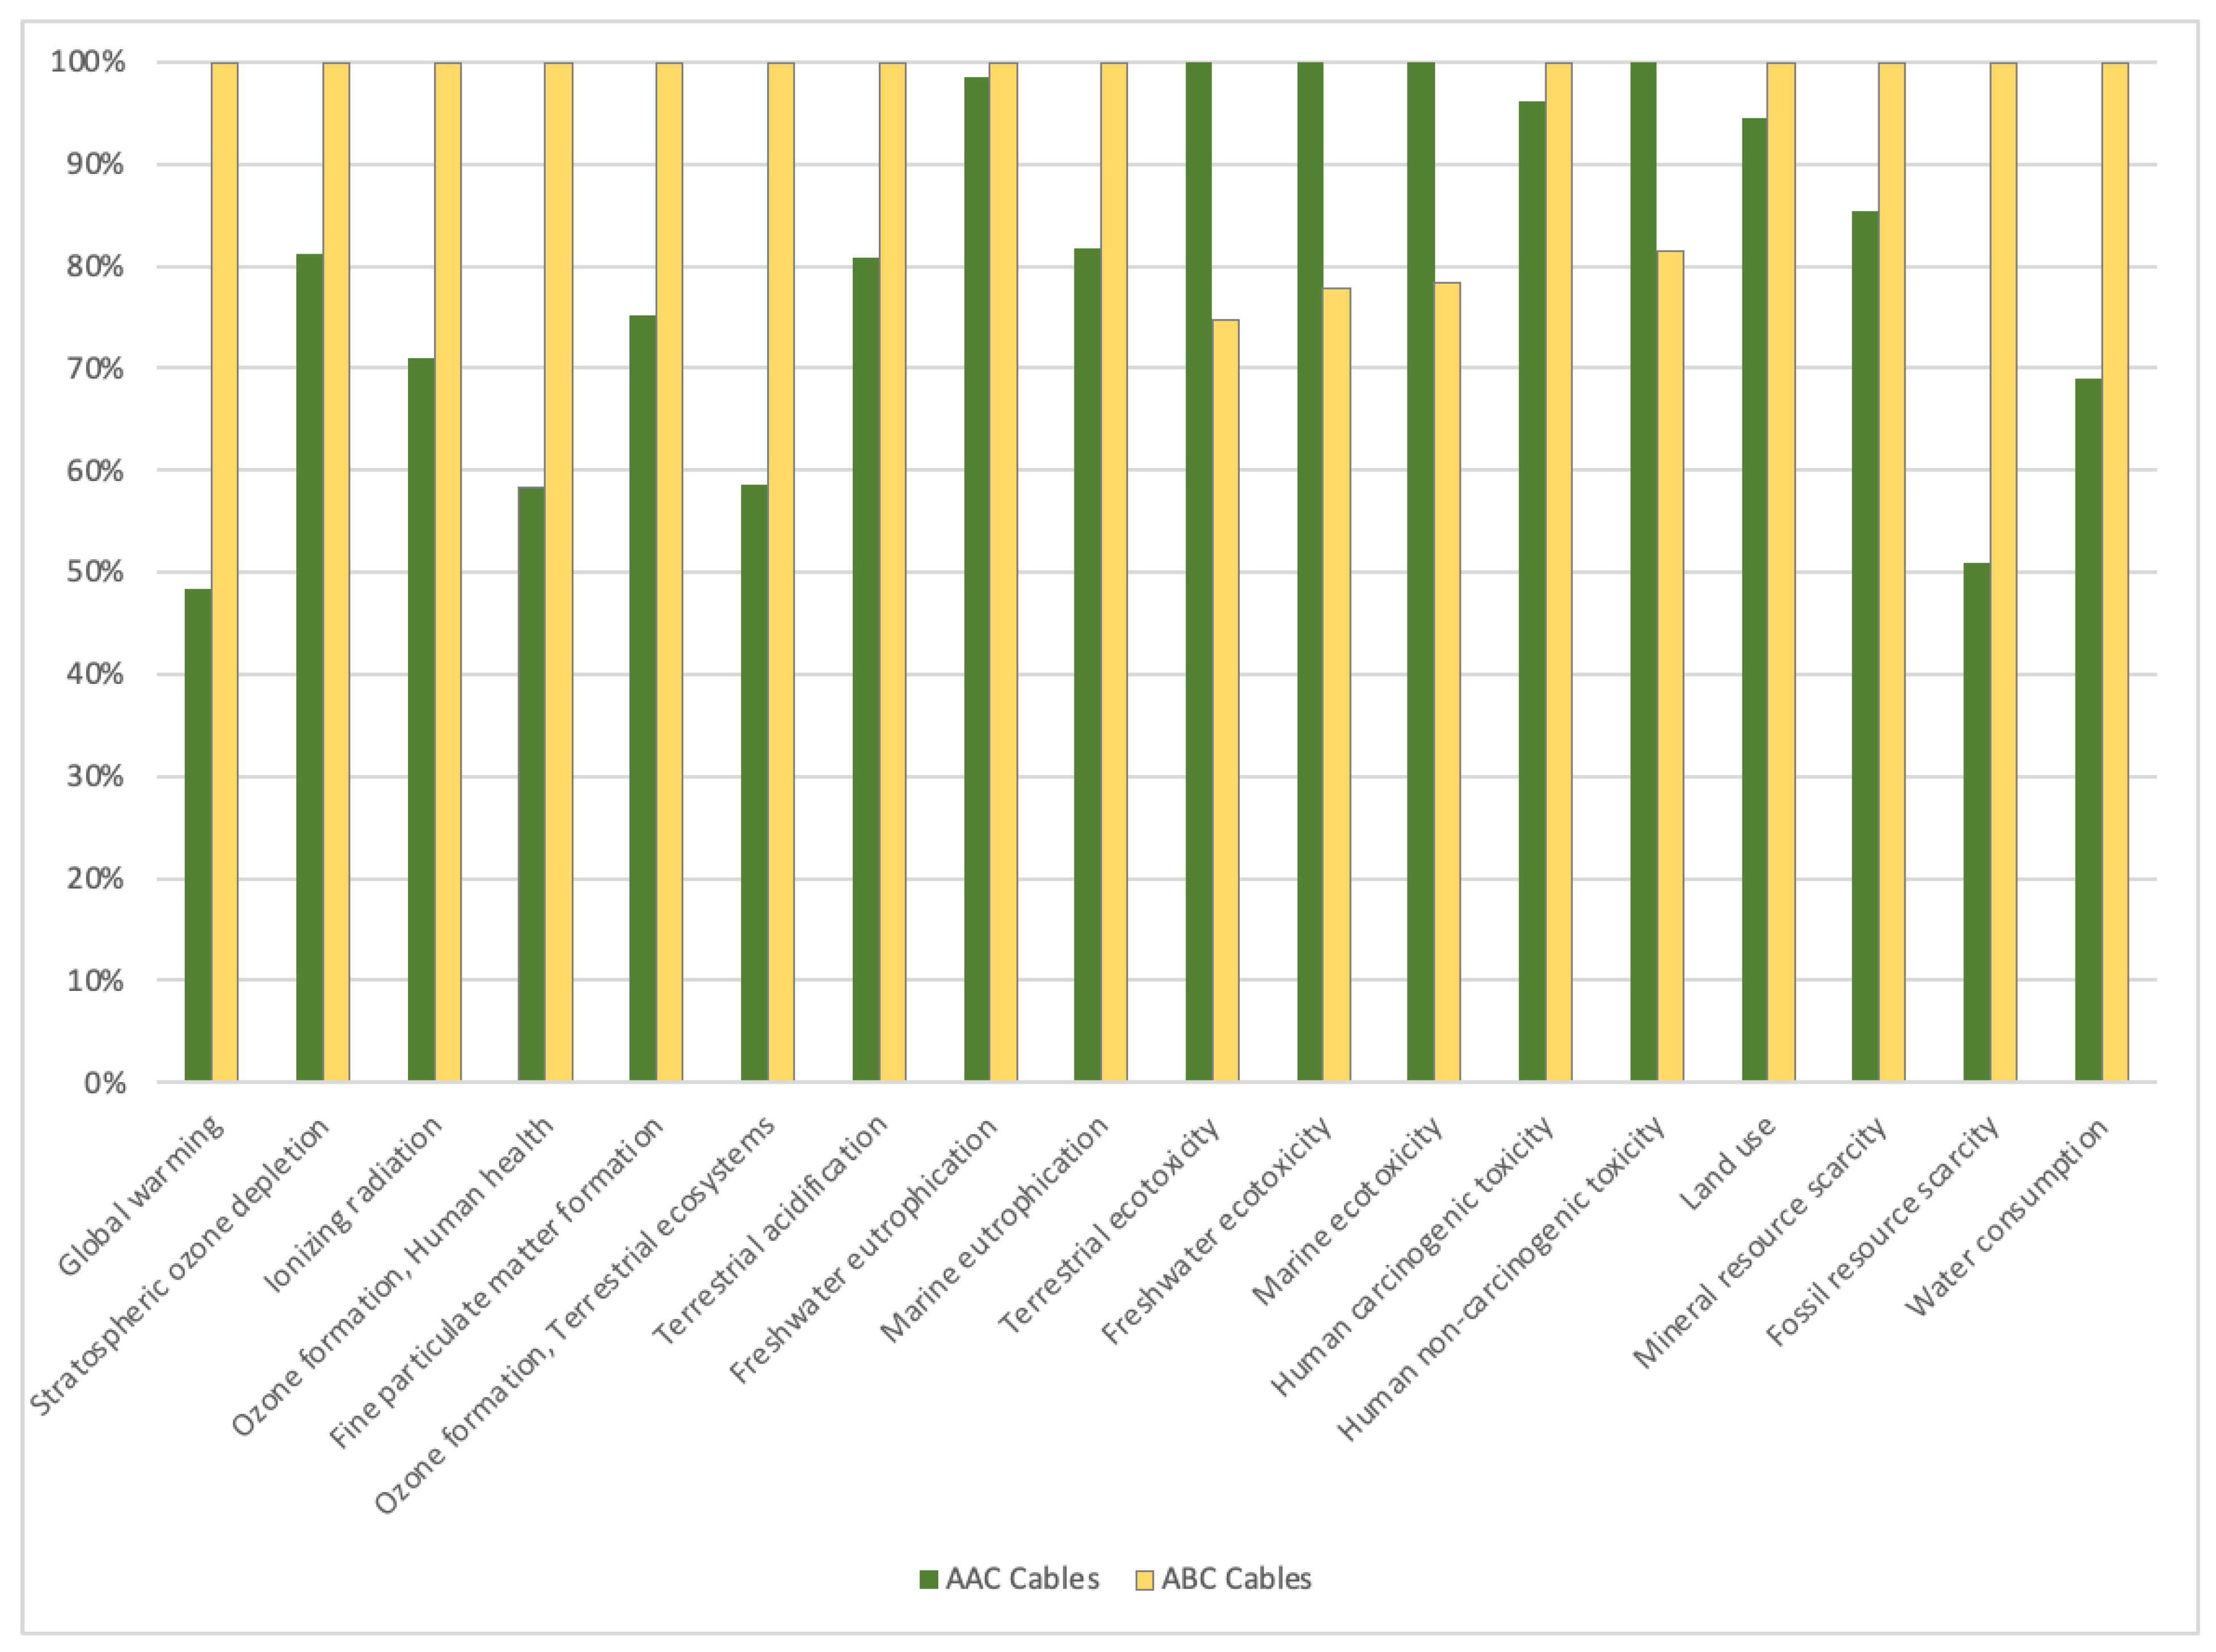
To reduce the impact from these cables, two opportunities exist. The first is to ensure that routing of the cable from the point of power delivery to each building is as efficient as possible, and the PV plant should be located as centrally as possible. The second opportunity is to investigate other cabling systems that could be used in place of the AAC and twin core cables. Developments in electricity distribution have created ABC cables (aluminium bundled cables), which deliver similar levels of performance as AAC and twin core cabling. Figure 10 shows the midpoint environmental indicators for the two alternative cabling systems. Since there was not much differentiation between the impacts for each system, it can be inferred that there were no major environmental gains to be made in changing the cabling system.
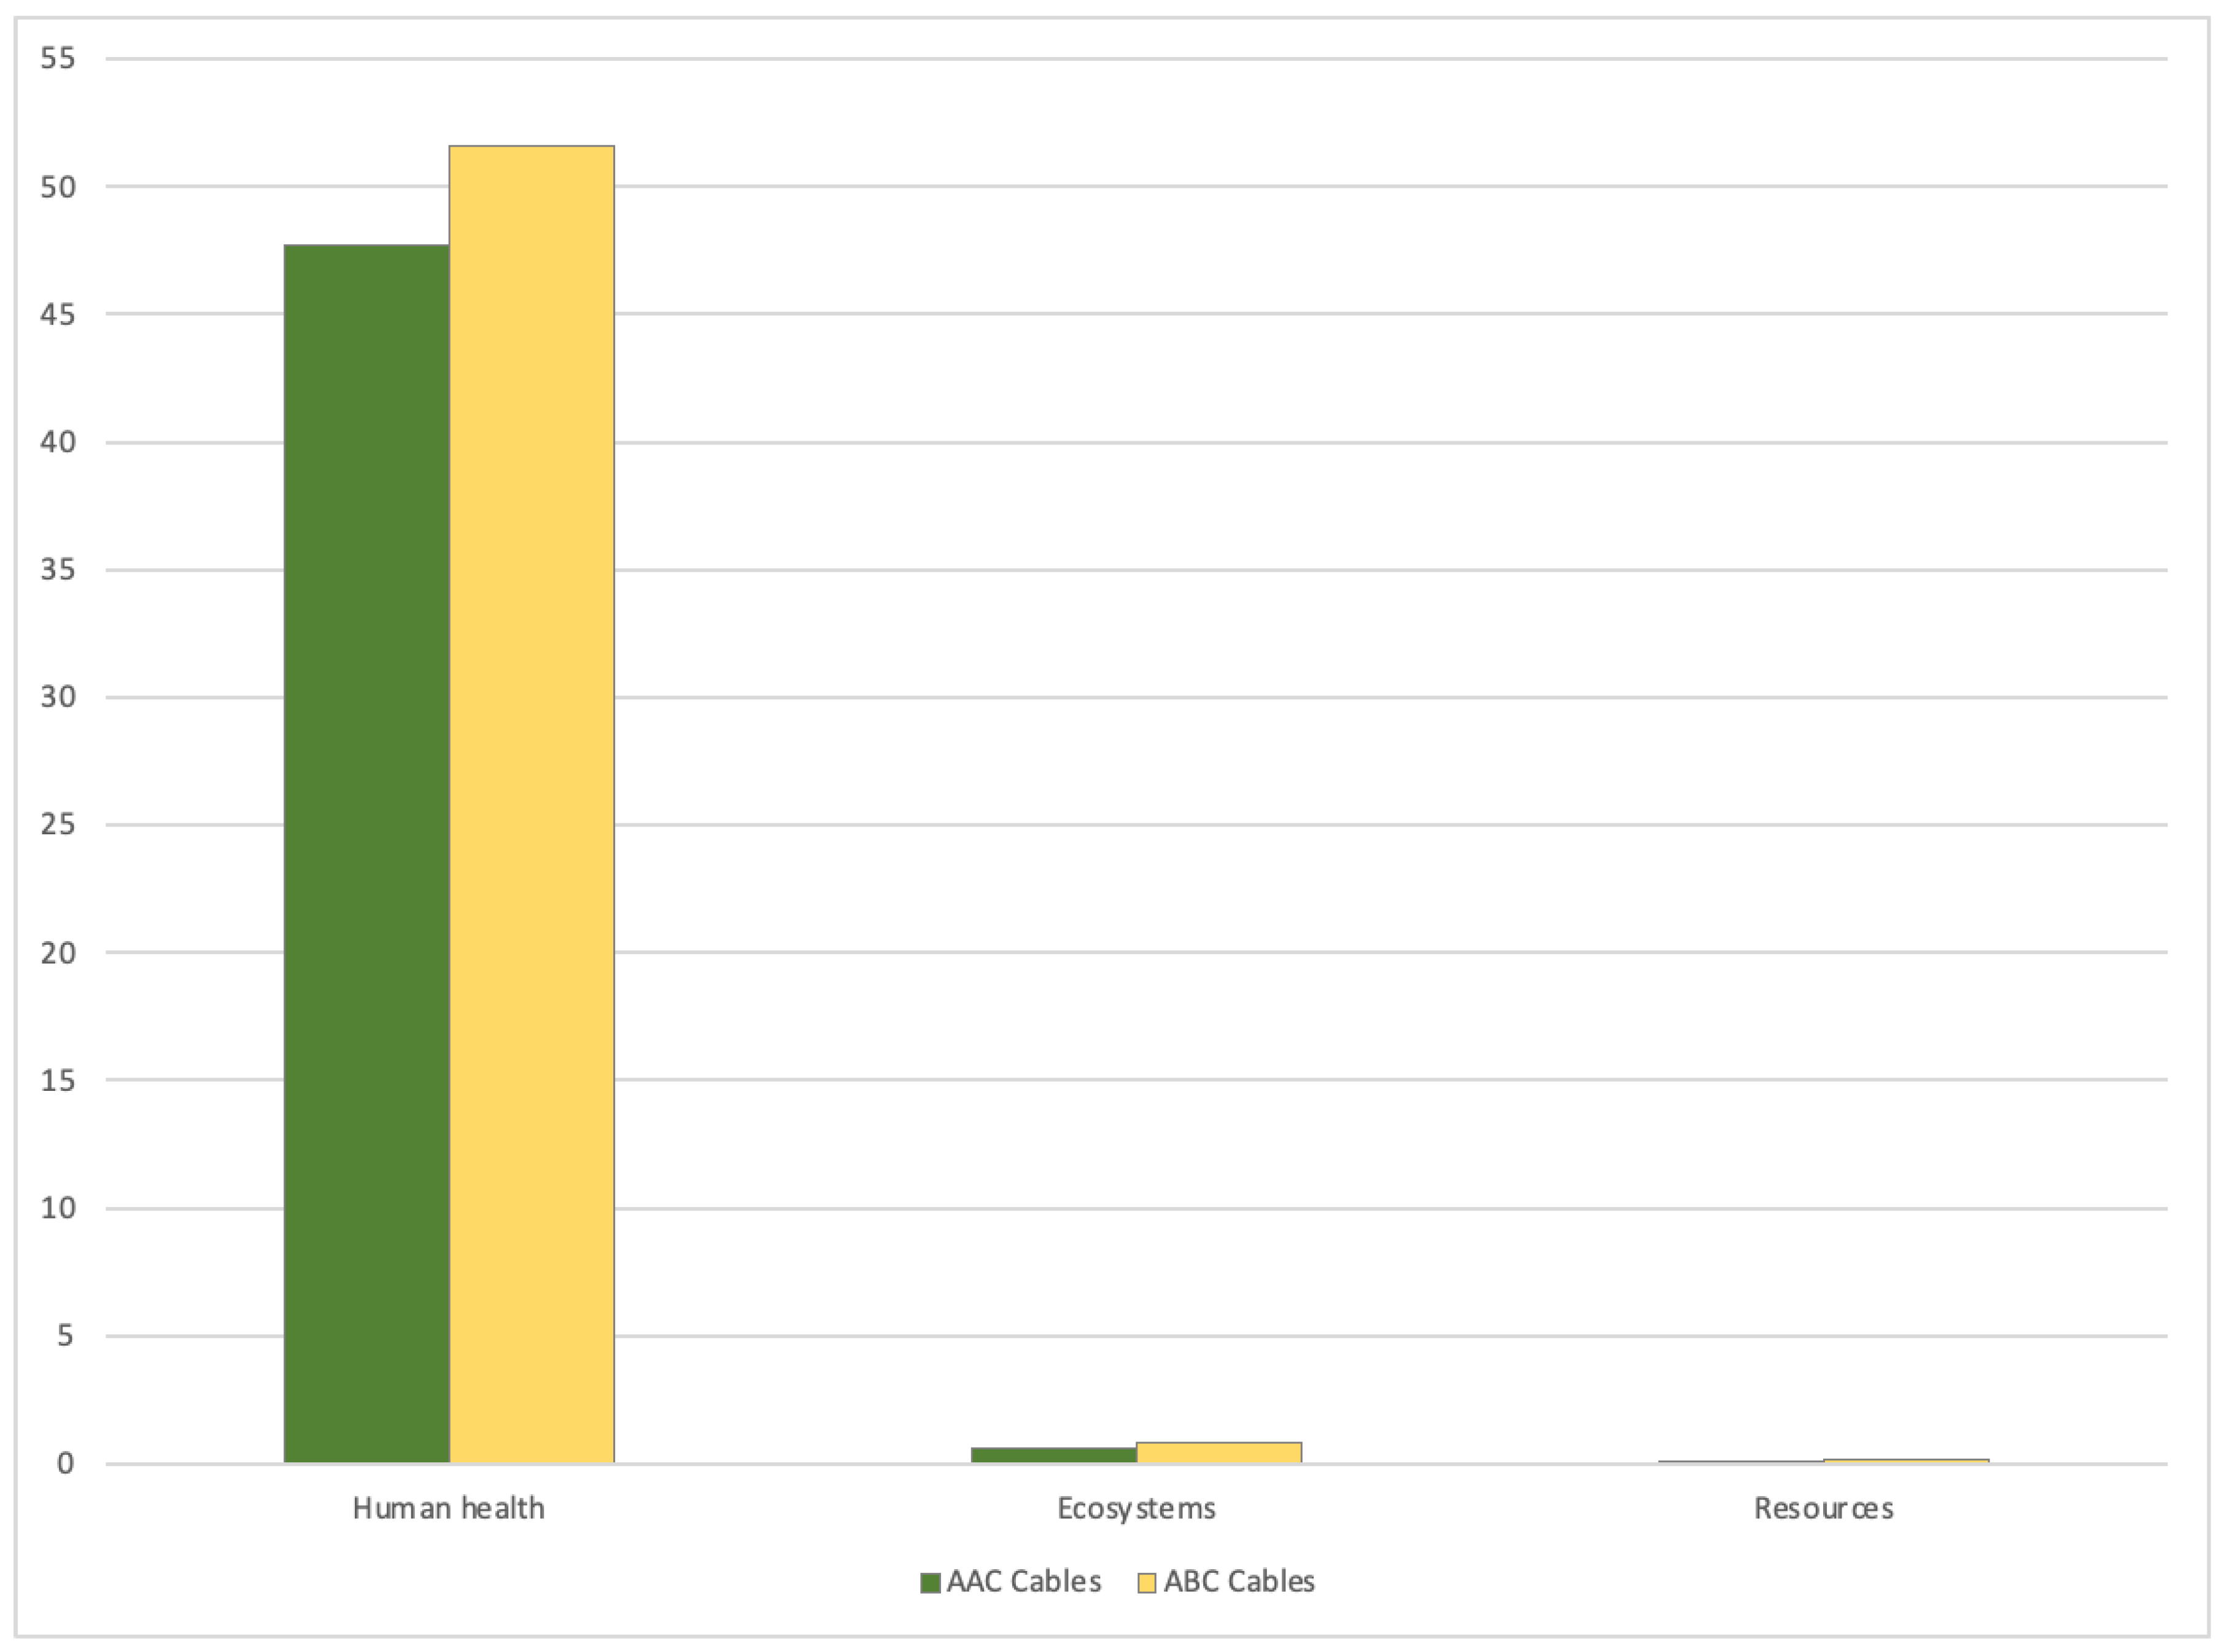
Figure 11 shows the normalised endpoint results for each system, where ABC cables were seen to have a marginally higher impact than the AAC cable system. The results from this analysis suggest that careful planning of the grid delivery system to minimise cable distance would deliver a much greater benefit than utilising a specific cable system, as each system contributes approximately the same impact.
3.2.3. PV Efficiency
From Figure 2 it was seen that, within the power delivery components, the PV panels were the greatest contributors to environmental impact by a considerable margin. The data used for the production of a single crystal PV panel were obtained from generic averaged industry data (single crystal PV panel, (GLO) from ecoinvent) and do not necessarily accurately reflect the specific processes used by the manufacturer listed in the bill of materials for the mini-grid. As a result, an assessment of the efficiency of the panels was carried out to evaluate how much the efficiency of the panels affected the overall environmental impact of the mini-grid system. The analysis evaluated the change in environmental impact that results from the efficiency of the panel increasing from 8% (the efficiency of the panels described in the ecoinvent Database for single crystal panel), to 16% (a current assessment of efficiency) to 25%, the optimum efficiency that has been suggested that could be obtained for this technology [22]. The increasing panel efficiency essentially equated to a reduction in the panel size required, with a corresponding reduction in materials needed and thus environmental impact. The chemistry and manufacture of the panel have been kept constant (as data on new materials and processing systems are not available), and it is recognised that this introduced some inaccuracies into the results.
From Section 3.1.2, it was shown that the function of the mini-grid, (lighting, phone charging, or lighting plus e-cooking,) will change the quantity of PV panels and storage required, shifting the greatest contribution from the non-power related components to the PV panels. For these larger sized mini-grids, the sensitivity of the overall impact of the PV panels was more important, and there is considerable research ongoing to develop more efficient panels, with different (and perhaps more complex) chemistry. If improved PV panel efficiency does not significantly improve the overall impact of the mini-grid, the environmental benefits of its use may be negative or marginal for this application.
Table 2 shows the normalized endpoint impact on the mini grid for each of the three efficiencies. It can be seen that whilst there was a mild overall improvement as the efficiency increased, it was not significant, suggesting that the use of highly efficient PV panels may not improve the overall impact of the mini-grid very much. Thus, for this system, there was thus limited benefit in focusing effort and resources on developing higher efficiency panels, as the overall impact will not be reduced significantly.
Given that the PV panels were one of the main contributors to the environmental impact of the mini-grid, and that panel efficiency does not seem to significantly reduce overall impact, it was sensible to consider what other options could be employed to reduce the impact driven by PV panel use. One option would be to consider the use of an additional power generation system to minimise the number of panels required. Keddar [20] suggested that complementing a PV system with a diesel generator can reduce the number of panels needed (especially since electricity requirement fluctuates throughout the day, peaking at mealtime and in the evening) [23]. Table 3 below (taken from Keddar) [24] provides the sizing for the PV, battery, inverter, and converter needed to cover 100% of the electricity requirements from a mini-grid using only PV panels and using a PV/diesel generator combination.
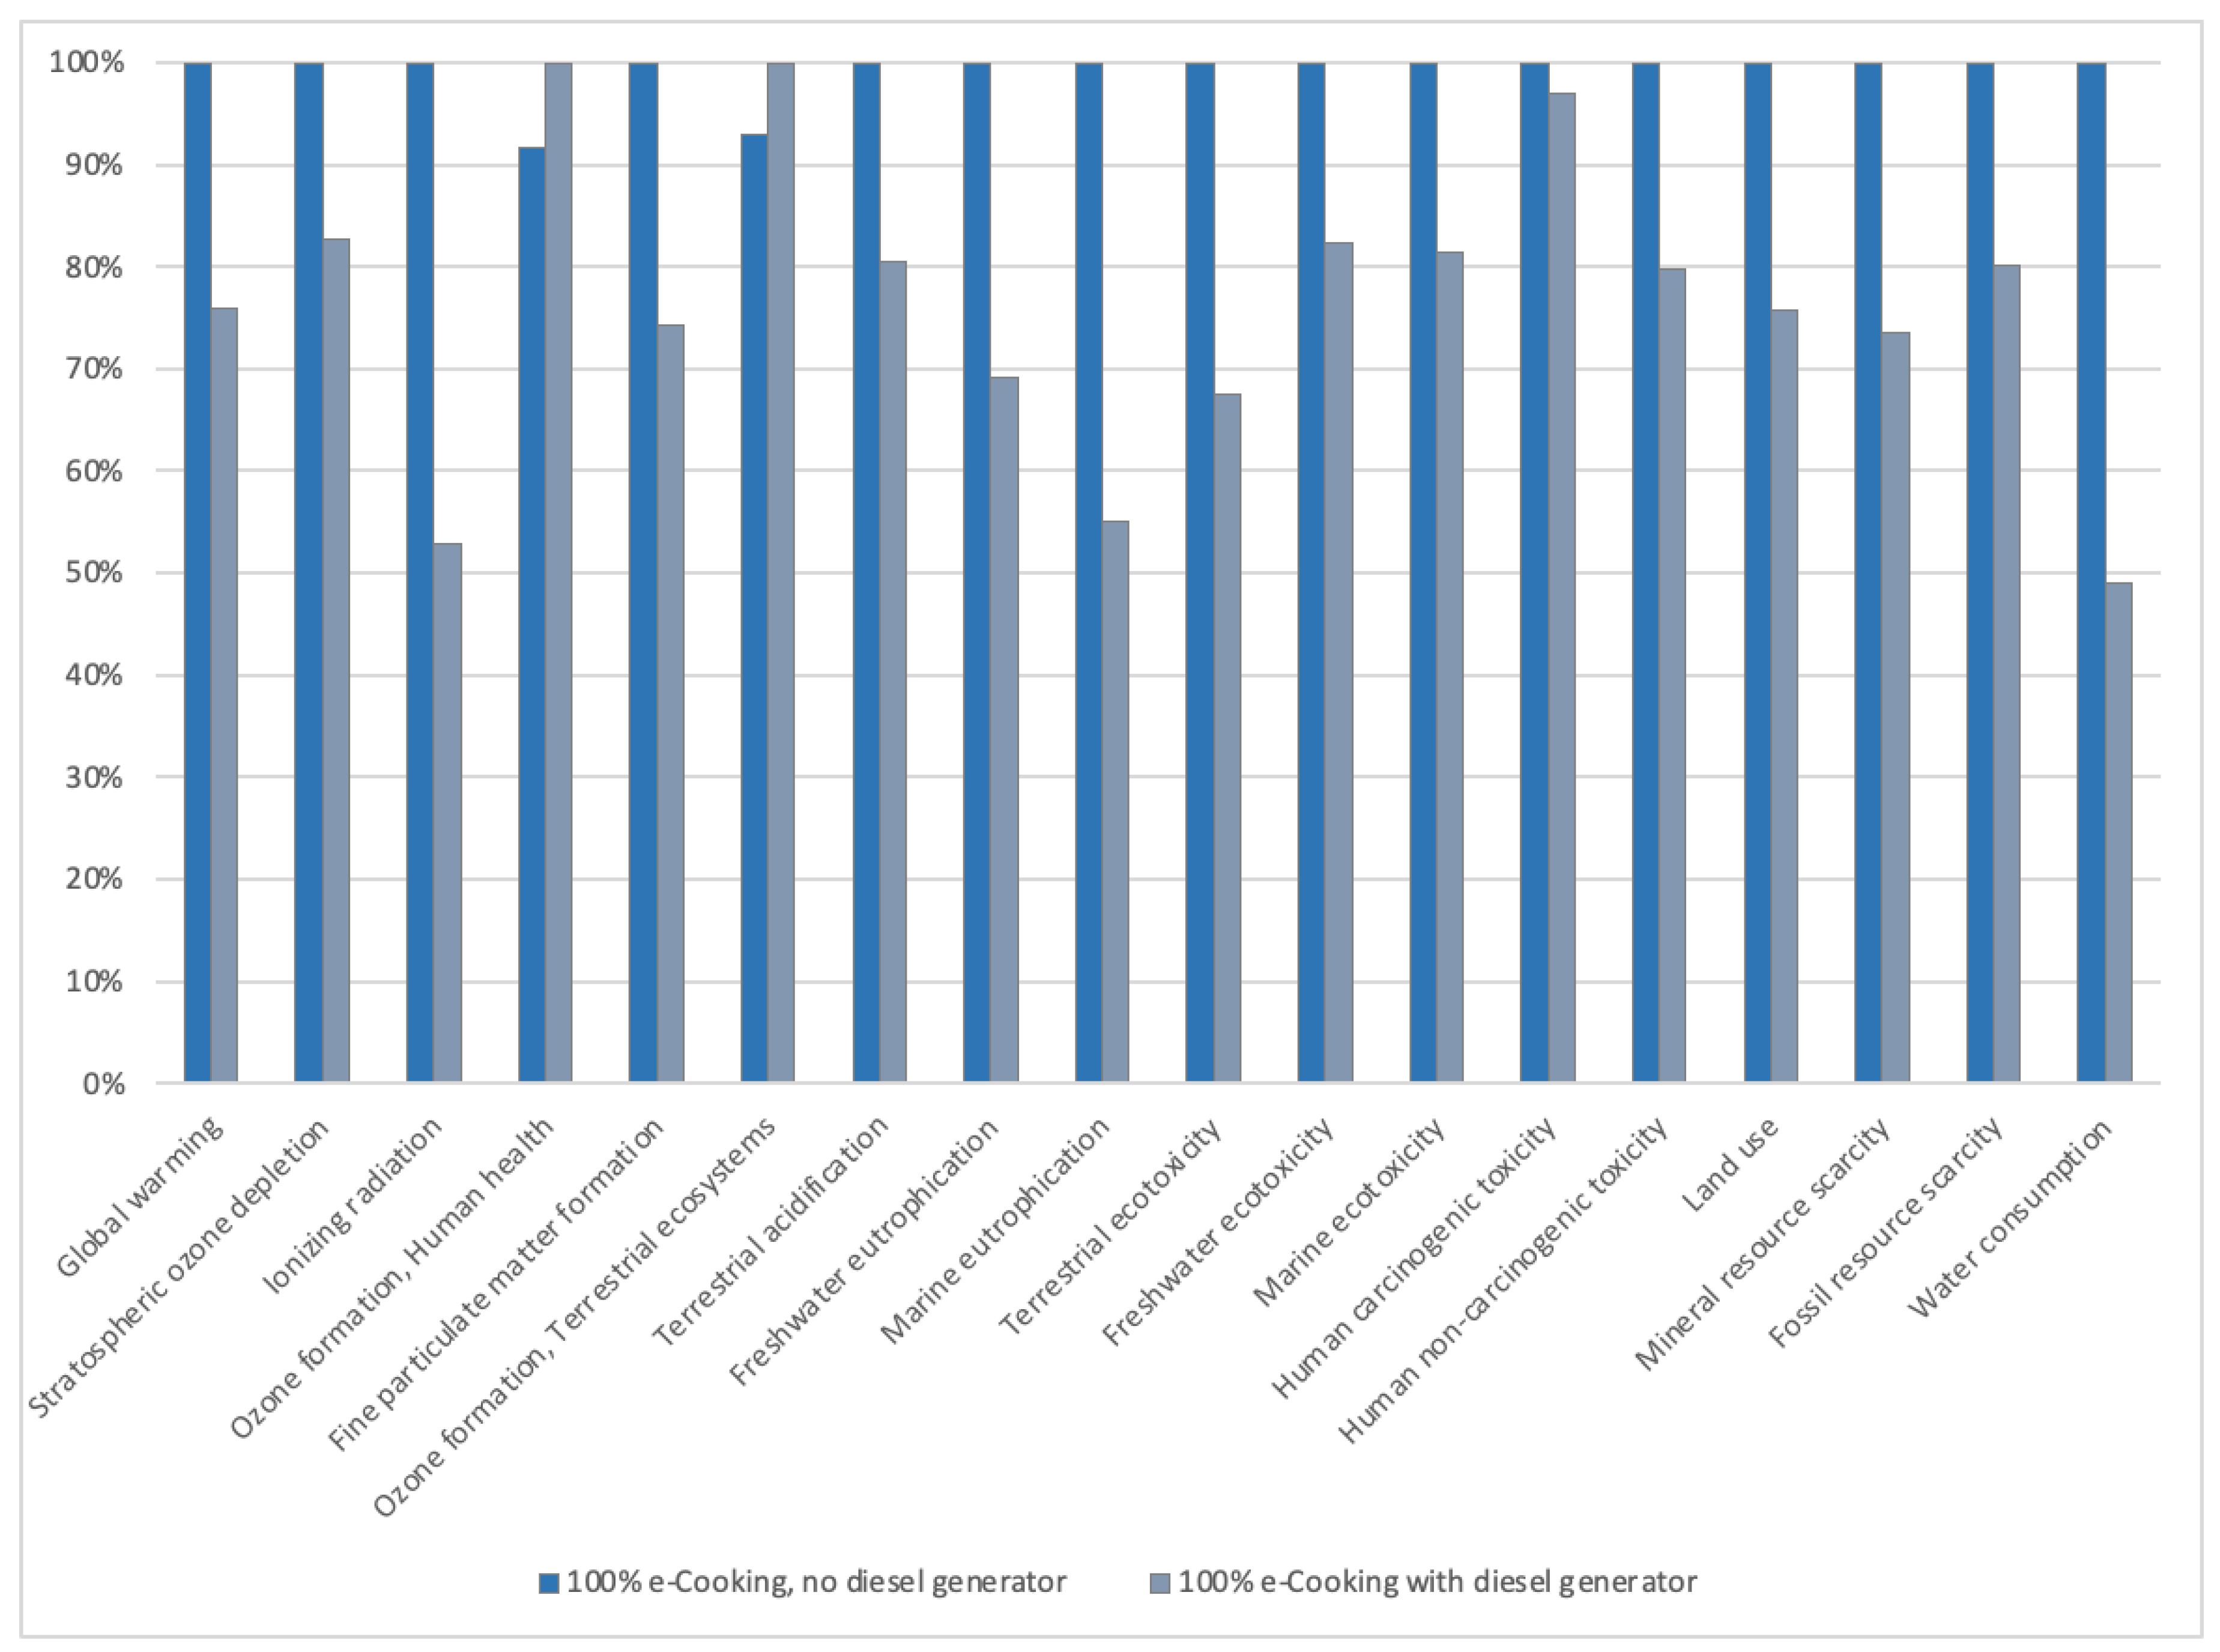
Figure 12 shows the environmental midpoint impact categories for the mini-grid, comparing a system without a diesel generator and one with. It was seen that out of the 18 categories listed, the combined PV/Diesel mini-grid system contributed less to the impact categories in 16 categories.
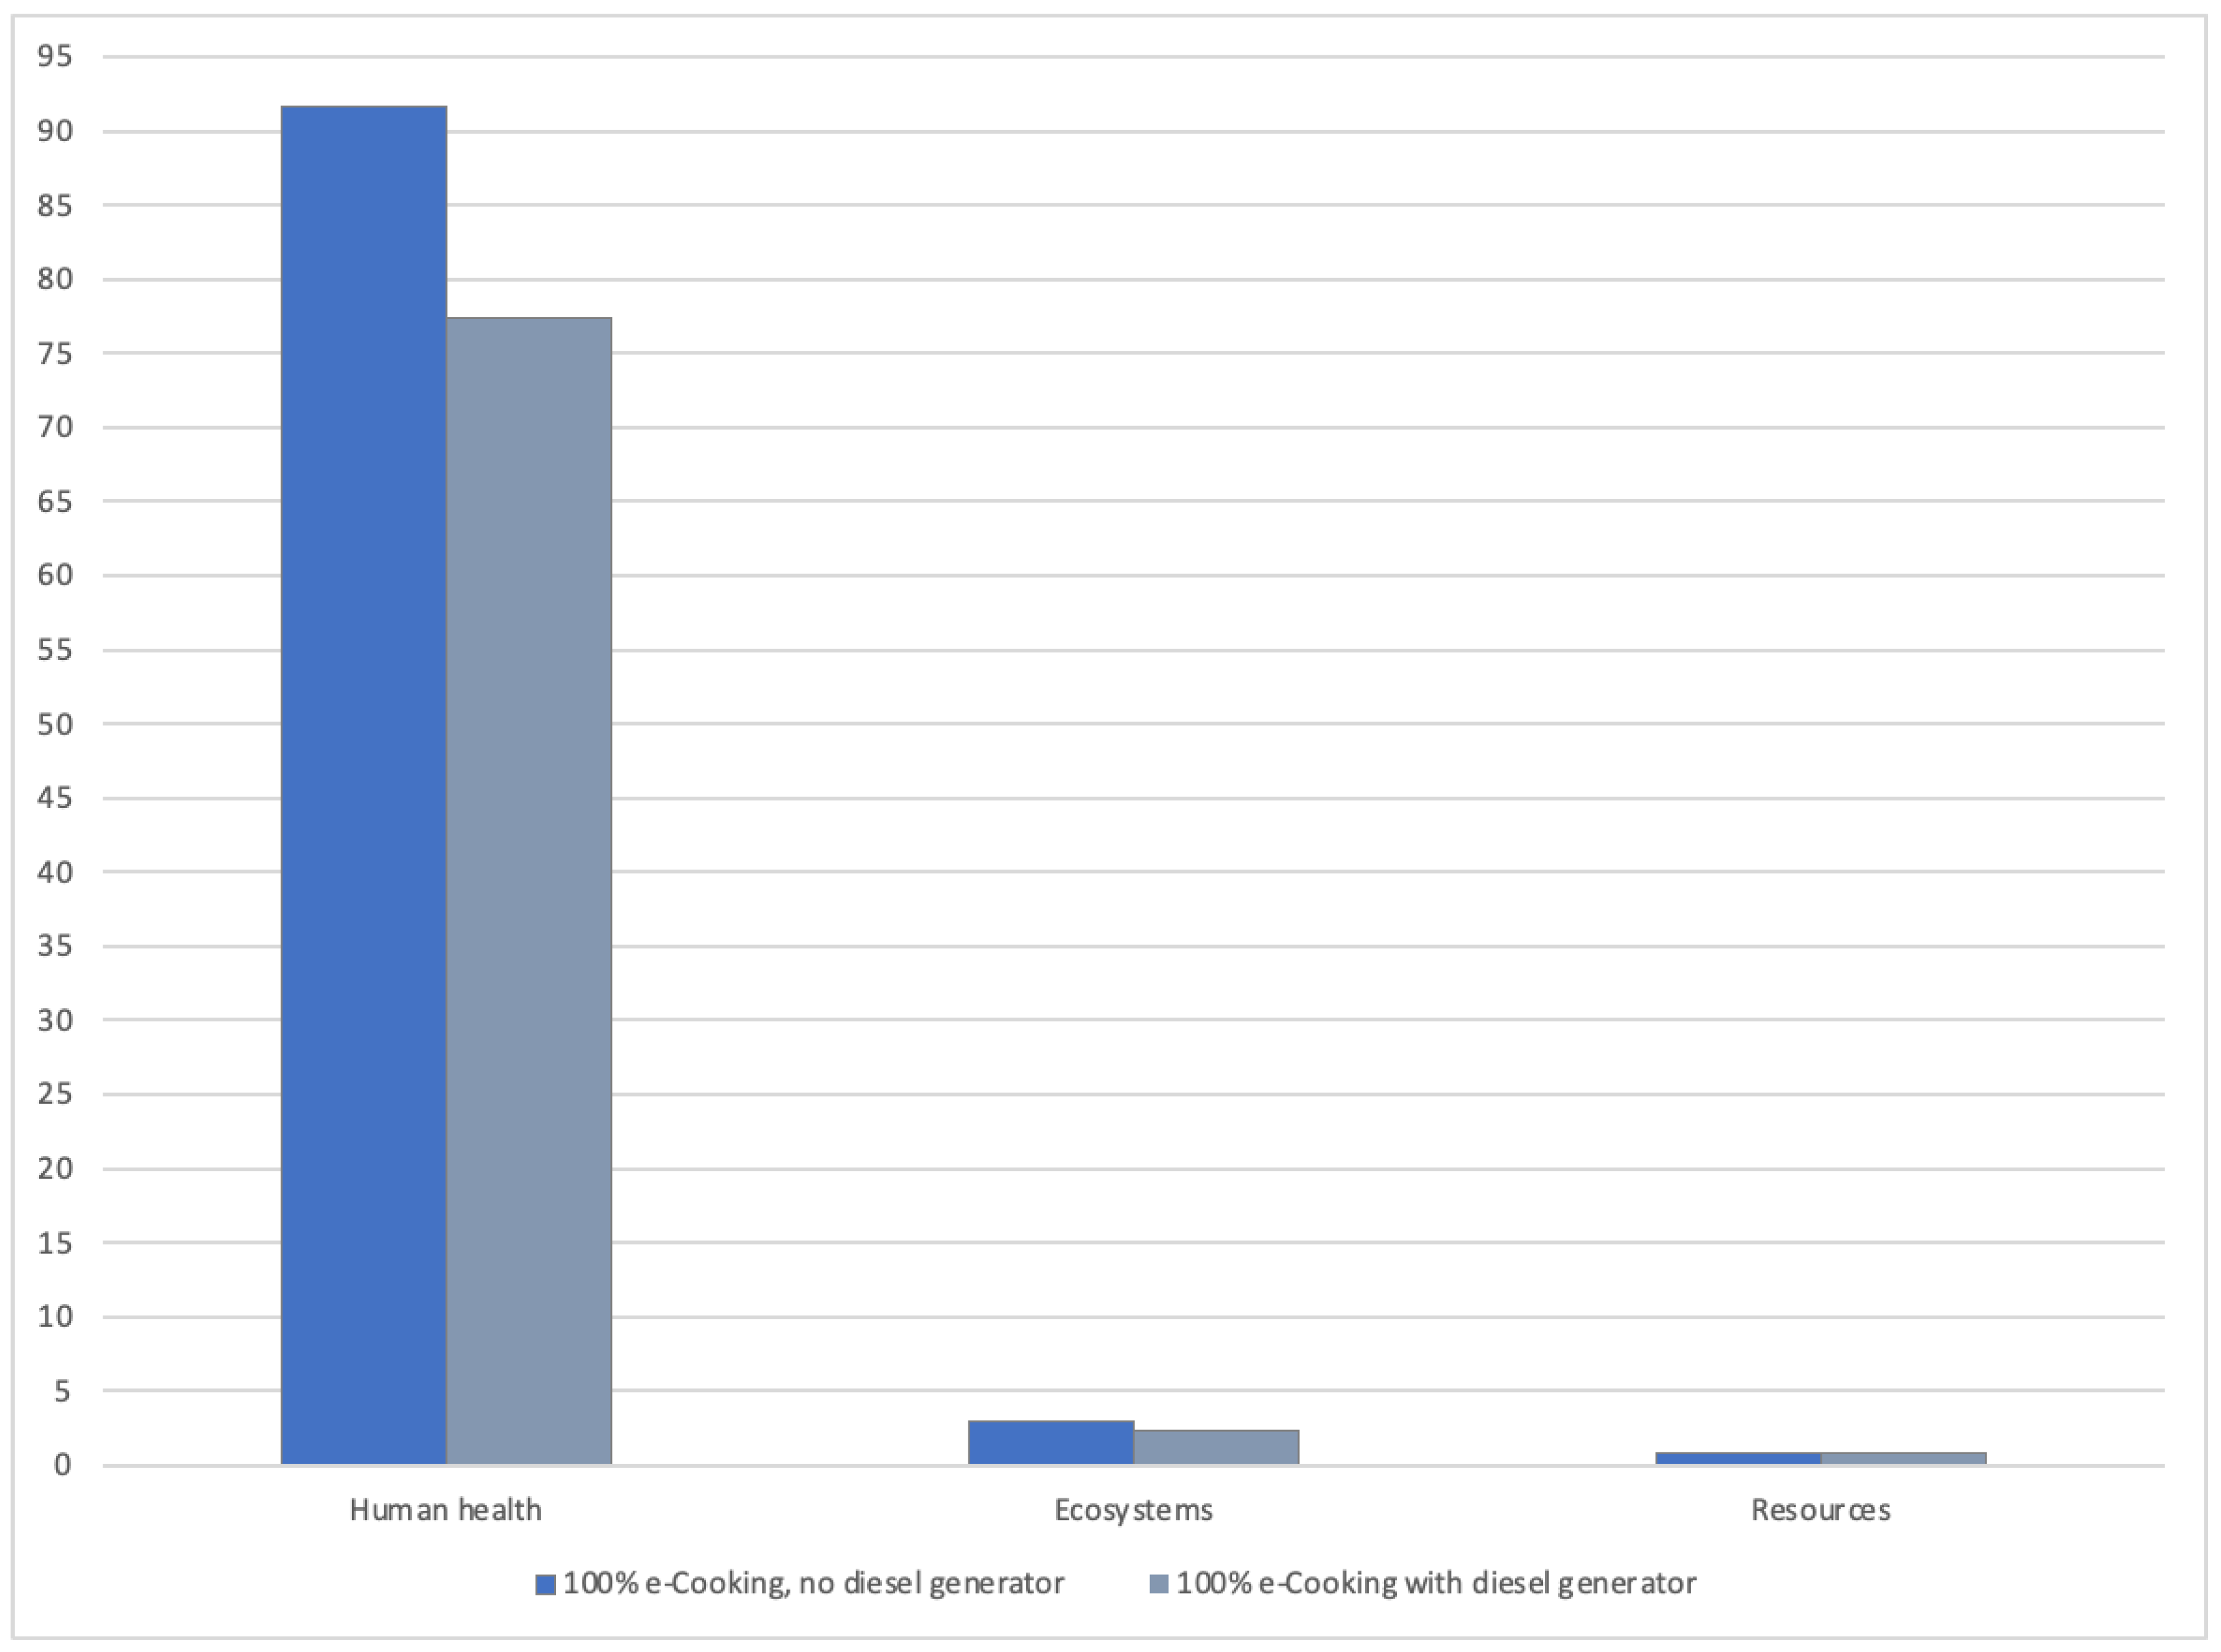
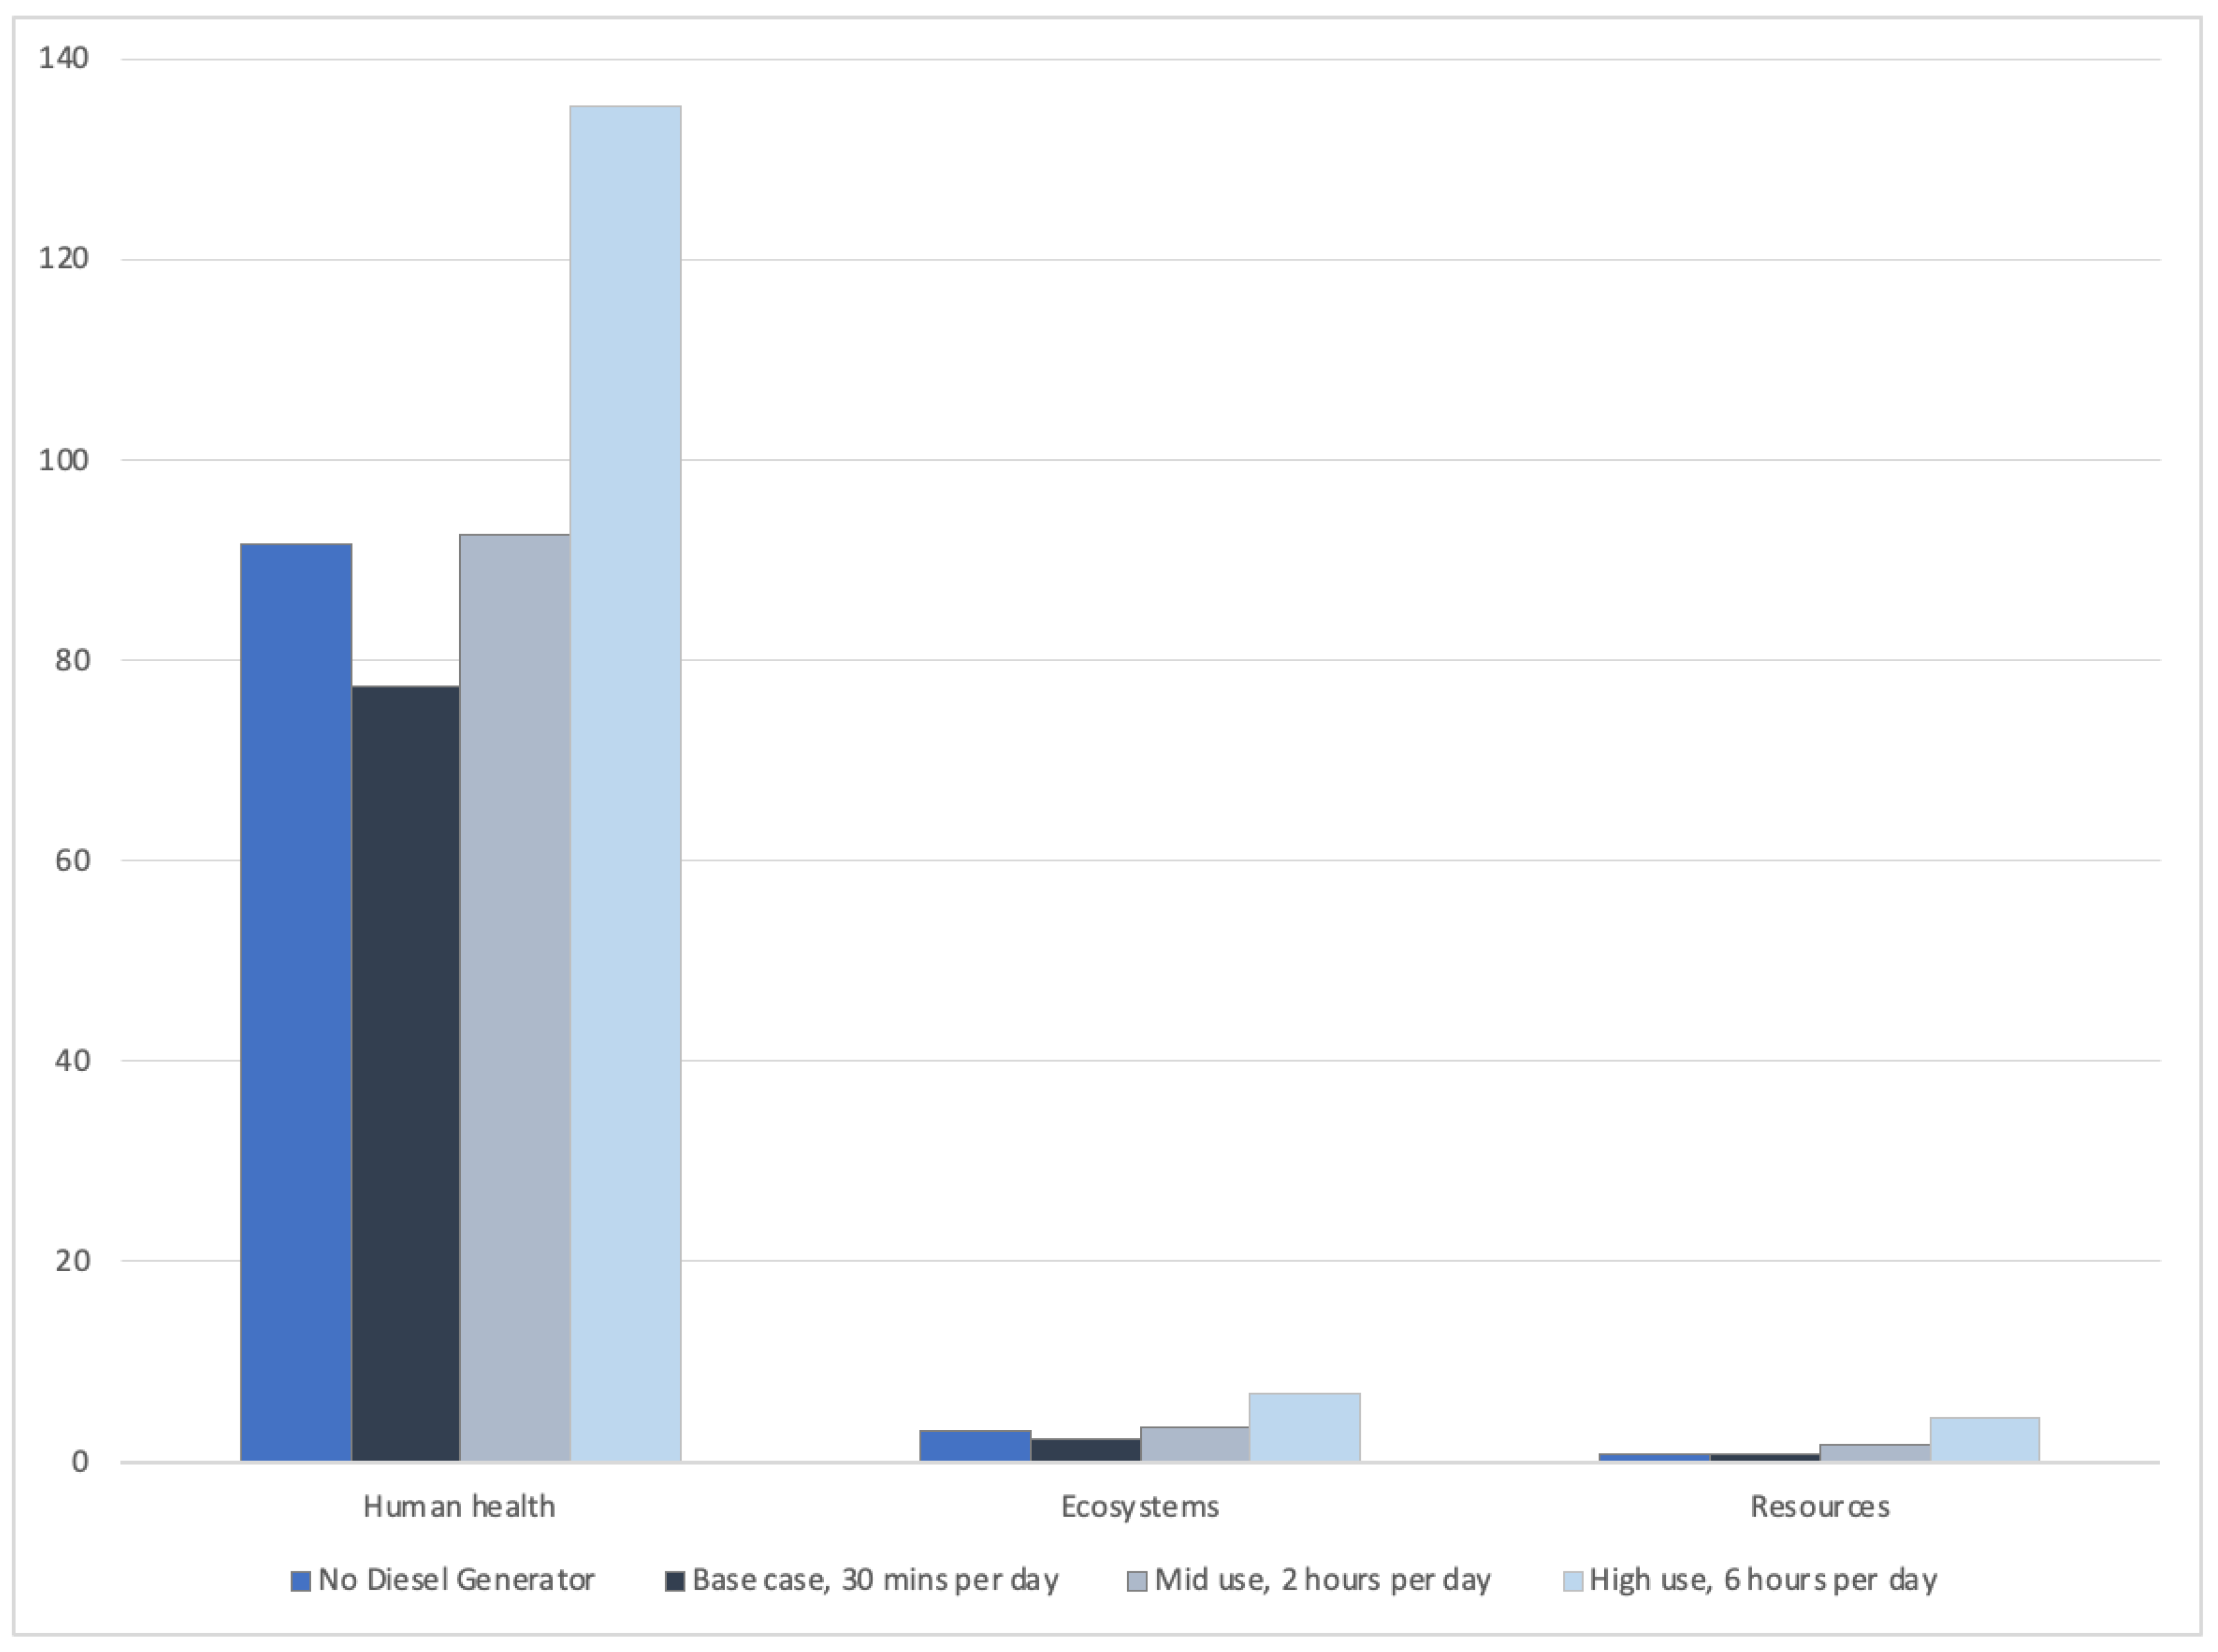
Figure 13 shows the normalized endpoint impact results and demonstrates that the effect of adding a diesel generator was to deliver a reduced impact. Clearly, this reduced impact is dependent on how long the diesel generator needs to operate. Thus, a sensitivity analysis was undertaken to assess the implication of the generator operating for 4300 h in 20 years (approx. 30 min per day), 14,600 h (approx. 2 h per day), and 43,800 (approx. 6 h per day).
Figure 14 shows the normalised endpoint impact category results. It can clearly be seen that, for this particular system, the benefits from using a diesel generator to supplement PV panels were only achievable when the diesel generator did not operate for more than about 2 h per day. This fits with the work by Keddar in that the diesel generator is used only when the system is at peak load, i.e., when many users require power at the same time, such as for cooking an evening meal. Above 2 h, the standalone PV system provided a more environmentally beneficial system.
4. Discussion
The environmental impact analysis for the mini-grid configuration and sizing for lighting, refrigeration, and phone charging suggests that the three areas of the mini-grid that show the highest impact scores were the PV panels, the wooden poles and stays, and cabling (specifically the AAC cable and the 16 mm2 twin figure 8 cable).
The most effective action to reduce the environmental impact of a mini-grid was to consider the material used for the poles and stays. It has been shown that concrete may be a suitable alternative material, but analysis would be needed to determine if the transport of concrete poles (if not produced locally) would outweigh the benefits over locally sourced and preserved wooden poles. The assumption that a chromium-based preservative was used on the wooden poles and stays was as a result of research into the production of telegraph poles and the standards used in Africa [21]. This assumption dominated the impact results for the non-power based mini-grid components and drove the scenario assessment for alternatives. If local wooden poles were chosen, then a non-chromium-based wood preservation process would significantly reduce the impact on human health.
For cables, the analysis suggests there was little benefit in substituting the AAC cables for the alternative, so the most beneficial option was to reduce the quantity required. This is highly dependent on the local landscape and available space to install the mini-grid power components. Security concerns also need to be considered, to stop trespassing near the equipment that could cause injury or death.
The overall impacts of the mini-grid were not unduly sensitive to the efficiency of the PV panel. The specification of highly efficient panels may (depending on complexity and chemistry) actually increase the overall impact of the mini-grid. For the mini-grid sized for lighting, more efficient PV panels would reduce the overall environmental impact of the system less than changing the poles and stays. For the mini-grid sized for e-cooking, the opposite is true: improving the panel efficiency would lead to greater environmental benefits overall. In general, however, as improvements to the manufacturing technology for PV panels increase, it is appropriate to assume that the PV panel contribution will reduce over time.
When the power components are modified to accommodate increased expected loadings, it can be seen that the main contribution to the environmental impact switches to the PV system, away from such items as poles/stays and cables. For mini-grids with this level of power requirements, it would be useful to consider combining PV panels with a diesel generator. The diesel generator is manufactured mainly from steel, a relatively low environmental impact material. The production of diesel itself produces more emissions, but it is the use of the diesel generator and associated emissions of combustion products that are the drivers of the impacts from the use of the diesel generator in supporting a PV mini-grid. Whilst it may seem counterintuitive that the combination of a diesel generator can reduce the environmental impact of a PV-powered mini-grid, this analysis suggests that the reduction in panels required (and the environmental impact associated with those) outweighs the environmental impact associated with the manufacture of a diesel generator and combustion of fossil fuel. Sizing the PV panels to meet the peak power demands of the mini-grid may not be sensible as it would require more than 13 times the PV panel area (see Table 1), and the inclusion of a diesel generator to provide the extra power at peak times is a simple solution. The diesel generator also removes the redundancy of panels not needed outside of peak loading. Essentially, the PV provides the base load for the mini-grid, and the diesel generator is used for peak load only. However, this only holds true when the generator is operated for less than 2 h per day. Should peak loading require the generator to operate for more than 2 h, the benefits are eradicated, and a system utilizing appropriately sized panels and battery used instead. This example highlights the need for careful sizing of mini-grid systems and that the sizing will be a key factor in determining the most appropriate combination of panels, batteries, and supporting equipment.
There are other issues that should be considered in the case of a combined PV/diesel powered mini-grid. There is potential for locally produced biofuel that could reduce the impact of the generator further or increase the hours that it could operate. However, since the main impacts result from the combustion of the fuel, rather than the production of diesel, the benefits may be marginal. This would require significant further analysis and will depend heavily on the biomass system used to create the biofuel. There are also benefits to having a generator that can be switched on quickly if there is a need to provide power at short notice or to compensate for when local weather conditions may have reduced the power available from the PV/battery system. These social benefits have not been factored into this environmental analysis.
Significant assumptions have been made for this study relating to the lifetime of components. As one of the key impact generators for mini-grids, the effect of the lifetime of the PV panels is worth exploring. A reduction in PV panel life would increase its contribution to total impact (assuming the mini-grid life remained at 20 years) and may (if sufficiently reduced) overtake the poles as the main issue of concern for all sized grids, not just those sized for e-cooking or higher loads. This would in turn suggest that (a) there is a driver for a more robust PV panel design as well as a more efficient design and (b) that diesel generators may be appropriate for use in a supporting capacity for less powerful mini-grid applications. In addition, the cost implications for frequent PV panel replacement could make mini-grids financially less attractive. By contrast, an extension to PV panel life to match the life of the poles and overhead cables would result in an increase in the small impact from batteries and inverters. The poles and cables are already assumed to last longer than the mini-grid (30 and 25 years, respectively). Any reduction in their lifespan (perhaps due to weather conditions or damage by animals) would increase their existing large contribution to the total impact. The batteries and inverter have a predicted life of 10 years. Increasing or decreasing this life span would affect their small contribution to the total impact, but it is unlikely to cause them to become an issue of concern.
Supplementary Materials
Supplementary Materials are available online at https://www.mdpi.com/article/10.3390/en14144227/s1.
Funding
This research was funded by the UK Foreign, Commonwealth and Development Office (FCDO) IATI Identifier GB-GOV-1-300123.
Acknowledgments
This paper was made open access through funding from the MECS programme, a UKAID funded programme led by Loughborough University. The opinions expressed do not necessarily reflect the opinions of the UK government.
Conflicts of Interest
The author declares no conflict of interest. The funders had no role in the design of the study; in the collection, analyses, or interpretation of data; in the writing of the manuscript, or in the decision to publish the results.
Appendix A
Items coloured green are included in the mini-grid model; the remainder have not been modelled. Details of how each item was modelled in Simapro can be found in the Supplementary Materials.

Table A1.
Bill of materials for the mini-grid.
| Malawi Mini-Grid BOM | ||||
|---|---|---|---|---|
| Section | Description | Unit | Qty | Comments |
| Power Components | ||||
| PV panels | m2 | 76.6 | 14.1 kWp at 16% efficiency. Modified from ecoinvent as a single crystal PV panel (GLO), market, Cut off U | |
| Battery | kWh | 41.1 | Lithium Iron Phosphate (LIB) | |
| Inverter | kW | 5 | Taken as multiples of the 2.5 kW inverter from ecoinvent, (GLO) Cut off U | |
| Converter | kW | 11.6 | Taken as multiples of 2.5 kW inverter from ecoinvent, (GLO) Cut off U | |
| Shipping container | m | 1 | Standard 20 ft container, Dimensions 5.89 × 2.35 × 2.36 | |
| Poles | ||||
| 9 m poles 140–160 mm | ea | 75 | Buried 1.5 m deep, no concrete | |
| Stay blocks | ea | 50 | Standard wooden block with hook, 1 m deep | |
| Cables/Conductors | ||||
| 50 mm AAC conductor | m | 6000 | Aluminium core | |
| 16 mm twin figure 8 | m | 1000 | Copper core | |
| 2 × 16 mm armored cable | m | 80 | From generation to first poles, 2 runs | |
| Stay wire 7/12 | m | 500 | Steel | |
| 4 mm2 single core cable red 100 m | ea | 2 | Assume a copper core | |
| 4 mm2 single core cable black 100 m | ea | 2 | Assume a copper core | |
| 2.5 mm2 single core cable red 100 m | ea | 8 | Assume a copper core | |
| 2.5 mm2 single core cable black 100 m | ea | 8 | Assume a copper core | |
| 2.5 mm2 single core cable green 100 m | ea | 10 | Used for earthing | |
| 1.5 mm2 single core cable red 100 m | ea | 30 | Assume a copper core | |
| 1.5 mm2 single core cable black 100 m | ea | 15 | Assume a copper core | |
| 1.5 mm2 single core cable green 100 m | ea | 15 | Assume a copper core | |
| Bare copper cable | ea | |||
| Overhead Materials | ||||
| Bobbin insulator | ea | 100 | Ceramic | |
| D-Iron, 2 bolts, 2 nuts, 2 washers, complete with bobbin | ea | 110 | 60 for hoses, 50 for use with poles with angles or junctions | |
| M16 × 200 GI bolt, nut, washer | ea | 48 | For the D-iron through pole | |
| M16 × 260 GI bolt, nut & washer | ea | 100 | For the bobbin through the pole | |
| LV Stay insulator | ea | 100 | Ceramic | |
| M16 Stay rod complete | ea | 50 | Steel | |
| Guy grip | ea | 110 | Steel | |
| PG clamp 50 mm AL/AL | ea | 150 | Overhead line | |
| PG clamp 50 mm AL/CU | ea | 150 | House connections | |
| Cable lug 16 mm | ea | 240 | Steel | |
| Distribution Board | ||||
| 4-Way distribution board | 60 | |||
| DB space covers | ea | 120 | ||
| 63A 2-Pole mainswitch RCCB 30mA | ea | 60 | 2 poles confirmed | |
| 5A MCB | ea | 60 | ||
| Earth rod 4ft | ea | 60 | ||
| PVC | ||||
| 20 mm PVC conduits | bundle | 18 | 25 pieces in a bundle | |
| 20 mm PVC couplings | ea | 2200 | ||
| 20 mm PVC nipples | ea | 2000 | ||
| 20 mm PVC saddles | ea | 800 | ||
| Round boxes | ea | 900 | ||
| Round box covers | ea | 700 | ||
| PVC boxes 175 × 150mm | ea | 60 | ||
| PVC boxes 75 × 75mm | ea | 240 | ||
| Electrical Fittings | ||||
| Batten lampholder | ea | 128 | Ceramic | |
| LED bulb 5 W | ea | 128 | Indoor light bulbs | |
| Wall glass fitting | ea | 56 | Outside light bulb holder | |
| LED bulb 10 W | ea | 56 | Outside light bulb | |
| Double sockets | ea | 60 | ||
| Switch: 1 gang 1 way | ea | 184 | Every light gets a 1 gang one way switch—option for 2 gang below | |
| Switch: 2 gang 2 way | ea | 30 | Enough for half the houses if needed | |
| Consumables | ||||
| Self-tapping screws 1” 8G for PVC boxes | packet | 10 | ||
| Insulation tape | roll | 10 | ||
| Hacksaw blades | ea | 10 | ||
| 2” nails | kg | 4 | ||
Table A2.
Expected lifetimes of mini-grid components.
| Item | Lifetime, Years |
|---|---|
| Minigrid | 20 |
| PV panel | 20 |
| Battery | 10 |
| Inverter | 10 |
| Converter | 10 |
| Shipping container | 25 |
| Poles and stays | 30 |
| Overhead equipment | 20 |
| Heavy duty cabling | 30 |
| Light duty cabling | 25 |
| PVC components | 15 |
References
- UN SDG 7. Affordable and Clean Energy. Available online: https://www.un.org/sustainabledevelopment/energy/ (accessed on 20 May 2021).
- IEA; IRENA; UNSD; World Bank; WHO; SDG 7. Tracking the Energy Progress Report 2020. 2020. Available online: https://trackingsdg7.esmap.org/data/files/download-documents/tracking_sdg_7_2020-full_report_-_web_0.pdf (accessed on 20 May 2021).
- ESMAP. Cooking with Electricity: A Cost Perspective, World Bank Group. 2020. Available online: http://documents1.worldbank.org/curated/en/920661600750772102/pdf/Cooking-with-Electricity-A-Cost-Perspective.pdf (accessed on 20 May 2021).
- ESMAP. Mini Grids for Half a Billion People: Market Outlook and Handbook for Decision Makers. 2019. Available online: https://openknowledge.worldbank.org/handle/10986/31926 (accessed on 20 May 2021).
- Bilch, A.; Langham, K.; Geyer, R.; Goyal, L.; Hansen, J.; Krishnan, A.; Bergesen, J.; Sinha, P. Life cycle assessment of solar photovoltaic micro-grid systems in off-grid communities. Environ. Sci. Technol. 2017, 51, 1043–1052. [Google Scholar] [CrossRef] [PubMed]
- Aberilla, J.M.; Gallego-Schmid, A.; Stamford, L.; Azapagic, A. Design and environmental sustainability assessment of small-scale off-grid energy systems for remote rural communities. Appl. Energy 2020, 258, 114004. [Google Scholar] [CrossRef]
- Akinyele, D. Analysis of photovoltaic mini-grid systems for remote locations: A techno economic approach. Int. J. Energy Res. 2017, 42, 1363–1380. [Google Scholar] [CrossRef]
- Mahmud, M.A.P.; Huda, N.; Farjana, S.H.; Lang, C. Environmental life-cycle assessment and techno-economic analysis of photovoltaic (PV) and photovoltaic/thermal (PV/T) systems. In Proceedings of the IEEE International Conference on Environment and Electrical Engineering, Palermo, Italy, 12–15 June 2018. [Google Scholar] [CrossRef]
- Smith, C.; Burrows, J.; Scheier, E.; Young, A.; Smith, J.; Young, T.; Gheewala, S.H. Comparative Life Cyele assessment of a Thai Islands Diesel/PV/wind hybrid microgrid. Renew. Energy 2015, 80, 85–100. [Google Scholar] [CrossRef]
- Schnitzer, D.; Lounbury, D.S.; Carvallo, J.P.; Deshmukh, R.; Kammen, D. Micro-Grids for Rural Electrification: A Critical Review of Best Practises Based on Seven Case Studies; Report of the United Nations Foundation; United Nations Foundation: Washington, DC, USA, 2014. [Google Scholar]
- Üçtuğ, F.G.; Azapagic, A. Environmental impacts of small scale hybrid ebergy systems: Coupling solar photovoltaics and lithium ion batteries. Sci. Total Environ. 2018, 643, 1579–1589. [Google Scholar] [CrossRef] [PubMed] [Green Version]
- Frischknecht, R.; Kim, H.C.; Frischknecht, R.; Raugei, M.; Sinha, P.; Stucki, M. Life Cycle Inventories and Life Cycle Assessment of Photovoltaic Systems; Report of the International Energy Agency PVPS Task 12 Working Group; IEA International Energy Agency: Paris, France, 2015. [Google Scholar]
- ISO. Environmental Management—Life Cycle Assessment—Principles and Framework; BS EN ISO 14040: 2006; ISO: Geneva, Switzerland, 2006. [Google Scholar]
- ISO. Environmental Management—Life Cycle Assessment—Requirements and Guidelines; BS EN ISO 14044: 2006 +A1: 2018; ISO: Geneva, Switzerland, 2018. [Google Scholar]
- EASE. Available online: https://ease.eee.strath.ac.uk/2020/06/27/switch-on-for-first-ease-microgrid/ (accessed on 8 December 2020).
- Eales, A.; University of Strathclyde, Glasgow, UK. Personal communication, 2020.
- Huijbregts, M.A.J.; Steinmann, Z.J.N.; Elshout, P.M.F.; Stam, G.; Verones, F.; Vieira, M.; Zijp, M.; Hollander, A.; van Zelm, R. ReCiPe2016: A harmonised life cycle impact assessment method at midpoint and endpoint level. Int. J. Life Cycle Assess. 2017, 22, 138–147. [Google Scholar] [CrossRef]
- SimaPro Database Manual, Methods Library. p. 36. Available online: https://simapro.com/wp-content/uploads/2020/10/DatabaseManualMethods.pdf (accessed on 20 May 2021).
- Ellingsen, L.A.-W.; Majeau-Bettez, G.; Singh, B.; Srivastava, A.K.; Valøen, L.O.; Strømann, A.H. Life cycle assessment of a lithium-ion battery vehicle pack. J. Ind. Ecol. 2014, 18, 113–124. [Google Scholar] [CrossRef] [Green Version]
- Keddar, S.; Strachan, S.; Eales, A.; Galloway, S. Assessing the techno-economic feasibility of eCook deployment on a hybrid solar-diesel mini-grid in rural Malawi. In IEEE PEA/IAS Power Africa; IEEE: Piscataway, NJ, USA, 2020. [Google Scholar] [CrossRef]
- East African Community. Copper/Chromium/Arsenic Compositions for the Preservation of Timber—Method for Timber Treatment; East African Standard EAS 324; East African Community: Arusha, Tanzania, 2000. [Google Scholar]
- Andreani, L.C.; Bozzola, A.; Kowalczewski, P.; Liscidini, M.; Redorici, L. Silicon solar cells: Toward the efficiency limits. Adv. Phys. X 2019, 4, 1548305. [Google Scholar] [CrossRef] [Green Version]
- Leach, M.; Mullen, C.; Lee, J.; Soltowski, B.; Wade, N.; Galloway, S.; Coley, W.; Keddar, S.; Scott, N.; Batchelor, S. Modelling the Costs and Benefits of Moving to Modern Energy Cooking Services—Methods & Application to Three Case Studies. Modern Energy Cooking Services Programme, Working Paper. April 2021. Available online: https://mecs.org.uk/wp-content/uploads/2021/05/Modelling-the-costs-and-benefits-of-moving-to-Modern-Energy-Cooking-Services-–-methods-application-to-three-case-studies.pdf (accessed on 7 May 2021).
- Keddar, S.; University of Strathclyde, Glasgow, UK. Personal communication, 2020.
Figure 1.
Representation of the relations between the impact categories midpoint and the areas of production (endpoint). Reproduced using information from [17].
Figure 1.
Representation of the relations between the impact categories midpoint and the areas of production (endpoint). Reproduced using information from [17].

Figure 2.
Contribution analysis to midpoint categories of main component groups to impacts from the mini-grid.
Figure 2.
Contribution analysis to midpoint categories of main component groups to impacts from the mini-grid.

Figure 3.
Contribution analysis to midpoint categories of component groups in Energy_MGrid.

Figure 4.
Contribution analysis to midpoint categories of component groups in cables to impacts from the mini-grid.
Figure 4.
Contribution analysis to midpoint categories of component groups in cables to impacts from the mini-grid.

Figure 5.
Contribution analysis to midpoint categories of main component groups to impacts from a mini-grid sized for e-cooking.
Figure 5.
Contribution analysis to midpoint categories of main component groups to impacts from a mini-grid sized for e-cooking.

Figure 6.
Contribution analysis to midpoint categories for the poles and stays.

Figure 7.
Midpoint category results for different pole and stay systems: wood with a chromium-based preservative, wood with a non-chromium-based preservative, and concrete.
Figure 7.
Midpoint category results for different pole and stay systems: wood with a chromium-based preservative, wood with a non-chromium-based preservative, and concrete.

Figure 8.
Endpoint damage assessment for three alternative systems for poles and stays.

Figure 9.
Normalised endpoint impact categories for the mini-grid (excluding power components) for three alternative poles and stays systems.
Figure 9.
Normalised endpoint impact categories for the mini-grid (excluding power components) for three alternative poles and stays systems.

Figure 10.
Midpoint category results for AAC and twin figure 8 cable with the ABC cabling option.

Figure 11.
Normalised endpoint impact categories for the AAC cable system and ABC cable system.

Figure 12.
Midpoint category results for the PV mini-grid and PV/diesel generator mini-grid.

Figure 13.
Normalised endpoint impact categories for a PV mini-grid and PV/diesel mini-grid.

Figure 14.
Normalised endpoint impact categories for the mini-grid with PV alone and mini-grid with PV/diesel generator operating for 30 min per day, 2 h per day, and 6 h per day.
Figure 14.
Normalised endpoint impact categories for the mini-grid with PV alone and mini-grid with PV/diesel generator operating for 30 min per day, 2 h per day, and 6 h per day.

Table 1.
Sizing of power components for a mini-grid used to support e-cooking.
| Base Load with No e-Cooking | Base Load Plus 100% e-Cooking | |
|---|---|---|
| PV panel size, kWp|m2 (assume 16% efficiency) | 14.1|76.6 | 190|1032 |
| Battery kWh | 41.1 | 124 |
| Inverter kW | 5 | 20 |
| Converter kW | 11.6 | 24 |
Table 2.
Normalised endpoint categories for different PV panel efficiencies.
| PV Efficiency 8% | PV Efficiency 16% | PV Efficiency 25% | |
|---|---|---|---|
| Human Health | 52.04 | 49.96 | 49.21 |
| Ecosystems | 0.88 | 0.76 | 0.72 |
| Resources | 0.19 | 0.15 | 0.13 |
Table 3.
Sizing of power components for a PV mini-grid and PV/diesel generator combination min-grid.
Table 3.
Sizing of power components for a PV mini-grid and PV/diesel generator combination min-grid.
| PV Only | PV and Diesel Generator | |
|---|---|---|
| PV panel size, kWp|m2 (assume 16% efficiency) | 190|1032 | 81.1|440 |
| Battery kWh | 124 | 110.4 |
| Inverter kW | 20 | 20 |
| Converter kW | 24 | 21.6 |
| Diesel Generator kW | n/a | 28 |
| Hours of Operation over 20 years | n/a | 4300 |
Publisher’s Note: MDPI stays neutral with regard to jurisdictional claims in published maps and institutional affiliations. |
© 2021 by the author. Licensee MDPI, Basel, Switzerland. This article is an open access article distributed under the terms and conditions of the Creative Commons Attribution (CC BY) license (https://creativecommons.org/licenses/by/4.0/).
Share and Cite
MDPI and ACS Style
Lee, J. Environmental Hotspot Assessment for a PV Mini-Grid Design: A Case Study for Malawi. Energies 2021, 14, 4227. https://doi.org/10.3390/en14144227
AMA Style
Lee J. Environmental Hotspot Assessment for a PV Mini-Grid Design: A Case Study for Malawi. Energies. 2021; 14(14):4227. https://doi.org/10.3390/en14144227
Chicago/Turabian StyleLee, Jacquetta. 2021. "Environmental Hotspot Assessment for a PV Mini-Grid Design: A Case Study for Malawi" Energies 14, no. 14: 4227. https://doi.org/10.3390/en14144227
Note that from the first issue of 2016, this journal uses article numbers instead of page numbers. See further details here.