Article

Joint Optimal Planning of Electricity and Modern Energy Cooking Services Access in Nyagatare

by
Eduardo Sánchez-Jacob
1,2,*,
Andrés González-García
3,
Javier Mazorra
2,
Pedro Ciller
3,
Julio Lumbreras
1,2,4 and
José Ignacio Pérez-Arriaga
3,5
1
Department of Chemical and Environmental Engineering, School of Industrial Engineering, Universidad Politécnica de Madrid (UPM), 28006 Madrid, Spain
2
Innovation and Technology for Development Centre at the Technical University of Madrid (itdUPM), 28040 Madrid, Spain
3
Institute for Research in Technology (IIT), ICAI, Comillas Pontifical University, 28015 Madrid, Spain
4
Harvard T. H. Chan School of Public Health, 401 Park Drive, Boston, MA 02215, USA
5
Massachusetts Institute of Technology (MIT) Sloan School of Management, Cambridge, MA 02142, USA
*
Author to whom correspondence should be addressed.
Energies 2021, 14(14), 4093; https://doi.org/10.3390/en14144093
Submission received: 8 June 2021 / Revised: 28 June 2021 / Accepted: 30 June 2021 / Published: 6 July 2021

Abstract

:
In 2019, there were 759 million people globally without access to electricity and 2.6 billion people lacked access to clean cooking. Cooking with electricity could contribute to achieving universal access to energy by 2030. This paper uses geospatially-based techniques—a computer model named REM, for Reference Electrification Model—to show the impact of integrating electric cooking into electrification planning. Three household scenarios were analyzed: one for providing basic electricity access with no electric cooking; another for cooking with electricity; and the third for cooking half of the meals with electricity and half with another fuel, with a clean stacking process. Results of the application of REM to the three scenarios were obtained for the Nyagatare District, Rwanda. The case study showed that electric cooking substantially changes the mix of technologies and the total cost of the least-cost electrification plan. It also showed that electric cooking can be cost competitive compared to LPG and charcoal in grid-connected households and can reduce greenhouse emissions. Stacking with energy-efficient electric appliances provides most of the benefits of full electric cooking at a lower cost and is a pathway worthy of further consideration.

Graphical Abstract

1. Introduction

In 2015, the General Assembly of the United Nations approved the 2030 Agenda for Sustainable Development and the seventeen Sustainable Development Goals (SDGs). SDG 7 is devoted to ensuring access to affordable, reliable, sustainable, and modern energy for all, with five targets: universal access to electricity and clean cooking; increased use of renewable energy; improvement in energy efficiency; enhancement of international cooperation to facilitate access to clean energy research and technology; and expansion of infrastructure and upgrading of technology [1]. Fulfilling SDG 7 is fundamental to achieving most of the SDGs because of the high interrelationship that exists between them [2].
In recent years, notable progress in expanding access to electricity has been made in several countries and the global population lacking access dropped from 1.2 billion in 2010 to 759 million in 2019. Meanwhile, access to clean cooking was expanding at an annualized average of just 1.0% between 2010 and 2019 and at this rate universal access will fall short of the SDG target by nearly 28 percent. A total of 2.4 billion people are estimated to be living without clean cooking [3].
The COVID-19 pandemic has profoundly disrupted all human activity since February 2020. The impact on the energy sector has been more significant than that produced by any recent event; its effects will last for years and may undermine the ongoing energy transition [4]. Vulnerability to COVID-19 has been greater in rural and peri-urban populations using firewood for cooking [5], highlighting the need for recovery plans that focus on an integrated response to access to modern energy cooking in low- and middle-income countries [6].
Lack of access to clean cooking produces a wide range of health impacts and contributes to between 2.6 and 3.8 million premature deaths a year caused by household air pollution (HAP) [7,8]. Moreover, the collection of firewood and charcoal in an unsustainable manner exacerbates the deforestation problems and contributes to climate change. Women often bear a significant burden in terms of fuelwood collection and cookstove preparation and are more affected by HAP. Therefore, addressing the lack of modern energy cooking services (MECS) [9] yields important co-benefits and contributes not only to achieving SDG 7, but also SDG 3, “Ensure healthy lives and promote well-being for all at all ages”, SDG 5, “Achieve gender equality and empower all women and girls”, and SDG 13, “Take urgent action to combat climate change and its impacts” [10].
Clean cooking solutions in terms of health are considered as fuel–stove combinations that achieve emissions performance measurements of Tier 4 or higher following ISO/TR (2018) 19867-3:2018 Voluntary Performance Targets, which refers to the World Health Organization guidelines for indoor air quality [11]. Smith and Sagar [12] pointed to two strategies to achieve clean cooking solutions: “making the available clean” and “making the clean available”. The first consists of using regularly available fuels such as wood and charcoal with improved cookstoves (ICSs) that meet the ISO/TR standard. However, it is difficult to burn biomass without smoke build-up indoors and air pollution outdoors. Many analyses in laboratories and in the field have found that there are hardly any “clean” ICSs [11,13,14,15]; therefore, this first strategy should be considered an interim solution.
The strategy of “making the clean available” aims to make more accessible, reliable, and affordable fuels that meet WHO’s guidelines with any stove, namely gaseous fuels, such as liquefied petroleum gas (LPG), natural gas and biogas, or electricity. LPG has been the most promoted energy driver, with strong support from governments and international organizations globally [16]. National LPG penetration targets for the coming years include, for instance, 58% in Cameroon, 50% in Ghana, and 35% in Kenya by 2030 [17]. However, in some African countries its expansion has come at the expense of high subsidies, which are difficult to maintain in the long term [10,18].
Electricity use for cooking is significant in high-income countries but in low- and middle-income countries (LMICs) it is limited [3], albeit with some exceptions such as the Southern Africa region. Cooking with electricity permits the use of not only stoves or hobs, but also a wide range of appliances to allow a better adjustment to cooking needs, such as ovens, microwave ovens, toasters, rice cookers, slow cookers, pressure cookers, kettles, etc. In addition, some of these appliances are highly energy-efficient, such as the induction stoves that transmit the energy directly to the cooking vessel or those with high thermal insulation, which reduce energy consumption by a factor of roughly seven compared to electric hobs [19]. For example, electric pressure cookers (EPCs) enable the preparation of meals that traditionally require long boiling times, such as beans, which are a staple food in many countries and which consume a large proportion of cooking energy. EPCs provide significant energy savings and could have a transformative role for cooking, similar to that of LED for lighting. However, cooking behavior is determined and reinforced through everyday social interactions [20], and the adoption of new technologies faces cultural barriers, the inertia of tradition, economic constraints, unwillingness to pay for new equipment, and external factors [21,22].
The main barriers to using electricity as an energy driver for cooking are, in addition to social and cultural constraints, the lack of access to electricity in rural areas, unreliable and unstable power supply, restrictions during peak hours, and the higher cost of electricity compared with other cooking alternatives [23]. However, in recent years some constraints are being relaxed; access to electricity is accelerating, surpassing population growth since 2015 in sub-Saharan Africa [24], the cost of power generation with renewable resources is dropping [25], and photovoltaic panels are becoming ubiquitous globally. Some countries in sub-Saharan Africa have surplus generation capacity to supply new demand [26] and, in new areas to be electrified, the increase in household electricity demand will lead to a decrease in unit electricity cost. In this context, electric cooking is arousing new interest as a means of promoting electricity and MECS access simultaneously, thus “killing two birds with one stone” [27].
Clean cooking is a necessary condition to meet MECS but is not sufficient. MECS refers to a household context that meets the standards of Tier 4 or higher across all the measurement attributes of the Multi-Tier Framework (MTF) for cooking. MTF for cooking is a multidimensional tier approach to measuring household access across six technical and contextual attributes: convenience, fuel availability, safety, affordability, efficiency, and exposure. The MTF provides detailed indicators and thresholds, with a rating ranging from level 0, when there is no access, to level 5, when there is full access. The overall rating of a cooking system is the same as the value given to its lowest-ranked attribute [9].
The definition of MECS does not include climate change impacts and fuel sustainability, but it is impossible to ignore these issues due to the current climate crisis and the global target of carbon neutrality by 2050. Although cooking is not amongst the top sources of the global greenhouse gas (GHG) emissions and LMICs are not major emitters [28], any long-term planning exercise involving large populations must contemplate the emission reduction target in line with the Paris Agreement. Biomass fuels, even if renewably harvested, are not GHG neutral because of their substantial emission of products from incomplete combustion (PIC) [29]. Natural gas and LPG are non-renewable resources and although their GHG emissions are much lower than those of biomass, they are not negligible [30], which has led some countries to impose banning their use in future households [31].
Emissions from electricity depend on how it is produced. When it is generated in coal-fired plants, emissions from electric cooking can be higher than those of cooking with firewood or LPG [30]. However, when it is produced with renewable sources, its emissions are almost zero in the generation and use phases, and low considering the entire life cycle. Therefore, long-term planning should favor cooking with electricity from renewable energy sources, in line with the IPCC recommendation of electrification of energy end-use by 2050 [32].
Electrification planning and MECS are critical for the achievement of SDG7, which requires a multidisciplinary approach that considers techno-economic, political, and regulatory factors (among others). Precise data and robust planning tools are critical for producing a realistic, implementable electrification plan. Although geospatial electrification models have a long trajectory in the literature [33,34,35], their use for MECS is at an incipient stage [36].
The dissemination, adoption and prolonged use of electric cooking will depend on multiple factors, such as the enabling environment, industry infrastructure, pricing and costing, factors influencing consumer demand, and user and community needs and perceptions [16], but technical and economic feasibility must be a precondition. There are studies about specific electric cooking appliances, such as the electric Mitad in Ethiopia [37] or EPCs [38], the cooking patterns using electricity [39,40], the potential of cooking with electricity in several settings [19,
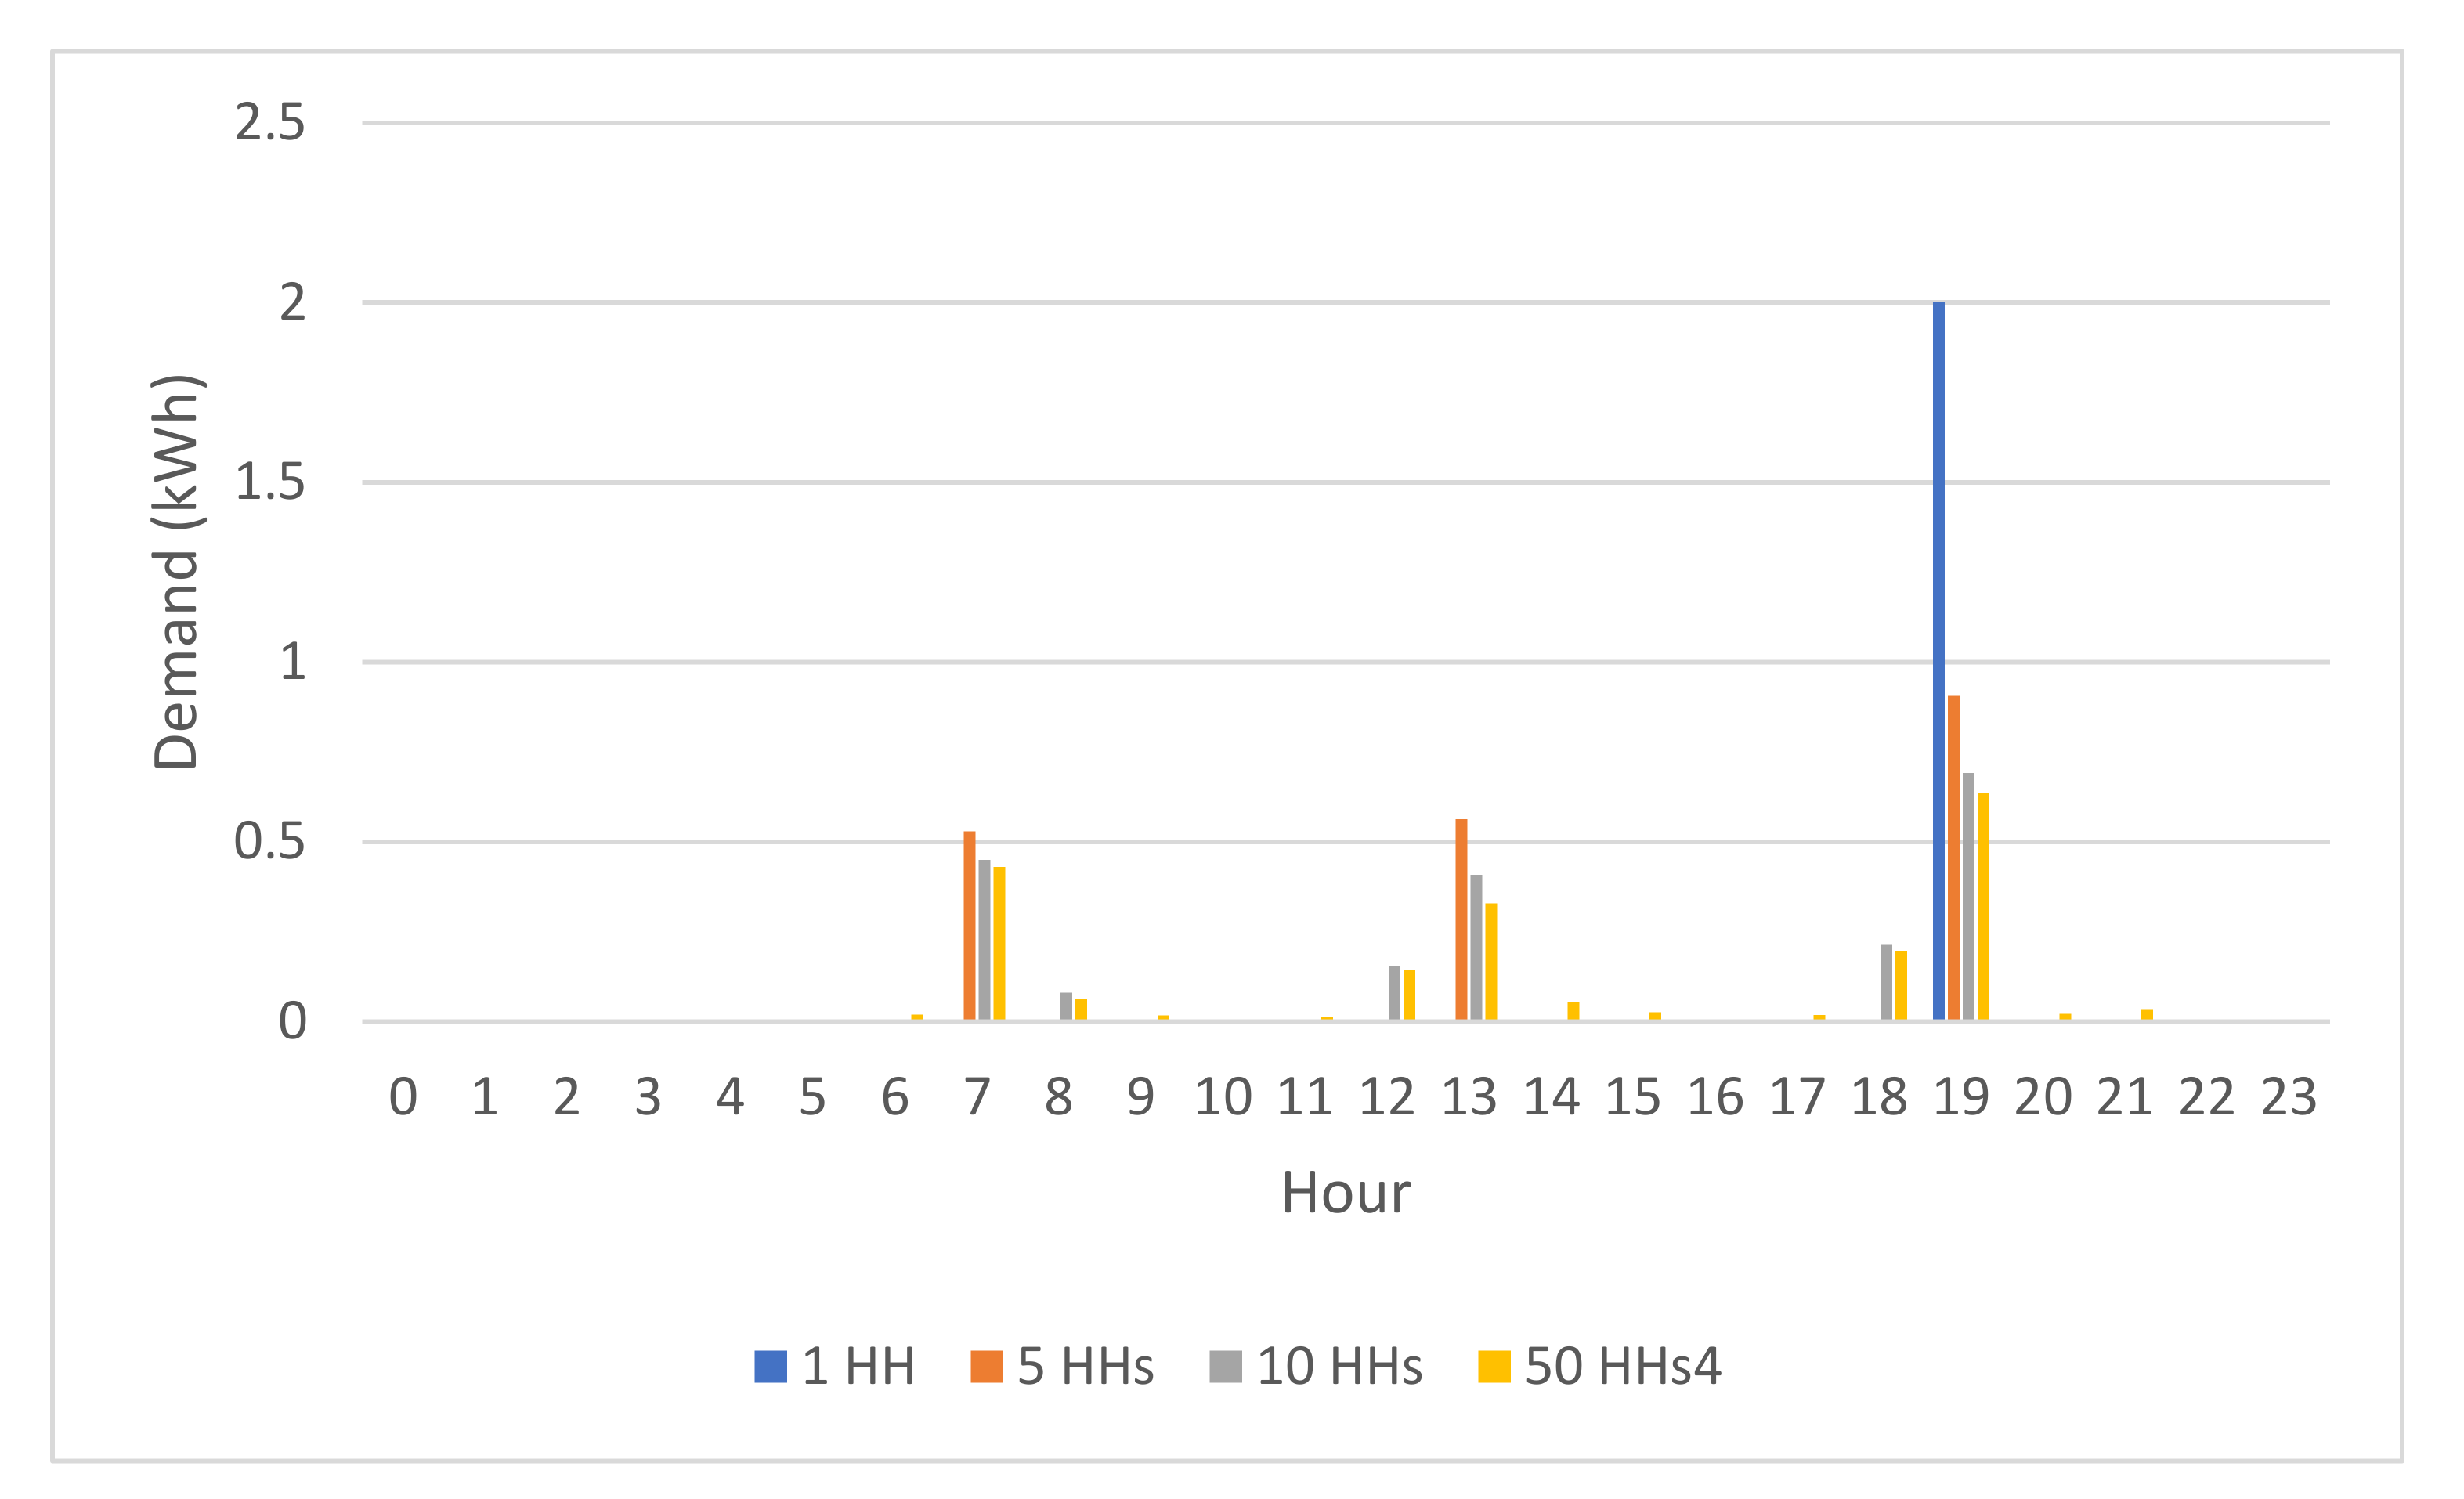
41], the definition of cooking load profiles in microgrids [42], the potential impact of incorporate cooking demands in the electrification planning of unserved areas [43,44] and the data standards for integrated energy planning of electrification and clean cooking [45]. However, to the best of our knowledge, no published methodology exists for the integration of the provision of access to modern energy cooking services into electricity planning in large-scale areas using geospatial techniques, and this study seeks to contribute to filling this gap.
This article describes a preliminary study to lay the foundations for the integration of electrical cooking and MECS in the electrical planning of unserved areas from the electricity supply side. The three main objectives are: 1) to develop a methodology; 2) to discuss reference values for the main variables used; and 3) to test the methodology and values in a real scenario in order to validate it, drawing some initial conclusions and identifying new areas of research for more detailed analysis.
We use the Reference Electrification Model (REM) to run the cases presented in this paper. REM is a mature large-scale planning tool that finds the least-cost electrification solution, usually a combination of standalone systems (SAs), microgrids (MGs), and grid extensions (GEs), for an underserved region using heuristic optimization [46]. To date, REM has been used in planning projects at the country level in sub-Saharan Africa, South Asia, and South America [47,48].
REM approaches electrification planning with a very high modeling complexity [49]. The model operates with a high spatial resolution, calculating detailed network designs for microgrids and grid extensions whose layouts go down to the end-buildings. These network designs are obtained considering frequent electric constraints and topographical features, such as terrain slopes and forbidden areas [50].
REM also works with a high temporal resolution, representing the demand of each consumer and the renewable potential (solar irradiance) with an hourly profile. The model optimizes the generation designs of microgrids and standalone systems using a heuristic method that simulates the hourly dispatch of potential generation designs [51].
This model is being continuously improved by the integration of new functionalities or enhancement of the optimality of its algorithm, but this paper focuses on applying the tool to several cases and analyzing the corresponding results. Therefore, this paper presents an application of methods developed prior to this paper. 
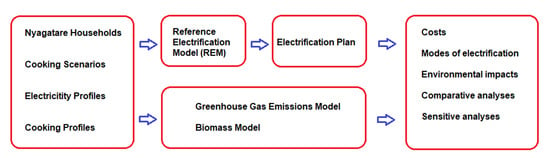
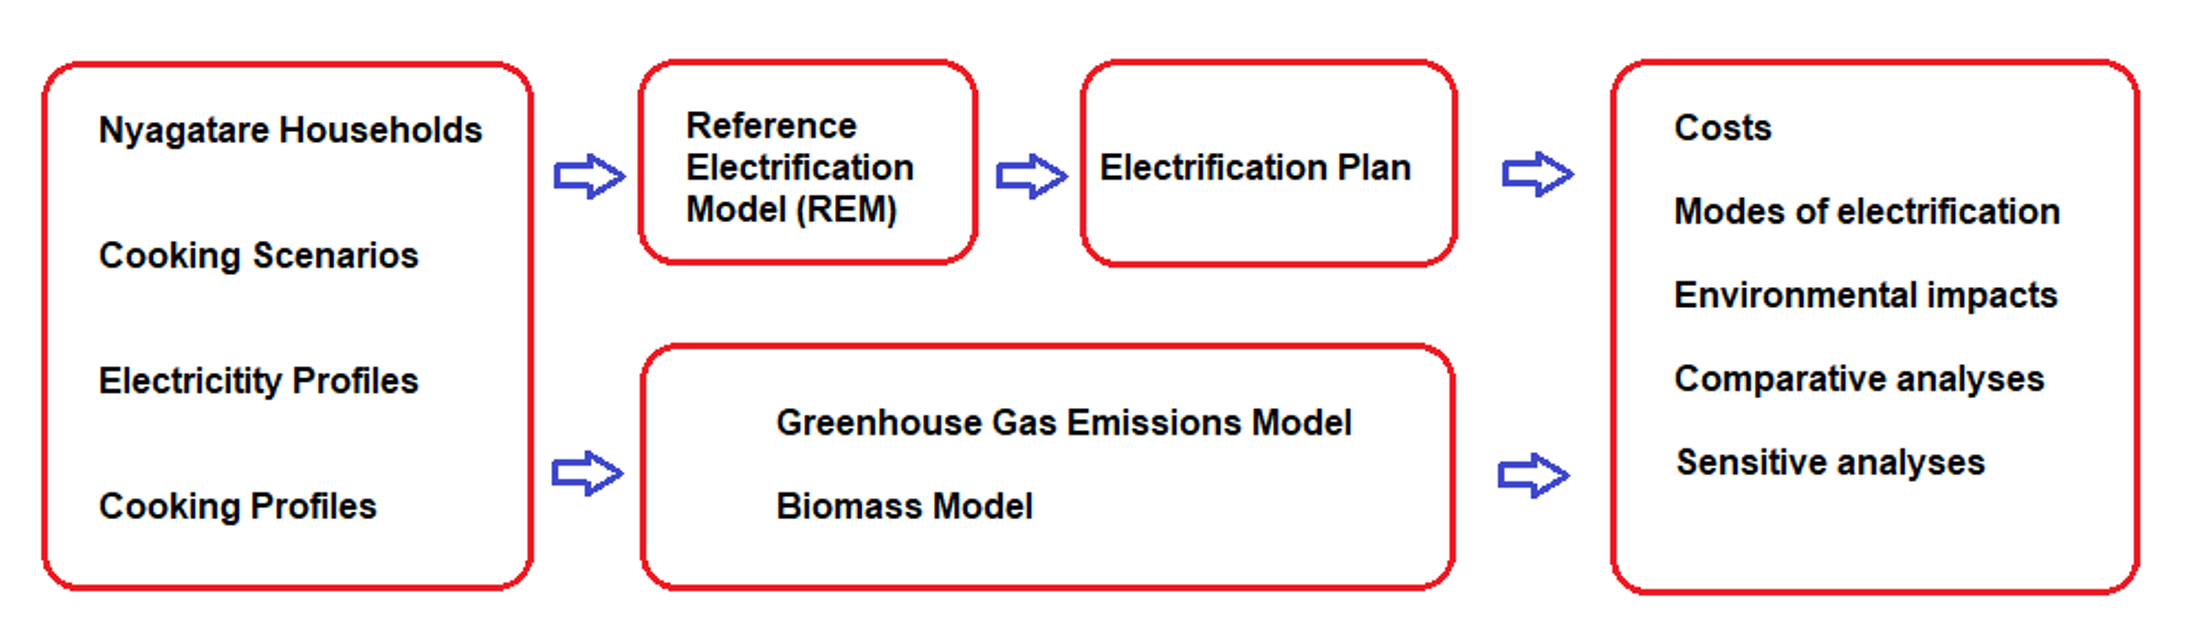
Appendix A provides an overview of the inputs and outputs of REM, in addition to the sequential process that REM follows to obtain the electrification solution of a case.
In this paper, three scenarios of the same region are studied with REM. The first, denominated the Basic Scenario, supplies the electricity to meet just the basic services in a household. In the second, the Complete Scenario supplies the basic services and electricity for cooking the entire daily cooking load. The third scenario, the Stacking Scenario, covers basic services with half the daily cooking load carried out with energy-efficient electric appliances and the other half with another cookstove. A stacking scenario, comprising the use of multiple stoves and fuels in the same household, was analyzed because it is the usual process of transition from traditional to clean cooking solutions [52]. Clean-stacking behavior, in which cleaner cooking solutions are adopted by users of traditional cookers, even for such small cooking tasks as boiling water or refrying, results in reduced use of a lower-tier alternative, facilitates learning, and increases the likelihood of its adoption over the longer term. Therefore, it should be considered as a valid strategy towards achieving MECS [9].
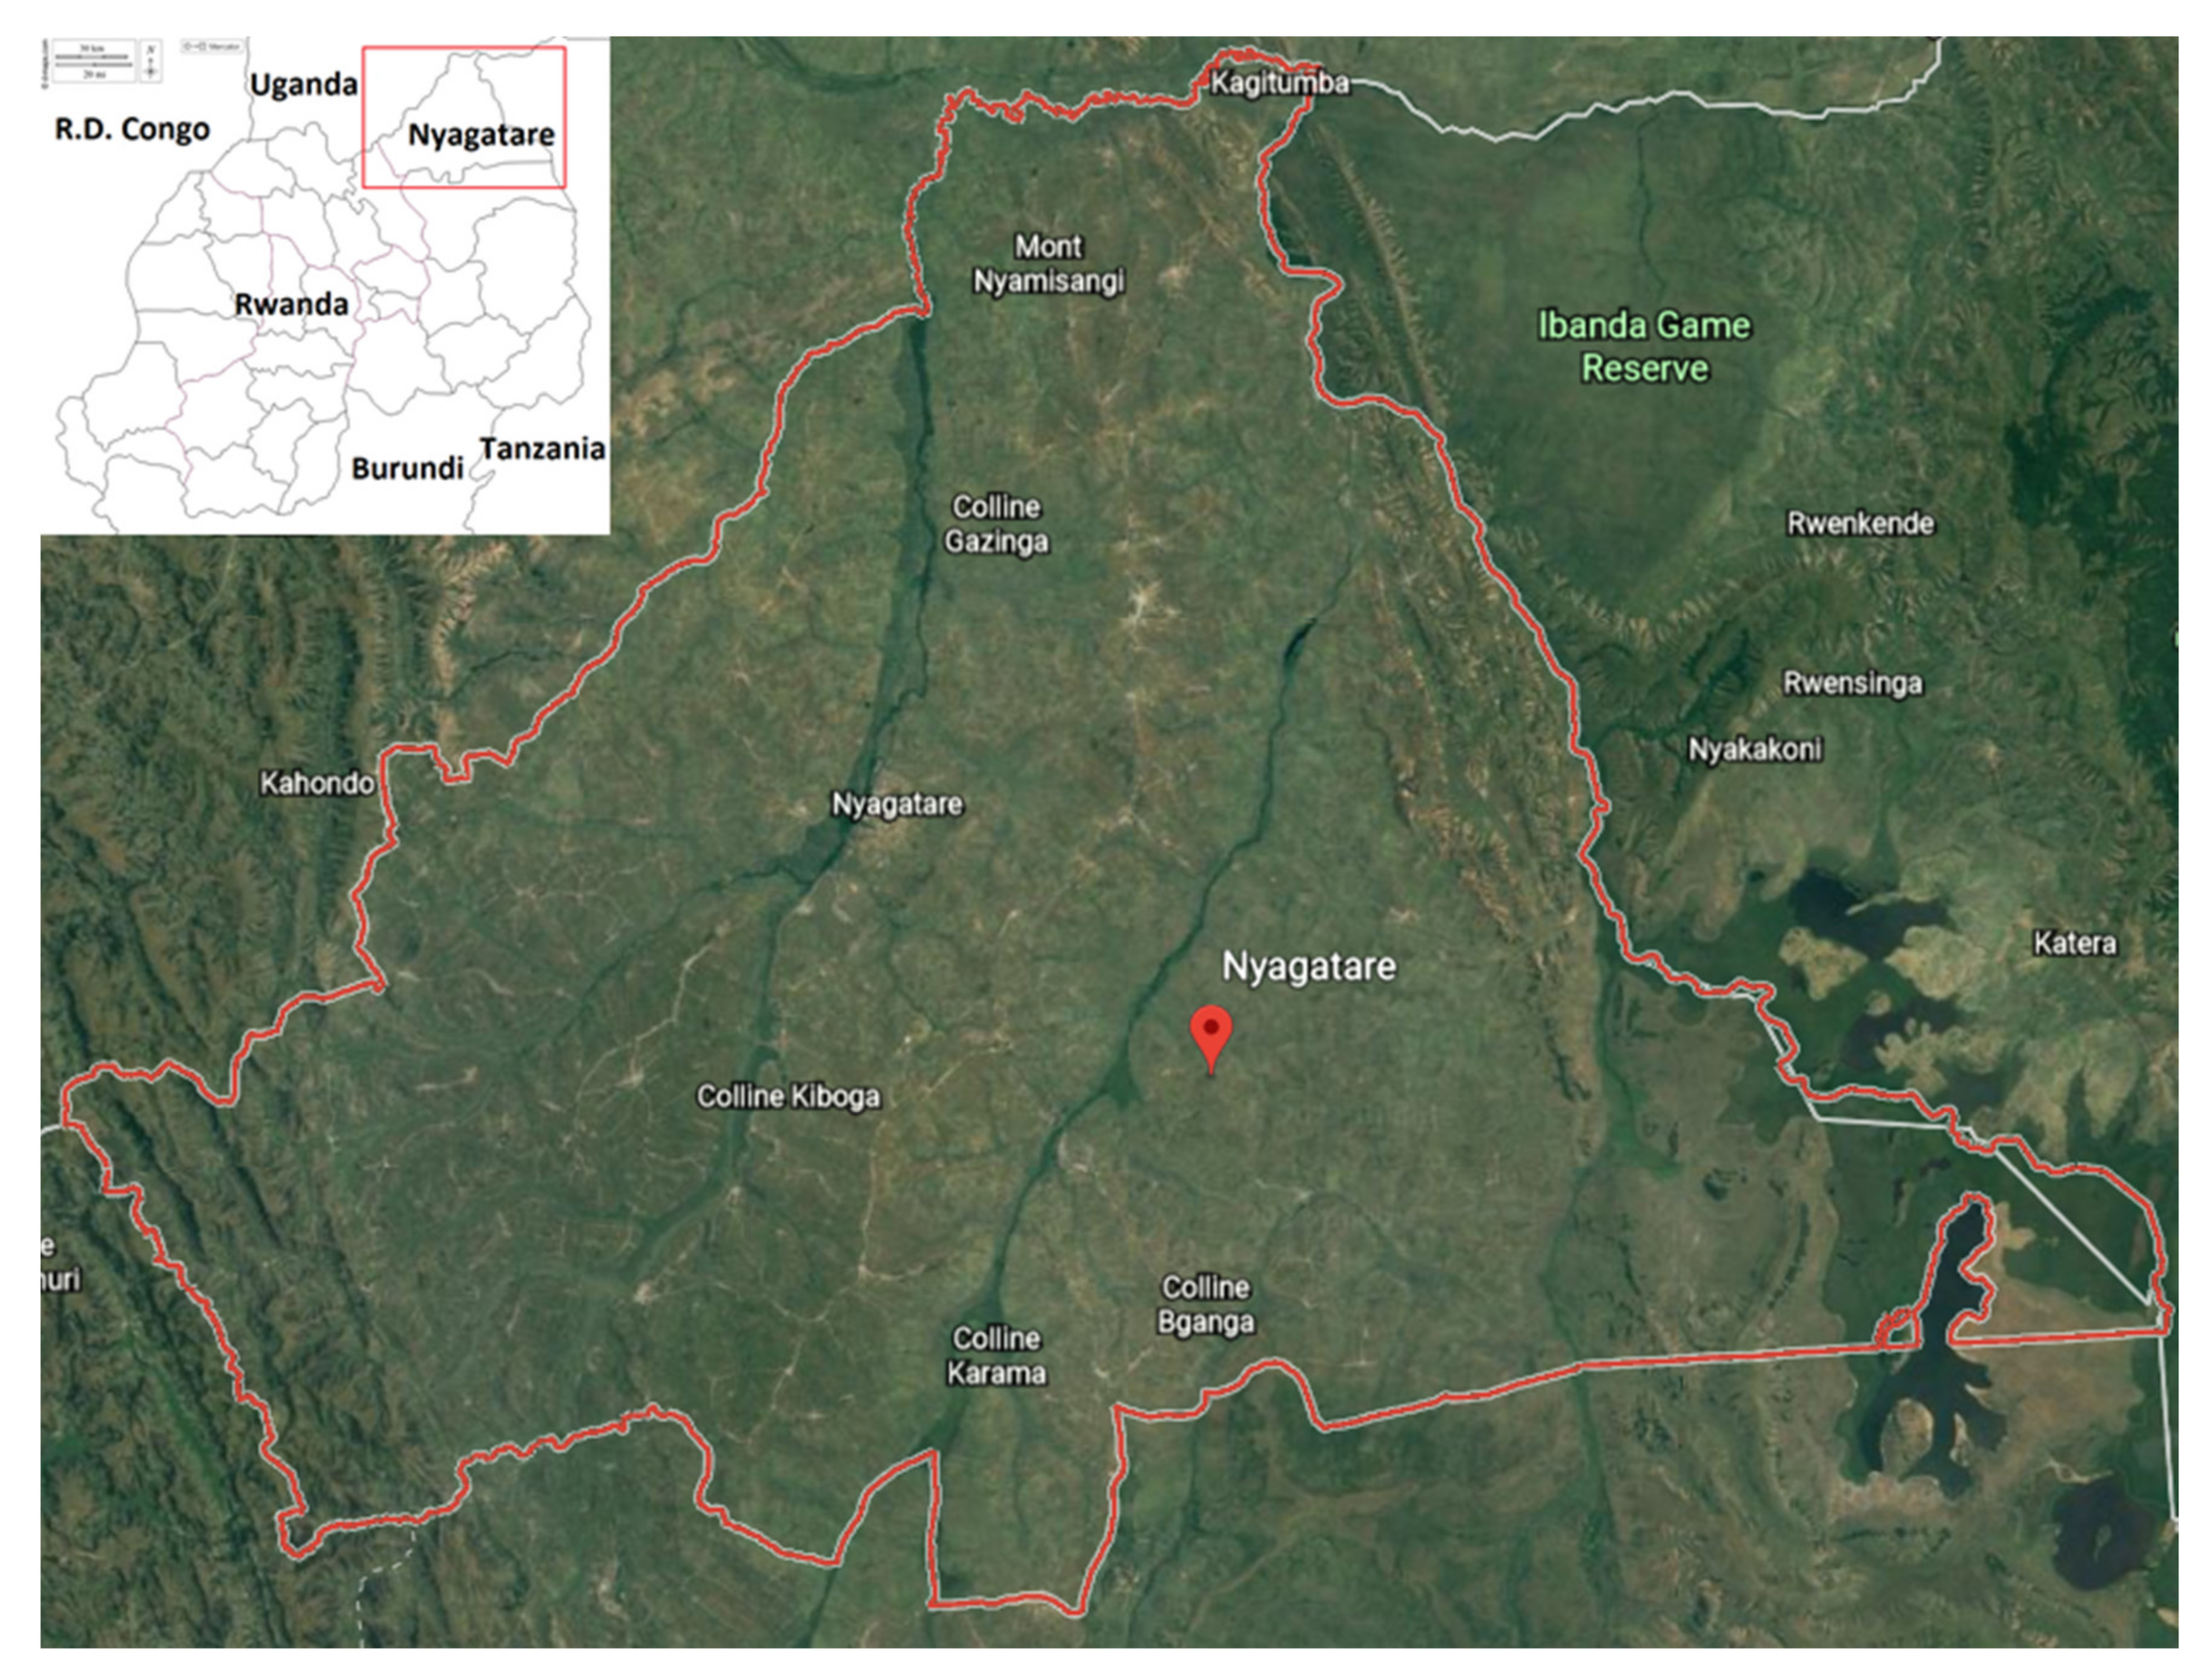
The country chosen to test the methodology is Rwanda. It is a landlocked country of East Africa with a surface area of 26,338 square kilometers and a population of 12.3 million people in 2018, of which more than 80% live in rural areas. Having a Gross National Income (GNI) per capita of USD 780, it is considered a low-income country by the World Bank [53].
The results of the analysis show that electric cooking substantially changes the least-cost distribution of the electrification modes and the kWh cost, and demonstrate that electric cooking can be cost-competitive compared to LPG and charcoal in grid-connected households. In addition, clean stacking with electricity can be a transitional means of meeting MECS. Cooking with energy-efficient electric appliances and renewable energy in grid and off-grid settings is the most effective way to meet the three targets of SDG 7—universal access, efficiency, and renewable energy—and to contribute towards complying with the Paris Agreement.
The remainder of this article is organized as follows: Section 2 presents the case study, including a description of Nyagatare District, scenarios developed, REM parametrization, household electricity demand, cooking alternatives and sensitivity analysis for grid electricity cost, renewable energy equipment cost, and the specification of the electricity package to supply basic services. Section 3 presents and discusses the results for each scenario: least-cost mix of electrification modes, the kWh supply cost, the household electricity and cooking costs, the total cost for electrification of Nyagatare District, the greenhouse gas emissions, and sensitivity analyses. Caveats and ongoing future research are also addressed within this section. Finally, Section 4 presents the main conclusions.

2. Case Study

2.1. Nyagatare District

This section presents the Nyagatare District case study. Herein, we contextualize the region and explain the operation and input parameters of REM, how the scenarios and demand profiles are built, and the logic of cost and GHG calculations. It enables discussion of different scenarios in terms of electrification modes and costs, and comparison of the electric cooking solution with its competing alternatives in respect of cost and greenhouse gas emissions.
The Nyagatare District is in the Eastern Province, occupying the north-eastern extremity of Rwanda (Figure 1). It has a surface area of 1741 km2 with an estimated population of 550,000 people in 2018 [54], resulting in a population density of 316 inhabitants per km2. Here it will be assumed that four people inhabit each household, the same as the national average in the rural areas [55].
According to the Rwanda Energy Access Diagnostic Report Based on the Multi-Tier Framework [56], less than 0.1% of the population has access to MECS. A share of 99.6% of households cook with biomass fuels, only a quarter of households cook outdoors, and only 15.2% of households that cook indoors use an extraction system. A share of 76.5% of households spend over 7 h per week acquiring and preparing cooking fuel. Household air pollution, mainly attributable to biomass cookstoves, produces 7425 deaths and 340,000 Disability-Adjusted Life Years (DALYs) annually [57]. To address this situation, the Rwandan Government has planned to reduce the reliance on firewood from 83% to 42%, and to increase the LPG penetration to 40% in urban areas by 2024 [58].
Taking into account the attributes of MTF for electricity [59], but excluding affordability, 73.2% of the nation is considered without access, 2.8% with Tier 1 access, 2.1% with Tier 2, 10.3% with Tier 3, 7.8% with Tier 4, and 3.7% with Tier 5, with lower levels in rural areas. The Government has set a target to achieve 100% electrification, of at least Tier 1, by 2024, and a National Electrification Plan (NEP) has been developed with REM [60].

2.2. Scenarios

The International Energy Agency considers that a household has access to electricity if it is able “to power a basic bundle of energy services—at a minimum, several lightbulbs, phone charging, a radio and potentially a fan or television—with the level of service capable of growing over time”, which means “electricity to power four lightbulbs operating at five hours per day, one refrigerator, a fan operating 6 h per day, a mobile phone charger and a television operating 4 h per day, which equates to an annual electricity consumption of 1250 kWh per household with standard appliances, and 420 kWh with efficient appliances” [61].
To compare the different alternatives for achieving electricity and MECS access, three future scenarios were studied:
  • Basic Scenario—electricity supplies the basic services in every household in Nyagatare District.
  • Complete Scenario—in addition to covering basic services, the entire daily cooking load is carried out with electricity in every household in Nyagatare District.
  • Stacking Scenario—in addition to covering basic services, half the daily cooking load is carried out using energy efficient electric appliances and the other half with other cookstoves in every household in Nyagatare District.
For the design of the scenarios, the starting point is the situation in 2018 and the target date is the date established to meet SDG 7, 2030.

2.3. Electrification Planning

To simulate scenarios with REM, it is necessary to identify the position of every consumer and to define user profiles.
The buildings across Nyagatare District were identified using satellite imagery from the Google Maps API and a convolutional neural network for semantic segmentation with human-based manual corrections [62]. A total of 74,315 buildings were identified and georeferenced: 74,248 households, 22 cell offices, four markets, four primary schools, 29 pre-primary schools, five secondary schools, and three telecom towers. In Nyagatare District, approximately 99% of buildings to be supplied with electricity are household dwellings.
The parameters used for the scenarios are similar to those used in the 2018 NEP design [60]:
  • Cost of energy from the central grid: 0.9 USD/kWh
  • Reliability of the central grid: 100%
  • Catalogue of components and network standards: equal for grid extension and grid-compatible microgrids: National
  • Catalogue of components for off-grid generation: International
  • Discount rate: 8%
  • Smallest microgrid must have at least 10 customers or 5 kW
  • Administrative charges per grid-connected customer: 9 USD/year
  • Administrative charges per microgrid customers: Medium size microgrid (100 customers): 16 USD/year. Large size microgrid: Asymptote at 9 USD/year
  • Administrative charges per isolated customers: 60 USD/year
  • Average cost of diesel: 1.2 USD/L
  • Average cost of labor: 1.6 USD/hour
The administrative charge per isolated system is based on a “service provision” business model in remote areas where the provider guarantees a high quality of service at all times—365 days a year, 24 h a day. In other business models, such as the sale of photovoltaic kits on the open market, the charge may be lower but this is at the expense of quality of service. Capital cost over the economic lifetime of the asset and operational cost are calculated for each technology assuming full recovery of the investment. The expenses incurred on a non-annual basis are converted to an annuity with a discount rate.
The electricity demand of each consumer depends on several factors such as socioeconomic data and climate information, among many others. REM assigns a one-hour-resolution yearly demand profile to each consumer and distinguishes between two types of demand: critical demand, which accounts for essential consumption, and non-critical demand, which accounts for non-essential consumption. REM usually assigns substantial penalties for the critical demand left unsupplied, while non-critical demand is penalized to a lesser extent if it is not met.

2.4. Household Electricity Demand

In this study, 1 kWh/day per household is used as “the basic service package” in all scenarios. This amount coincides with Tier 3 of the MTF scale and meets the current demand of a large part of recently electrified rural households in Kenya [63], where the rural area could be compared to the one in Nyagatare District.
The hourly profile of consumption expected from the average customer, household, and non-household users, is taken from NEP and was determined from average feeder data provided by the Energy Development Corporation Limited (EDCL) and the field study for the village of Karambi (Figure 2). The electrical profile for basic services in households is eleven-fold higher than the basic profile and is the same for every household.
There are no data available for Rwanda regarding the median daily per capita consumption of electricity for cooking, when using only electricity for cooking with a mix of efficient and inefficient appliances. For this reason, the data for Kenya (0.49 kWh) and Tanzania (0.49 kWh) were taken as the best available approximation due to their geographical and cultural proximity. Considering four people per household (HH) and rounding up to have a worst-case margin, 2 kWh/day/HH is assumed as the demand for cooking all the meals with electricity in the Complete Scenario.
In accordance with ESMAP [41], in a fuel stacking scenario in which half the daily cooking load is carried out using a mix of electric energy-efficient appliances, daily electricity consumption is projected to be just 0.30 to 0.67 kWh per household, and rounding up to have a worst-case margin, 0.7 kWh/day/HH, is assumed for the Stacking Scenario.
As there are no demand profiles for electric cooking available for Rwanda, a combination of the normalized 24 h load profile from households in Kenya and Tanzania [41] adapted to an hourly distribution was used. To consider the worst scenarios, when the load is only for one household, the entire demand is concentrated in 1 h (at 19), for five households it is distributed over 3 h (at 7, 13 and 19), for 10 households over 6 h (at 7–8, 12–13 and 18–19), and finally for 50 customers over 15 h (from 6 to 9 and from 11 to 21) This makes the profile as close as possible to the combination of the Kenya and Tanzania profiles adapted to the hourly format (Figure 3). This provision was made to consider the most disadvantageous situations for batteries and inverters in off-grid systems when a large part of the daily demand must be supplied in a short period of time.

2.5. Cooking Alternatives

Cooking with electricity is compared to the three most common alternatives, namely cooking with firewood, charcoal, and LPG. The price of an intermediate improved cookstove ranges from USD15 to USD30, whereas an energy-efficient electric appliance is normally more expensive, with basic EPCs typically retailing between USD50 and USD100 [41]. One robust LPG stove costs USD30 to USD60 [17]. Two stoves or electric appliances per household are considered because it is common for more than one cooking task to be undertaken at a time. In the stacking scenarios, one stove or electric appliance is considered for each technology. The consumption for each cooking mode is based on Kenyan and Tanzanian diaries [41]. In the Stacking Scenario, consumption is half for LPG, charcoal, and firewood, but less than half in terms of electricity because the use of a mix of energy-efficient appliances is assumed. LPG and electric appliances are estimated to have a lifetime of 5 years, compared to 2 years for charcoal and firewood stoves given the rapid deterioration of materials due to prolonged exposure to very high temperatures. Maintenance costs are included in the initial capital cost. Table 1 summarizes the main values.
Firewood and charcoal prices depend on their availability and legal regulation. When LPG and cylinders are imported, commodity pricing fluctuations, local currency inflation, and shortages in foreign currency exchange can influence fuel supply [64]. To avoid price uncertainty in the 2030 horizon, instead of calculating the cost of cooking for each fuel in each scenario, cooking cost with electricity is calculated and then the “breakeven price” of each fuel that matches this cost is also computed. For example, if the breakeven price of LPG is USD1.00, it means that when the cost of LPG is lower than USD1.00, it is more economical to cook with this fuel, but when it is greater than USD1.00, it is economically more advantageous to cook with electricity.

2.6. Greenhouse Gases Emissions

The climate change impact for each fuel is estimated through GHG emissions, using the Global Warming Potential over 100 years (GWP-100) to estimate the CO2 equivalent (CO2eq). The Fraction of Non-Renewable Biomass factor (fNRB) is used in accordance with Equation (1) and data used are shown in Table 2.
CO2eq = FC * [(EFCO2 * fNRB) + (EFCO * GWPCO) + (EFCH4 * GWPCH4) + (EFBC * GWPBC)]
where CO2 = carbon dioxide; CO = carbon monoxide; CH4 = methane; BC = black carbon; FC = fuel consumption; EF = emission factor; fNRB = Fraction of Non-Renewable Biomass; GWP = Global Warming Potential over 100 years.
The emissions are only calculated in the cooking process. For charcoal production, the impact on GHG emissions and biomass consumption is calculated due to concerns about its high impact [66]. It is assumed for 1 kg of charcoal produced, 5 kg of wood is consumed [67].
Due to the commissioning of new peat and methane plants in Rwanda, the share of renewables will fall from 62% in 2016 to 38% in 2021. With the phasing in of new hydropower plants, the share is expected to reach 44% in 2025. New plants will not only meet the demand but there will also be significant over-capacity. The share of renewable energy by 2030 is estimated to be between 44% and 60% [68]. In this study, 410 CO2eq grams per kWh emission factor is assumed by 2030 [69]. Microgrids and isolated systems are considered emission-free because they are supplied with PV systems.

2.7. Sensitivity Analysis

Several uncertainties affect the results. The cost of electricity supplied from the grid and the cost of the equipment for PV systems influence the fraction of customers with each electrification mode, the kWh cost in each mode, and the total cost of electrification. In the 2018 NEP design, 0.12 USD/kWh was used for electricity supplied to the grid, but it is expected that the new projected generating capacity will reduce the cost by 2030. In sensitivity analysis 1, 0.09 USD/kWh is used as the central hypothesis, and then the impacts of a higher—0.12 USD/kWh—and lower—0.06 USD/kWh—cost are analyzed. In sensitivity analysis 2, the PV equipment cost taken from an international catalog is used [60,70] and then the impacts of reductions of 10% and 20% are analyzed.
In the 2018 National Electrification Plan of Rwanda, the projected demand for basic services was lower than 1 kWh/day. Two types of residential customers were identified: 50,777 customers with a very low demand of 50 Wh/day, Tier 1 of the MTF scale, and 23,471 customers with a low demand of 450 Wh/day, Tier 2. Regardless of whether the demand was 50 Wh/day or 450 Wh/day, all households that, according to REM were to be electrified with isolated systems, would be supplied with the same small USD 35 DC Solar Kit, which would be upgraded as needed in the future [60]. In sensitivity analysis 3, the changes involved in using the National Electrification Plan basic package instead of 1 kWh/day demand is analyzed.

3. Results and Discussion

3.1. Fraction of Households by Electrification Mode and Total Cost per kWh

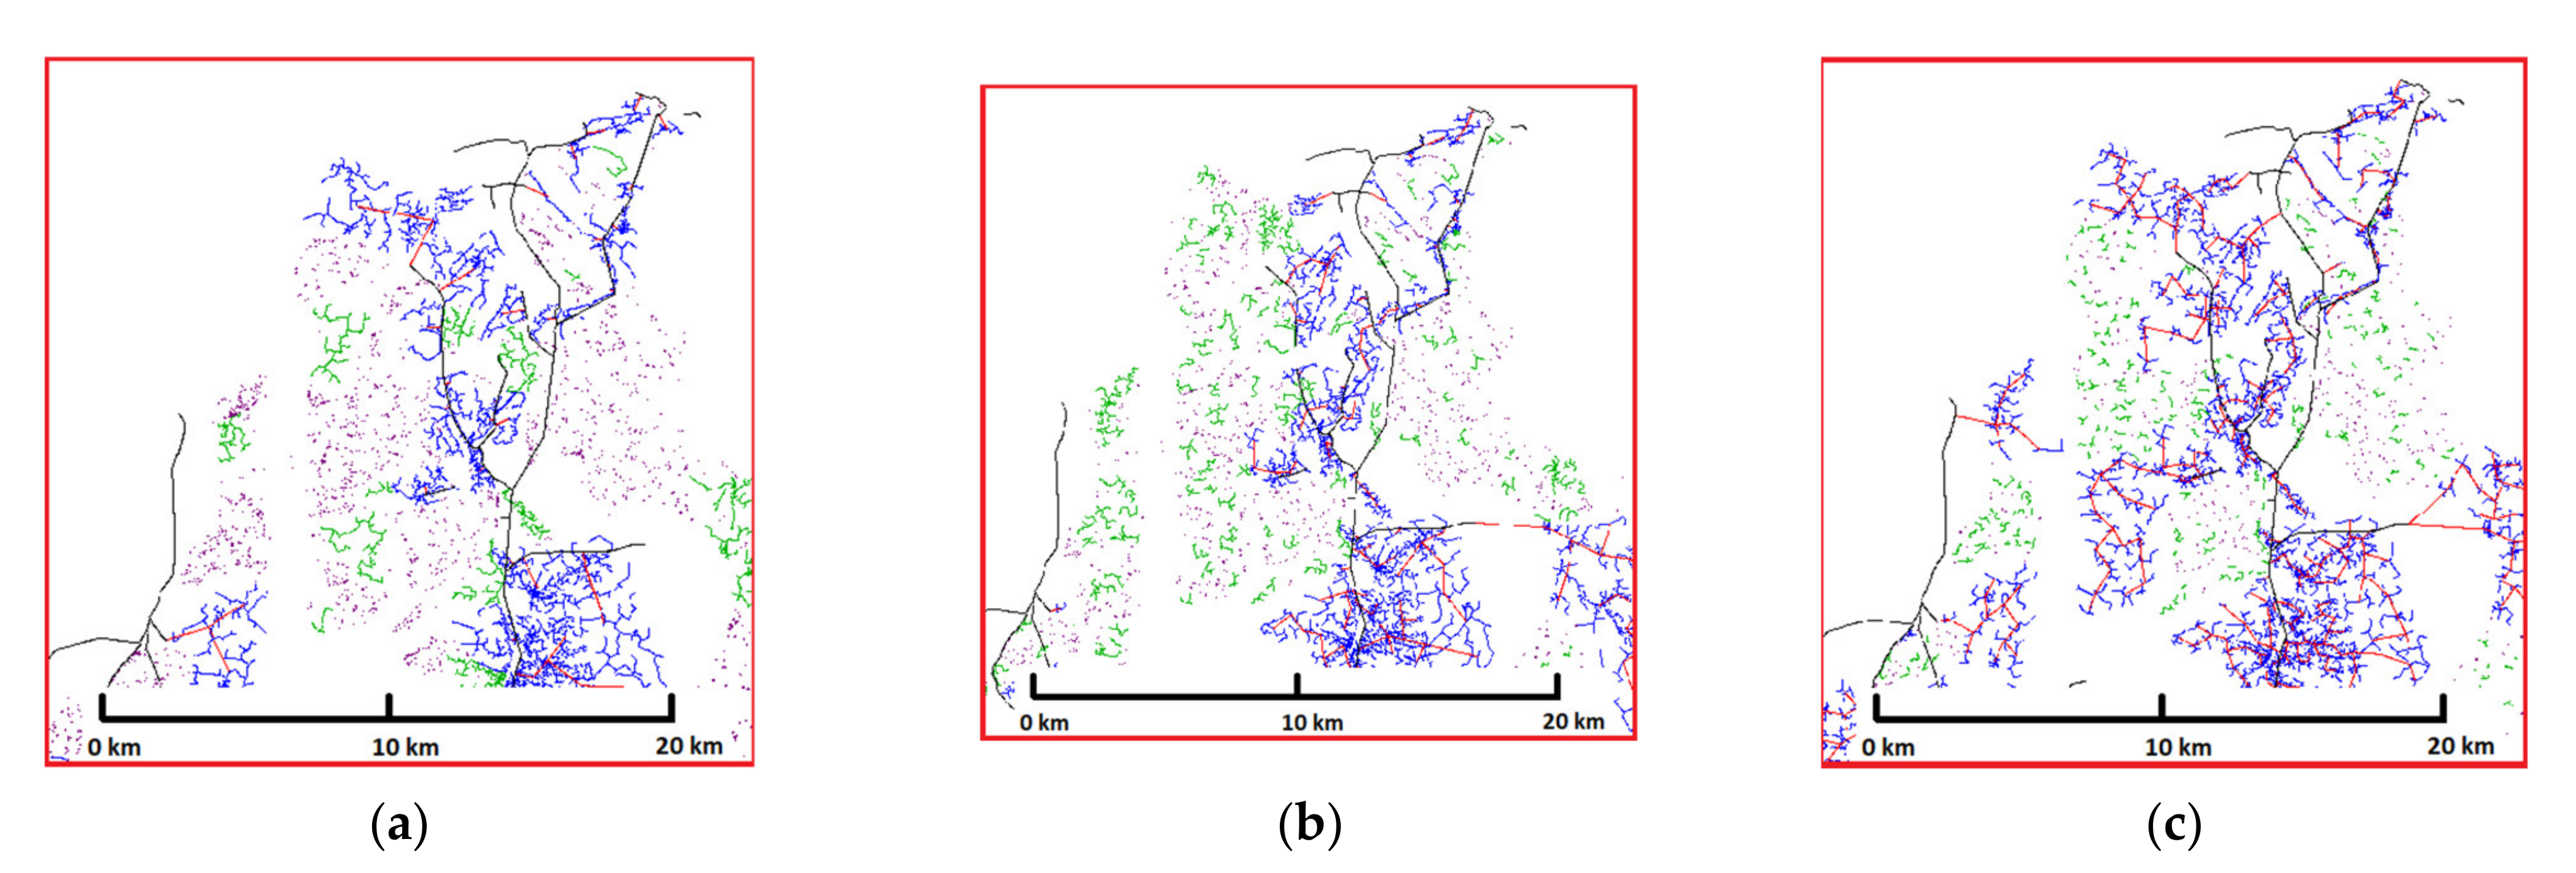
Each scenario has a different distribution of the three electrification modes and a different unit cost for the electricity supplied.
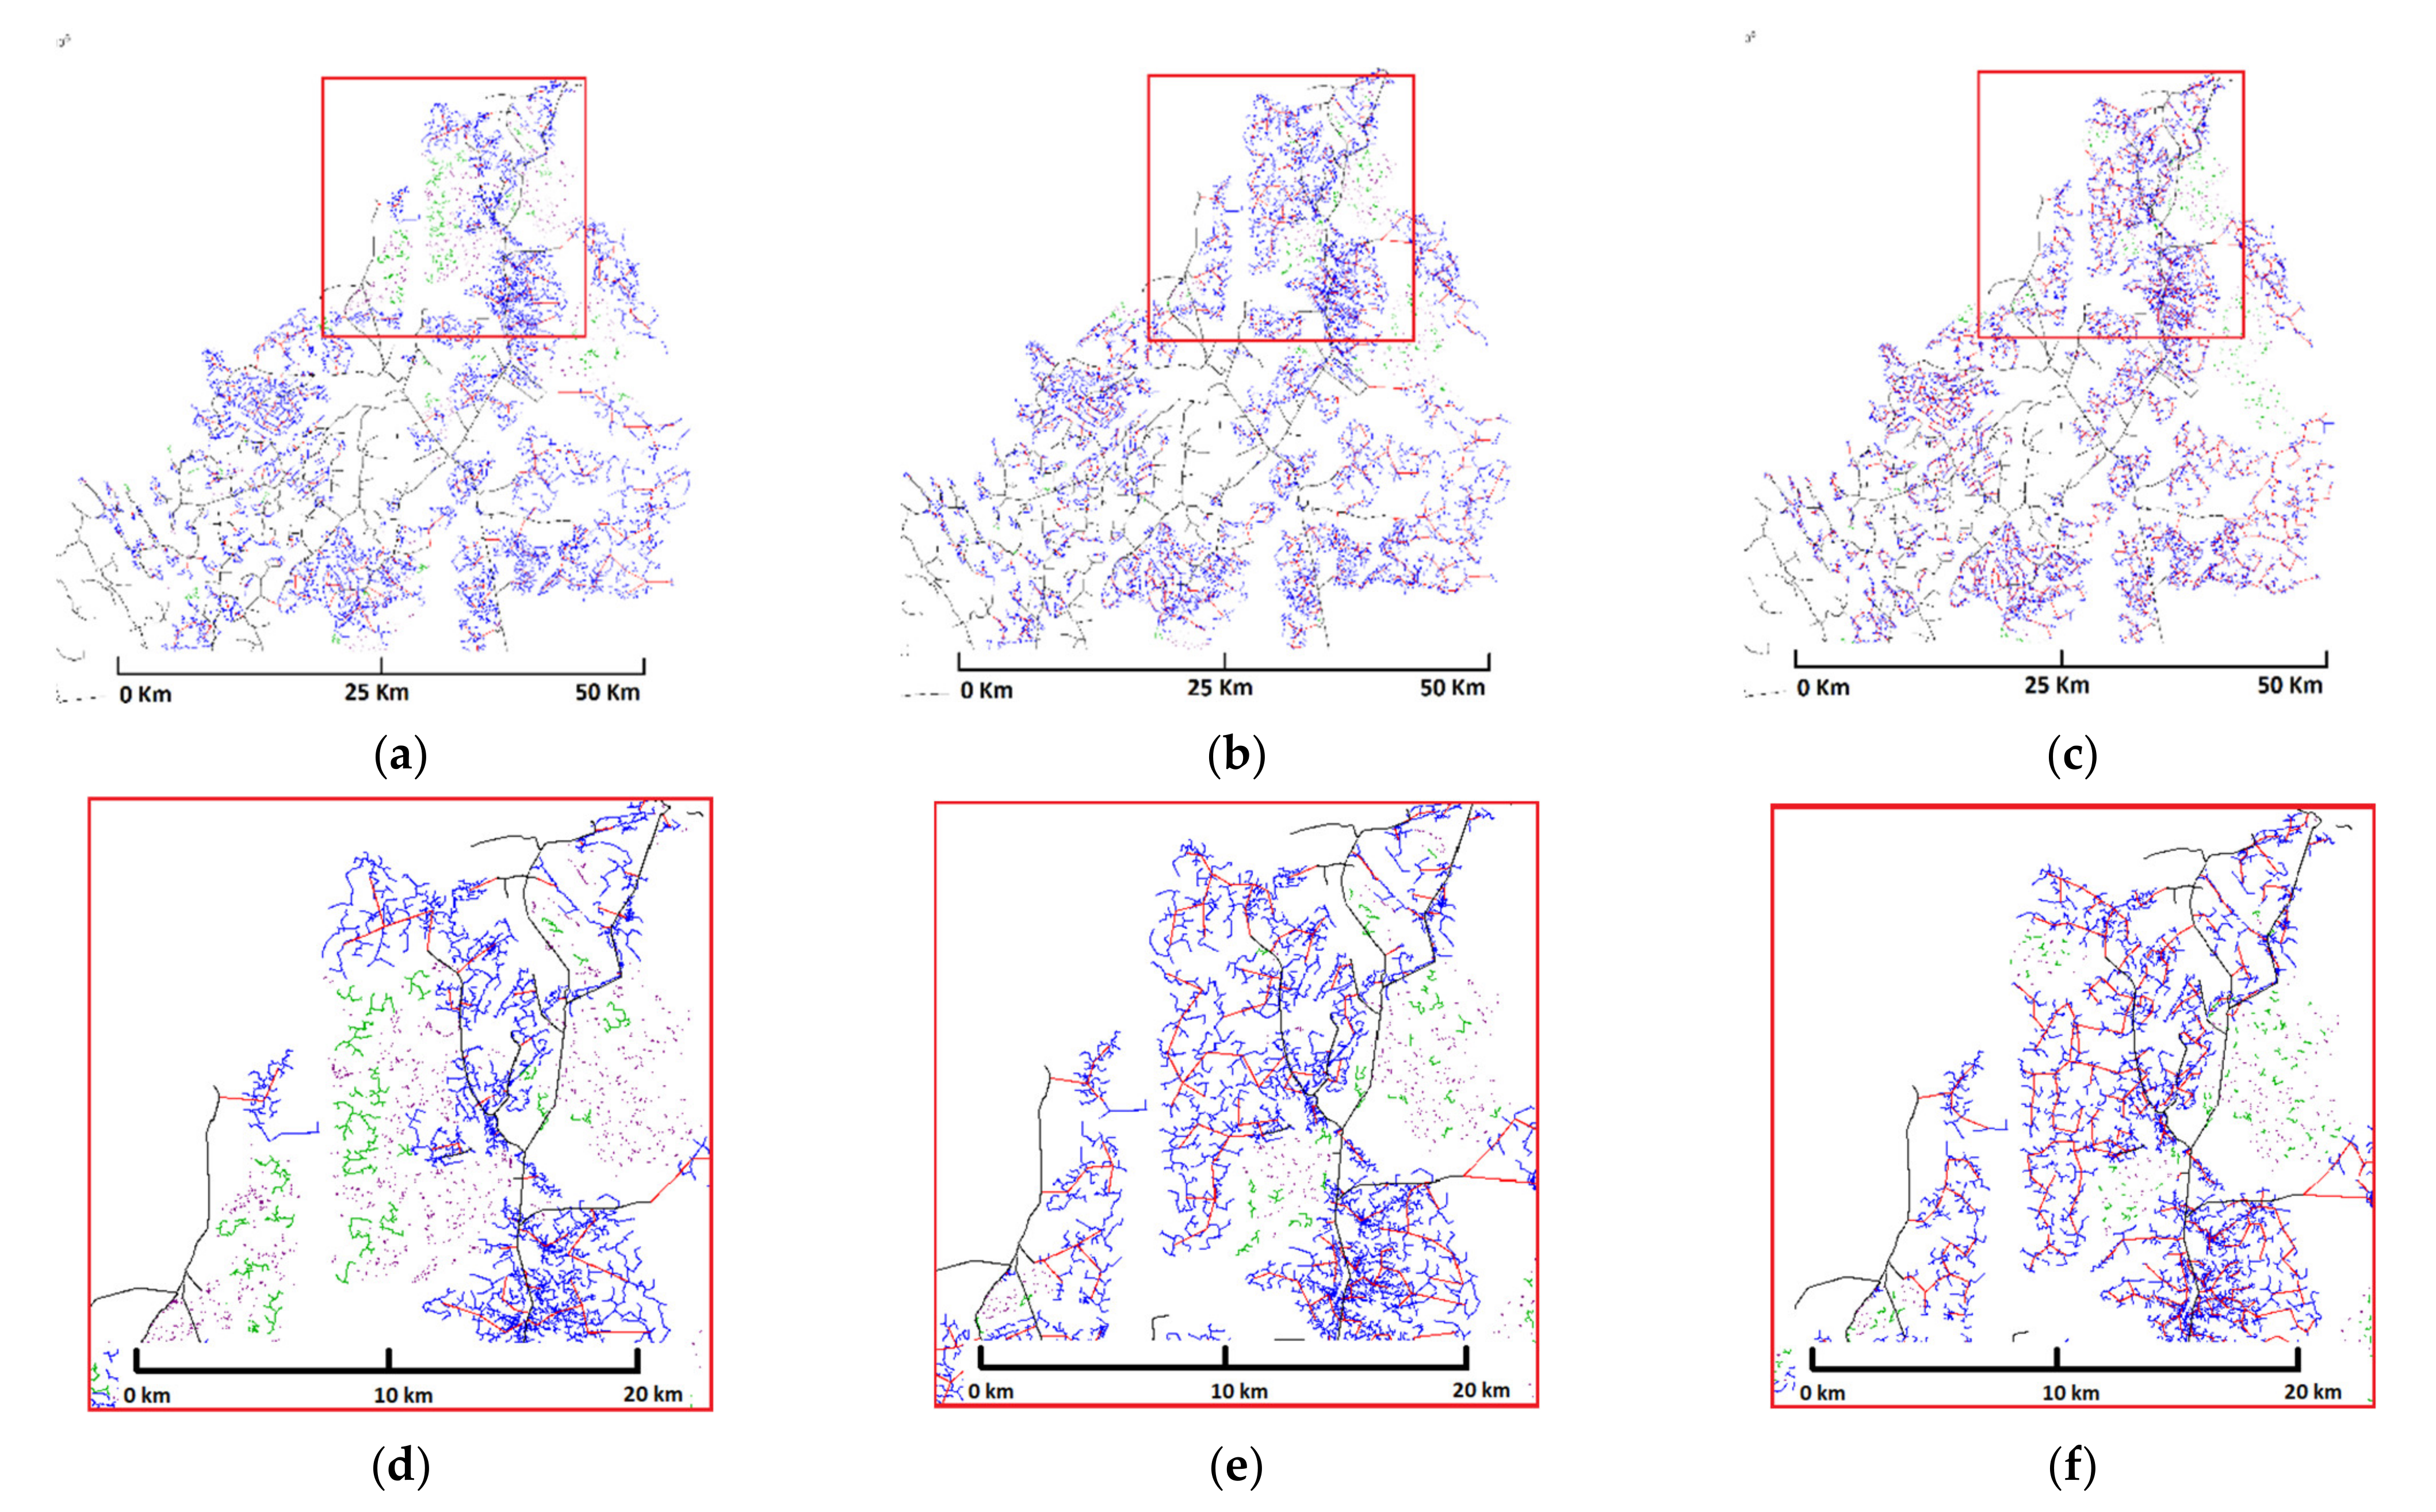
The most frequent electrification mode in all three scenarios is grid extension, with more than 92% of consumers electrified. In the Complete Scenario and the Stacking Scenario, the fraction of connected households increases to more than 96%. In the Basic Scenario, the second most frequent option is isolated systems, whereas in the Stacking Scenario and the Complete Scenario it is microgrids (Figure 4 and Table 3).
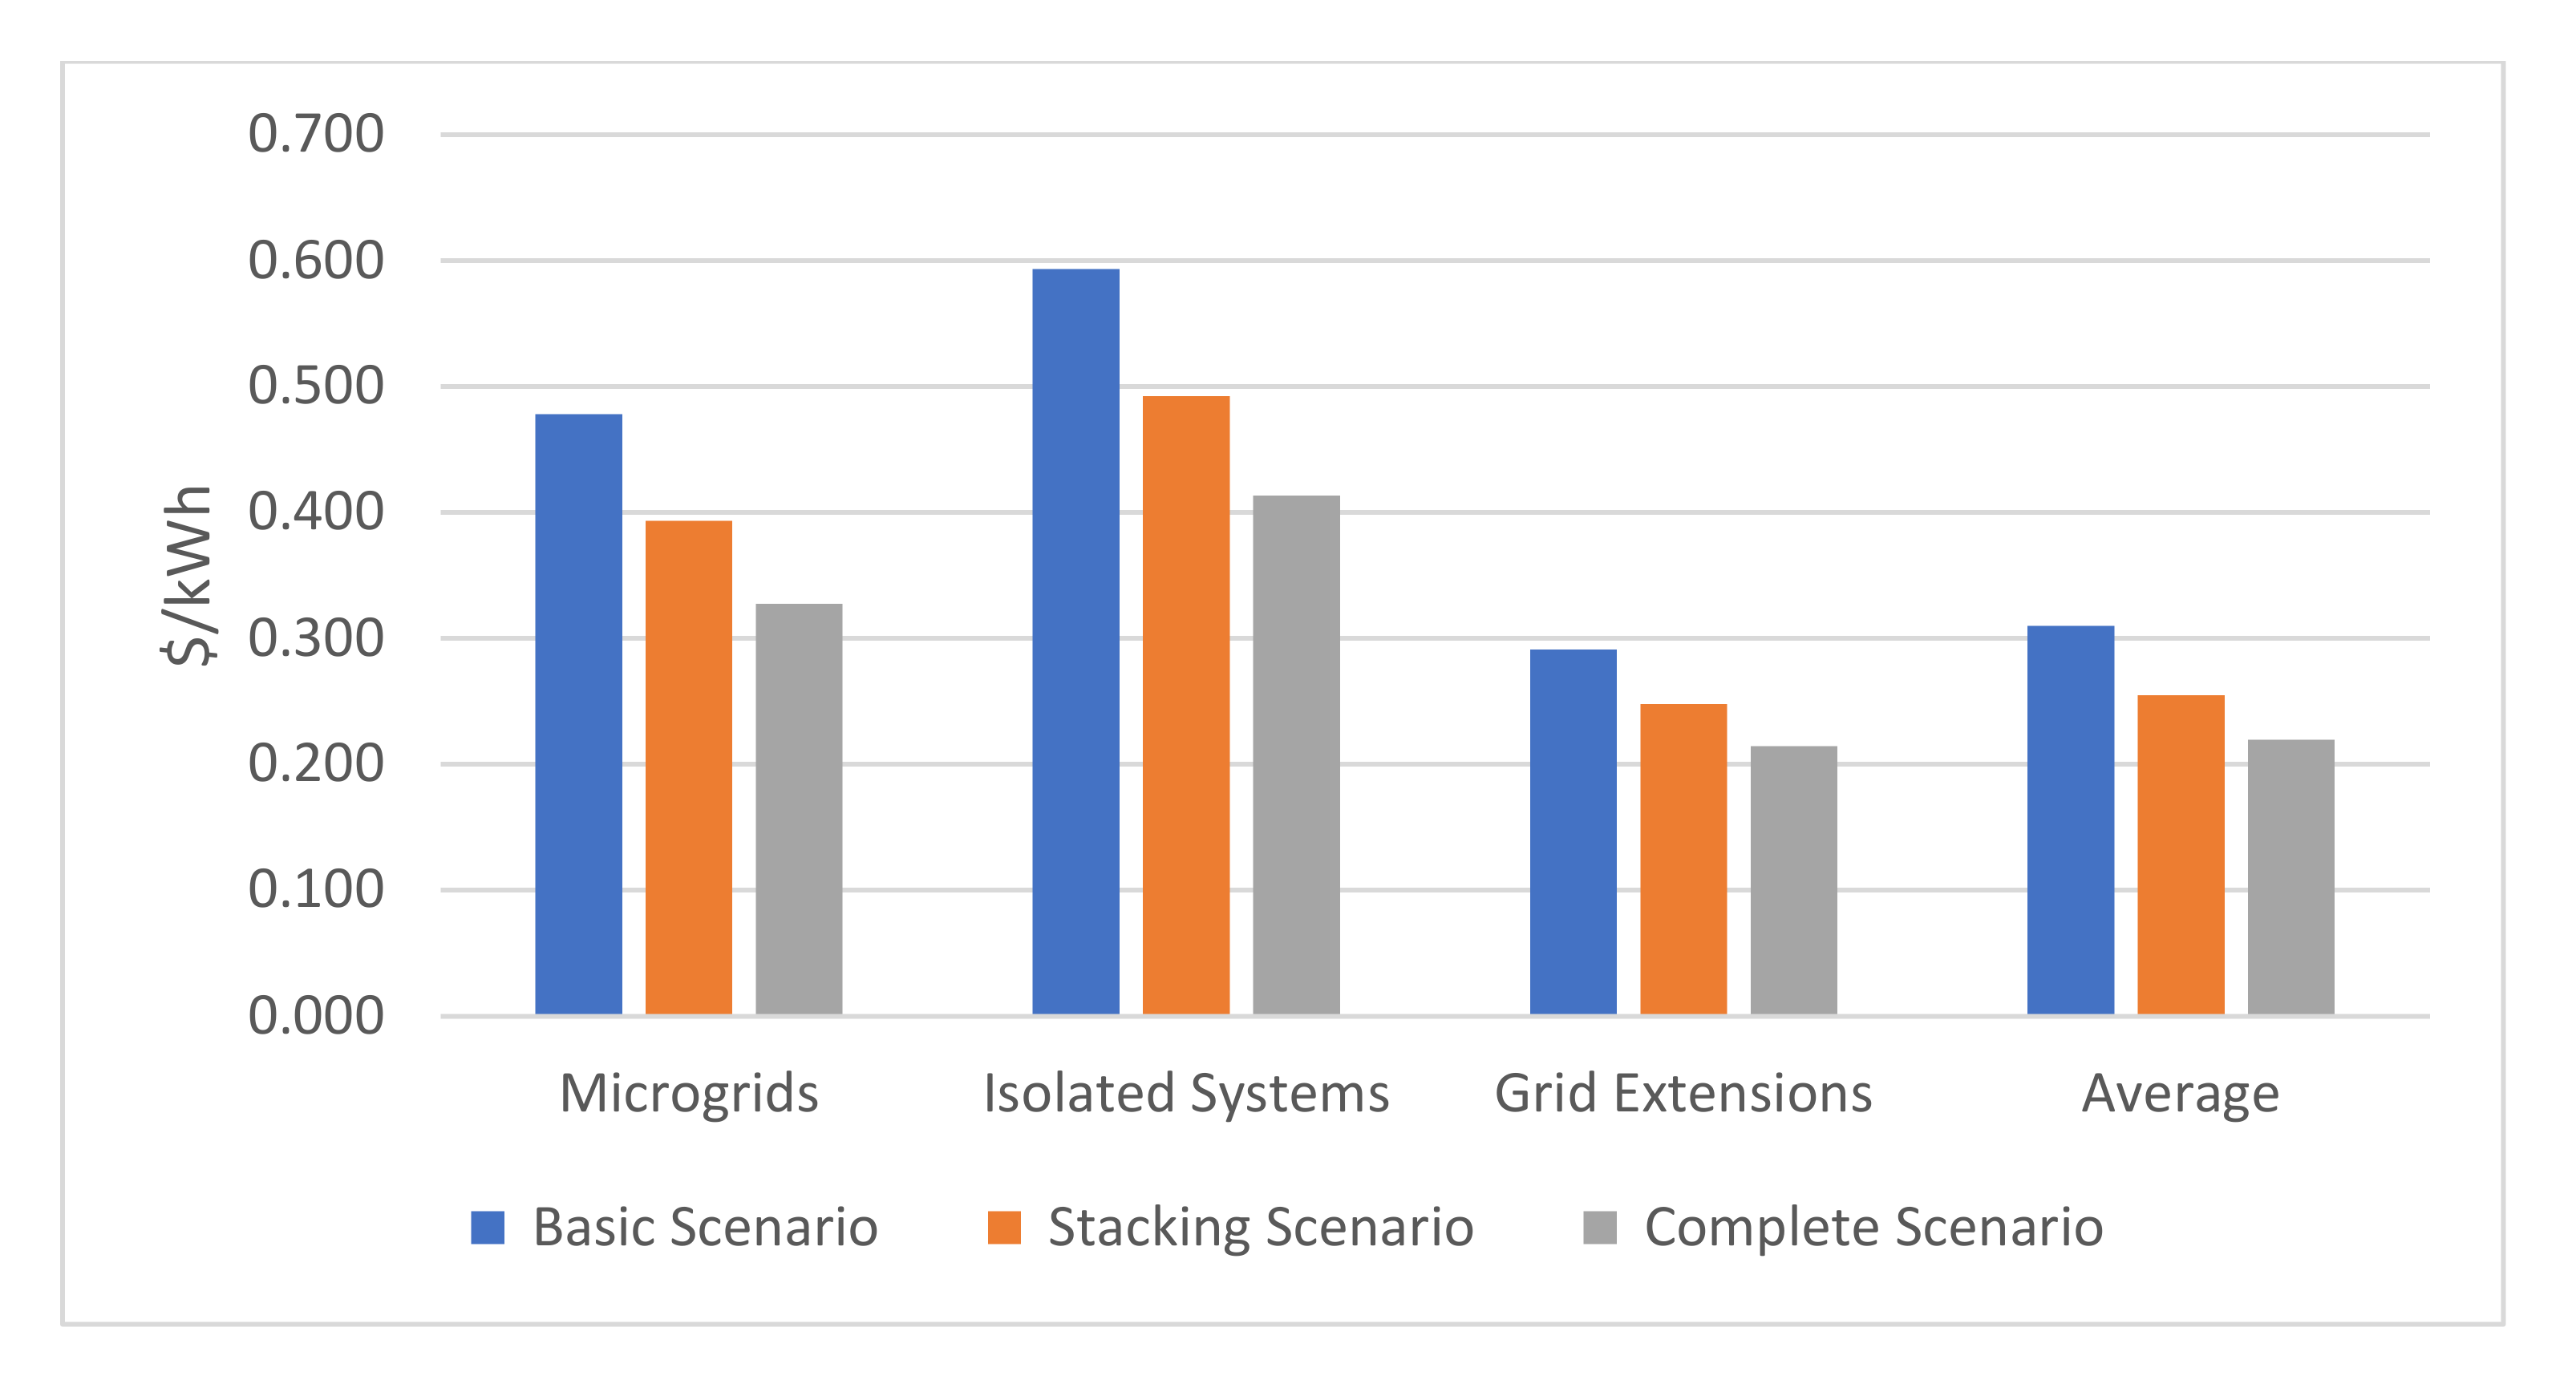
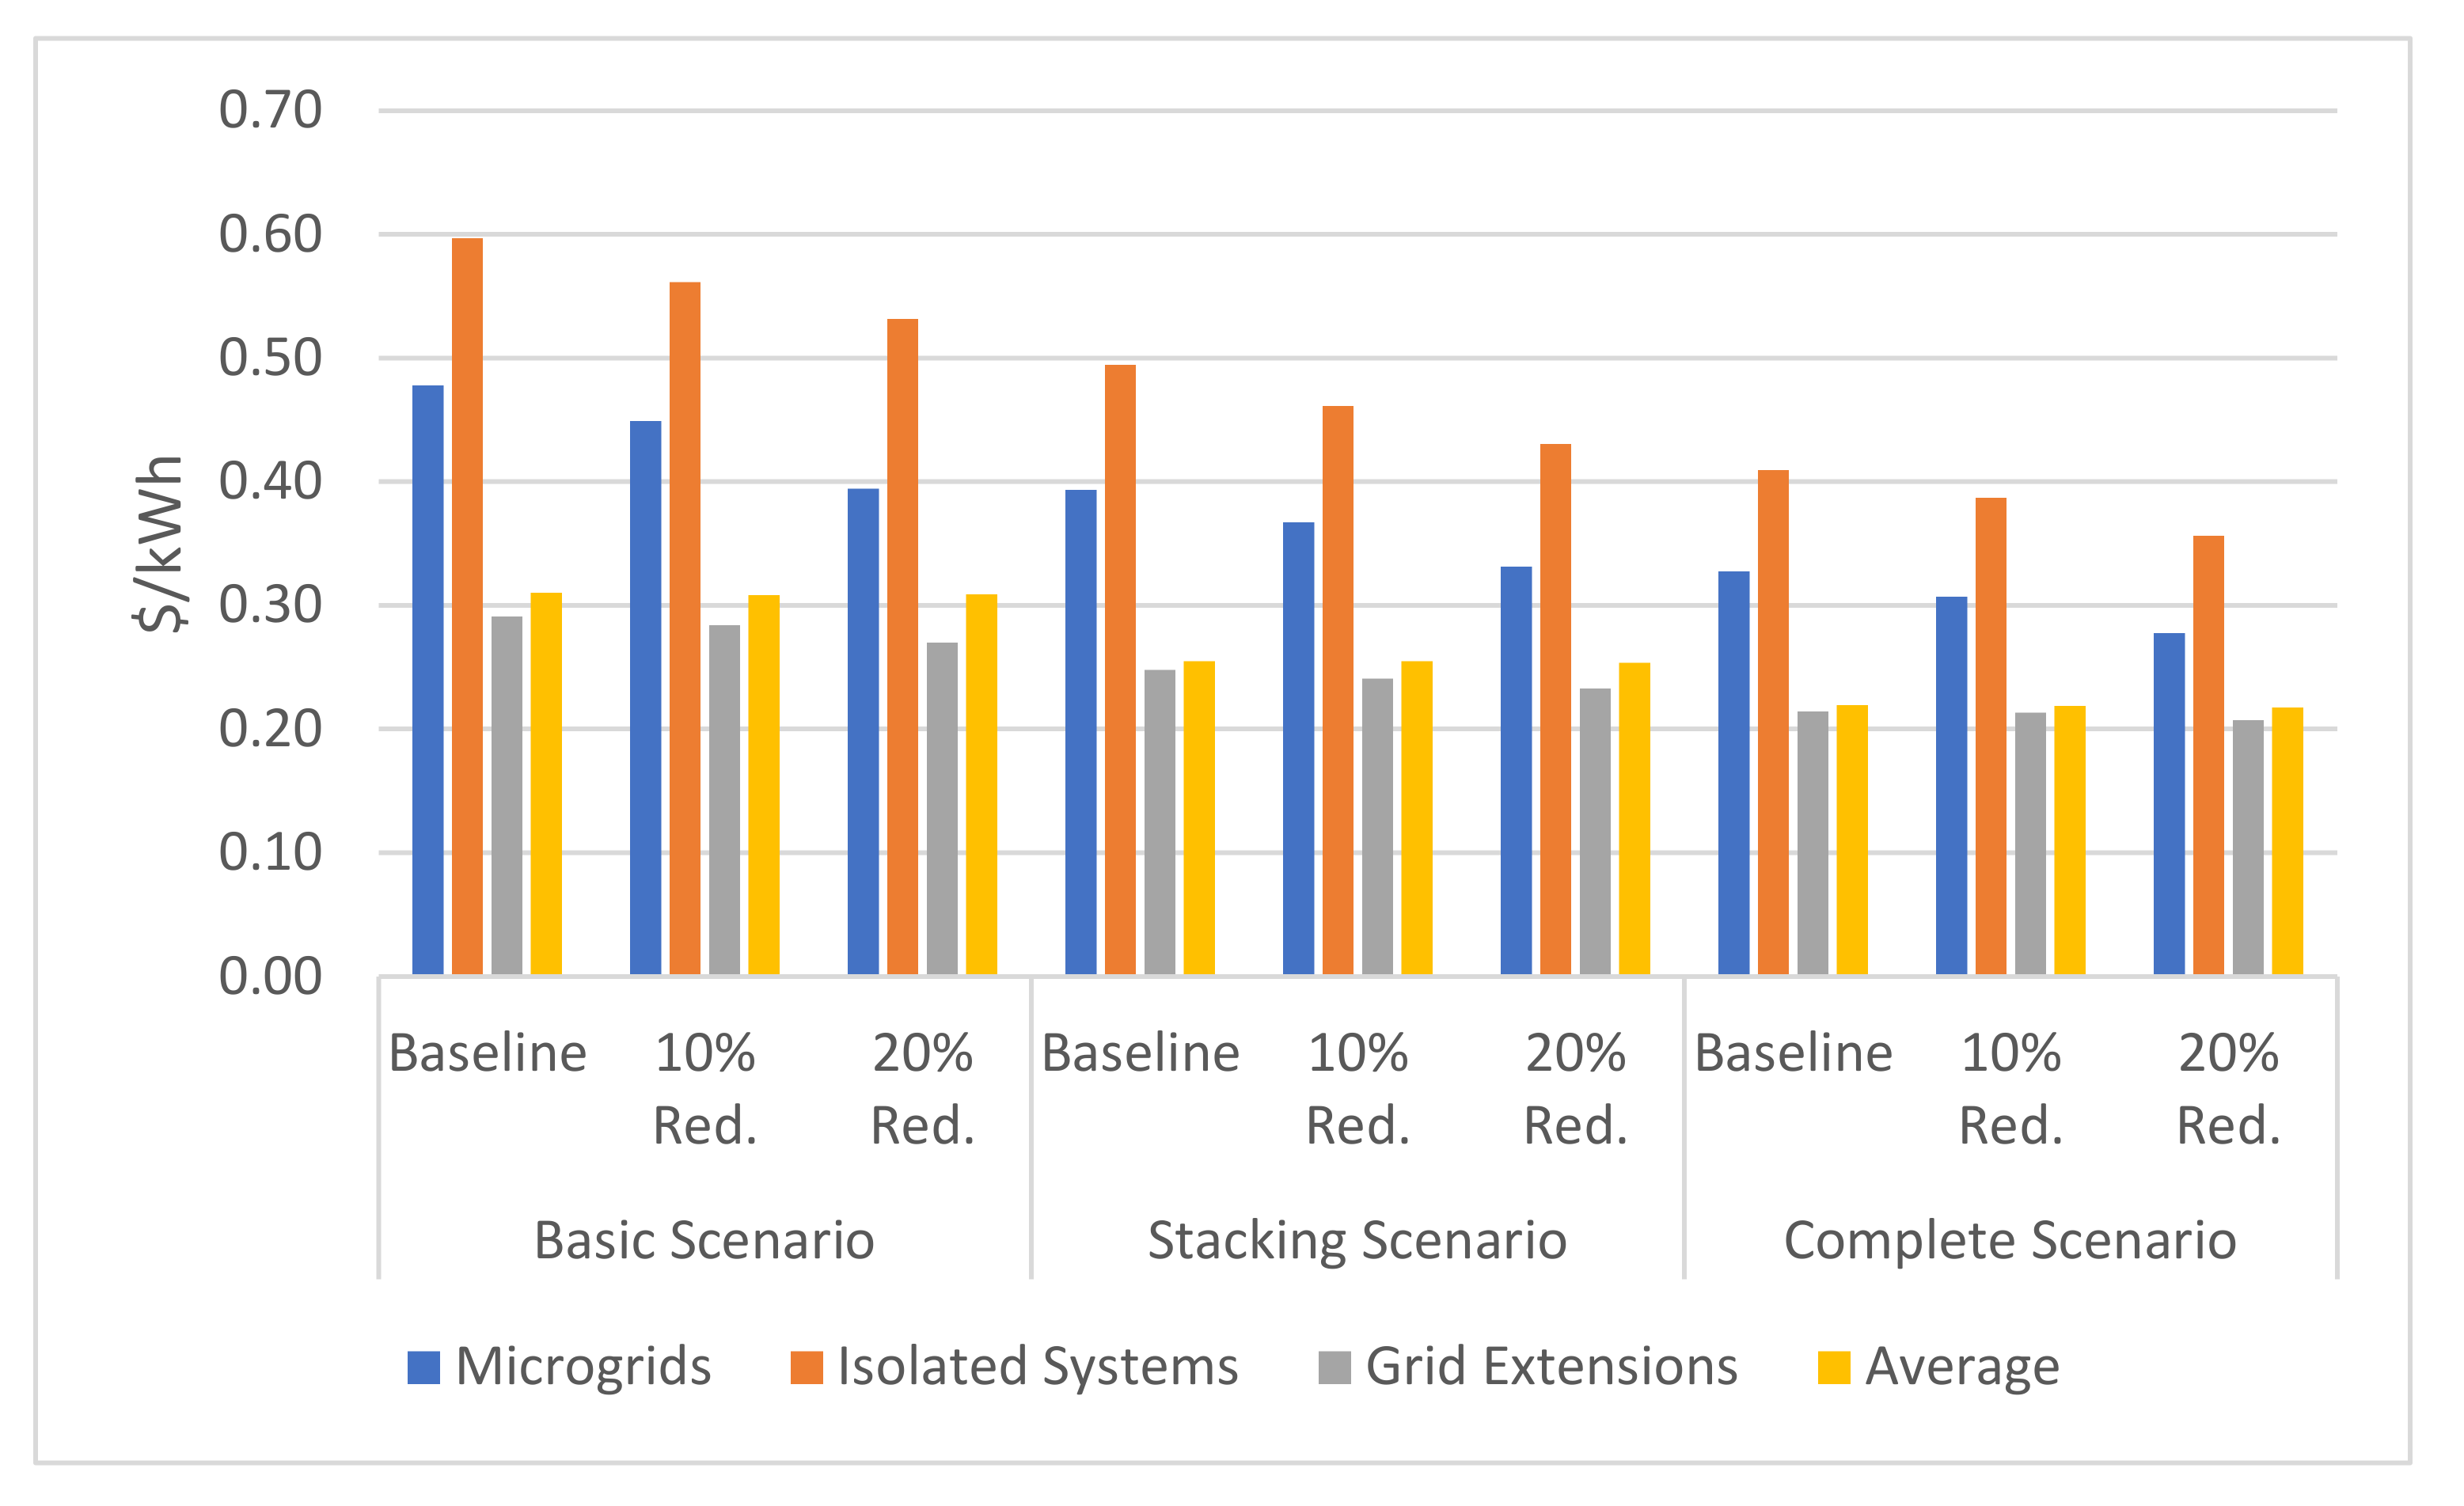
The average cost in the Basic Scenario is 0.31 USD/kWh, with an important reduction per unit cost in the Stacking Scenario and Complete Scenario when electricity is used for cooking (Table 3). The higher the consumption, the lower the per unit cost. In the Complete Scenario, there is a 29.24% average cost reduction—31.50% for microgrids, 30.31% for isolated systems, and 26.34% for grid extension—and in the Stacking Scenario, a 17.82% average cost reduction—17.68% for microgrids, 16.98% for isolated systems, and 14.88% for grid extension. The average cost reduction in the Stacking Scenario is higher than the reduction in the three electrification modes because the fraction of households changes between the Stacking Scenario and the Basic Scenario (Figure 5).
The reduction of electricity cost due to a higher electricity demand is consistent with previous studies [44]. The reduction of kWh cost in isolated systems is due to the economy of scale in PV systems. The PV equipment for the isolated systems projected by the simulations is: 372 Wp with an initial investment of USD 851 for the Basic Scenario; 727 Wp with USD 1440 for the Stacking Scenario; and 1411 Wp with USD 2508 for the Complete Scenario. These costs are within the cost range of DC solar kits on the international market [71].
The demand from grid extension households in Nyagatare is 25,046 MWh/year in the Basic Scenario, 44,382 MWh/year in the Stacking Scenario, and 78,378 MWh/year in the Complete Scenario. If the same percentages of dwellings connected to the grid were extrapolated to the whole of Rwanda, the demand would be 1036,502 MWh/year in the Basic Scenario, 1836,729 in the Stacking Scenario, and 3243,642 MWh/year in the Complete Scenario. Although Rwanda currently has an electricity generation surplus despite an installed capacity of only 150 MW [72], this is due to the low rate of connected households and the low consumption per household. Thus, in order to generalize the Basic Scenario, Stacking Scenario, and Complete Scenario to the whole country by 2030, installed generation capacity would have to grow substantially in the coming years.

3.2. Household Electricity and Cooking Costs

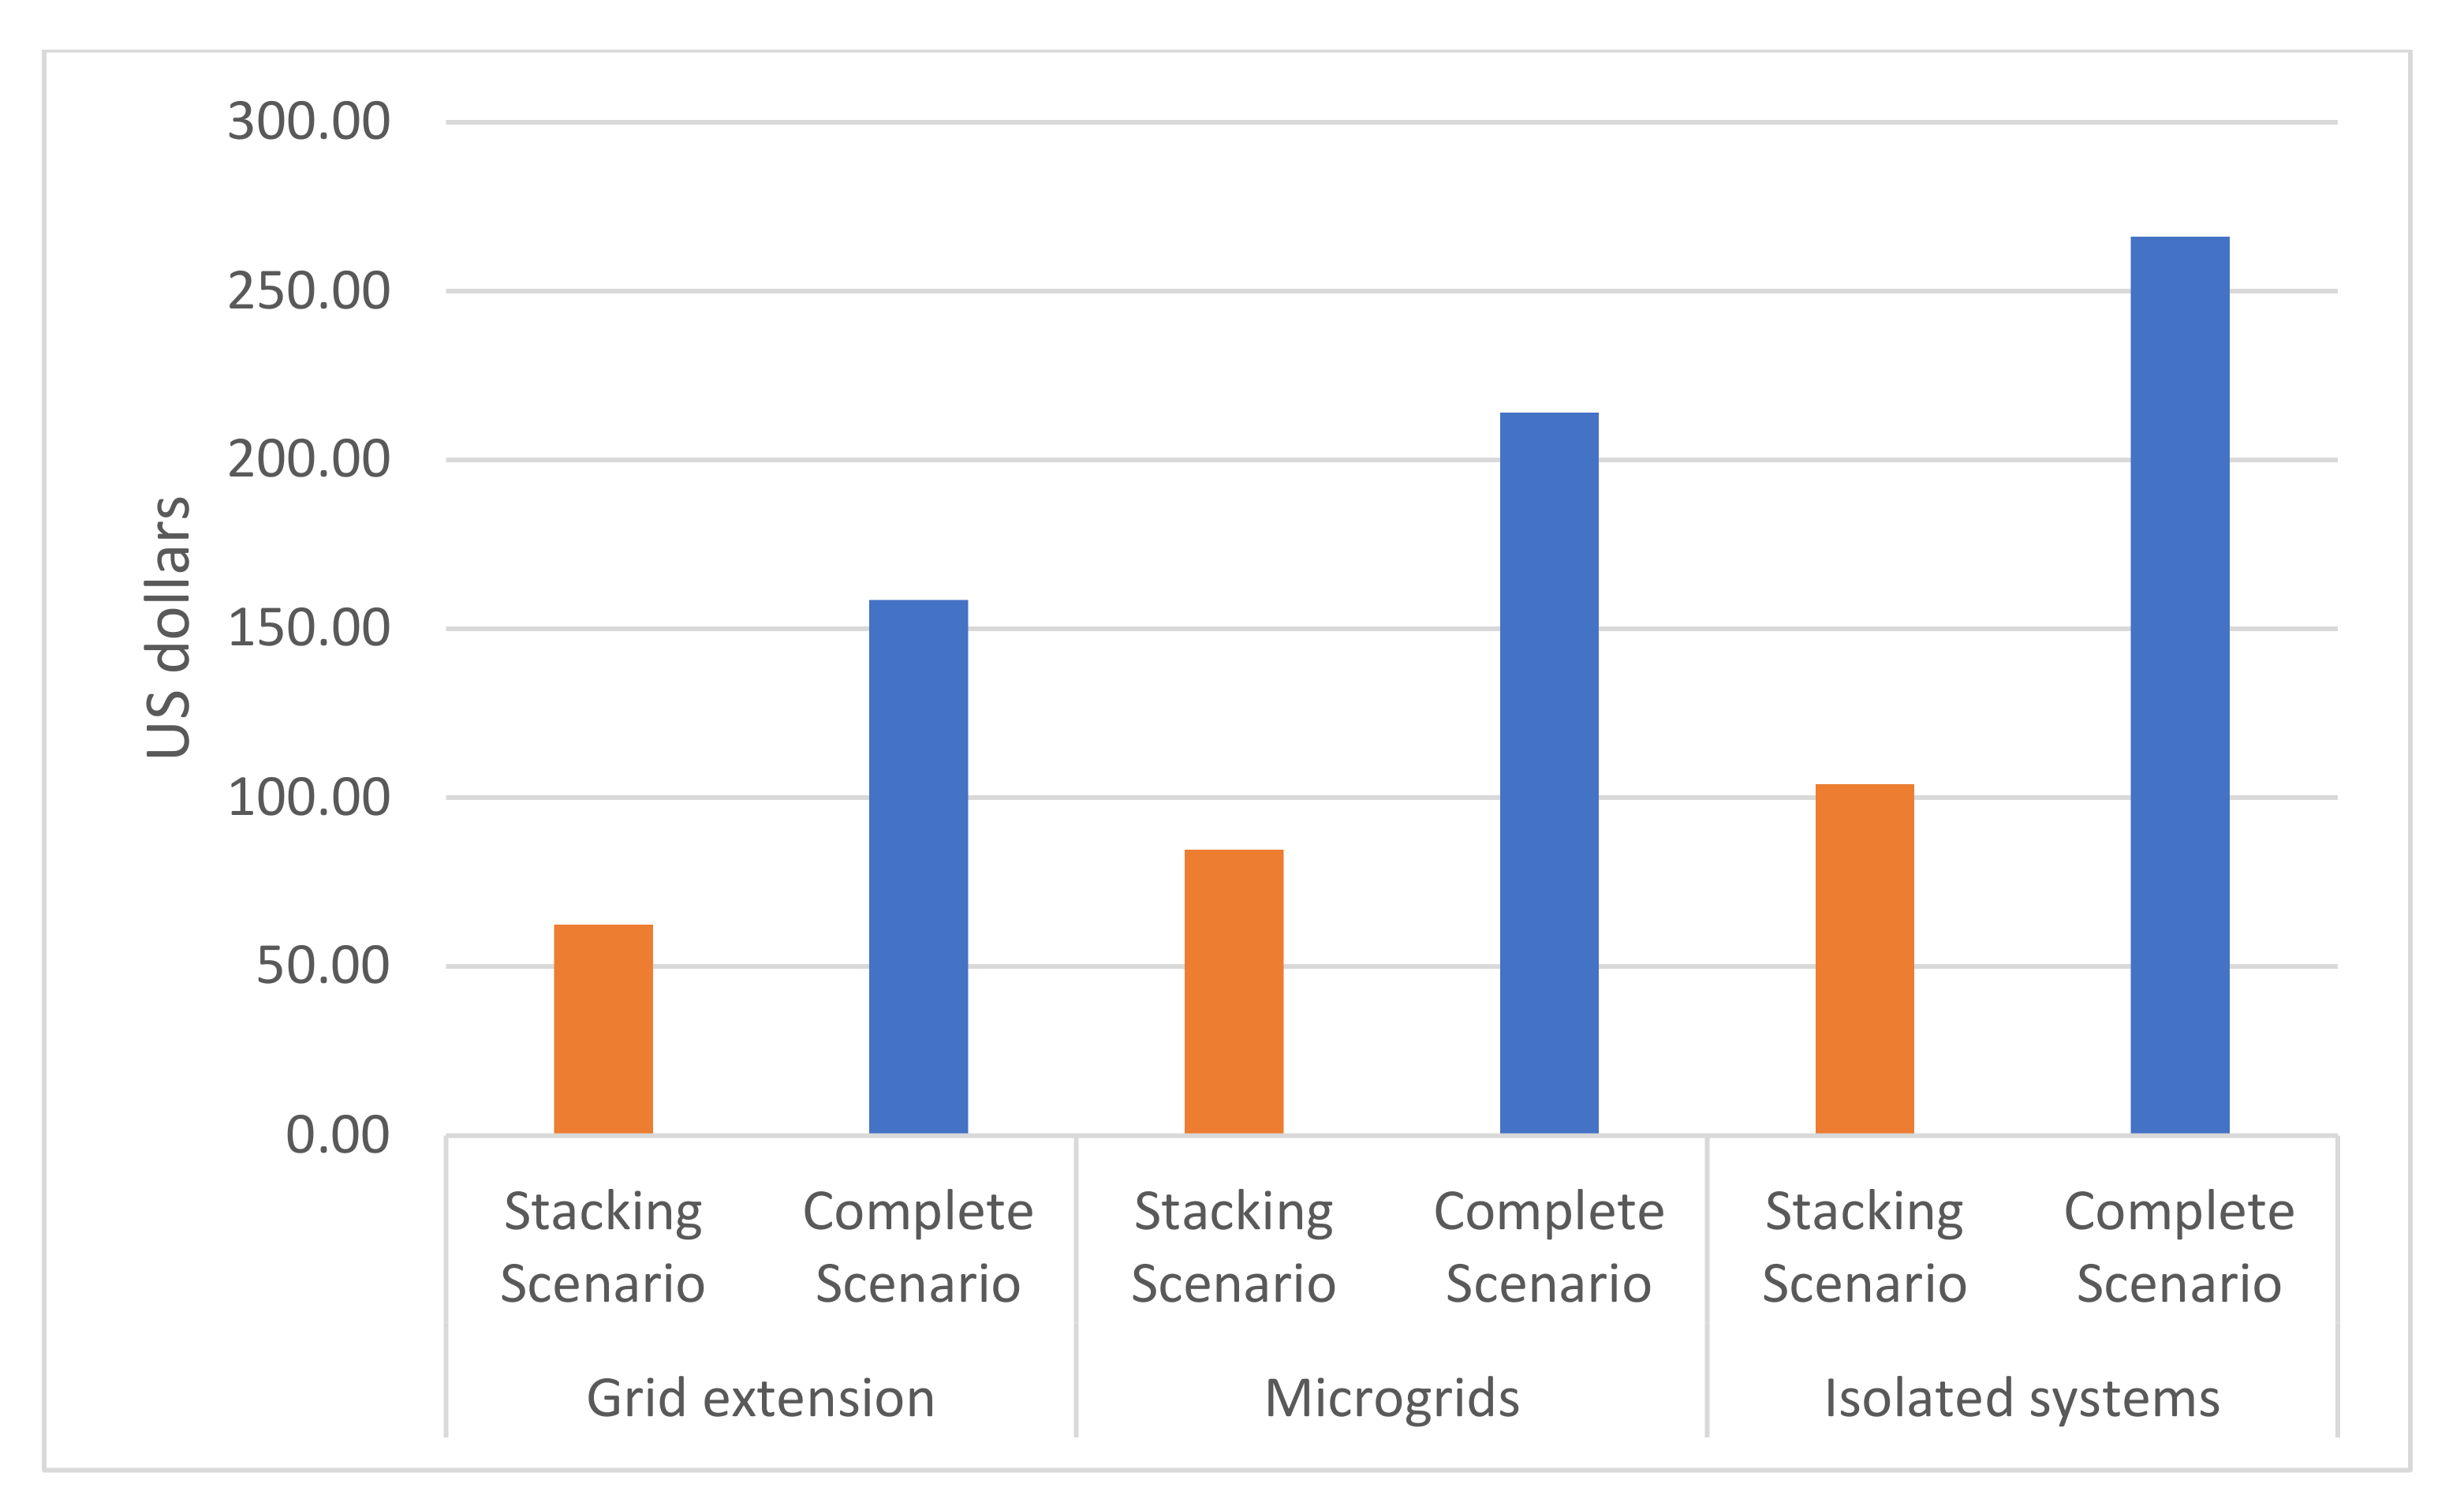
This section analyzes the cost of electric cooking and the competitiveness between cooking with electricity and cooking with LPG, charcoal, and firewood. The breakeven price between electricity and every other fuel is lower for the average grid-connected households, which account for more than 96% of the customers in both the Stacking Scenario and the Complete Scenario. For grid-connected households, the cost of electricity amounts to 153.70 USD/year in the Stacking Scenario and 234.69 USD/year in the Complete Scenario, and additional cooking costs are 47.49 USD/year in the Stacking Scenario and 128.48 USD/year in the Complete Scenario (Table 4 and Figure 6). The cooking cost for grid-connected households is higher than the 27 USD/year national average expenditure for households using firewood [73] but not for those using LPG and charcoal.
The LPG breakeven price for an average grid household is 1.05 USD/kg for the Stacking Scenario and 1.37 USD/kg for the Complete Scenario, but the average LPG price in Kigali can reach 1.30 USD/kg [74], with higher costs incurred in areas far from distribution networks. The charcoal breakeven price is 0.16 USD/kg for the Stacking Scenario and 0.21 USD/kg for the Complete Scenario, but the average cost in urban areas is between 0.27 and 0.36 USD/kg [75], with lower prices in rural areas. The LPG and charcoal breakeven prices increase between 40% and 43% for microgrid households and between 77% and 81% for isolated system households.
The results show the competitiveness of cooking with electricity compared to alternatives and are consistent with recent studies [41]. Income remains a fundamental driver of fuel and stove demand, with the lowest income quintiles most dependent on the historically most affordable fuels, primarily wood and charcoal [9]. The MTF considers that access to electricity or MECS is affordable if it accounts for less than 5% of household expenditure, or 10% for both electricity and MECS. In Rwanda in 2018, the total household consumption expenditure was USD 7341 million for 12.302 million people (WB, 2021, web data). Assuming four people per household, the household expenditure was 2387 USD/year per household. The average growth of the GNI per capita was 4.36% in the ten years before 2018, and assuming the same average growth for the forthcoming years, household expenditure would be close to 4000 USD/year per household by 2030. A share of 5% of this amount is 200 USD/year, which is less than the average cost of electricity for basic services in all scenarios, less than the average cooking cost in the Stacking Scenario, and less than the average cooking cost in the Complete Scenario for grid households. However, because household expenditure is not equal in every household, access to either electricity or MECS might not be affordable for low-income households in any scenario in the absence of subsidies.

3.3. Total Cost for Electrification of Nyagatare District

The total cost for the electrification of all Nyagatare customers varies in each scenario. In the Basic Scenario, the total customer cost per year is USD 10,868,613. This amount increases by 27.90% to reach the Stacking Scenario and 82.01% to reach the Complete Scenario. Cooking with isolated systems increases the cost attributed to household electrification and reduces the cost for non-households and their kWh cost. Due to the displacement of customers from microgrids and isolated systems to grid extension in the Stacking Scenario and the Complete Scenario, the cost of grid extensions increases and the cost of isolated systems decreases in both scenarios. The cost of microgrids decreases in the Stacking Scenario but increases in the Complete Scenario (Table 5).

3.4. Greenhouse Emissions
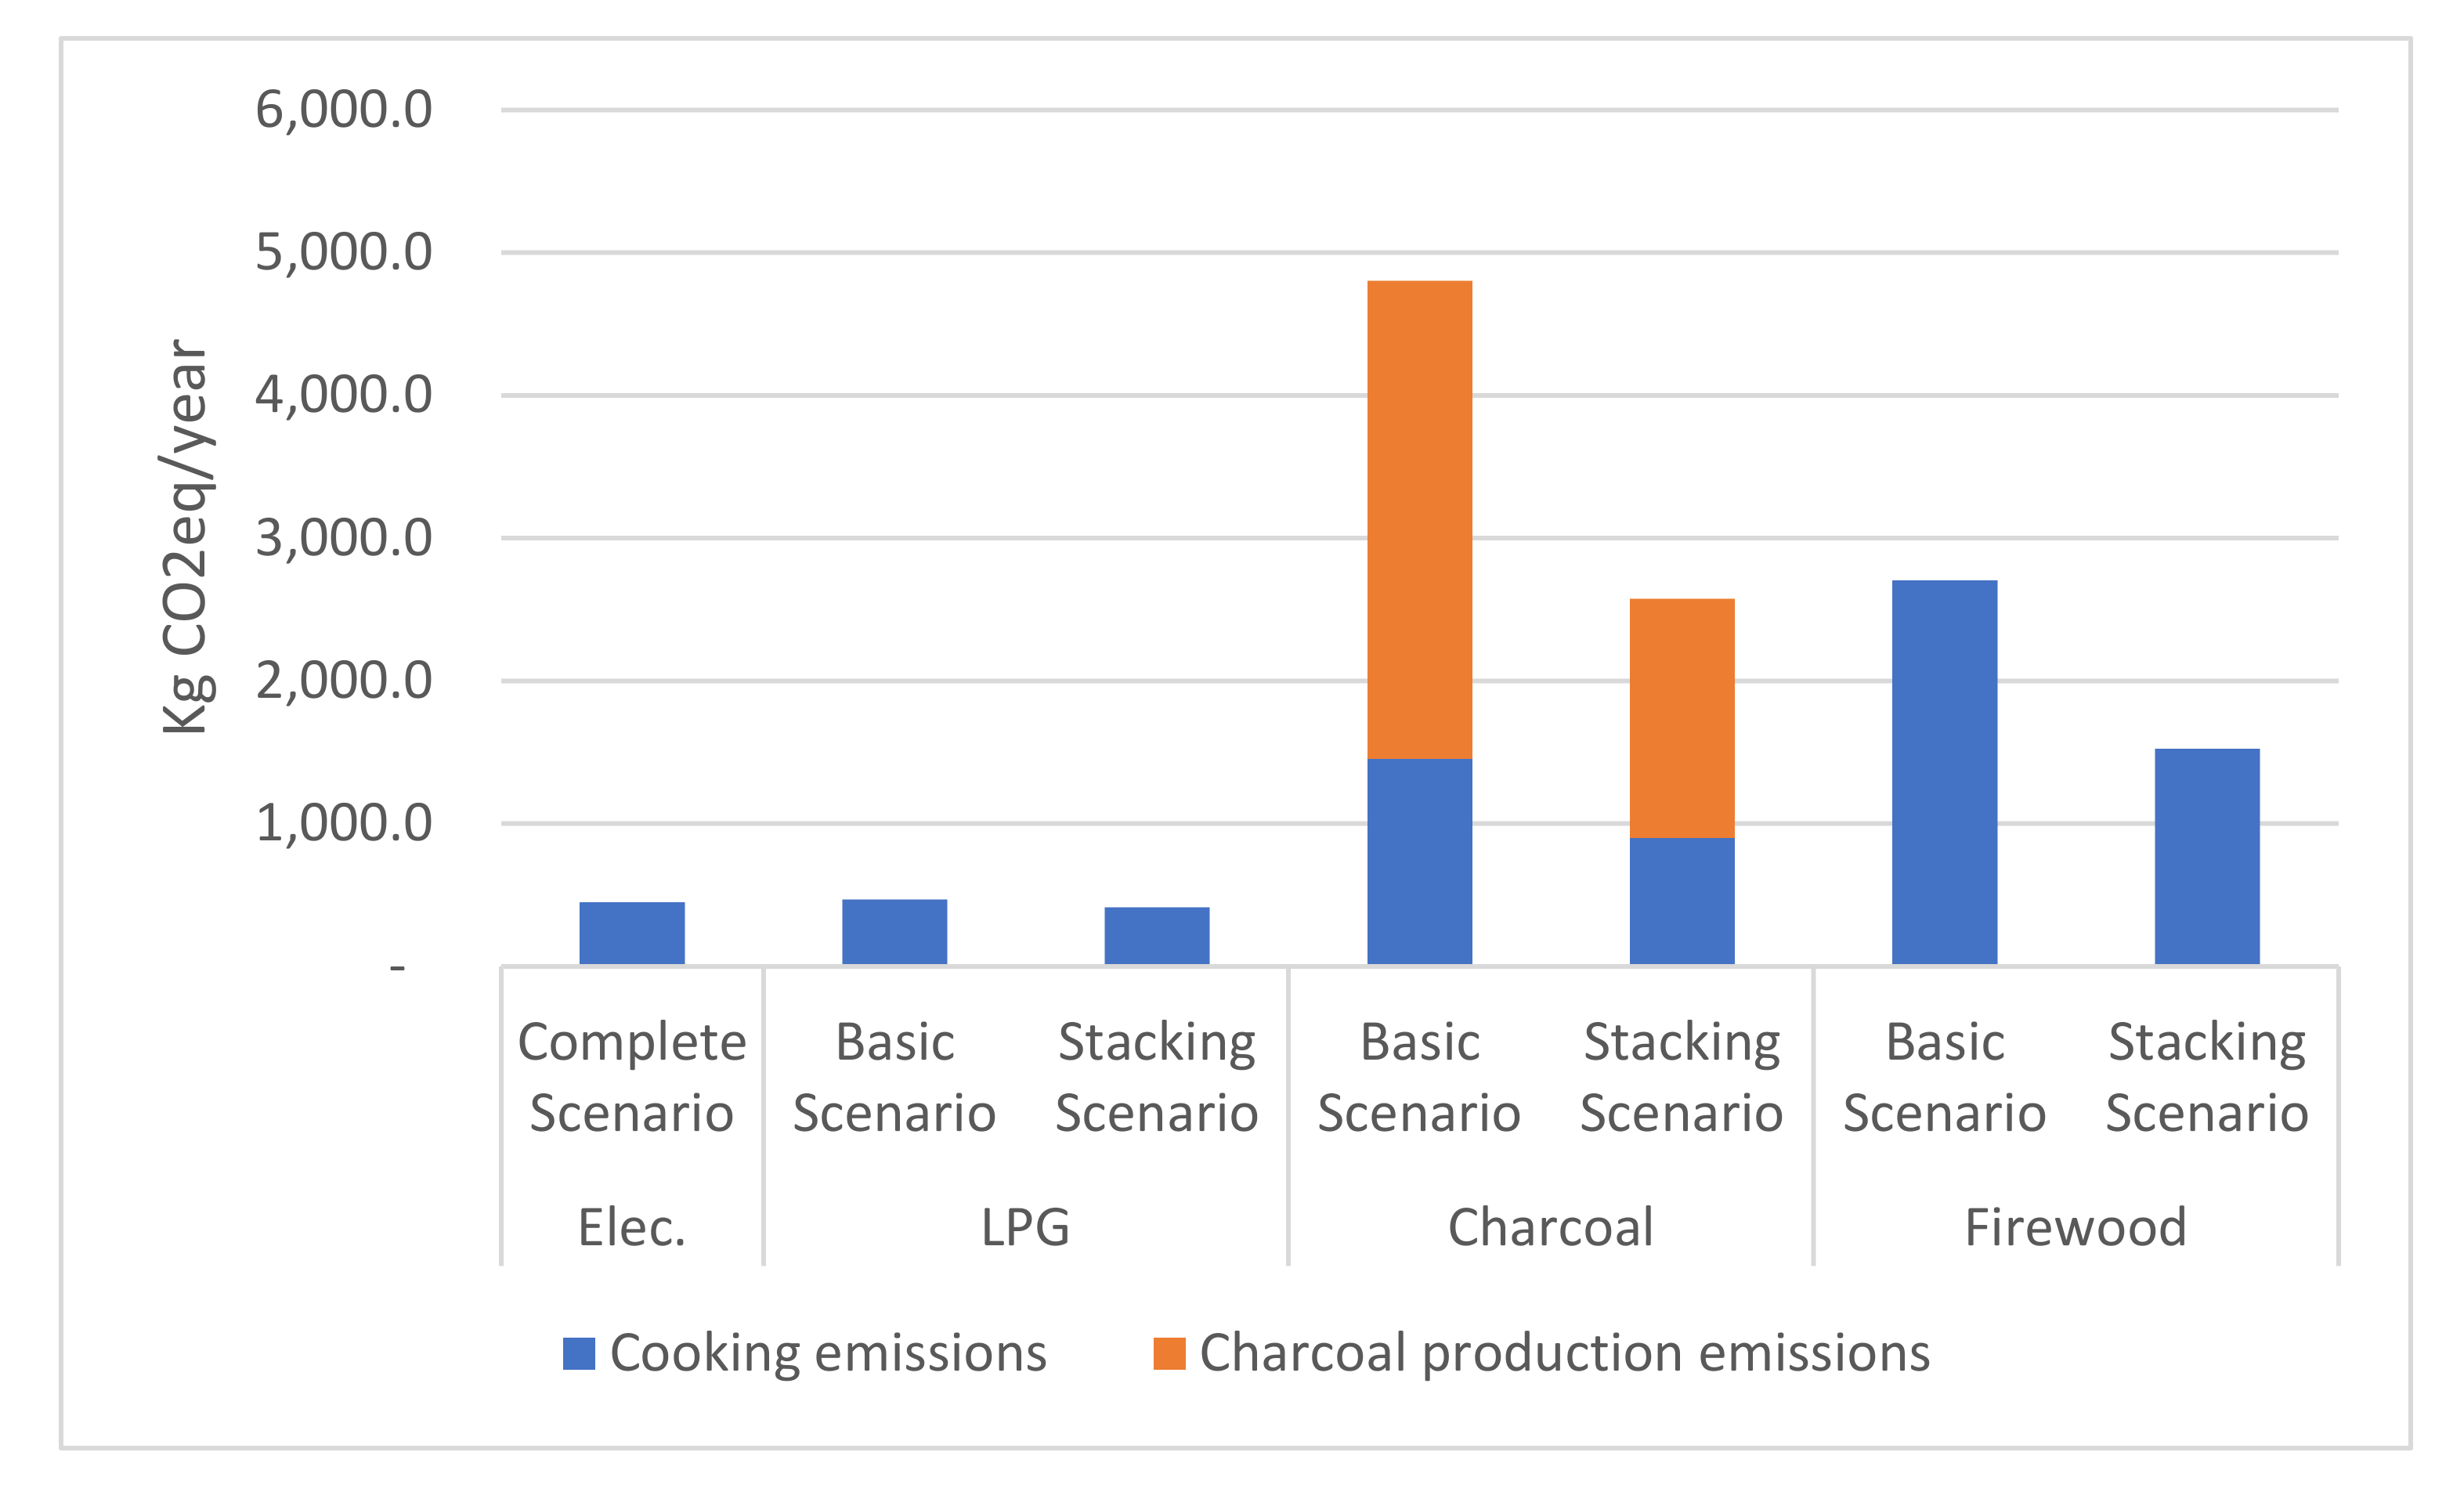
The lowest CO2eq emissions are produced by cooking with electricity and LPG. The lowest emission option is stacking with LPG—414.5 kg/year/HH—followed by cooking only with electricity—449.0 kg/year/HH—and cooking only with LPG—468.5 kg/year/HH (Table 6). In the Nationally Determined Contribution, the Rwandan Government has committed to a low carbon mix of power generation for the national grid, and this action would reduce Complete Scenario emissions to below those of the Basic Scenario and Stacking Scenario with LPG.
Cooking with charcoal and firewood produces much higher emissions. Considering only the final use, charcoal emits less than firewood, but this situation is the opposite if the emissions of charcoal production are considered. In these circumstances, cooking only with charcoal produces 4802.5 kg/year/HH, more than 10 times the emissions when only electricity and/or LPG is used (Figure 7).
The global GHG household emissions derived from cooking in Nyagatare are 356,577 t/year using only charcoal and 200,790 t/year using only firewood. These figures are reduced to 191,118 (46.40%) and 113,224 (43.61%) respectively by stacking with electricity.
The results related to the reduction in GHG emissions by replacing biomass with electricity or LPG for cooking are consistent with those of the modern fuel and electric cooking scenarios in sub-Saharan Africa developed by Dagnachew [76].
Due to the use of wood in charcoal production, cooking with charcoal is the most wood-demanding alternative, needing more than 3 t/year-HH in the Basic Scenario and 1.5 t/year-HH in the Stacking Scenario. Assuming a factor of non-renewable biomass of 58.45%, cooking only with charcoal in Nyagatare produces a loss of 138,602 t/year of biomass, whereas stacking with electricity reduces this amount by half, and cooking with electricity and/or LPG eliminates the loss. (Table 7).
One of the measures planned by the Government of Rwanda in its Nationally Determined Contributions is to reduce firewood and fossil energy consumption for cooking to mitigate GHG emissions. Stacking Scenario and Complete Scenario emissions show that replacing firewood and charcoal with electricity is an effective means of achieving this target, and LPG replacement may also be effective in the future if there is a lower carbon mix of power generation for the national grid.

3.5. Sensitivity Analysis

Change in grid costs leads to a change in electrification modes, particularly the swapping between grid extensions and microgrids, leaving the other fuels unaffected. Higher grid cost results in fewer grid extensions, and more microgrids and isolated systems (Table 8).
A 3.0 cents/kWh difference in grid cost is passed on to the average kWh cost for customers of between 3.0 and 3.2 cents/kWh. The kWh cost increases in grids between 2.3 and 2.9 cents, reduces in microgrids between 0.2 and 2.5 cents/kWh, and remains the same in isolated systems. The high kWh cost in microgrids together with an increase in their proportion leads to a rise in average kWh cost, which is higher than the cost to customers connected to grids.
When the grid cost decreases by 3.0 cents, the average cost is reduced by 3.2 cents in all scenarios. The kWh cost reduces in grids by between 2.4 and 3.1 cents/kWh, varies slightly upwards or downwards in microgrids, and remains the same in isolated systems. The reduction in the proportion of microgrids, which have a higher kWh cost, leads to a reduction that is slightly in excess of 3.0 cents/kWh.
Sensitivity of kWh cost versus grid cost lies between 29.17% and 44.45% throughout all the electrification modes, between 24.74% and 40.59% for grids, between 0.58% and -14.82% for microgrids, and nil for isolated systems.
Reductions of 10% and 20% in the cost of PV equipment lead to a notable change in electrification modes, the lower cost of PV equipment, fewer grid extensions, and more microgrids and isolated systems. The reduction in PV equipment cost leads to a reduction in the kWh cost in all electrification modes and scenarios (Figure 8). However, the average kWh cost changes insignificantly, by no more than 0.2 cents of a dollar, because the reduction of kWh costs is compensated by a higher fraction of microgrids and isolated systems, which means higher kWh costs and a high fraction of households with grid extension (Table 9). The sensitivity of average kWh cost versus PV equipment cost is less than 3%.
The greater the PV equipment cost reduction, the higher the kWh cost reduction for each individual electrification mode. The largest reductions are off-grid systems, which reduce the cost of electric cooking and the breakeven price of LPG and charcoal in these settings.
In the Basic Scenario, using the National Electrification Plan basic package instead of 1 kWh/day demand, the average kWh cost increases by USD 0.50, from USD 0.310 to USD 0.810, and a change in the proportion on electrification modes is registered (Figure 9 and Table 10). This is due to the increase in the kWh cost in all electrification modes and the increased proportion of the most expensive modes (microgrids and isolated systems). The average kWh cost increases less in the Stacking Scenario—USD 0.104—and the Complete Scenario—USD 0.039.
The electricity available with the National Electrification Plan basic package is 50 Wh/day or 450 Wh/day, 20- or 2.2-fold less than that available with 1 kWh, respectively; however, the savings with the National Electrification Plan package are relatively low. For household customers the saving is 2,790,648 USD/year or 37.55 USD/year-HH in the Basic Scenario; 2,493,955 USD/year or 33.56 USD/year-HH in the Stacking Scenario; and 2,218,613 USD/year or 29.85 USD/year-HH in the Complete Scenario (Table 11). Given the benefits of having Tier 3 electricity access, as opposed to Tier 1 or 2, and the limited savings with the National Electrification Plan basic package, planning electricity access with the 1 kWh basic package appears worthwhile.

3.6. Caveats and Ongoing Future Research

This work is a first approximation towards developing and testing a methodology for the introduction of electric cooking in large-scale electricity planning in areas without electricity. Extrapolating the results obtained in the Nyagatare District case study to other regions must be carried out with caution.
Due to the lack of reliable data, it was necessary to make certain assumptions about household demand profiles, both for electricity and cooking fuel consumption, and about equipment costs. The costs by 2030 will depend on technological developments and government policies in the coming years. With other values, the results may vary, but the methodology remains valid, nevertheless.
In this study, it was considered that the generation capacity of the grid is able to reliably meet the demand, including peak demand. However, this may not be the case if demand growth is faster than supply growth. Estimations of greenhouse gas emissions did not consider the life cycle of fuels and electricity due to lack of information and are therefore underestimated.
The analysis in this paper relied on a solid computer-based model of electricity supply. However, a similar model for the fuels that compete with electricity and the associated demand needs further development.
On the cooking fuel supply side, a georeferenced layer with LPG, charcoal, and firewood distribution networks must be developed, in addition to the estimation of the fuel costs at the household level, hotspots of deforestation and charcoal production, availability and cost of stoves and electric cooking equipment, government policy priorities, public subsidy options, and the plans of business and civil society.
On the demand side, additional information must be gathered for each household: cultural preferences, electricity and fuels demand profile, prioritized technologies for stacking, ability and willingness to pay, household expenditure, health impacts, and time for collecting free firewood.
With these two layers of georeferenced data, it will be possible to match the supply and demand sides to establish the least-cost solution based on social, environmental, and political criteria.

4. Conclusions

This study lays the foundations for the integration of electric cooking and MECS in the electrical planning of unserved areas. The approach has been illustrated by its application to the Nyagatare District in Rwanda.
The methodology developed is useful for planning the electrification of unserved regions considering the use of electricity for cooking, although some aspects can still be improved and some assumptions can be removed; calibration of the model for a particular region allows the analysis of multiple situations and scenarios.
In the Nyagatare District case study, the hypothetical penetration of electric cooking would substantially change the fraction of households electrified with each electrification mode in the least cost plan and would lead to a reduction in the kWh cost, both for households and for all consumers as a whole.
Electric cooking can be cost-competitive compared to LPG for grid households, but not for non-grid-connected households. Its competitiveness with charcoal will depend on the future cost of this fuel in rural areas. Replacing firewood and charcoal with electricity for cooking is an effective means to achieve GHG emission reductions.
Clean stacking with electricity significantly reduces kWh cost, and the need for collection of non-renewable biomass, with a limited increase in global cost for electrification and cooking. Therefore, this scenario is a transitional means to meet MECS.
Cooking with energy-efficient electric appliances and renewable energy feeding grid and off-grid settings is the most effective means to meet the three targets of SDG 7—universal access, efficiency, and renewable energy—and to contribute towards complying with the Paris Agreement. In a context of climate change and movement towards a carbon neutral economy for the future, cooking with electricity is an inevitable option. It has already proven to be economically competitive in certain scenarios and in all likelihood will be enhanced by the decarbonization of grid-supplied electricity in the coming years.

Author Contributions

Conceptualization, E.S.-J., A.G.-G., J.M., J.L. and J.I.P.-A.; methodology, E.S.-J., A.G.-G., J.L. and J.I.P.-A.; software, P.C.; validation, A.G.-G.; formal analysis, E.S.-J.; investigation, E.S.-J. and A.G.-G.; resources, A.G.-G. and J.M.; data curation, P.C.; writing—original draft preparation, E.S.-J.; writing—review and editing, E.S.-J., A.G.-G., J.M., P.C., J.L. and J.I.P.-A.; visualization, E.S.-J.; supervision, J.L., and J.I.P.-A.; project administration, J.L.; funding acquisition, J.L. All authors have read and agreed to the published version of the manuscript.

Funding

This research received no external funding.

Institutional Review Board Statement

Not applicable.

Informed Consent Statement

Not applicable.

Data Availability Statement

The data presented in this study are available upon request from the corresponding author. The data is not publicly available be-cause some of it was generated in previous work and requires the permission of 3rd party.

Acknowledgments

The itdUPM appreciates the support received from the Fundación Iberdrola in the area of clean cooking research.

Conflicts of Interest

The authors declare no conflict of interest.

Appendix A. REM Overview

This appendix summarizes the inputs and outputs of REM. We also provide a short description of the sequential workflow that the model follows to obtain the electrification solution in a case study. A thorough explanation of the inputs and outputs of the model and its sequential workflow is available in reference [46].

Appendix A.1. REM Inputs and Outputs

REM requires substantial information concerning the analysis region to operate. The inputs of the model include the following data:
  • The location and demand of each consumer.
  • The location, reliability, and energy cost of the distribution network.
  • The catalog of generation components, which includes techno-economic data of solar panels, batteries, diesel generators, inverters, and charge controllers.
  • The catalog of network components, which includes techno-economic information of transformers and lines.
  • The topographical features of the terrain such as altitudes and protected areas.
  • The hourly solar irradiance for a year, which is used to calculate the generation of solar panels.
  • Techno-economic and configuration parameters, such as discount rates, cost of diesel, and labor cost.
REM provides the following outputs when it calculates the least-cost solution for a region:
  • The grouping of consumers into clusters and the best electrification mode for each cluster (i.e., a combination of individual standalone systems, a mini-grid, or a grid extension).
  • The generation design of each mini-grid and standalone system. REM provides detailed information regarding the generation components included in each design and the corresponding costs.
  • The distribution network of each mini-grid and grid extension. The electrification solution includes a bill of material and the location of the lines and transformers needed for each design.
  • Relevant information concerning the electrification solution, such as the amount of demand served and reliability of the systems, overnight costs, and costs per kWh of demand served.

Appendix A.2. REM Workflow

REM operates following a process comprised of five sequential steps, which are briefly described in this section.
  • Data preparation. This step aims to collect the input information that REM needs and convert it to the specific formats that the model requires. Satellite imagery and machine learning methods based on convolutional neural networks can estimate the location of the consumers, although there are publicly available datasets such as the High Resolution Settlement Layer (HRSL) with approximates population density in cells of 30 × 30 m2 [77].
  • Mini-grid generation. REM optimizes the generation designs of several mini-grid representatives of the analysis region and stores the corresponding information in a look-up table. If REM needs information concerning generation costs of the remaining mini-grids, the model quickly obtains it interpolating among the designs stored in the look-up table.
  • Clustering. The model groups the consumers into potential mini-grids and grid extensions, analyzing the trade-offs among costs. For example, large mini-grids have substantial network costs but they benefit from economies of scale in generation.
  • Final designs. REM optimizes the network designs of the potential mini-grids and grid extensions, determining the final electrification solution for the analysis region and the corresponding costs.
  • Process results. The model generates graphical and statistical outputs that contain critical information about the case study. For example, REM generates files with the distribution networks of mini-grids and grid extensions, which can be projected onto Google Earth.

References

  1. UN General Assembly. Transforming Our World: The 2030 Agenda for Sustainable Development; United Nations: New York, NY, USA, 2015. [Google Scholar]
  2. Fonseca, L.M.; Domingues, J.P.; Dima, A.M. Mapping the sustainable development goals relationships. Sustainability 2020, 12, 3359. [Google Scholar] [CrossRef] [Green Version]
  3. IEA; IRENA; UNSD; WB; WHO. Tracking SDG7: The Energy Progress Report 2021; The World Bank: Washington, DC, USA, 2021. [Google Scholar]
  4. International Energy Agency World Energy Outlook 2020; World Energy Outlook; OECD: Paris, France, 2020; ISBN 978-92-64-62199-2.
  5. Masera, O.; Riojas-Rodríguez, H.; Pérez-Padilla, R.; Serrano-Medrano, M.; Schilmann, A.; Ruíz-García, V.; Sierra, L.A.; Berrueta, V. Vulnerabilidad a COVID-19 En Poblaciones Rurales y Periurbanas Por El Uso Doméstico de Leña; Instituto de Investigaciones en Ecosistemas y Sustentabilidad, Universidad Nacional Autónoma de México (UNAM): Mexico City, Mexico, 2020. [Google Scholar]
  6. Batchelor, S.; Brown, E. Cooking Health Energy Environment and Gender (CHEEG)—Guiding covid recovery plans. Gamos. Loughb. Univ. 2020, Working Paper V1.1, 98. Available online: https://mecs.org.uk/wp-content/uploads/2020/07/CHEEG-Covid-recovery-strategies-Final.pdf (accessed on 7 June 2021).
  7. HEI Household Air Pollution Group. Household Air Pollution and Noncommunicable Disease; Health Effects Institute: Boston, MA, USA, 2018. [Google Scholar]
  8. WHO. Burden of Disease from Household Air Pollution for 2016. Description of Method. V4 2018; WHO: Geneva, Switzerland, 2018. [Google Scholar]
  9. Energy Sector Management Assistance Program (ESMAP). The State of Access to Modern Energy Cooking Services; World Bank: Washington, DC, USA, 2020. [Google Scholar]
  10. Mazorra, J.; Sánchez-Jacob, E.; de la Sota, C.; Fernández, L.; Lumbreras, J. A comprehensive analysis of cooking solutions co-benefits at household level: Healthy lives and well-being, gender and climate change. Sci. Total Environ. 2020, 707, 135968. [Google Scholar] [CrossRef]
  11. WHO. WHO Indoor Air Quality: Household Fuel Combustion; WHO: Geneva, Switzerland, 2014. [Google Scholar]
  12. Smith, K.R.; Sagar, A. Making the clean available: Escaping India’s chulha trap. Energy Policy 2014, 75, 410–414. [Google Scholar] [CrossRef]
  13. CCA. Clean Cooking Catalog: Product and Performance Data for the Clean Cooking Sector. Available online: http://catalog.cleancookstoves.org (accessed on 18 May 2021).
  14. De la Sota, C.; Lumbreras, J.; Mazorra, J.; Narros, A.; Fernández, L.; Borge, R. Effectiveness of improved cookstoves to reduce indoor air pollution in developing countries. The case of the cassamance natural subregion, Western Africa. GEP 2014, 2, 1–5. [Google Scholar] [CrossRef] [Green Version]
  15. De la Sota, C.; Lumbreras, J.; Pérez, N.; Ealo, M.; Kane, M.; Youm, I.; Viana, M. Indoor air pollution from biomass cookstoves in rural Senegal. Energy Sustain. Dev. 2018, 43, 224–234. [Google Scholar] [CrossRef]
  16. Quinn, A.K.; Bruce, N.; Puzzolo, E.; Dickinson, K.; Sturke, R.; Jack, D.W.; Mehta, S.; Shankar, A.; Sherr, K.; Rosenthal, J.P. An analysis of efforts to scale up clean household energy for cooking around the world. Energy Sustain. Dev. 2018, 46, 1–10. [Google Scholar] [CrossRef]
  17. Puzzolo, E.; Cloke, J.; Parikh, J.; Evans, A.; Pope, D. National Scaling up of LPG to Achive SDG 7: Implications for Policy, Implementation, Public Health and Environment; MECS: Loughborough, UK, 2020. [Google Scholar]
  18. International Energy Agency. Africa Energy Outlook: A Focus on Energy Prospects in Sub-Saharan Africa; World Energy Outlook; OECD: Paris, France, 2014. [Google Scholar]
  19. Couture, T.; Jacobs, D. Beyond Fire. How to Achieve Electric Cooking; World Future Council : Hamburg, Germany; Hivos: The Hague, The Netherlands, 2019. [Google Scholar]
  20. Jürisoo, M.; Serenje, N.; Mwila, F.; Lambe, F.; Osborne, M. Old habits die hard: Using the energy cultures framework to understand drivers of household-level energy transitions in urban Zambia. Energy Res. Soc. Sci. 2019, 53, 59–67. [Google Scholar] [CrossRef]
  21. Rehfuess, E.A.; Puzzolo, E.; Stanistreet, D.; Pope, D.; Bruce, N.G. Enablers and barriers to large-scale uptake of improved solid fuel stoves: A systematic review. Environ. Health Perspect. 2014, 122, 120–130. [Google Scholar] [CrossRef]
  22. Malla, S.; Timilsina, G.R. Household Cooking Fuel Choice and Adoption of Improved Cookstoves in Developing Countries: A Review; Policy Research Working Papers; The World Bank: Washington, DC, USA, 2014. [Google Scholar]
  23. ESMAP. Clean and Improved Cooking in Sub-Saharan Africa; World Bank Group: Washington, DC, USA, 2014. [Google Scholar]
  24. IEA. Africa Energy Outlook 2019. World Energy Outlook Special Report; International Energy Agency: Paris, France, 2019. [Google Scholar]
  25. IRENA. Renewable Energy Market Analysis: GCC 2019; IRENA: Abu Dhabi, UAE, 2019. [Google Scholar]
  26. Muchira, N. East Africa power consumers unable to buy the surplus. The East African, 19 May 2019. Available online: https://www.theeastafrican.co.ke/tea/business/east-africa-power-consumers-unable-to-buy-the-surplus-1417824 (accessed on 7 June 2021).
  27. Batchelor, S.; Brown, E.; Scott, N.; Leary, J. Two birds, one stone—Reframing cooking energy policies in Africa and Asia. Energies 2019, 12, 1591. [Google Scholar] [CrossRef] [Green Version]
  28. IPCC. 2014. Climate Change 2014: Mitigation of Climate Change. Contribution of Working Group III to the Fifth Assessment Report of the Intergovernmental Panel on Climate Change; Grafham, O., Pichs-Madruga, R., Sokona, Y., Farahani, E., Kadner, S., Seyboth, K., Adler, A., Baum, I., Brunner, S., Eickemeier, P., et al., Eds.; Cambridge University Press: Cambridge, UK; New York, NY, USA, 2015; Volume 3, ISBN 1-107-05821-X. [Google Scholar]
  29. Smith, K.R.; Uma, R.; Kishore, V.V.N.; Lata, K.; Joshi, V.; Zhang, J.; Rasmussen, R.A.; Khalil, M.A.K. Greenhouse Gases from Small-Scale Combustion Devices in Developing Countries, Phase IIA: Household Stoves in India; US EPA: Washington, DC, USA, 2000. [Google Scholar]
  30. ERG. Comparative Analysis of Fuels for Cooking: Life Cycle Environmental Impacts and Economic and Social Considerations; Global Alliance for Clean Cookstoves: Washington, DC, USA, 2017. [Google Scholar]
  31. Ivanova, I. Cities Are Banning Natural Gas in New Homes, Citing Climate Change. CBS News, 6 December 2019. Available online: https://www.cbsnews.com/news/cities-are-banning-natural-gas-in-new-homes-because-of-climate-change/ (accessed on 7 June 2021).
  32. IPCC. Global Warming of 1.5°C. An IPCC Special Report on the Impacts of Global Warming of 1.5°C above Pre-Industrial Levels and Related Global Greenhouse Gas Emission Pathways, in the Context of Strengthening the Global Response to the Threat of Climate Change, Sustainable Development, and Efforts to Eradicate Poverty; IPCC: Geneva, Switzerland, 2018; In Press. [Google Scholar]
  33. Moner-Girona, M.; Puig, D.; Mulugetta, Y.; Kougias, I.; AbdulRahman, J.; Szabó, S. Next generation interactive tool as a backbone for universal access to electricity. Wiley Interdiscip. Rev. Energy Environ. 2018, 7, e305. [Google Scholar] [CrossRef] [Green Version]
  34. Bhattacharyya, S.C.; Palit, D. A critical review of literature on the nexus between central grid and off-grid solutions for expanding access to electricity in Sub-Saharan Africa and South Asia. Renew. Sustain. Energy Rev. 2021, 141, 110792. [Google Scholar] [CrossRef]
  35. Morrissey, J. Achieving universal electricity access at the lowest cost: A comparison of published model results. Energy Sustain. Dev. 2019, 53, 81–96. [Google Scholar] [CrossRef]
  36. KTH. Accelerating the Transition to Clean and Modern Cooking for the 3 Billion People without Access. Available online: https://www.energy.kth.se/energy-systems/desa-news/accelerating-the-transition-to-clean-and-modern-cooking-for-the-3-billion-people-without-access-1.1056280 (accessed on 23 May 2021).
  37. Alem, Y.; Hassen, S.; Köhlin, G. The Dynamics of Electric Cookstove Adoption; Environment for Development Initiative: Gothenburg, Sweden, 2013. [Google Scholar]
  38. Global LEAP Awards. 2020 Buyer’s Guide for Electric Pressure Cookers; MECS: Loughborough, UK, 2021. [Google Scholar]
  39. Leary, J.; Batchelor, S.; Scott, N. Cooking Diaries 3.0 Protocols; MECS: Loughborough, UK, 2019. [Google Scholar]
  40. Batchelor, S.; Leary, J.; Sago, S.; Mnja, E.; Sawe, J.; Suma, N.; Scott, N. ECook Tanzania Country Report; MECS: Loughborough, UK, 2018. [Google Scholar]
  41. Energy Sector Management Assistance Program (ESMAP). Cooking with Electricity: A Cost Perspective; World Bank: Washington, DC, USA, 2020. [Google Scholar]
  42. Lombardi, F.; Riva, F.; Sacchi, M.; Colombo, E. Enabling combined access to electricity and clean cooking with PV-microgrids: New evidences from a high-resolution model of cooking loads. Energy Sustain. Dev. 2019, 49, 78–88. [Google Scholar] [CrossRef]
  43. IEA. World Energy Outlook 2018; International Energy Agency: Paris, France, 2018. [Google Scholar]
  44. Lee, S.J.; Sánchez Jacob, E.; González García, A.; Ciller Cutillas, P.; Dueñas Martínez, P.; Taneja, J.; Cuadra García, F.; Lumbreras Martín, J.; Daly, H.; Stoner, R.J.; et al. Investigating the necessity of demand characterization and stimulation for geospatial electrification planning in developing countries. Mit Cent. Energy Environ. Policy Res. 2019, Working Paper. http://ceepr.mit.edu/files/papers/2019-018.pdf.
  45. SE4ALL. Data Standards for Integrated Energy Planning; Sustainable Energy For All. SE4ALL: Vienna, Austria, 2020. [Google Scholar]
  46. Ciller, P.; Ellman, D.; Vergara, C.; Gonzalez-Garcia, A.; Lee, S.J.; Drouin, C.; Brusnahan, M.; Borofsky, Y.; Mateo, C.; Amatya, R.; et al. Optimal electrification planning incorporating on- and off-grid technologies: The reference electrification model (REM). Proc. IEEE 2019, 107, 1872–1905. [Google Scholar] [CrossRef]
  47. MIT & IIT-Comillas Universal Energy Access Research Group—Projects. Available online: http://universalaccess.mit.edu//#/cases (accessed on 18 May 2021).
  48. Waya. Energy Projects. Available online: https://waya-energy.com/projects (accessed on 18 May 2021).
  49. Ciller, P.; Lumbreras, S. Electricity for all: The contribution of large-scale planning tools to the energy-access problem. Renew. Sustain. Energy Rev. 2020, 120, 109624. [Google Scholar] [CrossRef]
  50. Drouin, C. Geospatial Cost Drivers in Computer-Aided Electrification Planning: The Case of Rwanda. Master’s Thesis, Department of Mechanical Engineering, Massachusetts Institute of Technology, Cambridge, MA, USA, 2018. [Google Scholar]
  51. Ciller, P.; de Cuadra, F.; Lumbreras, S. Optimizing off-grid generation in large-scale electrification-planning problems: A direct-search approach. Energies 2019, 12, 4634. [Google Scholar] [CrossRef] [Green Version]
  52. Shankar, A.V.; Quinn, A.K.; Dickinson, K.L.; Williams, K.N.; Masera, O.; Charron, D.; Jack, D.; Hyman, J.; Pillarisetti, A.; Bailis, R. Everybody stacks: Lessons from household energy case studies to inform design principles for clean energy transitions. Energy Policy 2020, 141, 111468. [Google Scholar] [CrossRef]
  53. World Bank. World Bank Open Data. Available online: https://data.worldbank.org/ (accessed on 18 May 2021).
  54. NISR. Fourth Population and Housing Census, Rwanda, 2012. District Profile. Nyagatare; National Institute of Statistics of Rwanda: Kigali, Rwanda, 2015. [Google Scholar]
  55. NISR. Fourth Population and Housing Census, Rwanda, 2012. Population Projetions; National Institute of Statistics of Rwanda: Kigali, Rwanda, 2015. [Google Scholar]
  56. World Bank. Rwanda Beyond Connections. Energy Access Diagnostic Report Based on the Multi-Tier Framework; World Bank: Washington, DC, USA, 2018. [Google Scholar]
  57. Institute for Health Metrics and Evaluation (IHME). GBD Results Tool. Available online: http://ghdx.healthdata.org/gbd-results-tool (accessed on 18 May 2021).
  58. Development Bank of Rwanda. Rwanda Energy Access and Quality Improvement Project. Component 3b Increasing Access to Clean Cooking Solutions Operations Manual. Ver 02 15.03.2021; Development Bank of Rwanda: Kigali, Rwanda, 2021. [Google Scholar]
  59. Bhatia, M.; Angelou, N. Beyond Connections: Energy Access Redefined; World Bank: Washington, DC, USA, 2015. [Google Scholar]
  60. REG. Review Assessment of Current Electrification Programs Prepared by REG/EDCL and Confirmation on Institutional, Technical and Financial Aspects. TASK 2 Report. Design of the National Ministry of Infrastructures; Rwanda Energy Group: Kigali, Rwanda, 2019. [Google Scholar]
  61. International Energy Agency. Defining Energy Access: 2020 Methodology. Available online: https://www.iea.org/articles/defining-energy-access-2019-methodology (accessed on 20 May 2021).
  62. Lee, S.J. Adaptive Electricity Access Planning; Massachusetts Institute of Technology, School of Engineering: Cambridge, MA, USA, 2018. [Google Scholar]
  63. Fobi, S.; Deshpande, V.; Ondiek, S.; Modi, V.; Taneja, J. A longitudinal study of electricity consumption growth in Kenya. Energy Policy 2018, 123, 569–578. [Google Scholar] [CrossRef]
  64. Puzzolo, E.; Zerriffi, H.; Carter, E.; Clemens, H.; Stokes, H.; Jagger, P.; Rosenthal, J.; Petach, H. Supply considerations for scaling up clean cooking fuels for household energy in low- and middle-income countries. GeoHealth 2019, 3, 370–390. [Google Scholar] [CrossRef] [PubMed] [Green Version]
  65. Drigo, R.; Bailis, R.; Ghilardi, A.; Masera, O.; Suber, M. Pan-tropical analysis of woodfuel supply, demand and sustainability. Glob. Alliance Clean Cookstoves 2014. https://www.researchgate.net/publication/312021671_Pan-tropical_analysis_of_woodfuel_supply_demand_and_sustainability_2014?channel=doi&linkId=58695ce808ae8fce4917d86f&showFulltext=true (accessed on 7 June 2021). [CrossRef]
  66. MARGE. Biomass Energy Strategy (BEST) Rwanda; EUEI-PDF, GTZ, MARGE: Kigali, Rwanda, 2009. [Google Scholar]
  67. GIZ. Multiple-Household Fuel Use—A Balanced Choice between Firewood, Charcoal and LPG; Deutsche Gesellschaft für Internationale Zusammenarbeit: Bonn, Germany, 2014. [Google Scholar]
  68. Ministry of Infrastructure. Sustainable Energy for All. Action Agenda.; Ministry of Infrastructure: Kigali, Rwanda, 2016.
  69. Gouldson, A.; Colenbrander, S.; Sudmant, A.; Chilundika, N.; de Melo, L. The Economics of Low Carbon Cities: Kigali, Rwanda (2018); International Crowth Centre, University of Leeds: Leeds, UK, 2018. [Google Scholar]
  70. Moretti, L.; Astolfi, M.; Vergara, C.; Macchi, E.; Pérez-Arriaga, J.I.; Manzolini, G. A Design and dispatch optimization algorithm based on mixed integer linear programming for rural electrification. Appl. Energy 2019, 233, 1162. [Google Scholar] [CrossRef]
  71. Kit Solaire Discount. Autonomous Solar Kits. Available online: https://kitsolaire-discount.com/gb/12-autonomous-solar-kits (accessed on 23 May 2021).
  72. Republic of Rwanda. Nationally Determined Contribution. Updated; Ministry or Environment: Kigali, Rwanda, 2020.
  73. Hakizimana, E.; Wali, U.G.; Sandoval, D.; Venant, K. Environmental impacts of biomass energy sources in Rwanda. Energy Environ. Eng. 2020, 7, 62–71. [Google Scholar] [CrossRef]
  74. Bishumba, N. What Is behind the recent spike in cooking gas prices? The New Times, 19 March, 2021. Available online: https://www.newtimes.co.rw/news/what-behind-recent-spike-cooking-gas-prices (accessed on 7 June 2021).
  75. Batchelor, S.; Brown, E.; Leary, J.; Scott, N.; Alsop, A.; Leach, M. Solar electric cooking in Africa: Where will the transition happen first? Energy Res. Soc. Sci. 2018, 40, 257–272. [Google Scholar] [CrossRef]
  76. Dagnachew, A.G.; Hof, A.F.; Lucas, P.L.; van Vuuren, D.P. Scenario analysis for promoting clean cooking in Sub-Saharan Africa: Costs and benefits. Energy 2020, 192, 116641. [Google Scholar] [CrossRef]
  77. Facebook Connectivity Lab and Center for International Earth Science Information Network—CIESIN—Columbia University High Resolution Settlement Layer (HRSL). Source Imagery for HRSL©. 2016 DigitalGlobe. Available online: https://www.ciesin.columbia.edu/data/hrsl/ (accessed on 24 June 2021).
Figure 1. Nyagatare District. © Google Map. © d-maps.com.
Energies 14 04093 g001
Figure 2. Basic profile in the design of the National Electrification Plan (NEP) in Rwanda. (REG, 2019).
Energies 14 04093 g002
Figure 3. Electric cooking demand for the Complete Scenario for 1, 5, 10, and 50 households.
Energies 14 04093 g003
Figure 4. Distribution of grid extensions (blue), microgrids (green), and isolated systems (red) in Nyagatare and a framed area for the Basic Scenario (a,d), Stacking Scenario (b,e), and Complete Scenario (c,f).
Energies 14 04093 g004
Figure 5. Cost per kWh by electrification mode in the Basic Scenario, Stacking Scenario, and Complete Scenario with microgrids, isolated systems, and grid extensions.
Energies 14 04093 g005
Figure 6. Total and partial costs of cooking with electricity in the Stacking Scenario and Complete Scenario with grid extension, microgrids, and isolated systems.
Energies 14 04093 g006
Figure 7. Annual GHG emissions in the Complete Scenario, Basic Scenario, and Stacking Scenario with different fuels.
Energies 14 04093 g007
Figure 8. kWh cost for microgrids, isolated systems and grid extensions, for a PV equipment cost reduction of 10% and 20%.
Energies 14 04093 g008
Figure 9. Distribution of grid extensions (blue), microgrids (green), and isolated systems (red) in the Basic Scenario (a), Stacking Scenario (b), and Complete Scenario (c) with National Electrification Plan basic package.
Energies 14 04093 g009
Table 1. Average cost and consumption of cooking appliances and stoves.
LPG Single BurnerCharcoal StoveWood StoveEnergy-Efficient Electric Appliance
Cost (USD)4522.522.575
Lifetime (years)5225
Annual cost (USD)9.011.311.315
Consumption as sole source
(kWh/day or Kg/day)
0.281.753.52
Consumption in Stacking Sc. (kWh/day or Kg/day)0.140.8751.750.7
Table 2. GWP-100 (IPCC), fraction of Non-Renewable Biomass (fNRB) [65], emission factors for LPG [29], and common SSA charcoal stoves, firewood stoves, and kiln process [23], in grams of emissions per kg of fuel burned.
GWP100LPGCharcoalFirewoodCharcoal Kiln
CO2 3085233515191800
fNRB 1 100.00%58.45%58.45%58.45%
CO2 non- renewable130851364.8887.91052.1
CO1.915.00192.570.00225.00
CH4280.0510.23.9044.60
BC4600.010.071.905.47
CO2eq 3120204820045245
1. Rwanda average for low and high productivity variant, considering biomass from deforestation and afforestation.
Table 3. Fraction of households and cost per kWh by electrification mode in the Basic Scenario, Stacking Scenario and Complete Scenario.
ScenariosFraction of HouseholdsHH’s Total Cost per kWh (USD/kWh)
MicrogridsIsolated SystemsGrid ExtensionsMicrogridsIsolated SystemsGrid ExtensionsAverage
Basic Sc.3.66%4.01%92.33%0.4780.5930.2910.310
Stacking Sc.2.21%1.54%96.25%0.3930.4920.2480.255
Complete Sc.2.74%0.94%96.32%0.3270.4130.2140.219
Table 4. Annual HH cost for electricity and cooking, breakeven price for LPG, charcoal, and firewood. All values are in US dollars.
Cost of ElectricityTotal and Partial Costs of Cooking with ElectricityBreakeven Price
TotalFor Basic ServicesFor CookingElectricity Cost in Basic Sc.Additional Cost *Appliances CostElectricity and Appliances CostLPGCharcoalFirewood
Grid ExtensionStacking Sc.153.7090.4163.29106.2147.4915.0062.491.050.160.08
Complete Sc.234.6978.23156.46106.21128.4830.00158.481.370.210.11
MicrogridsStacking Sc.244.11143.59100.52174.4369.6815.0084.681.480.230.10
Complete Sc.358.47119.49238.98174.43184.0430.00214.041.920.300.13
Isolated SystemsStacking Sc.305.54179.73125.81216.4889.0615.00104.061.860.290.13
Complete Sc.452.57150.86301.71216.48236.0930.00266.092.430.380.17
* Additional cost refers to the difference in electricity cost compared to the Basic Scenario.
Table 5. Total annual cost for Nyagatare District electrification for all customers, households, and non-households.
ScenariosAll CustomersHousehold CustomersNon-HH Customers
MicrogridsIsolated SystemsGrid ExtensionsTotalTotalTotal
Basic Sc,513,662 657,450 9697,502 10,868,613 8406,912 2461,701
Stacking Sc.407,696 347,214 13,145,682 13,900,591 11,744,338 2156,253
Complete Sc.733,959 316,966 18,730,646 19,781,572 17,845,445 1936,127
Table 6. Annual GHG emissions in the Complete Scenario, Basic Scenario, and Stacking Scenario with different fuels.
Energy Consumption% Grid Connected HHGHG Emissions per HH (kg CO2eq/year)GHG Emissions in Nyagatare (t CO2eq/year)
Electricity (kWh/year)Fuel (kg/year)From ElectricityFrom FuelTotalIncluding Charcoal Production
Elec.Complete Sc.1095.0 - 92.33% 414.5 - 449.0 449.0 33,334
LPGBasic Sc. 365.0 102.2 96.32% 144.1 318.8 468.5 468.5 34,782
Stacking Sc. 620.5 51.1 96.2% 244.9 159.4 413.8 413.8 30,725
CharcoalBasic Sc. 365.0 638.8 96.3% 144.1 1308.4 1452.5 4802.5 356,577
Stacking Sc. 620.5 319.4 96.2% 244.9 654.2 899.1 2574.0 191,118
FirewoodBasic Sc. 365.0 1277.5 96.3% 144.1 2560.2 2704.3 2704.3 200,790
Stacking Sc. 620.5 638.8 96.2% 244.9 1280.1 1524.9 1524.9 113,224
Table 7. Wood and non-renewable biomass consumption from firewood and charcoal production.
Wood ConsumptionNon-Renewable Biomass
Per HH
(Kg/year)
For Nyagatare
(t/year)
Per HH
(Kg/year)
For Nyagatare
(t/year)
CharcoalBasic Sc. 3193.8 1866.7 237,129.6 138,602
Stacking Sc. 1596.9 933.4 118,564.8 69,301
FirewoodBasic Sc. 1277.5 746.7 94,851.8 55,441
Stacking Sc. 638.8 373.3 47,425.9 27,720
Table 8. Fraction of households and kWh cost for microgrids, isolated systems, and grid extensions, for a grid cost of 0.09 USD/kWh, 0.12 USD/kWh and 0.06 USD/kWh.
ScenarioGrid CostFraction of HouseholdskWh Cost (USD)
USD/kWhMicrogridsIsolated SystemsGrid ExtensionsMicrogridsIsolated SystemsGrid ExtensionsAverage
Basic Sc.0.093.66%4.01%92.33%0.4780.5970.2910.310
0.128.20%4.94%86.86%0.4530.5970.3150.340
0.061.19%2.56%96.25%0.4790.5970.2670.278
Stacking Sc.0.092.21%1.54%96.25%0.3930.4940.2480.255
0.127.96%2.95%89.09%0.3870.4940.2710.287
0.061.70%1.23%97.07%0.3930.4940.2170.223
Complete Sc.0.092.74%0.94%96.32%0.3270.4090.2140.219
0.127.07%1.55%91.38%0.3260.4090.2430.252
0.060.83%0.39%98.78%0.3380.4090.1850.187
Table 9. Fraction of households and kWh cost for microgrids, isolated systems and grid extension, for a PV equipment cost reduction of 10% and 20%.
ER Cost ReductionFraction of CustomersHH’s Total Cost per kWh (USD/kWh)
%MicrogridsIsolated SystemsGrid ExtensionsMicrogridsIsolated SystemsGrid ExtensionsAver.
Basic Sc.0%3.66%4.01%92.33%0.4780.5970.2910.310
−10%6.26%5.06%88.68%0.4490.5610.2840.308
−20%16.82%6.93%76.25%0.3940.5320.2700.309
Stacking Sc.0%2.21%1.54%96.25%0.3930.4940.2480.255
−10%6.51%2.72%90.77%0.3670.4610.2410.255
−20%13.29%3.91%82.80%0.3310.4300.2330.254
Complete Sc.0%2.74%0.94%96.32%0.3270.4090.2140.219
−10%3.72%1.14%95.15%0.3070.3870.2130.219
−20%10.32%1.95%87.74%0.2780.3560.2070.217
Table 10. Fraction of households and cost per kWh by electrification mode in the Basic Scenario, Stacking Scenario, and Complete Scenario with a basic package of 1 kWh and using the NEP basic package.
Basic Pack.Fraction of CustomersHH’s Total Cost per kWh (USD/kWh)
MicrogridsIsolated SystemsGrid ExtensionsMicrogridsIsolated SystemsGrid ExtensionsAverage
Basic Sc.1 kWh 3.66%4.01%92.33%0.4780.5930.2910.310
NEP 13.96%8.93%77.11%0.9592.8230.5500.810
Stacking Sc.1 kWh 2.21%1.54%96.25%0.3930.4920.2480.255
NEP 12.38%4.15%83.47%0.5050.7650.3180.359
Complete Sc.1 kWh 2.74%0.94%96.32%0.3270.4130.2140.219
NEP 4.47%1.43%94.10%0.3720.4860.2490.258
Table 11. Total annual cost for Nyagatare District electrification for all customers, households, and non-households with a basic package of 1 kWh and using the National Electrification Plan basic package.
Basic PackageMicrogridsIsolated SystemsGrid ExtensionsTotalHousehold CustomersNon-HH Customers
Basic Sc.1 kWh513,662 657,450 9,697,502 10,868,613 8,406,912 2,461,701
NEP904,282 1,045,292 6,128,391 8,077,965 4,512,670 3,565,295
Stacking Sc.1 kWh407,696 347,214 13,145,682 13,900,591 11,744,338 2,156,253
NEP1,596,983 731,233 9,078,421 11,406,636 8,825,401 2,581,235
Complete Sc.1 kWh733,959 316,966 18,730,646 19,781,572 17,845,445 1,936,127
NEP996,180 417,405 16,149,374 17,562,959 15,446,649 2,116,310
Publisher’s Note: MDPI stays neutral with regard to jurisdictional claims in published maps and institutional affiliations.

