1. Introduction
Today, injections are becoming increasingly important in mining and civil works, both on the surface and under it. The injection of a ground involves the introduction of a fluid mixture into the ground, which subsequently sets and hardens. The objective is to reduce its degree of permeability and/or improve its mechanical conditions. In fact, there are more and more works where the first objective of the injection treatment is waterproofing. In such cases, the identification of the need for treatment requires studies to clearly state the problem to be solved and determine its theoretical evolution in the event that no treatment is carried out.
At present, there is a large body of research worldwide, whose objective is to develop laboratory-scale tests to try to predict the injectability of a grout in grounds or fractures.
In this respect, work such as that of [
1] is noteworthy, whose test consists of two plexiglass discs, 50 cm in diameter, joined by bolts to fix a joint opening or a clamping tension, through which the grout is injected. On a larger scale is the test developed by [
2], which simulates fractures of 4 m length, 2 m width, and 5 mm opening. In 2018, ref. [
3] published a comparative work between analytical models of penetrability and small-scale tests on joints made of glass. The results indicate that grout penetration at openings of 125 μm and 200 μm is verified at up to 40% of the maximum theoretical penetration length. The weaknesses of these investigations are the scale of the work and the non-consideration of parameters such as roughness and anisotropy of the joint or the in-situ stress state of the ground.
In 2015, ref. [
4] published two interesting papers on ground injection, and in the same year, ref. [
5] used the results of laboratory-scale tests to calibrate the parameters of an empirical model of injectability.
Regarding the different theoretical models of injectability, there are numerous recent efforts, highlighting the analytical models of [
6,
7,
8,
9] for polymeric grouts, the numerical models of [
10,
11], or the physical model of [
12].
In 2018, ref. [
13] used artificial intelligence models trained with laboratory tests of microcement grouting as a predictive tool. Again, the extrapolation of results to a real scale (sample size and stress state) is the weak point of this work.
On the other hand, ref. [
14,
15,
16,
17] test different compositions from the point of view of their rheology and strength.
Therefore, it can be said that injection study has focused on small- and medium-scale tests. In this work, the use of cement-based grouts is presented to solve a real-scale problem: The supply of water from a channel close to the basement floors of a recently built building.
Initially, a drilling campaign was carried out to determine the characteristics of the rock mass crossed by the excavation. Then, and due to the water flowing in from the edge of the excavation, a study of permeability was carried out through four new boreholes S-1, S-2, S-3, and S-4. This study reflects the necessity of develop a waterproofing screen. For that, two injection boreholes (EY-1, EY-2) and eight control boreholes (T-1, T-2, T-3 and T-4 around EY-1 and T-5, T-6, T-7 and T-8 around EY-2) were made. Different cement and micro-cement grouts were injected into the injection boreholes and their behaviour was analysed through the control boreholes. To complete this analysis, an innovative study in 3D of the radius of influence of the injection was developed where the effect of the joints was considered.
The result of the study is the construction of one waterproofing screen of a total of 78 boreholes of 21 m depth and 52 boreholes of 10 m depth, divided into three types of treatment according to the stratification.
2. Description of the Problem
The study area is located on the left bank (northeast) of the Bilbao estuary in northern Spain. It is an old dock that still preserves vestiges of the port activity that took place in the Nervión river basin during the second half of the 20th century. The Deusto Channel is, in reality, an artificial arm, with a northwest-southeast direction, built between the 50′s and 70′s that formed the island of Zorrotzaurre. It was almost entirely excavated in rock, up to a depth of 7 to 10 m, and it is delimited by cyclopean concrete walls.
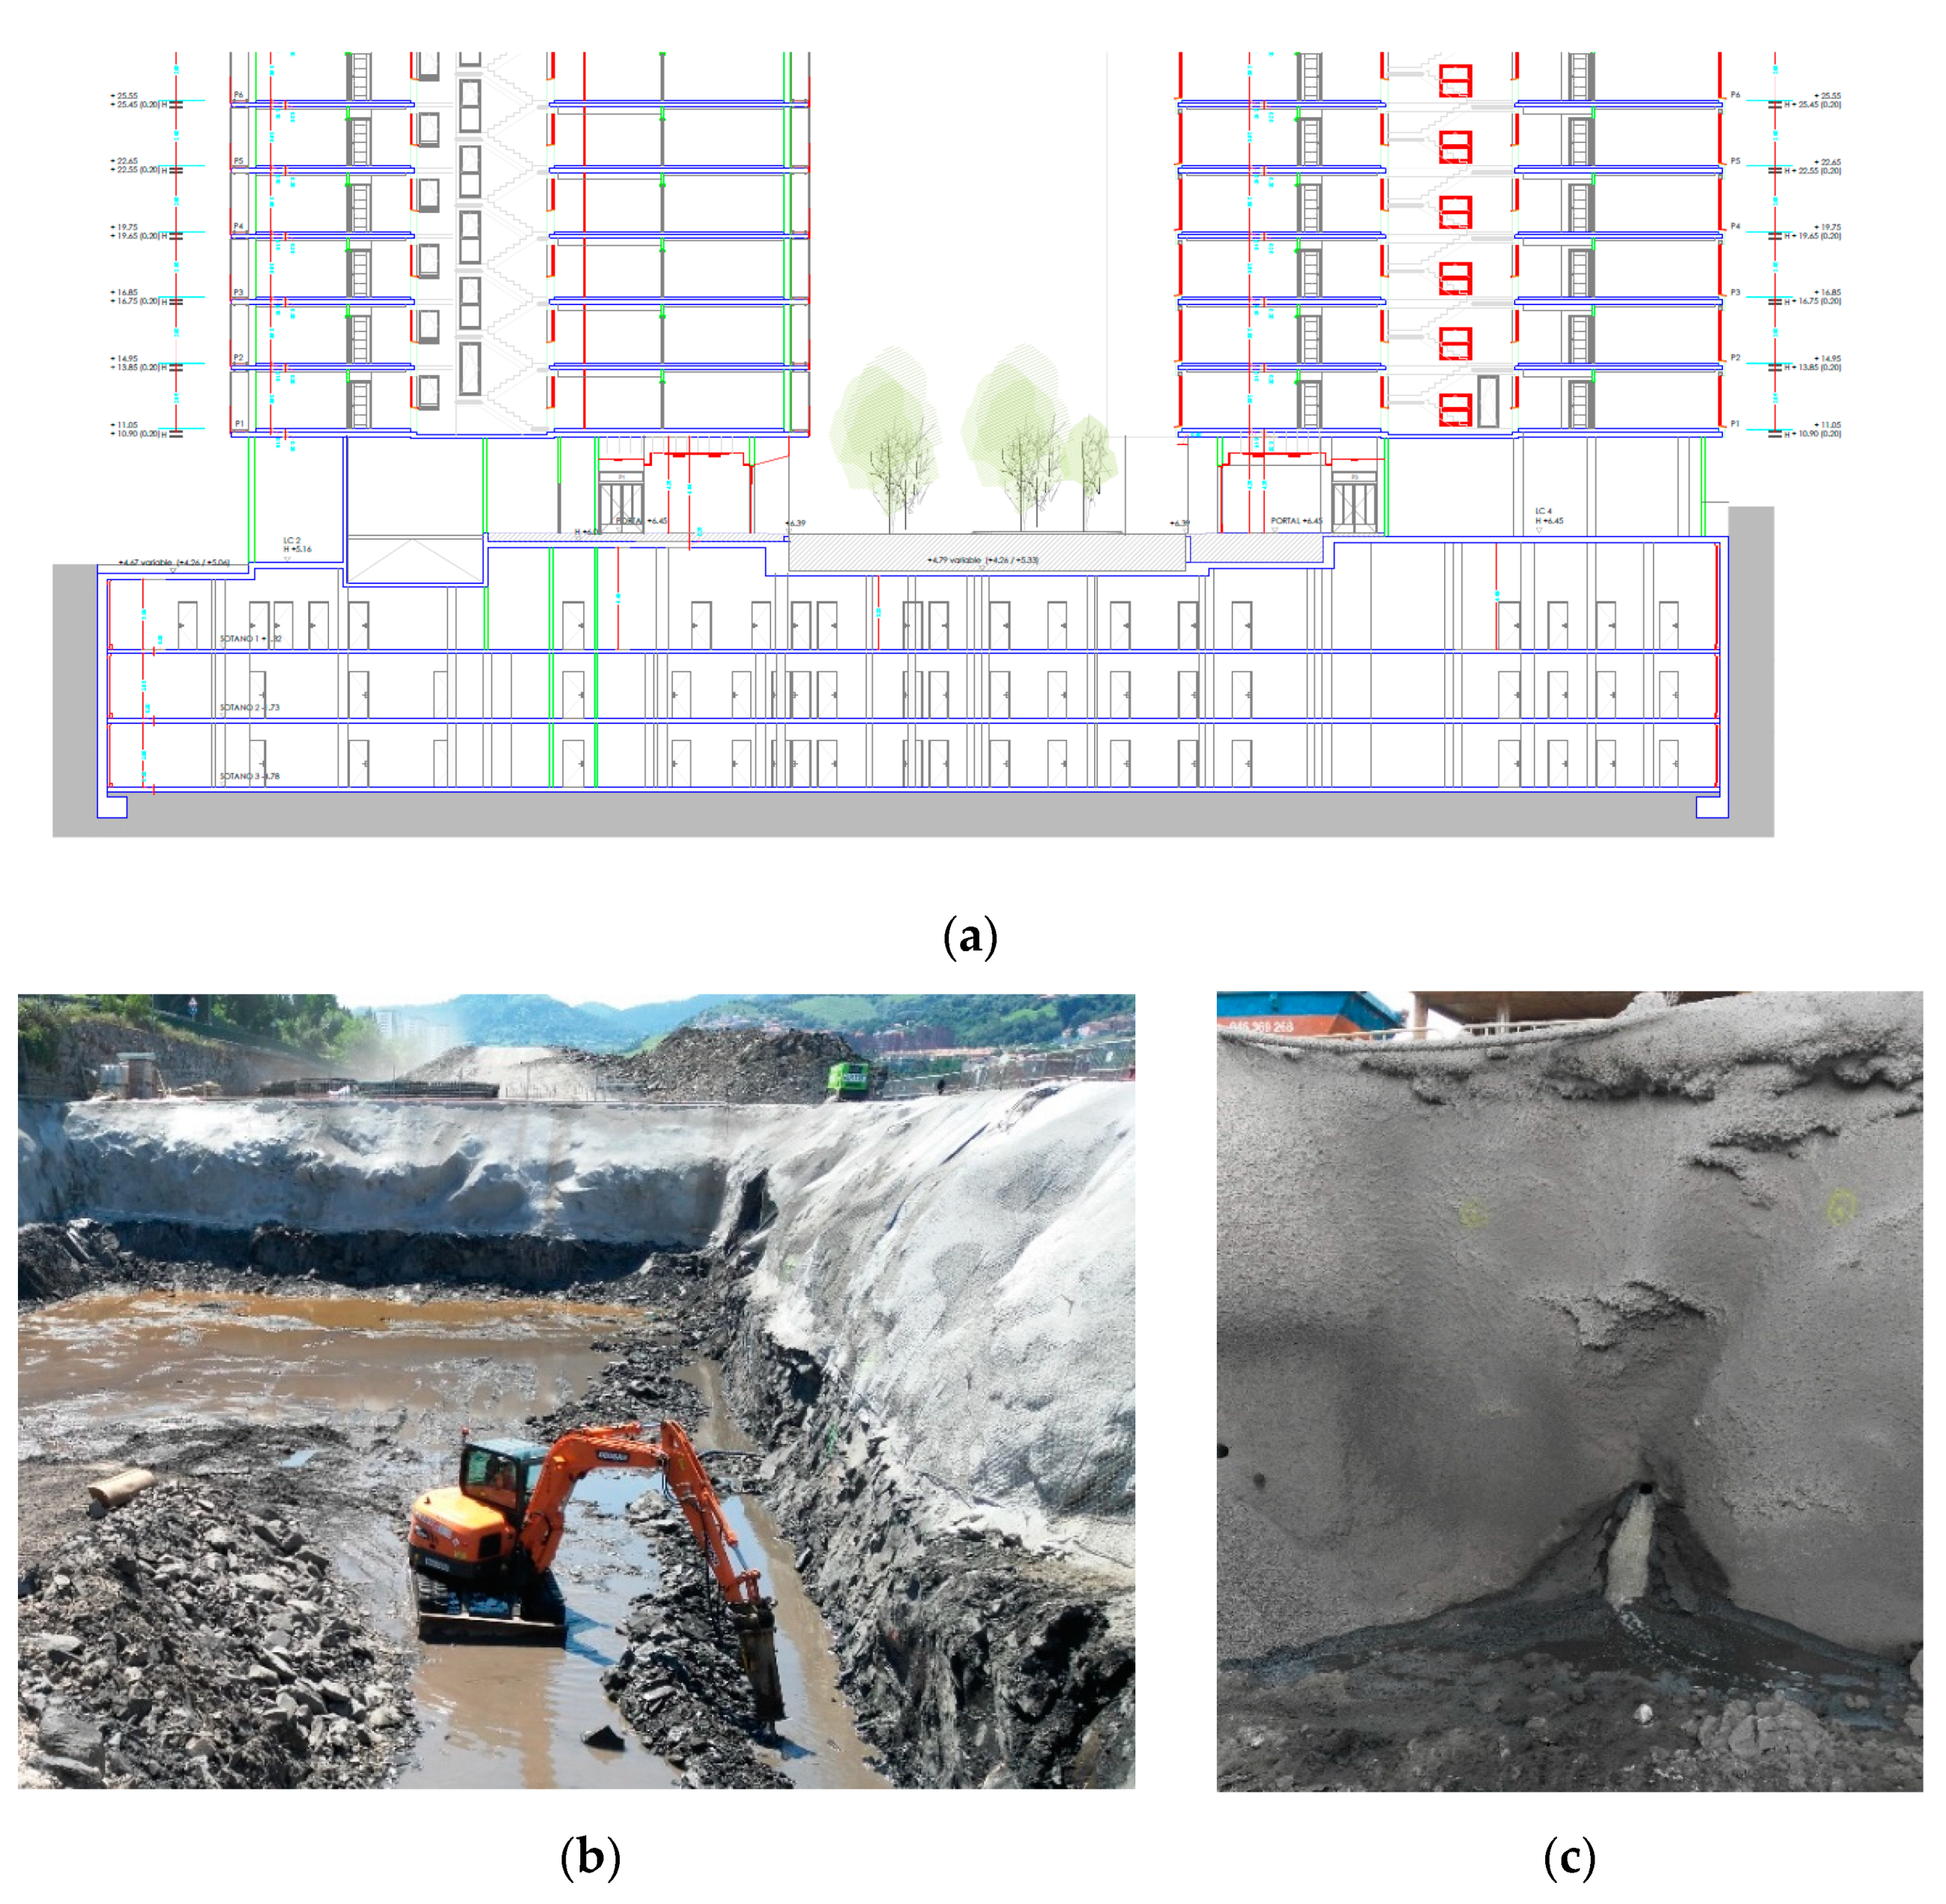
In an area close to the channel, the construction of two housing blocks with three basement floors begins. During the emptying of the site for the construction of the basement floors, there is a significant inflow of water from the Deusto Channel. The rectangular plot, 72 m long and 31 m wide, is parallel to the Channel, which is located about 20 m away. The depth of excavation is 8.4 m and the lowest level is −4.8 m.
Figure 1 shows the typology of the excavated rock, of shaly type, in which the permeability is associated with fracturing.
Once the structure of the basement floors has been built, the inflow of water through the drains under the third basement floor forces the installation of a pumping system with an average daily flow of 250 m3/day, and with values of up to 400 m3/day on rainy days.
Due to this situation, the injection of grout through boreholes to form a waterproofing screen between the Deusto Channel and the basements is analysed as a possible solution.
3. Methodology
Initially, a drilling campaign was carried out to determine the characteristics of the rock mass crossed by the excavation. However, the water flowing in from the edge of the excavation closest to the Deusto Channel required a more exhaustive study through of a new campaign of in situ tests. The results show the need to create a waterproofing screen that is designed following the Gusftanson injection process [
18].
3.1. Recognition of the Rock Mass
Below the anthropic fills that cover the area (between 0.8 and 1.5 m thick), the materials belong to the Lower Cretaceous. They are series of grey, leafy calcareous shale-siltstones with occasional sandstone.
Four core boreholes were drilled to a depth of 15 m and the reconnaissance was completed with the analysis of the excavation slopes. The characteristics of the rock mass are shown in
Table 1.
The maximum height of the piezometric level is between 0.0 and 1.5 m at high tide and can drop to −1.8 m at low tide. The initial permeability given to this type of materials is of the order of 7.3 × 10⁻⁶ m/s. However, once the basin has been emptied, there is a significant contribution from the edge closest to the Deusto Channel. This fact shows the need for a more in-depth study, so a new campaign of in situ tests was carried out.
3.2. New In Situ Testing Campaign
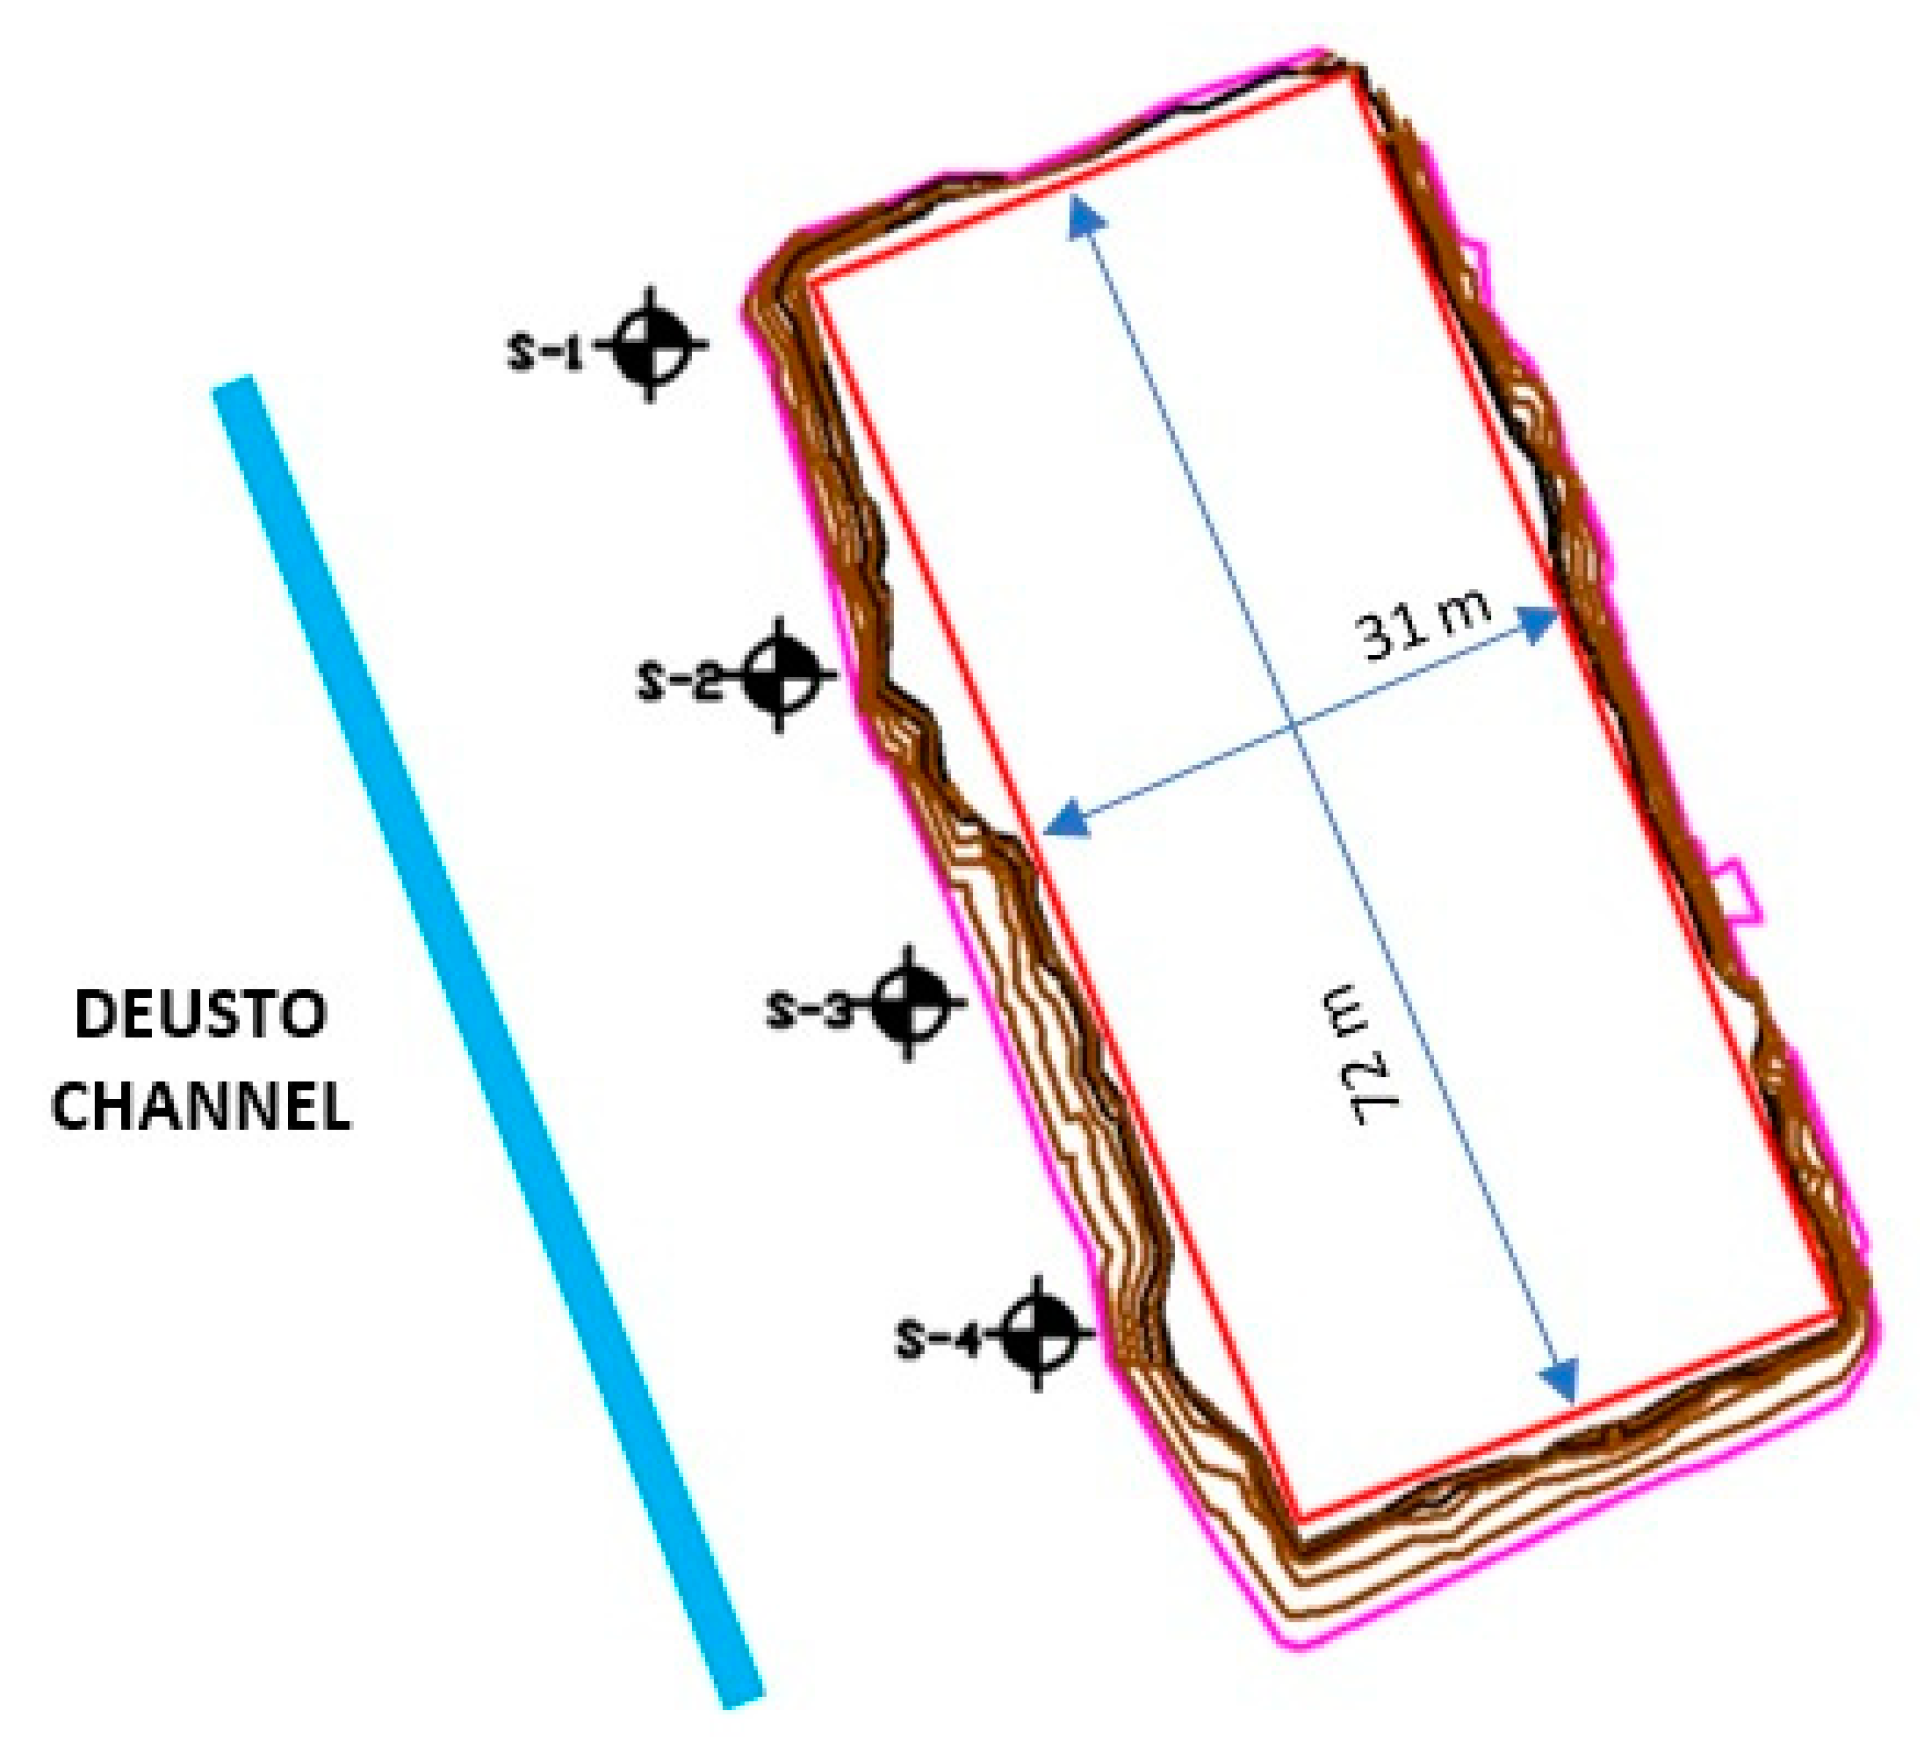
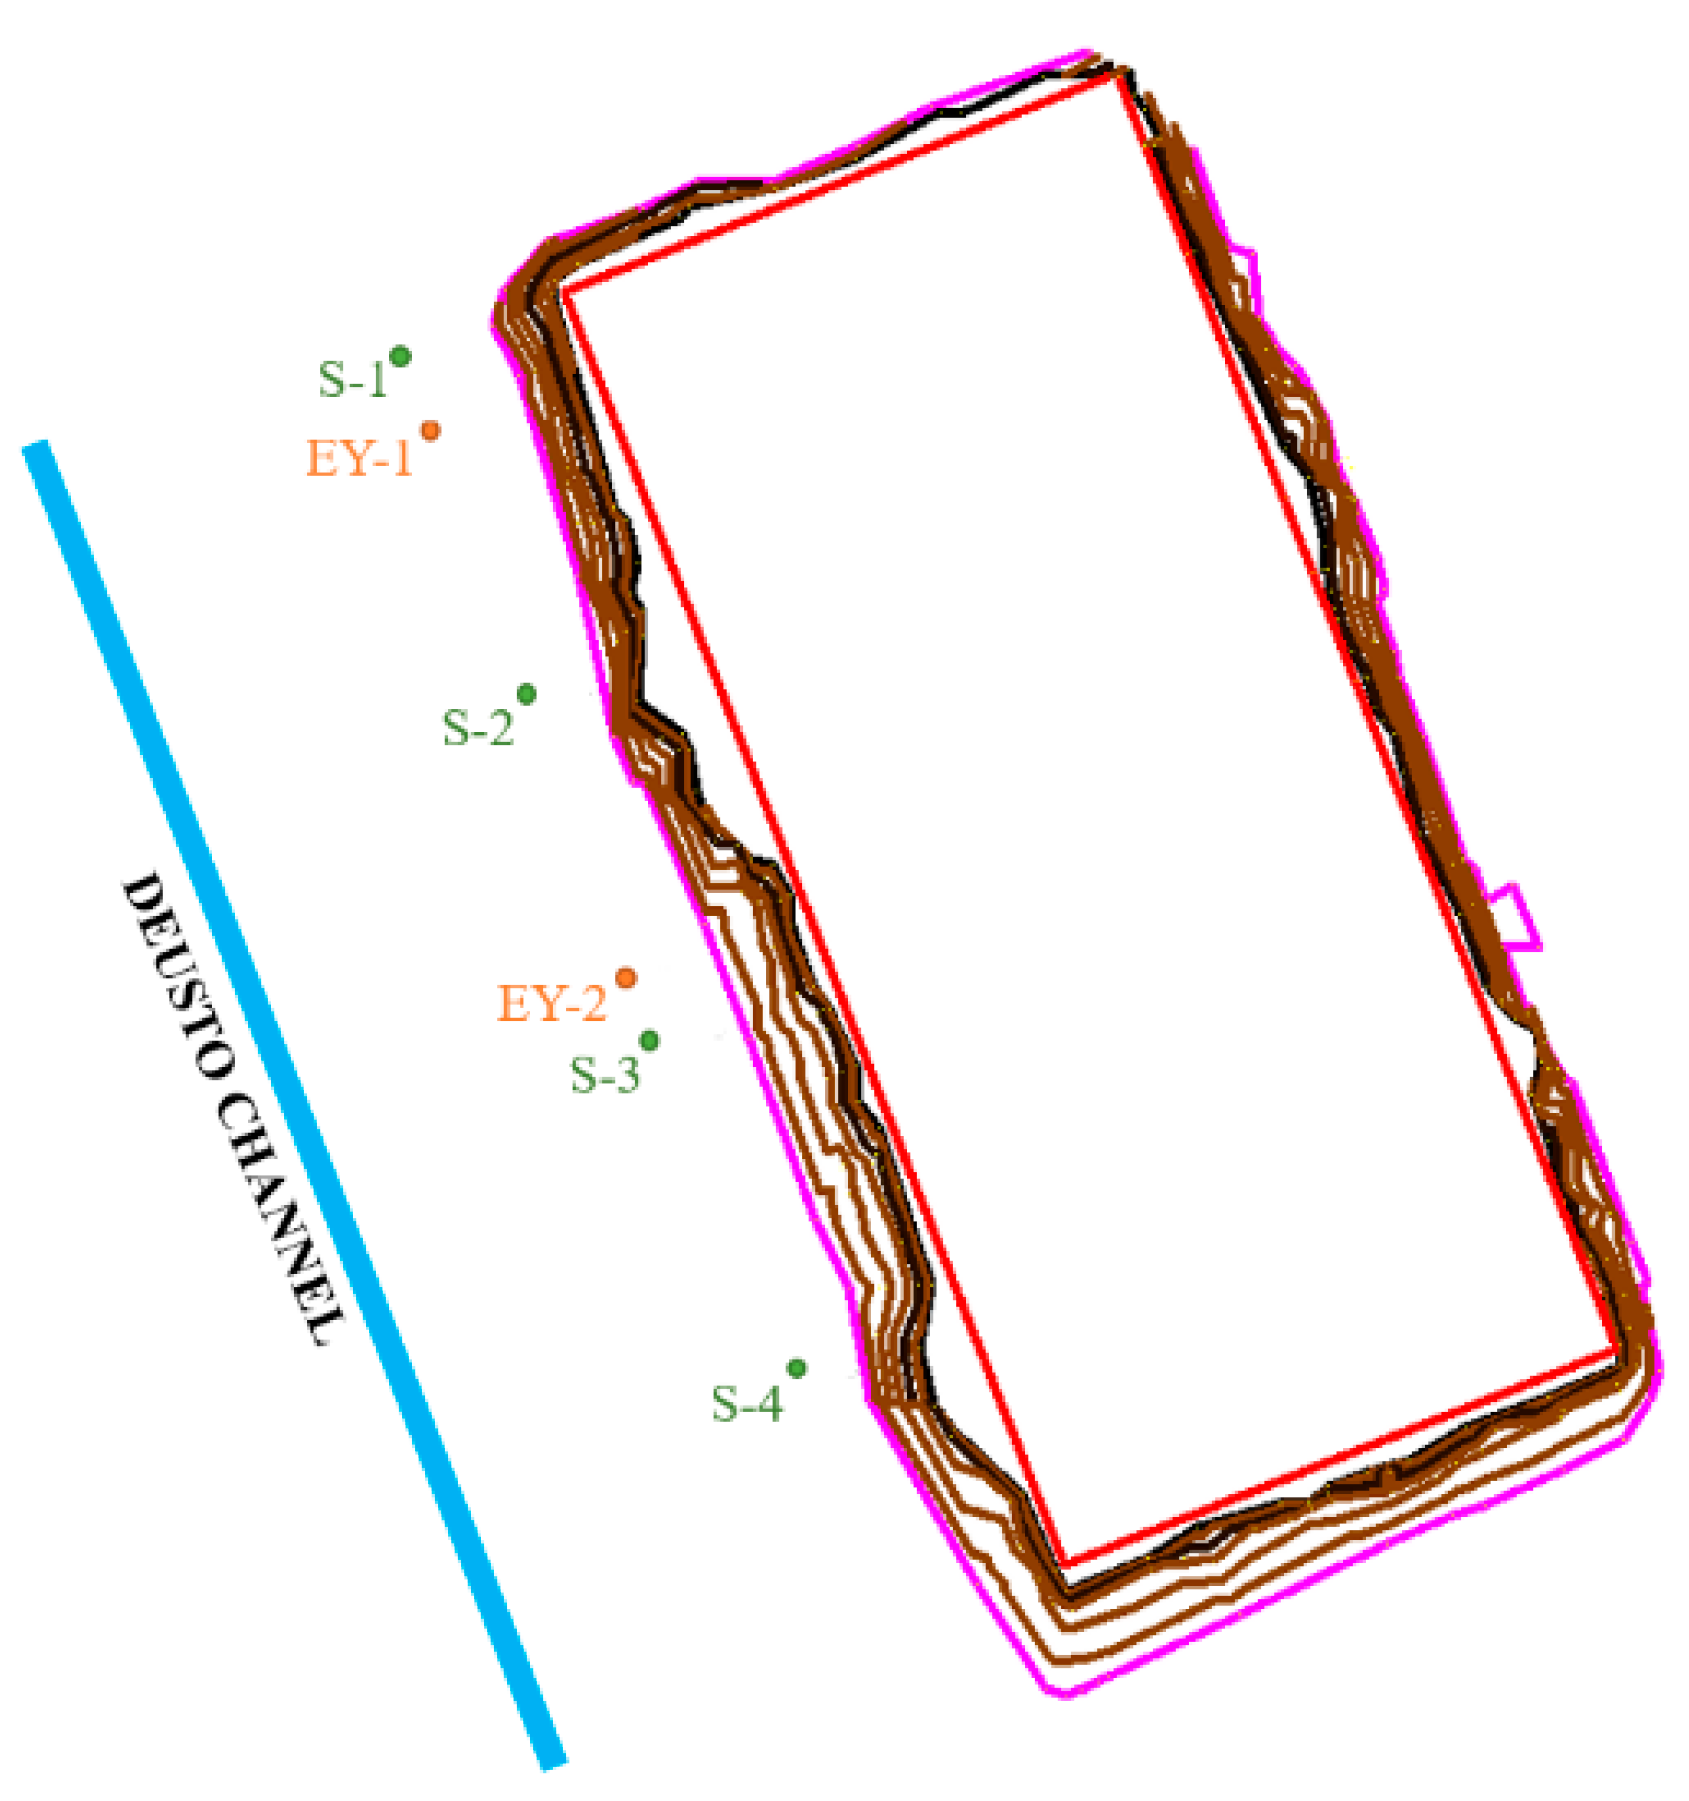
Four boreholes of 21 m of depth were drilled. They have a distance of about 18 m between them and are along the SW edge of the plot (
Figure 2). The length of the boreholes will serve as a support when defining the depth of a possible waterproofing screen.
Table 2 summarises the main characteristics of the ground crossed by the new boreholes.
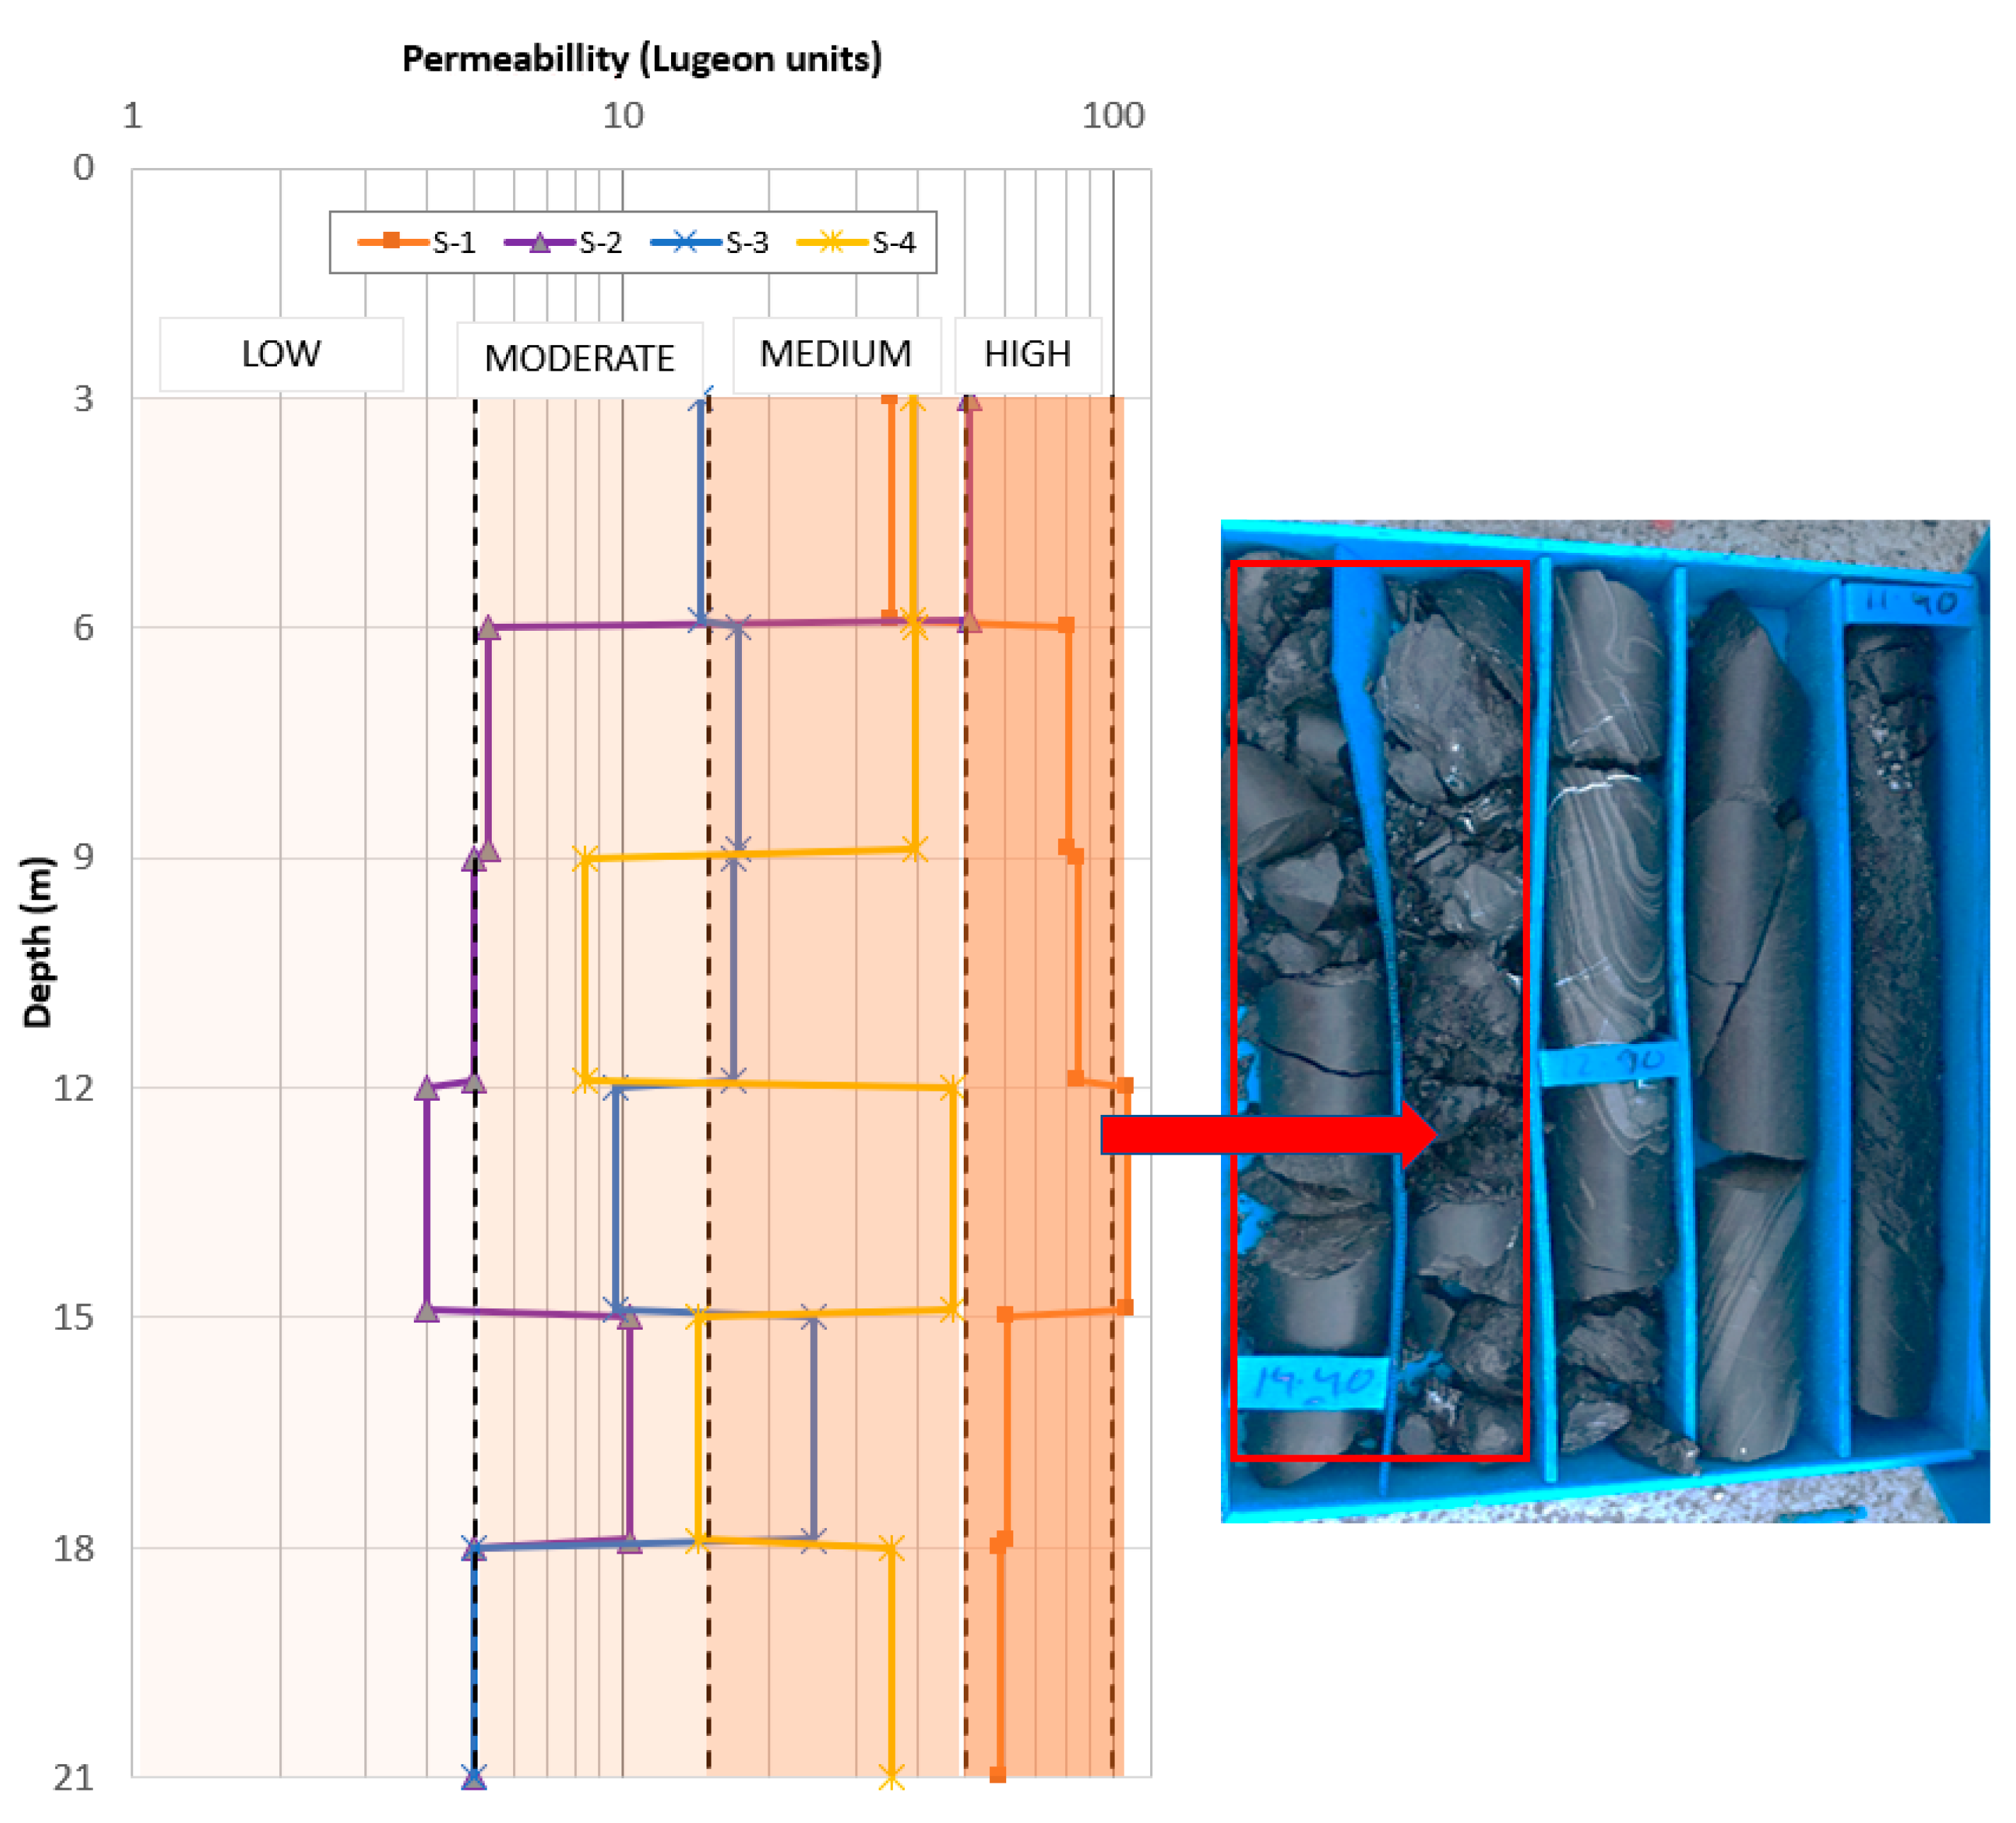
During the drilling of the boreholes, Lugeon [
19] permeability tests were carried out in 3-metre sections and with 5 load steps, i.e., 6 tests per borehole. The tests were carried out in sections, without repeatability, because the injection of pressurised water can modify the condition of the joints. Therefore, there is no standard deviation data. Their results, with a precision of 1UL, can be seen in
Figure 3.
In no case were pressures of 1 MPa reached during the tests, and the maximum was 0.5 MPa. According to the characterisation of discontinuities based on the Lugeon test [
20,
21,
22] and
Figure 3, the boreholes S-2 and S-3 present closed or partially open joints. However, S-4 has some open joints and S-1 has many open joints, making them the most problematic boreholes.
Averaging all the values obtained in the tests, there is a rock mass with a permeability of 33 UL (unit of Lugeon), that is, of the medium type. However, the section between 12 and 15 m depth of S-1 reaches 105 UL of permeability. This high value is associated with an intensely fractured section, between 13.0 and 14.3 m of depth (
Figure 3).
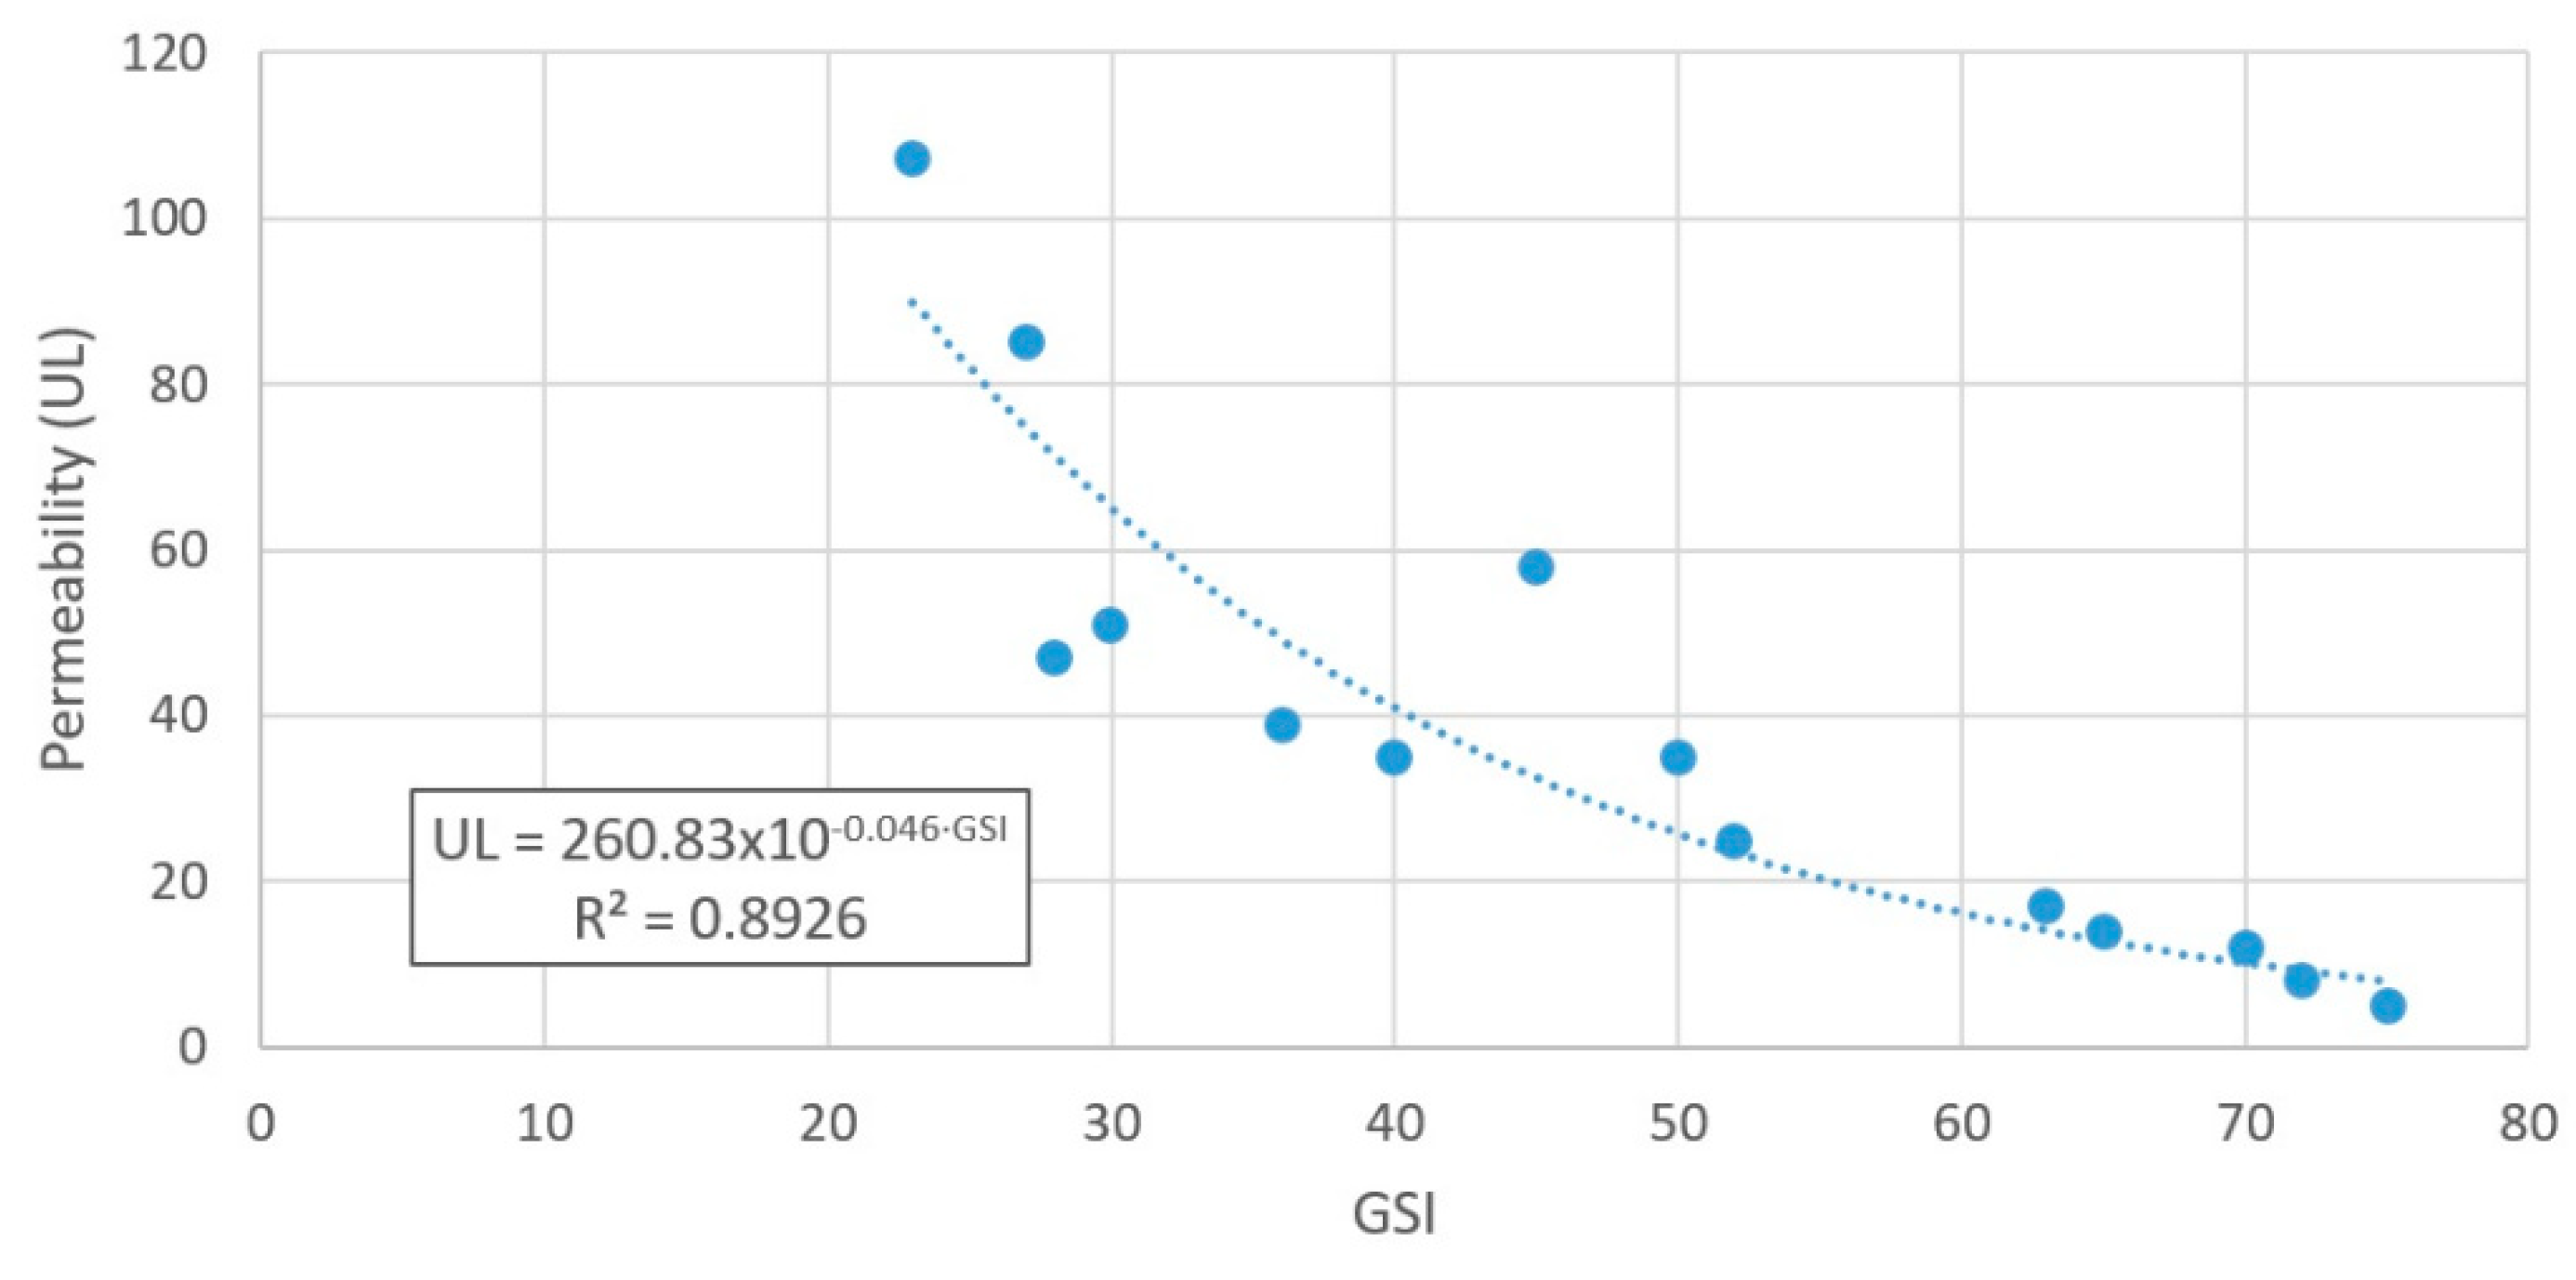
One of the big questions in this type of test is whether the permeability tests have been carried out correctly. To verify these data, the in situ permeability and the quality of the rock mass are often compared [
21,
22].
Figure 4 shows the correlation between GSI (
Table 2) and the permeability (
Figure 3) for the four boreholes. It shows a good correlation between the two parameters, being very good with high GSI values.
3.3. Design of the Waterproofing Screen
The analysis of the rock mass, together with the new in situ test campaign, shows the need to construct a waterproofing screen. For its design, the injection process adapted from Gustafson [
18] was followed, dividing the work into three large blocks: Analysis of the boreholes, selection of the material to be injected, and study of the distribution of the penetration length through injection tests.
3.3.1. Analysis of the Boreholes
From the analysis of the borehole campaigns, the following can be deduced:
The area with the highest permeability is the area located in the corner of the basin, that is, the area around S-1 and S-4, with S-1 being particularly problematic. On the other hand, the central boreholes S-2 and S-3 show lower permeabilities. This circumstance invites the definition of different degrees or intensities in the treatment to be carried out.
The permeability observed in S-1 requires a treatment in phases that gradually reduces the water supply. The objective is to reduce the initial permeability to 50% at the beginning of each phase.
Injections must be carried out at low pressure, always below 1 MPa, in order to avoid damage to the environment.
In S-1 and S-4, there is a significant permeability between 12 and 15 m of depth. Even in S-1, a permeability of 60 UL is observed at around 21 m of depth. Therefore, although the construction reaches a depth of 8.4 m, the depth of the screen must be increased in order to prevent water below it.
In order to obtain in-situ parameters of the characteristics that the injections must have that allow reducing permeability, the execution of a test area was planned. The selection of this test area takes into account the reduction of permeability in phases:
In the environment of S-1, with “high” (50 to 100 UL) or “very high” (>100 UL) levels of permeability, the objective is to reach the “medium” level (15 to 50 UL) [
20,
21,
22].
In the environment of S-3 with a “medium” level of permeability, the objective is to reach the “moderate” level (5 to 15 UL) [
20,
21,
22].
With these objectives of reducing the permeability, two 76 mm diameter injection boreholes named EY-1 and EY-2 (
Figure 5) were made. EY-1 is located 1 m away from S-1 and has a depth of 21 m due to the high permeability in that environment and at that depth. EY-2 is located 1 m away from S-3 and has a depth of 15 m.
3.3.2. Selection of the Material to Be Injected
At the same time that the boreholes for the injection and/or permeability tests were being drilled, laboratory tests were carried out to characterise the two materials to be injected in the tests: A cement type CEM I-52.5 and a microcement type MCEM TP-12 in EY-2.
Density, bleeding, viscosity, and setting tests were carried out. The objective was to achieve a mixture with good workability, i.e., one that is easy to handle and inject without setting too quickly and that is capable of retaining water even when in contact with absorbent surfaces such as rock mass.
Density affects the pumpability of the mixture, whereby low density favours pumpability, but as density decreases, there is less retention of water in the mixture, known as bleeding or exudation. In bleeding, the aggregates become compacted, and the water tends to rise to the surface, creating a thin, weak, porous surface that has no strength and that can create tensile cracks when its evaporation is fast. Therefore, it is necessary to find a compromise between density and bleed. In general, injection mixtures can have up to 4% exudation by volume, although the water must be reabsorbed after 24 h [
23].
The viscosity or fluidity of the mixture defines the ability of the mixture to penetrate cavities in the ground. It is measured with the flow cone or Marsh cone [
24]. The method consists of filling the Marsh cone with 800 mL of grout and measuring the time it takes for 200 mL of grout to flow out through its 8 mm diameter nozzle. This time is related to the degree of consistency of the mixture, in such a way that a high outlet time indicates a mixture that is not very fluid and therefore difficult to pump.
The setting affects the handling time of the mixture since it reflects the moment in which the mixture changes from a fresh state to a hardened state. Two setting times were collected:
The initial setting or time from the moment the cement receives water until it begins to lose fluidity and its temperature rises.
The final set or the time until the mixture ceases to deform under relatively small loads and begins to harden and acquire its mechanical strength.
Table 3 shows the average value and the standard deviation of the density and the result of the Marsh cone test for three tests with each mixture. In the case of cement, the properties were analysed for different water/cement ratios.
3.3.3. Study of the Distribution of the Penetration Length with Injection Tests
Once the different mixtures had been characterized, it was decided to inject cement in EY-1 located in an environment with high permeability and large fractures and microcement in EY-2, in an environment of medium permeability with the presence of microfractures. In the first case, the water/cement ratio was varied depending on the injection depth in order to analyse its waterproofing capacity. In the second, a constant water/cement ratio was used, but the pumping pressure was varied depending on the depth, ensuring access to deep areas.
All the injection tests were carried out with a DOMINE PH 2 × 5 pump and a 2PI_GIN controller, which allowed the control and recording of 2 injection lines through two Siemens SITRANS F M MAG 5000/6000 electromagnetic flowmeters.
Borehole EY-1
As previously mentioned, in the injection tests, the objective is to reduce the permeability around S1, going from a high and/or very high permeability to a medium permeability. With this objective, EY-1 was carried out with a length of 21 m and located 1m from S-1.
In the borehole EY-1, 6 injection sections of 3 m in length were defined. The superficial section from 0 to 3 m was not injected as a protective massif. In the injection sections, different water/cement dosages were used, increasing the relationship as the depth increased. In addition, a maximum pressure stop criterion was established as a function of the quality of the rock mass following the recommendations of the US practice, which uses lower pressures than those used by the Swedish practice [
25,
26]. Although countries such as Norway and China prefer to work with higher pressures, a limitation in pressure reduces the risk of deformation and grout spillage.
Table 4 summaries the water/cement ratios, the maximum injection pressure selected for each section, the injected volume, the kg of cement used, and the injection time for each section. The precision of the measures was 0.5 L for the injected volume, 1 kg for the cement used, 1 s for the injection time, and 0.01 MPa for the final pressure.
The table shows that in the sections between 6 and 12 m, more volume of grout was injected, i.e., the injections were greater than in the sections between 12 and 21 m where the injection volume was low, and therefore the injection result was not positive.
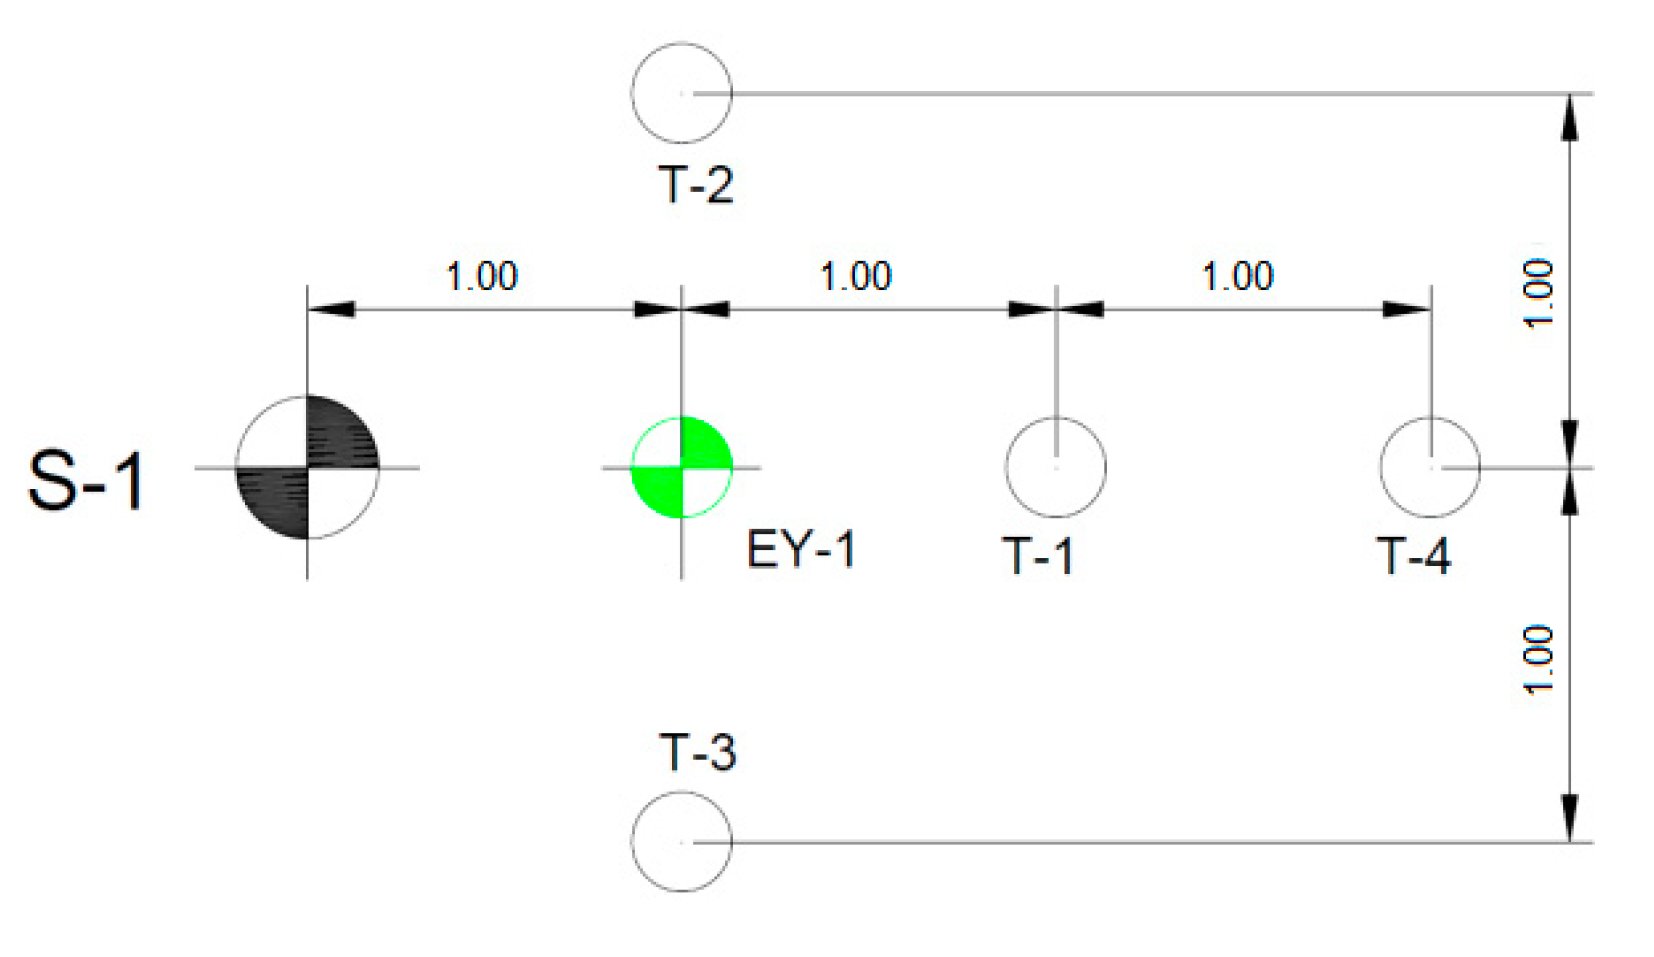
In order to check the extension of the injected grout, four control boreholes were drilled around EY-1. These boreholes are called T-1, T-2, T-3, and T-4, and all of them were 1 m away from EY-1 with the exception of T-4, which was 2 m away (
Figure 6).
The control boreholes were drilled 24 h after the injections and it is assumed that, given their proximity, the initial permeabilities in them are similar to those obtained in S-1. Although the possibility of drilling them prior to injection and measuring these permeabilities more objectively was considered, the idea was rejected because it was considered that such a concentration of boreholes in such a small space could alter the flow of fluids during the injection tests.
Once the control boreholes were drilled, permeability tests were carried out in both the control boreholes and the borehole S-1. The tests, each 3 m of length, allow to compare the results with the initial permeability, but as it has previously noticed, there is not repeatability in these tests.
Table 5 shows the results of the Lugeon tests before and after injection with a precision of 1UL.
Section from 3 to 6 m. No improvement was seen in S-1, located 1 m from EY-1, and there did not seem to be any influence on the permeability of the rest of the boreholes. Therefore, it can be said that the zone of influence of the injection was less than 1 m, considering that the boreholes were located at a distance of 1 m.
Section from 6 to 9 m. In the case of S-1, the influence of the treatment was clear, with a decrease in permeability from 82 to 41 UL. T-1 and T-4 show values of the same order as S-1 after injection, so it is coherent to assume that the improvement could also have extended to them. As for T-2 and T-3, the reduction was not so significant. In other words, there was a greater difficulty for the progress of grouting in that direction, that it is to say, there was a directionality in the flow of the grout.
Section from 9 to 12 m. Despite the fact that a considerable volume of grout was injected, in S-1 and T-2, no influence on the permeability value was observed. However, in the rest of the boreholes, a lower permeability value was observed.
Section from 12 to 15 m. No improvement in permeability was seen in S-1. The rest of the boreholes had much lower permeabilities, but all of the same order. Taking into account the small volume that was injected (34 litres), it does not seem plausible that the effect of the injection reached them and reduced the permeability so much. The values can be explained by a fault zone or karst conduit located in S-1, so a more realistic permeability for the section would be about 30 UL and it seems clear that the test in this case was not positive.
Section from 15 to 18 m. Despite the injected volume, no improvement in permeability was observed in S-1. On the other hand, improvements were observed in T-1, T-3, and T-4. However, the permeability values of T-4 in all its sections were lower than those of the rest of the boreholes and the values were much more homogeneous, which leads us to suspect that it has a different behaviour model.
Section from 18 to 21 m. The effect of the injection was detected mainly in T-1 and to a lesser extent in T-3, while T-4 showed a similar behaviour to the previous section.
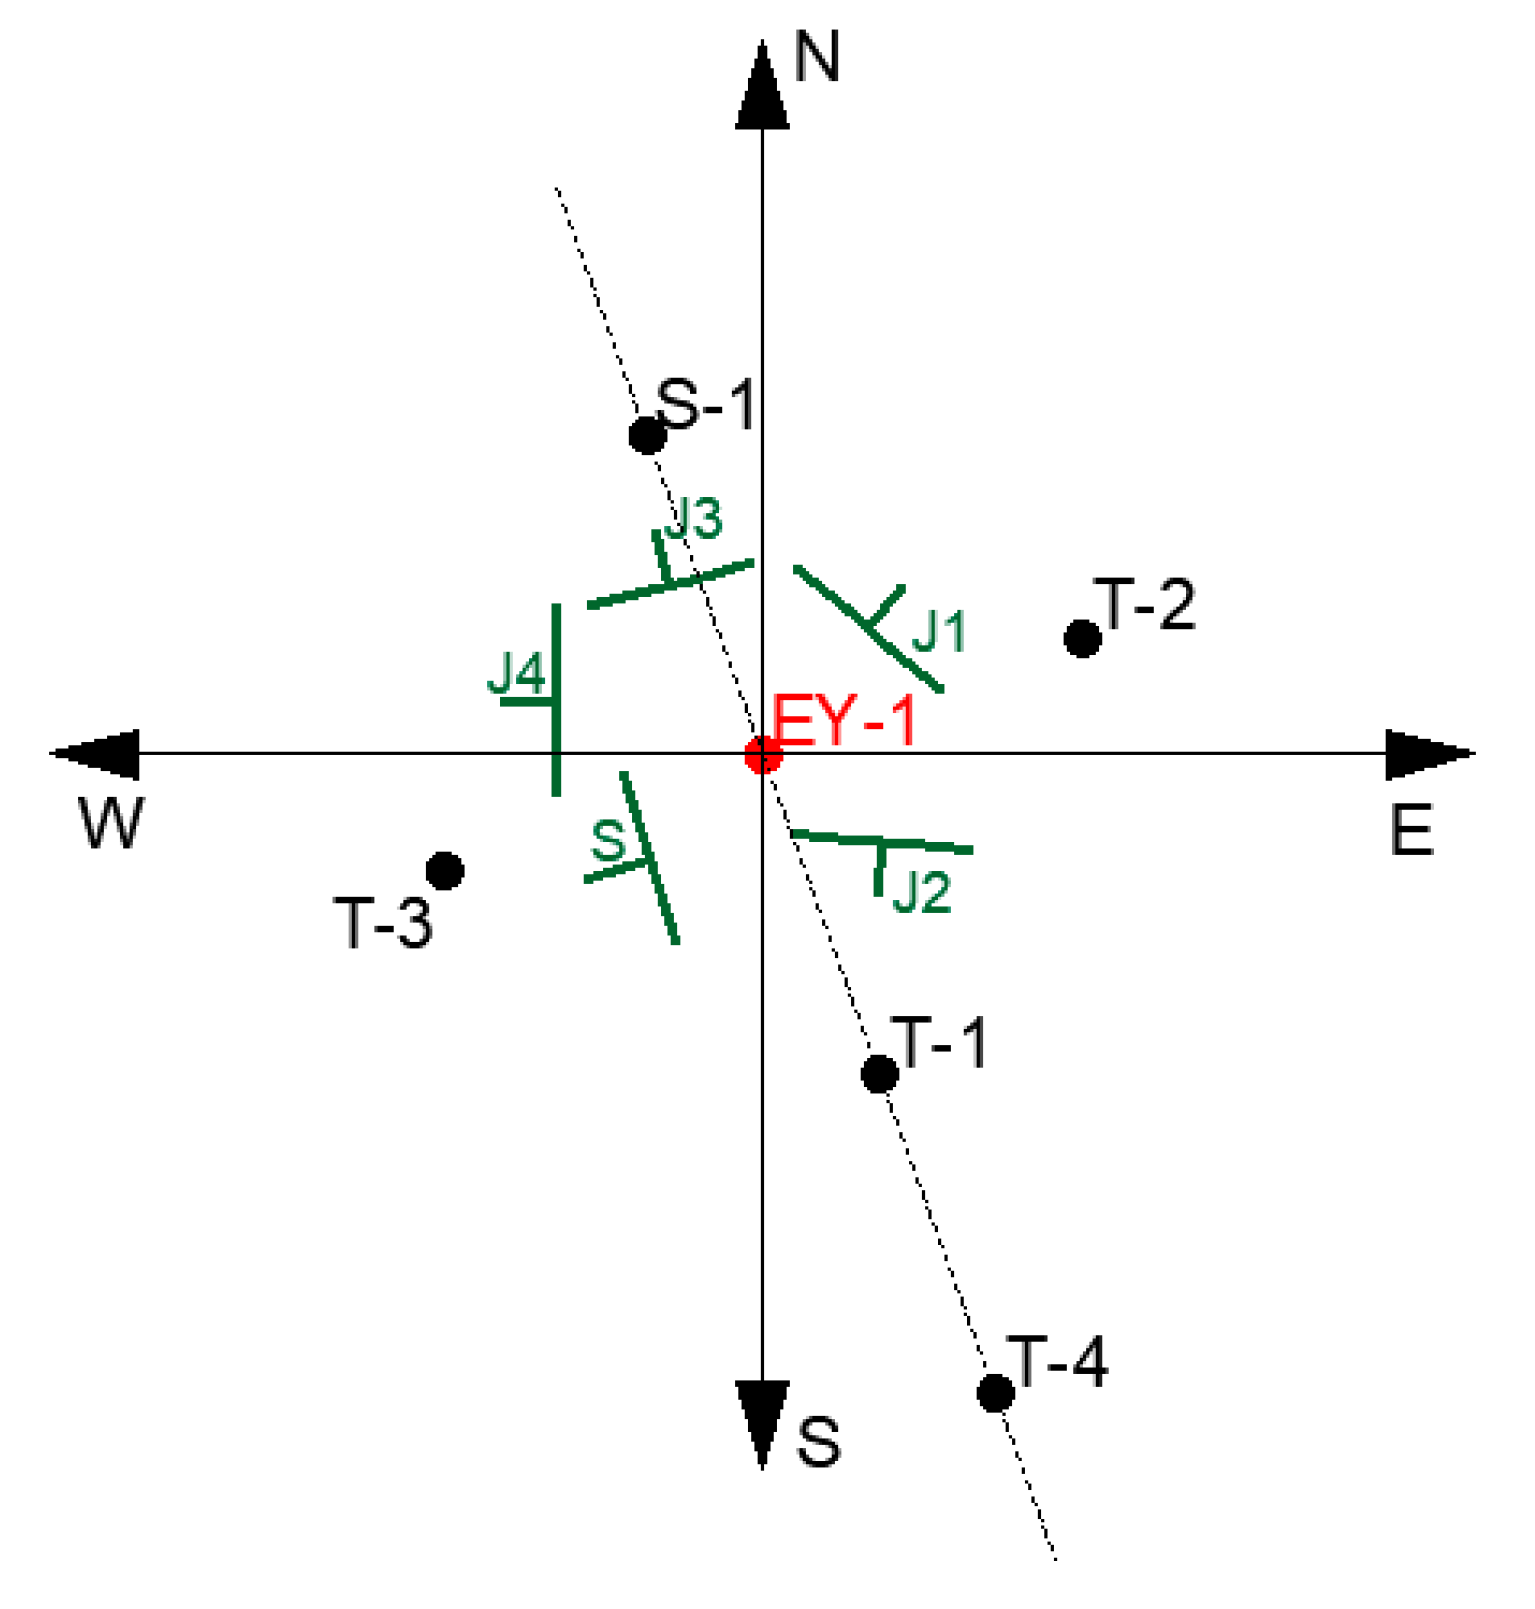
The results show that the radius of influence of the injection did not reduce the flow of water to the target level, mainly due to the fact that the pressure was very conservative. However, they also show an anisotropic distribution of the grout, which can be justified by analysing the influence of the five families of discontinuities around EY-1 on the movement of the grout.
Figure 7 shows that three of the five families (S, J2, J4) dipped to the south-southwest direction and affected T-1, while the rest of the families affected S-1. However, the effect on T-1 was greater, because one of the families that dipped to the south-southwest (S) was the stratification with the greatest presence and continuity in the area.
As for the T-3/T-2 direction, only one of the families of joints dipped directly towards T-2 (J1), while the rest of the joints affected T-3 to a greater or lesser extent, causing greater changes in its permeability values.
Borehole EY-2
EY-2 was located in the vicinity of S-3. With it, the end was to reduce the permeability of the environment from a level considered medium to a moderate level.
In this borehole, 15 m with 4 injection sections of 3 m of length were drilled and microcement was employed with the same water/microcement ratio equal to 0.6 but varied injection pressure, depending on the depth. In other words, the greater the depth, the greater the pressure. As in the previous case, a section from 0 to 3 m was left without injection, as a protective massif.
Table 6 shows, for each section, the injection pressures, the injected volume, the kg of microcement used, and the injection time (with a precision in the measures of 0.01 MPa for the pressure, 0.5 l for the injected volume, 1 kg for the microcement used, and 1 s for the injection time). It can be seen that in the last sections between 9 and 15 m, more volume of grout was injected, therefore the injections were higher than in the shallower sections.
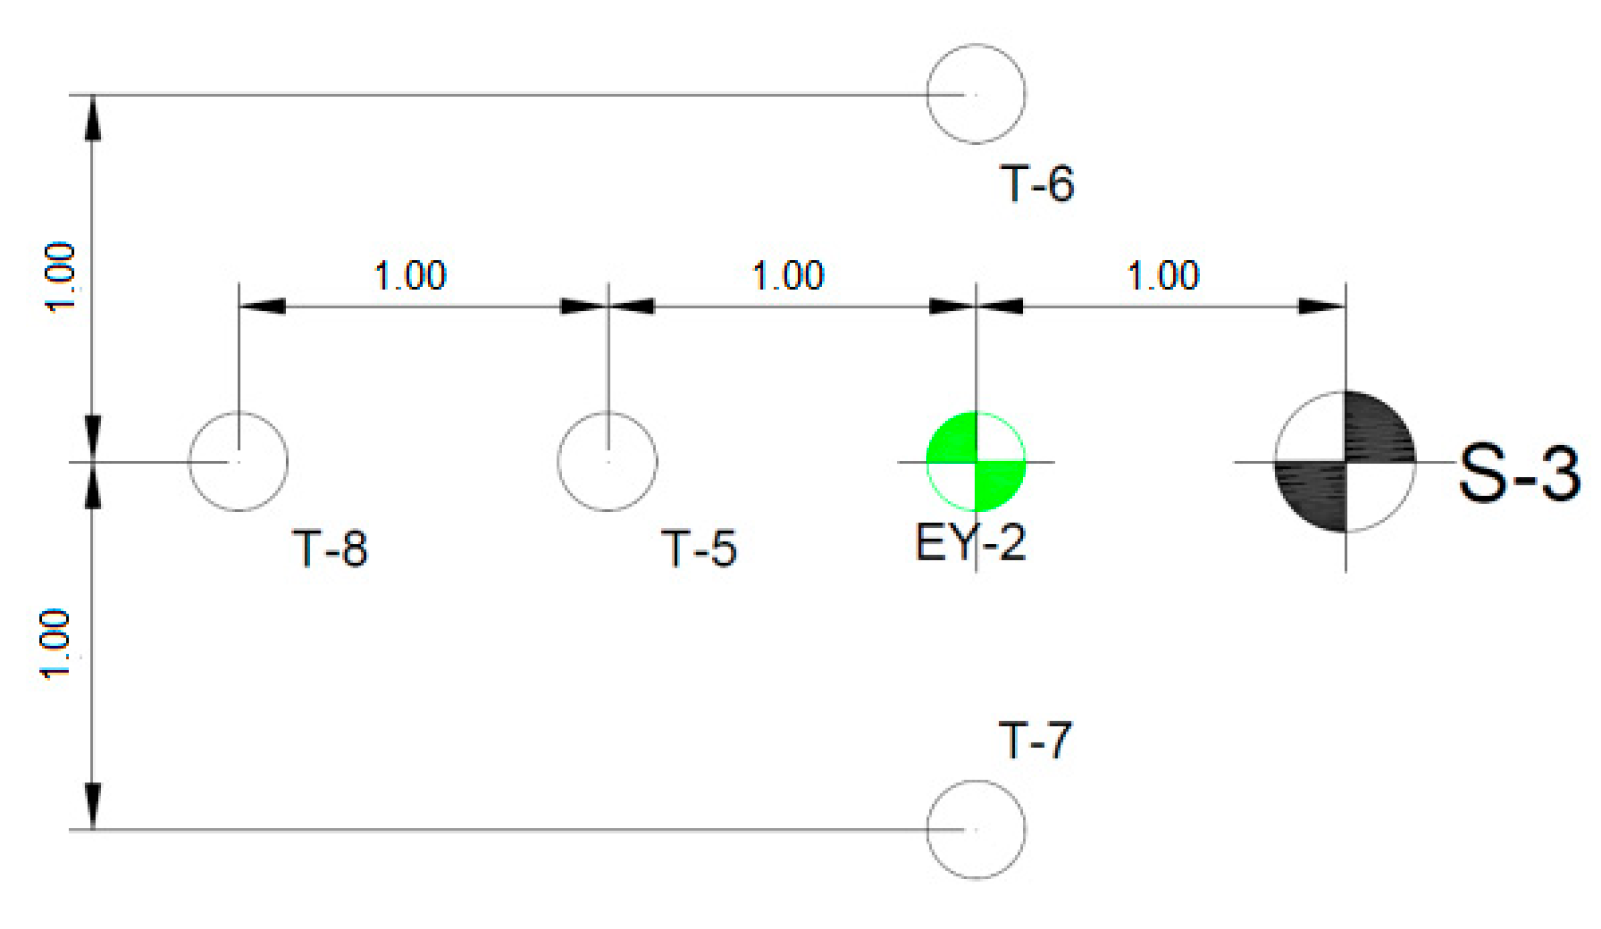
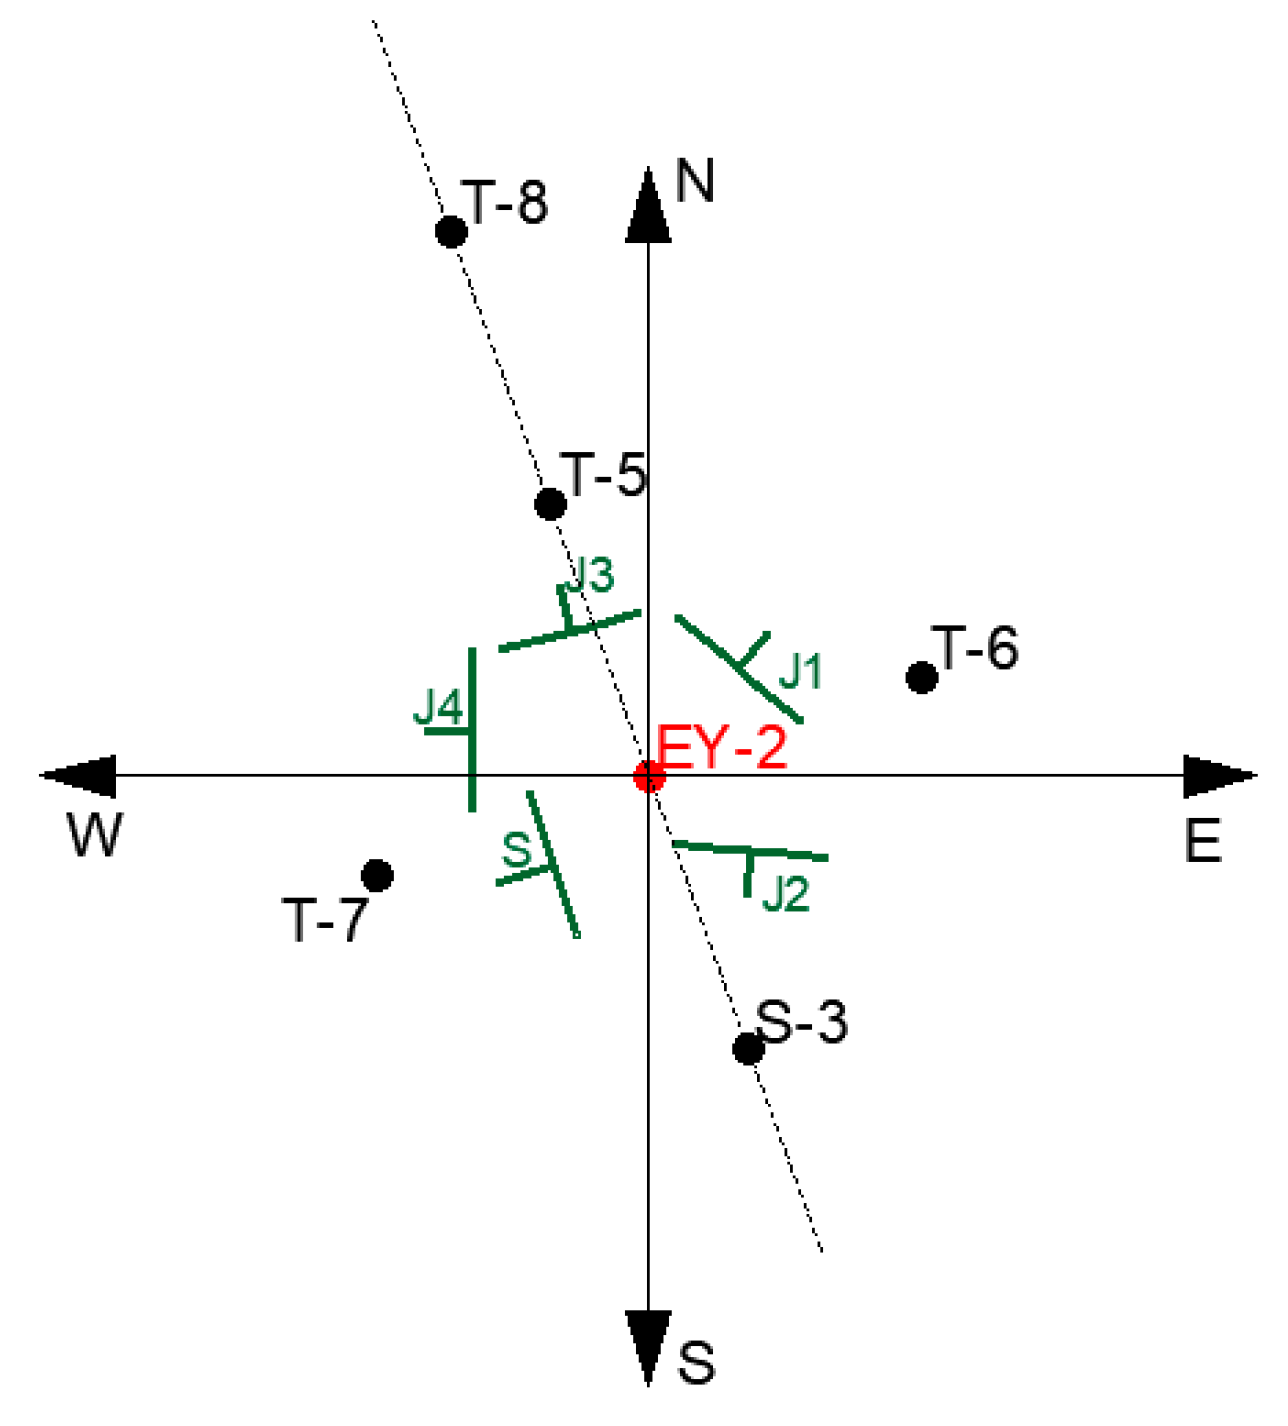
As in the previous case, 24 h after injection, four control boreholes were drilled around EY-2. They were called T-5, T-6, T-7, and T-8. These boreholes were located at a distance of 1 m from EY-2, with the exception of T-8, which was 2 m away (
Figure 8).
Once the control boreholes were drilled and considering that, initially, their permeability was similar to S-3, permeability tests were carried out in 3 m sections to compare the results with the initial permeability.
Table 7 shows the results of the Lugeon tests before and after injection.
Section from 3 to 6 m. No improvement was observed in S-3, located 1 m from EY-2. In the rest of the boreholes, the permeability presented similar or higher values than in S-3, so it did not seem that there was any type of influence on the permeability of these boreholes. It can be said that the zone of influence of the injection was less than 1m, considering that the boreholes were located at a distance of 1m.
Section from 6 to 9 m. In the case of S-3, there was also no appreciable improvement in the value of its permeability. However, a very significant drop was observed in T-6 to values of 3.9 UL. T-5 also shows a decrease in permeability to 16.6 UL, while in T-7 and T-8, the treatment did not cause changes in the behaviour of its permeability.
Section from 9 to 12 m. Although a considerable volume of grout was injected, there was only a significant change in the permeability value in T-5, which dropped to 8.3 UL.
Section from 12 to 15 m. All the boreholes show a reduction in the value of their permeability. S-3 has a value of 10 UL, thus reaching a moderate degree of permeability. As for the control boreholes, the greatest reduction in permeability was achieved in the T-5/T-8 axis.
As in the previous case, the proposed objective was not achieved. This is due, on the one hand, to the fact that the size of the fractures was greater than indicated for treatment with microcement and, on the other hand, because S-3 was affected by three families of joints (S, J2, J4) and T-5, T-8 by two families of joints (J1, J3) (
Figure 9).
The analysis on the perpendicular axis indicates that, although T-7 was affected by four families of joints (S, J2, J3, J4), its permeability remained fairly constant, as T-6, which was affected by only one family of joints (J1).
The low effect of microcement grouting on the permeability value was due to the fact that microcement grouting was able to close micro-fractures but did not fill fractured rock such as that in the upper sections of the borehole (
Table 1).
The decrease in permeability due to grout injection has been demonstrated in small and medium scale tests; however, the analyses carried out in this work show that on a real scale, this decrease is affected by the presence of joints and their orientation. Therefore, it is necessary to develop a new model that analyses the movement of the grout once it is injected into the ground, that is, the radius of influence of the injection both horizontally and vertically.
4. Analysis of the Radius of Influence of the Injection
The analysis of the fracturing and the dip indicates that the injection of grout undergoes both vertical and horizontal redistribution, causing different levels of affection on the control boreholes. The analysis of the maximum radius of influence at different depths allows to obtain the three-dimensional model of the grout distribution. The study was carried out in EY-1 and the injection of cement, due to the low results obtained with microcement.
Assuming that the injection is carried out homogeneously in each section, the volume of grout injected can be obtained from Equation (1).
where:
A is the injected area defined by Equation (2), where the diameter of the borehole has not been taken into account.
E is the current opening of the joint families or the part of the rock mass that can be injected.
For the calculation of the real opening, the model of Snow [
27] is taken into account. In it, the fractured rock mass is replaced by a cubic fracturing network with a constant average permeability and an equivalent hydraulic opening of the rock mass
e (
E ≈ e) that is a function of the permeability of the rock mass
L and the spacing
S between the parallel planes of the joint families Equation (3).
For
n families of joints, the volumetric index of joints
Jv or number of discontinuities per unit volume is defined by Equation (4), but at the same time, this index is related to the
RQD index by Equation (5) known as Palmstrom’s formula [
28].
Operating on Equations (2)–(5), and taking the value of the radius of influence out of Equation (1), Equation (6) is obtained
Therefore, with this simple model, it is possible to estimate the distance the grout reaches as a function of geotechnical data (RQD and Lugeon) and the volume of grout injected.
However, the radius of influence shown in
Table 8 does not take into account the distribution of the joint families, nor their dips, nor the orientation of the boreholes.
Taking into account the number of joint families that affect each borehole, and that S-1, T-1 and T-4 are oriented in a northwest–southeast direction and T-2 and T-3 in a northeast–southwest direction, it is possible to apply a correction factor to the radius of influence collected in
Table 8 and obtain the radii of influence according to the direction (
Table 9).
The columns named North, East, West, and South of
Table 9 show the values of the radii of influence, considering the orientation of the joint families. The rest of the columns show the radii of influence as a function of the orientation and the dip of the joint families. At this point, it is necessary to clarify that the dip has been considered as the average of the dips of the joint families that affect each control borehole and the borehole S-1.
The values shown in
Table 9 provide a three-dimensional view of the effect of the joints on the injection of cement. In all the boreholes, the horizontal component is the one that undergoes the greatest decrease with respect to the initial radius of influence.
Comparing the radii of influence (
Table 9) with the permeability values after injection (
Table 5), it is possible to say that:
In the direction of S-1, the greatest radius of influence is found in the section between 6 and 9 m, coinciding with the section where there is a drop in permeability. On the other hand, in the rest of the sections, the radius of influence is less than 1 m, which corresponds to no variation in the value of permeability.
In the direction of T-1/T-4, it can be observed that while the x component of the radius of influence only has a value greater than 1 m in the 6 to 9 m section, the z component exceeds this value, except for the 12 to 15 m section. Therefore, from 9 m, the permeability in these boreholes is mainly due to the vertical component, which allows the grout to descend and reduce the permeability. This fact corroborates the very different behaviour of these boreholes compared to the rest.
In T-2, it is observed that there is hardly any decrease in permeability, with the exception of the section between 12 and 15m. In this case, the radii of influence are always less than 1 m, so this decrease, together with the small volume of grout injected, confirms the theory put forward in the permeability study: The existence of a fault or karst conduit in S-1.
In T-3, vertical components of the radius of influence greater than unity are observed. This is confirmed by the decrease in the permeability values, with the exception of the section from 12 to 15 m, which shows a behaviour completely analogous to that of T-2.
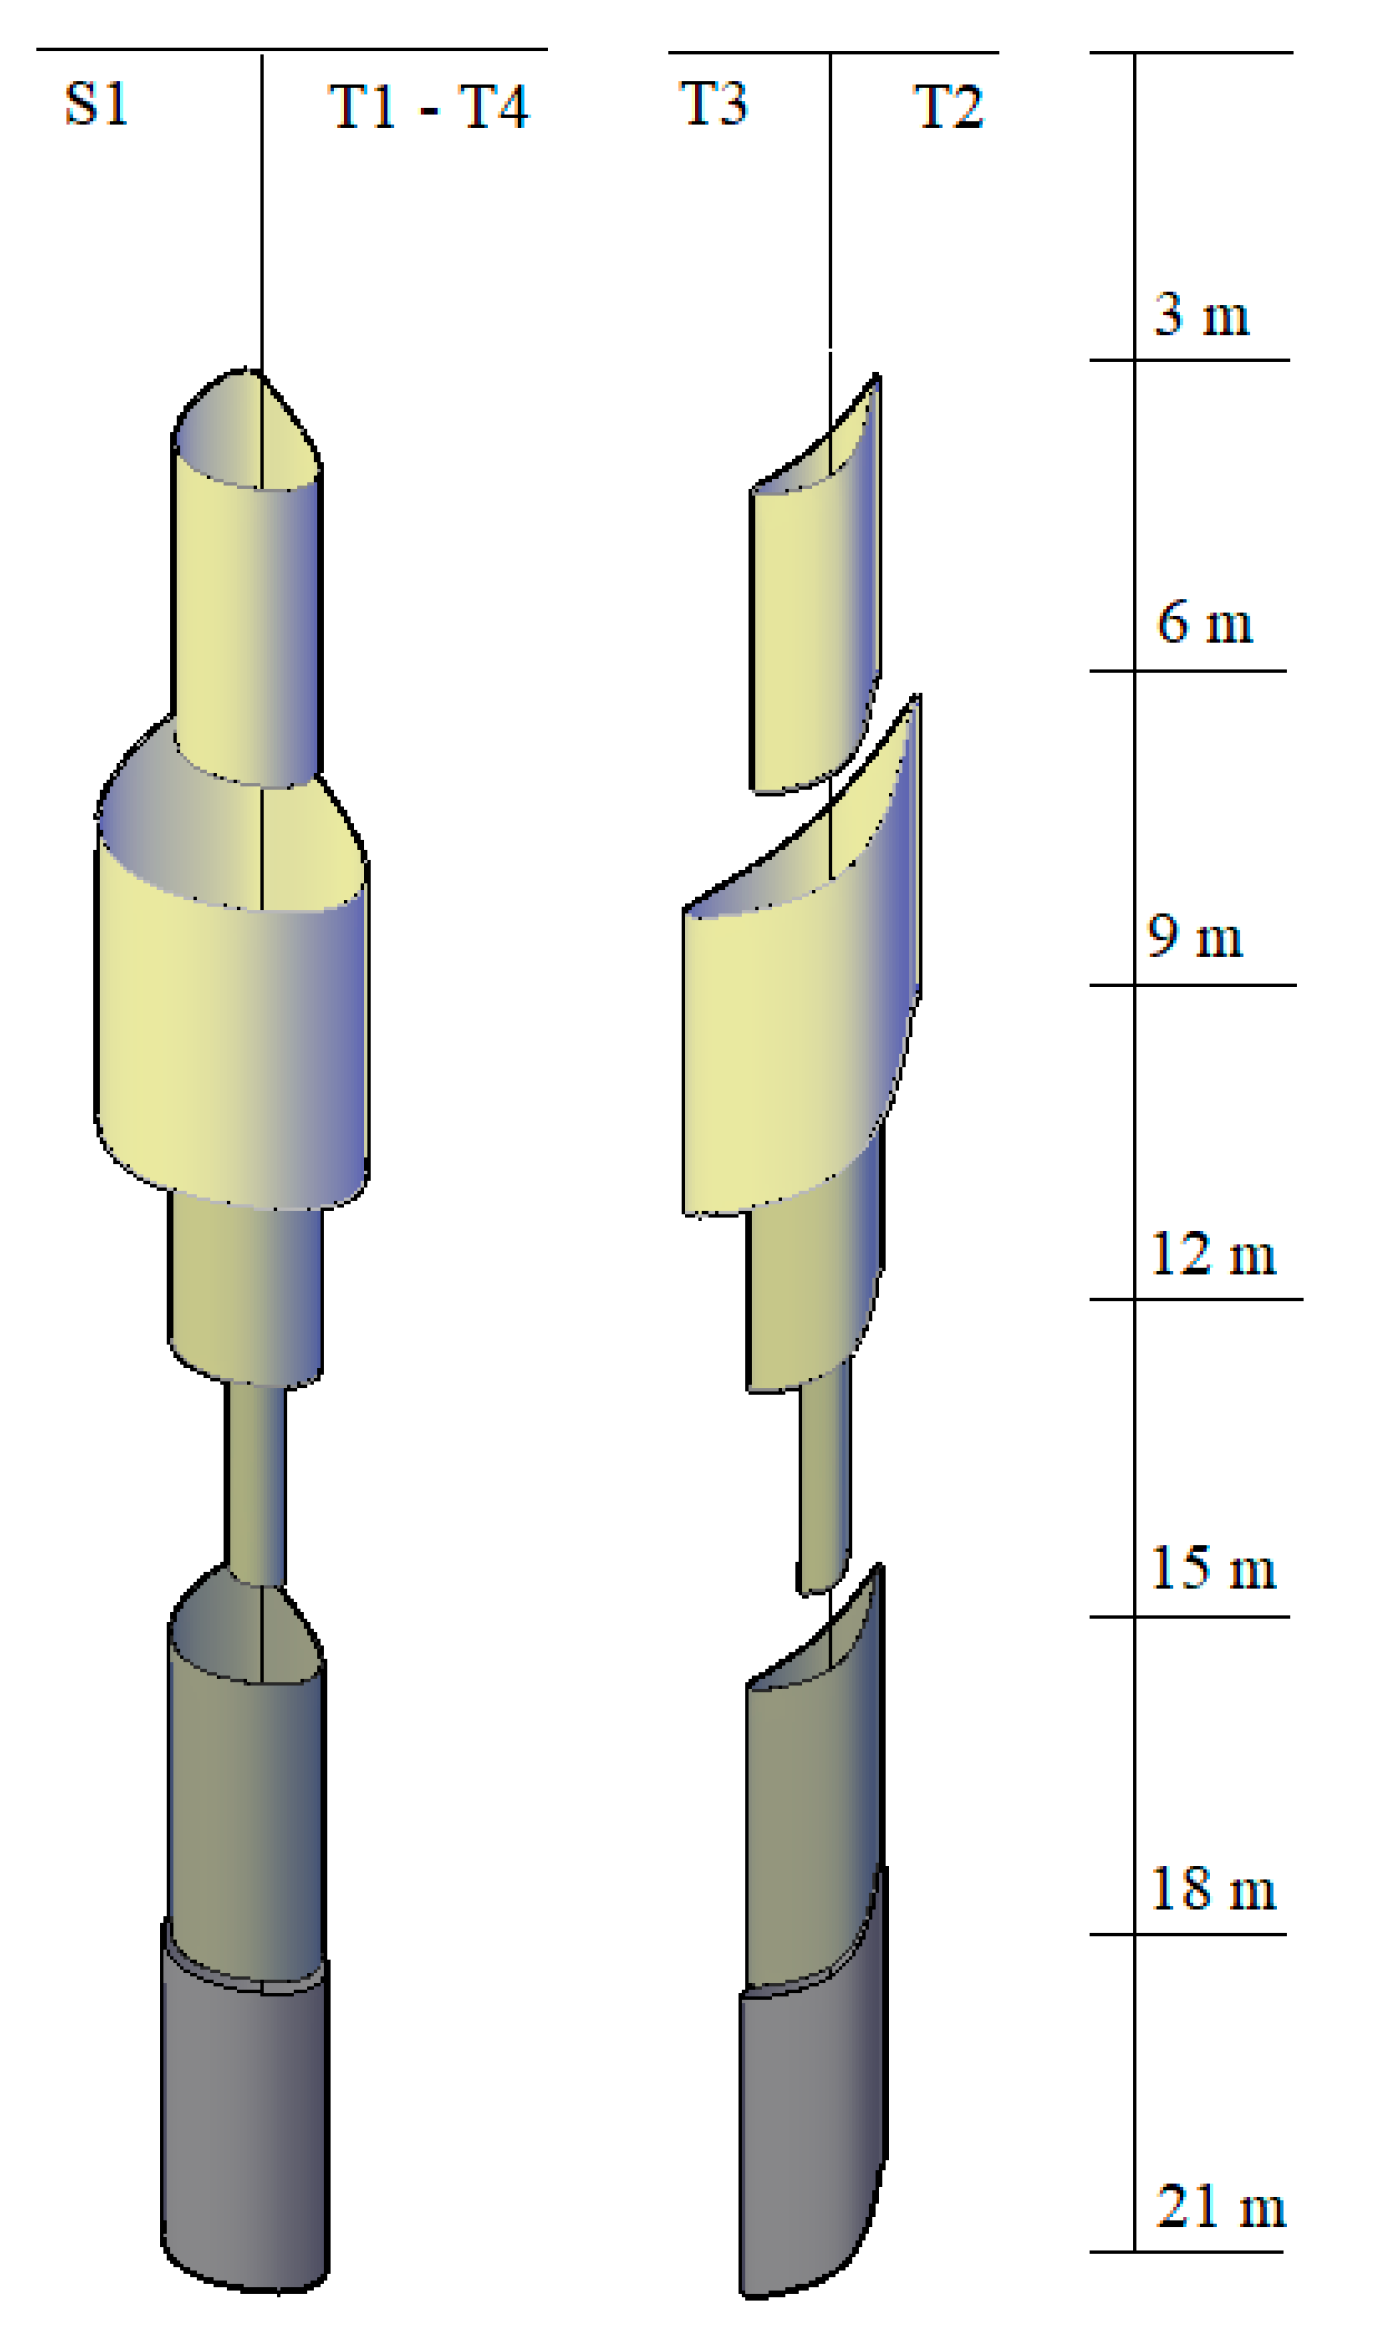
Figure 10 shows the radii of influence along EY-1. It can be seen that there are sections that, due to their strong vertical component, the grouts overlap, while in those cases with low radii of influence, there are sections without grouting, which clearly explains the variation in the permeability values shown in
Table 5.
5. Proposed Solution
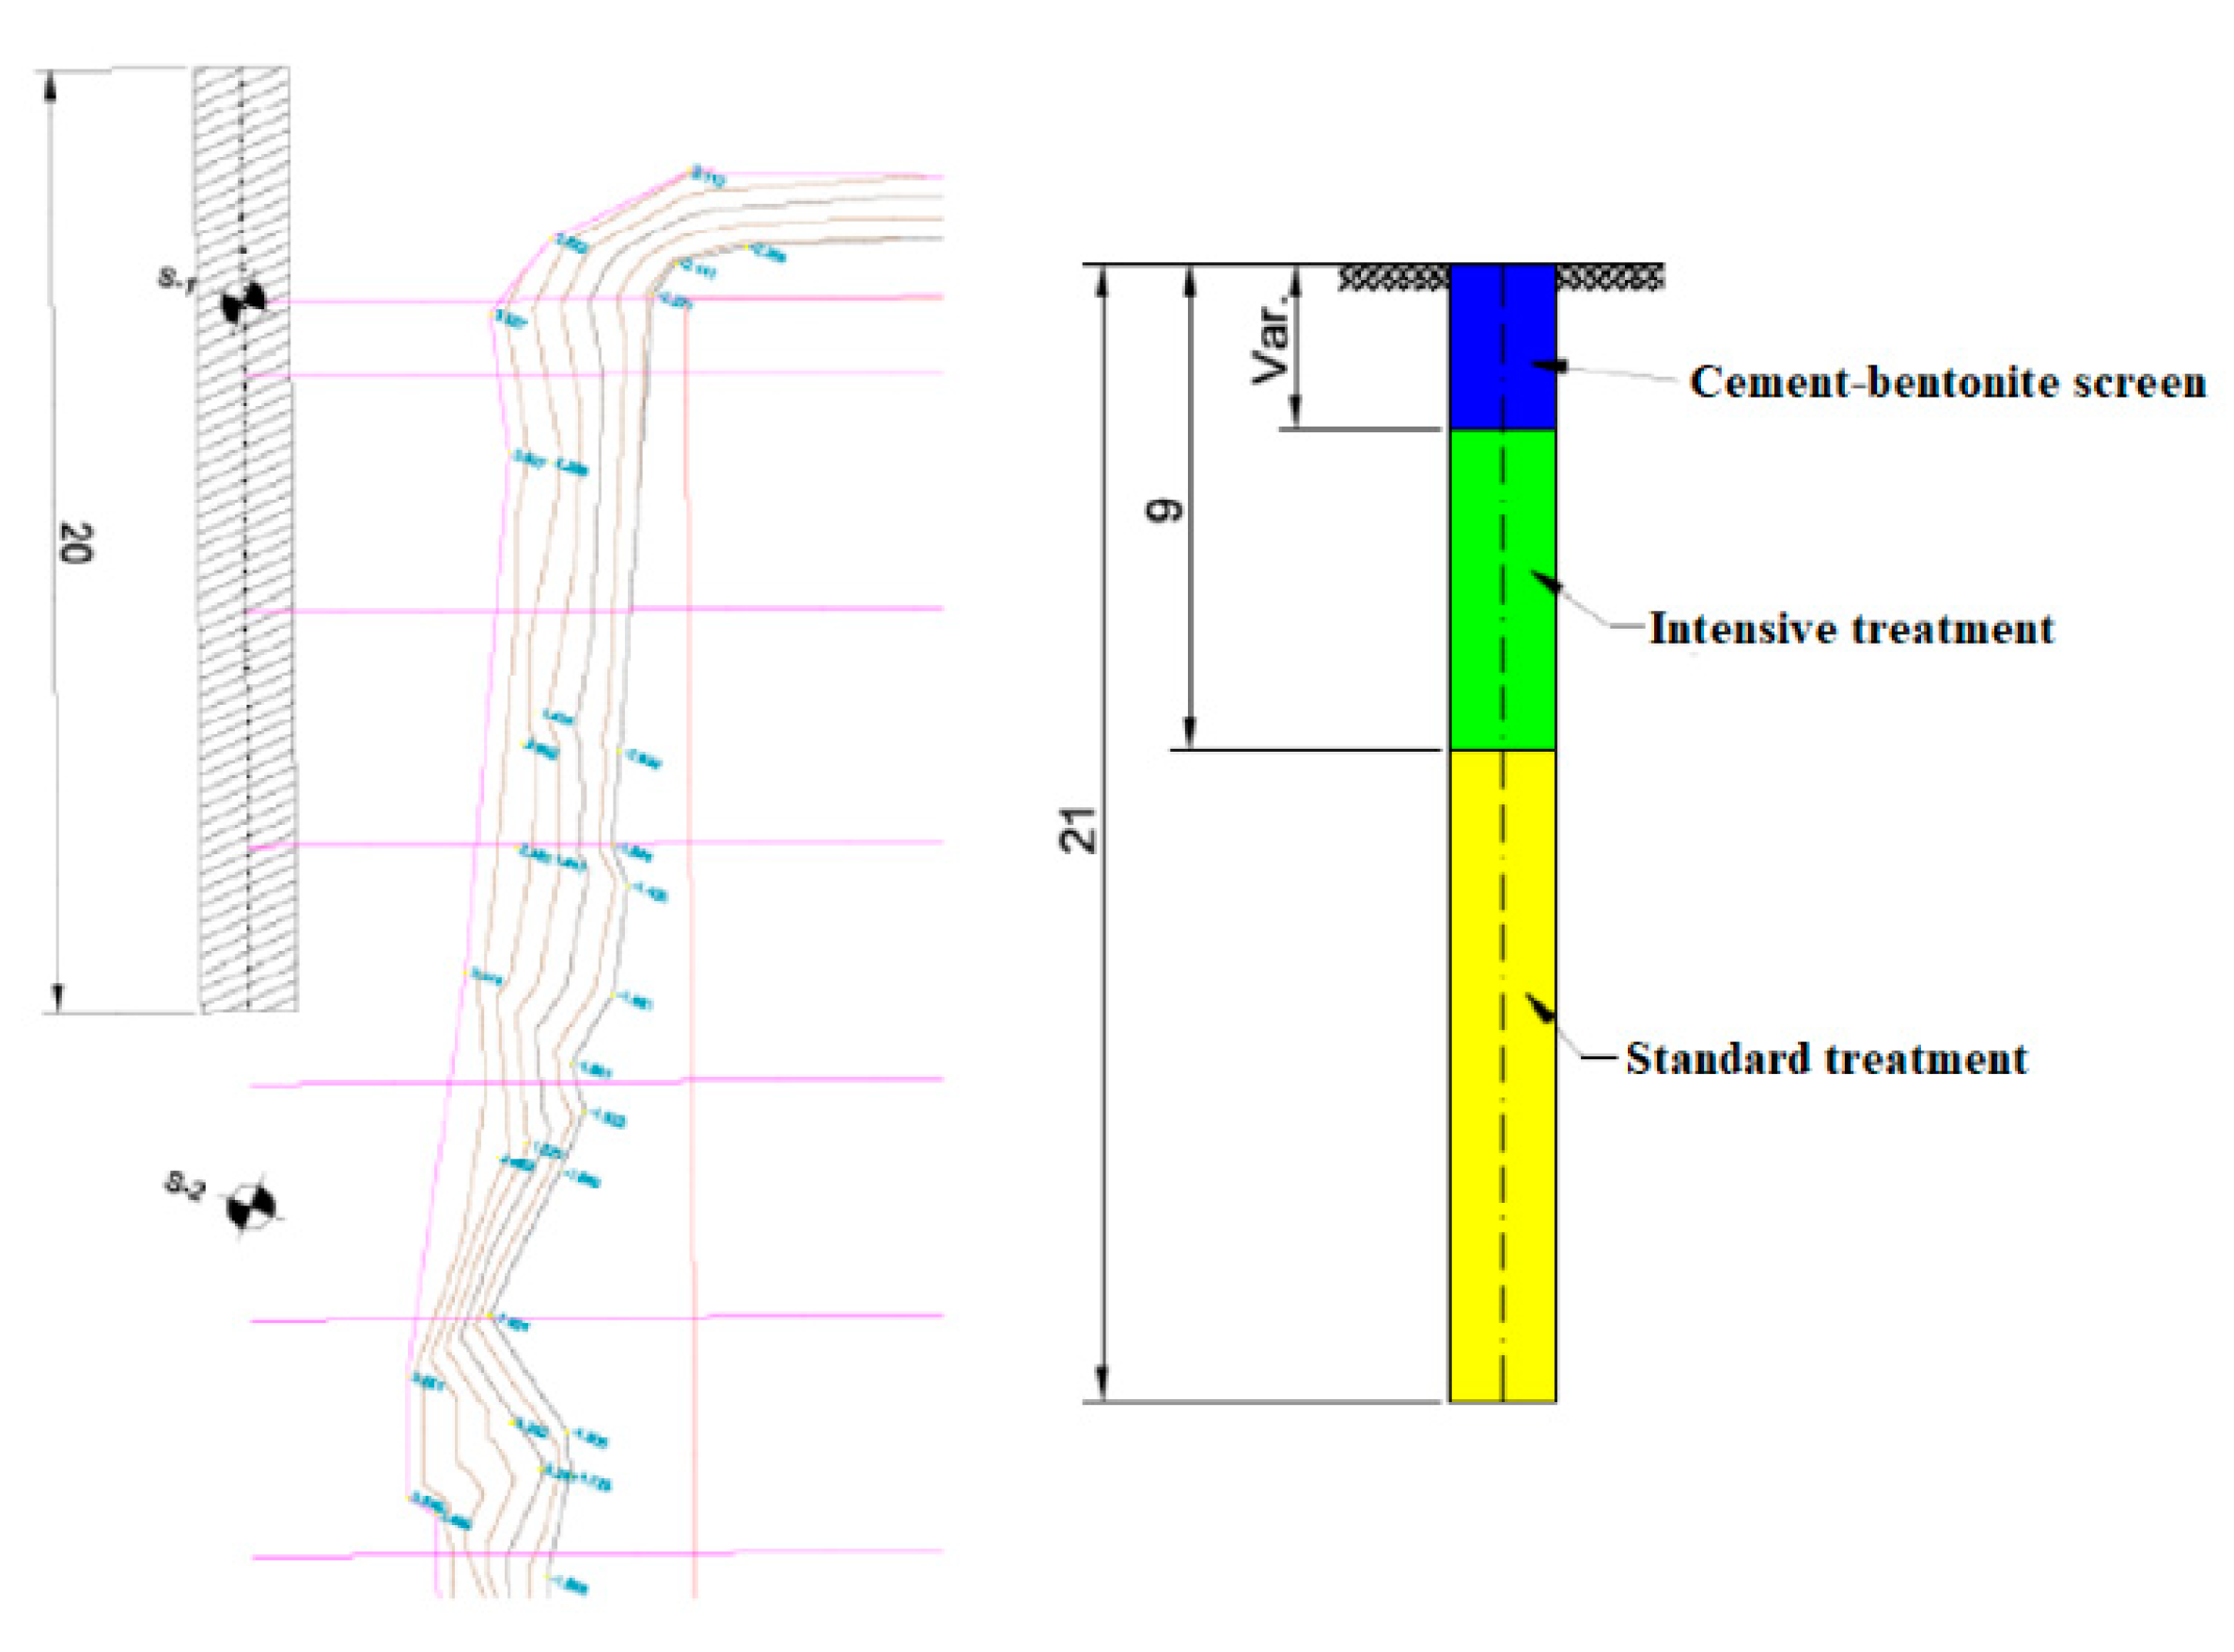
Given that the cost, both for the waterproofing of the total work and the section located between S-2 and S-4, is very high in comparison with the flow reduction achieved, the proposed solution is to design a partial screen in which the treatment is centred on a section of about 20 m in length around S-1. This partial screen consists of a total of 78 boreholes of 21 m depth and 52 boreholes of 10 m depth, divided into three types of treatment (
Figure 11):
A standard treatment with three rows of boreholes of 21 m depth and a spacing of 0.75 m between them (within the radius of influence shown in
Table 9) and 1 m between rows. These boreholes would be injected with cement (CEM I-52.5) with a w/c ratio of 0.6 and a pressure of between 0.2 and 0.6 MPa as a function of depth.
An intensive treatment with two rows of boreholes of 10 m depth and a spacing of 0.75 m between them, and interspersed between the boreholes of the standard treatment, in order to reduce the distance between the boreholes and reinforce the radius of influence. These boreholes would be injected with microcement (MCEM TP-12) with a w/c ratio of 0.6 and pressures of 0.4–0.5 MPa. Their end is to reduce the most direct connexion between the Deusto Channel and the basement.
A cement-bentonite screen of 3 m of depth. It is built in the superficial zone where the fillings and the very fragmented materials avoid the injection of grouts.
6. Discussion
The results of the injection tests made it impossible, with the previous theories, to interpret the problem correctly. However, the information made it possible to carry out a forensic analysis, the result of which is the development of an anisotropic behaviour model that takes into account the directionality and frequency of the discontinuities and that has been calibrated for the case study.
The model has two major limitations. The first is that the starting point is core drillings, which does not allow for a precise assessment of the position and condition of the joints, in particular the openness of the joints. The second is that only this case study is available because companies do not want to provide information that they consider confidential and that constitutes their know-how.
In order to avoid the first limitation, it is proposed to combine witnessing with monitoring of the boreholes, if possible, with an ultrasonic camera or, at least, with a televiewer type camera, which makes it possible to check the position and opening of the joints, as well as to detect the water supply areas on which to focus the treatments.
Finally, based on the RQD and the knowledge of the families of discontinuities and calibrating the model with the initial Lugeon tests, the calculation of the zone of influence of the grout in the different sections of the injection boreholes could be improved.
7. Conclusions
From the studies carried out, it can be said that:
The use of cement is suitable for reducing permeability in areas with large fractures. However, it is necessary to work with the highest possible injection pressure [
29,
30] provided that there is no risk of damage to the environment.
The use of micro-cement is suitable for reducing the permeability in micro-fractures, but it is necessary to establish the limit of the fracture size that allows such micro-cement to work properly [
31].
In ground waterproofing by injection, it is necessary to analyse the effect of the stratification that causes anisotropy in the radius of influence affected by the injection. With this end, in this paper, a new anisotropic behaviour model is shown.
Due to the heterogeneity of the ground, waterproofing of the ground is achieved by a combination of treatments using different materials and pressures depending on the size of the fractures and their distribution.
Author Contributions
Conceptualization, I.E.-M. and M.-I.Á.-F.; methodology, C.G.-N.; formal analysis, I.E.-M. and C.G.-N.; lab tests, M.-I.Á.-F. and I.E.-M.; writing—original draft preparation, M.-B.P.-G.; writing—review and editing, M.-B.P.-G. and M.-I.Á.-F.; supervision, C.G.-N. All authors have read and agreed to the published version of the manuscript.
Funding
This research was funded by the Centre for the Development of Industrial Technology (CDTI) of the Science Ministry of the Spanish Government within the Research Project (IMPETU) grant number FUO-159-19.
Institutional Review Board Statement
Not applicable.
Informed Consent Statement
Informed consent was obtained from all subjects involved in the study.
Data Availability Statement
The data presented in this study are available on request from the corresponding author. The data are not publicly available due to confidentiality.
Acknowledgments
The authors want to acknowledge the Viuda de Sainz, S.A. company for the facilities provided for the development of the research.
Conflicts of Interest
The authors declare no conflict of interest.
References
- Hatem, M.; Pusch, R.; Knutsson, S. Study of cement-grout penetration into fractures under static and oscillatory conditions. Tunn. Undergr. Space Tech. 2015, 45, 10–19. [Google Scholar]
- Li, S.; Liu, R.; Zhang, Q.; Zhang, X. Protection against water or mud inrush in tunnels by grouting: A review. J. Rock Mech. Geotech. 2016, 8, 753–766. [Google Scholar] [CrossRef] [Green Version]
- Funehag, J.; Thörn, J. Radial penetration of cementitious grout—Laboratory verification of grout spread in a fracture model. Tunn. Undergr. Space Tech. 2018, 72, 228–232. [Google Scholar] [CrossRef]
- Jorne, F.; Henriques, F.; Baltazar, L. Evaluation of consolidation of different porous media with hydraulic lime grout injection. J. Cult. Herit. 2015, 16, 438–451. [Google Scholar] [CrossRef]
- Yoon, J.; El Mohtar, C.S. A filtration model for evaluating maximum penetration distance of bentonite grout through granular soils. Comput. Geotech. 2015, 65, 291–301. [Google Scholar] [CrossRef]
- Xiao, F.; Zhao, Z.; Chen, H. A simplified model for predicting grout flow in fracture channels. Tunn. Undergr. Space Tech. 2017, 70, 11–18. [Google Scholar] [CrossRef]
- Zou, L.; Håkansson, U.; Cvetkovic, V. Two-phase cement grout propagation in homogeneous water-saturated rock fractures. Int. J. Rock Mech. Min. Sci 2018, 106, 243–249. [Google Scholar] [CrossRef]
- Li, X.; Wang, L.; Hao, M.; Zhong, Y.; Zhang, B. An analytical solution for the radial flow of variable density grout in rock fractures. Constr. Build. Mater. 2019, 206, 630–640. [Google Scholar] [CrossRef]
- Trybala, A.; Koursari, N.; Johnson, P.; Arjmandi-Tash, O.; Starov, V. Interaction of liquid foams with porous substrates. Curr. Opin Colloid Interface Sci 2019, 39, 212–219. [Google Scholar] [CrossRef]
- Liu, Q.; Sun, L.; Tang, X. Investigate the influence of the in-situ stress conditions on the grout penetration process in fractured rocks using the combined finite-discrete element method. Eng. An. Bound. El. 2019, 106, 86–101. [Google Scholar] [CrossRef]
- Boschi, K.; di Prisco, C.G.; Ciantia, M.O. Micromechanical investigation of grouting in soils. Int J. Solids Struct 2020, 187, 121–132. [Google Scholar] [CrossRef]
- Xu, Z.; Liu, C.H.; Zhou, X.; Gao, G.; Feng, X. Full-scale physical modelling of fissure grouting in deep underground rocks. Tunn. Undergr. Space Tech. 2019, 89, 249–261. [Google Scholar] [CrossRef]
- Mozumder, R.H.; Laskar, A.I.; Hussain, M. Penetrability prediction of microfine cement grout in granular soil using Artificial Intelligence techniques. Tunn. Undergr. Space Tech. 2018, 72, 131–144. [Google Scholar] [CrossRef]
- Zhou, Z.; Cai, X.; Du, X.; Wang, S.; Zang, H. Strength and filtration stability of cement grouts in porous media. Tunn. Undergr. Space Tech. 2019, 89, 1–9. [Google Scholar] [CrossRef]
- Sonebi, M.; Perrot, A. Effect of mix proportions on rheology and permeability of cement grouts containing viscosity modifying admixture. Constr. Build Mater. 2019, 212, 687–697. [Google Scholar] [CrossRef] [Green Version]
- Liu, J.; Li, Y.; Zhang, G.; Liu, Y. Effects of cementitious grout components on rheological properties. Constr. Build. Mater. 2019, 227, 116654. [Google Scholar] [CrossRef]
- Jorne, F.; Henriques, F.; Baltazar, L. Influence of superplasticizer, temperature, resting time and injection pressure on hydraulic lime grout injectability. Correlation analysis between fresh grout parameters and grout injectability. J. Build. Eng. 2015, 4, 140–151. [Google Scholar] [CrossRef]
- Gustafson, G.; Fransson, A.; Funehag, J.; Axelsson, M. Ett nytt angreppssätt för bergbeskrivning och analysprocess för injektering (A new approach for rock characterization and analysis for grouting). Vägoch Vattenbyggaren 2004, 4, 10–15. [Google Scholar]
- ASTM D4630-19. Standard Test Method for Determining Transmissivity and Storage Coefficient of Low-Permeability Rocks by In Situ Measurements Using the Constant Head Injection Test; ASTM International: West Conshohocken, PA, USA, 2019; Available online: www.astm.org (accessed on 17 May 2021).
- Quiñones-Rozo, C. Lugeon test interpretation, revisited. In Proceedings of the Collaborative Management of Integrated Watersheds, US Society of Dams, 30th Annual Conference, Sacramento, CA, USA, 12–16 April 2010; pp. 405–414. [Google Scholar]
- Aliaga-Robles, P.J. Relación entre la permeabilidad Insitu y la Calidad del Macizo Rocoso. In Proceedings of the ISRM Regional Symposium—8th South American Congress on Rock Mechanics, Buenos Aires, Argentina, 15–18 November 2015. [Google Scholar]
- Ferid-Öge, I. Assessing rock mass permeability using discontinuity properties. Procedia Eng. 2017, 191, 638–645. [Google Scholar]
- EHE-09. Structure Concrete Instruction. In Test Method to Determine Injection Stability (Annex 6); Ministry of Development: Madrid, Spain, 2010. [Google Scholar]
- Spanish Association for Standardization and Certification. (AENOR). Paints and Varnishes—Determination of Flow Time by Use of Flow Cups (UNE-EN ISO 2431:2012.). Available online: https://www.aenor.com/ (accessed on 17 May 2021).
- Warme, K. Practical Handbook of Grouting: Soil, Rock, and Structures; John Wiley and Sons, Inc.: Hoboken, NJ, USA, 2004. [Google Scholar]
- Weaver, K. Dam Foundation Grouting; ASCE Press: Reston, VA, USA, 1991. [Google Scholar]
- Snow, D.T. Anisotropic Permeability of Fractured Media. Water Resour. Res. 1969, 5, 1273–1289. [Google Scholar] [CrossRef]
- Palmstrøm, A. Characterization of degree of jointing and rock mass quality. Intern. Report. Ing. A. B. 1975, 1–26. [Google Scholar]
- Sun, Z.; Yan, X.; Han, W.; Ma, G.; Zhang, Y. Simulating the Filtration Effects of Cement-Grout in Fractured Porous Media with the 3D Unified Pipe-Network Method. Processes 2019, 7, 46. [Google Scholar] [CrossRef] [Green Version]
- Draganović, A.; Stille, H. Filtration and penetrability of cement-based grout: Study performed with a short slot. Tunn. Undergr. Space Tech. 2011, 26, 548–559. [Google Scholar] [CrossRef]
- Santagata, M.C.; Santagata, E. Experimental investigation of factors affecting the injectability of microcement grouts. In Proceedings in the 3rd Int Specialty Conf on Grouting and Ground Treatment; ASCE: Reston, VA, USA, 2003. [Google Scholar]
Figure 1.
(a). Construction profile of basements and buildings. (b). Earth movements during the construction. (c). Water contributions during excavation.
Figure 1.
(a). Construction profile of basements and buildings. (b). Earth movements during the construction. (c). Water contributions during excavation.
Figure 2.
Plant view of the new boreholes in relation to the plot and the channel.
Figure 2.
Plant view of the new boreholes in relation to the plot and the channel.
Figure 3.
Results of Lugeon tests.
Figure 3.
Results of Lugeon tests.
Figure 4.
Correlation between GSI and Lugeon permeability.
Figure 4.
Correlation between GSI and Lugeon permeability.
Figure 5.
Plant view of the new injection boreholes.
Figure 5.
Plant view of the new injection boreholes.
Figure 6.
Arrangement of control boreholes during cement tests.
Figure 6.
Arrangement of control boreholes during cement tests.
Figure 7.
Arrangement of boreholes and families of discontinuities around EY-1.
Figure 7.
Arrangement of boreholes and families of discontinuities around EY-1.
Figure 8.
Arrangement of control boreholes during microcement tests.
Figure 8.
Arrangement of control boreholes during microcement tests.
Figure 9.
Arrangement of boreholes and families of discontinuities around EY-2.
Figure 9.
Arrangement of boreholes and families of discontinuities around EY-2.
Figure 10.
Grout distribution, function of radii of influence.
Figure 10.
Grout distribution, function of radii of influence.
Figure 11.
Waterproofing screen around S1.
Figure 11.
Waterproofing screen around S1.
Table 1.
Most representative properties of the rock and the rocky mass.
Table 1.
Most representative properties of the rock and the rocky mass.
| Characteristic | Description |
|---|
| Lithology | Grey Calcareous Siltstones |
| Simple compressive strength of the rock | 16.65 MPa |
| Tensile strength of the rock | 5.59 MPa |
| Specific weight of the rock | 26.3 kN/m3 |
| Families of discontinuities | 5 | S | 252/62 |
| J1 | 40/40 |
| J2 | 185/62 |
| J3 | 345/50 |
| J4 | 270/75 |
| RQD average | 41 |
| Degree of weathering (ISRM) | II a III |
| RMR (Bieniawski Classification) | 35–55 |
Table 2.
Drill cores characteristics.
Table 2.
Drill cores characteristics.
| Borehole | Depth (m) | Description | RQD | GSI |
|---|
| S-1 | 0–1.4 | Fillings (concrete, gravel) | - | - |
| 1.4–8.4 | Medium rock | 60 ± 2 | 50 ± 3 |
| 8.4–11.4 | Fractured rock | 30 ± 4 | 27 ± 3 |
| 11.4–17.5 | Very fractured rock | 15 ± 5 | 23 ± 3 |
| 17.5–21.0 | Medium rock | 65 ± 2 | 45 ± 3 |
| S-2 | 0–0.4 | Fillings (concrete, gravel) | - | - |
| 0.4–5.2 | Fractured rock | 40 ± 3 | 30 ± 3 |
| 5.2–21.0 | Healthy rock | 85 ± 1 | 70 ± 3 |
| S-3 | 0–1.2 | Fillings (concrete, gravel) | - | - |
| 1.2–2.4 | Fractured rock | 40 ± 3 | 30 ± 3 |
| 2.4–16.0 | Medium rock | 62 ± 2 | 63 ± 3 |
| 16.0–17.5 | Medium rock | 60 ± 2 | 52 ± 3 |
| 15.0–21.0 | Healthy rock | 85 ± 1 | 75 ± 3 |
| S-4 | 0–1.0 | Fillings (concrete, gravel) | - | - |
| 1.0–2.4 | Altered rock | - | - |
| 2.4–9.9 | Fractured rock | 50 ± 3 | 36 ± 3 |
| 9.9–11.5 | Healthy rock | 85 ± 1 | 72 ± 3 |
| 11.5–14.2 | Fractured rock | 20 ± 4 | 28 ± 3 |
| 14.2–17.5 | Healthy rock | 60 ± 2 | 65 ± 3 |
| 17.5–21.0 | Medium rock | 55 ± 3 | 40 ± 3 |
Table 3.
Characteristics of the mixtures.
Table 3.
Characteristics of the mixtures.
| Material | Water/Cement Ratio | Density (g/cm3) | Standard
Deviation Density | Marsh Cone
(s) | Standard
Deviation Marsh Cone |
|---|
| CEM | 0.6 | 1.61 | 0.1 | 41 | 0.20 |
| 0.7 | 1.61 | 0.1 | 40 | 0.19 |
| 0.8 | 1.62 | 0.1 | 39 | 0.20 |
| 1.0 | 1.64 | 0.1 | 36 | 0.19 |
| 1.2 | 1.72 | 0.1 | 34 | 0.18 |
| 1.5 | 1.72 | 0.1 | 34 | 0.18 |
| 1.7 | 1.72 | 0.1 | 33 | 0.18 |
| Micro | 1.6 | 1.27 | 0.1 | 36 | 0.19 |
Table 4.
Numerical injection results in EY-1.
Table 4.
Numerical injection results in EY-1.
| Depth (m) | Treatment | Injected Volume (L) | kg of Cement | Time (min) | Final Pressure (MPa) |
|---|
| 3–6 | CEM a/c = 0.6 | 172 | 187 | 17 | 0.2 |
| 6–9 | CEM a/c = 0.6 | 450 | 490 | 44 | 0.2 |
| 9–12 | CEM a/c = 0.8 | 360 | 322 | 36 | 0.2 |
| 12–15 | CEM a/c = 1.0 | 34 | 26 | 4 | 0.2 |
| 15–18 | CEM a/c = 1.2 | 173 | 114 | 15 | 0.3 |
| 18–21 | CEM a/c = 1.7 | 50 | 25 | 5 | 0.6 |
Table 5.
Lugeon test results after injection into EY-1.
Table 5.
Lugeon test results after injection into EY-1.
| Depth (m) | S-1 (Before) | S-1 (After) | T-1 | T-2 | T-3 | T-4 |
|---|
| 3–6 | 35 | 35 | 35 | 28 | 48 | 37 |
| 6–9 | 82 | 41 | 34 | 71 | 59 | 26 |
| 9–12 | 85 | 85 | 42 | 79 | 34 | 27 |
| 12–15 | 107 | 107 | 31 | 35 | 35 | 26 |
| 15–18 | 62 | 62 | 18 | 65 | 52 | 24 |
| 18–21 | 59 | 59 | 30 | 57 | 48 | 39 |
| Average | 66 | 56 | 32 | 61 | 48 | 28 |
Table 6.
Numerical injection results in EY-2.
Table 6.
Numerical injection results in EY-2.
| Depth (m) | Pressure (MPa) | Injected Volume (l) | kg of Cement | Time (min) |
|---|
| 3–6 | 0.10 | 14 | 10.36 | 2 |
| 6–9 | 0.10 | 15 | 11.1 | 2 |
| 9–12 | 0.15 | 255 | 188.7 | 30 |
| 12–15 | 0.20 | 188 | 139.12 | 20 |
Table 7.
Lugeon test results after injection into EY-2.
Table 7.
Lugeon test results after injection into EY-2.
| Depth (m) | S-3 (Before) | S-3 (After) | T-5 | T6 | T-7 | T-8 |
|---|
| 3–6 | 14.4 | 14 | 24.0 | 25.5 | 16.2 | 66.3 |
| 6–9 | 17.3 | 17 | 16.6 | 3.9 | 33.8 | 97.7 |
| 9–12 | 17 | 17 | 8.3 | 29.6 | 15.9 | 86.1 |
| 12–15 | 24.6 | 10 | 15.6 | 22.0 | 22.2 | 27.1 |
| Average | 18.3 | 14.5 | 16.1 | 20.25 | 22.0 | 69.3 |
Table 8.
Values of the radii of influence for the different sections of EY-1.
Table 8.
Values of the radii of influence for the different sections of EY-1.
| Depth (m) | Injected Volume (l) | RQD | Jv | L | r (m) |
|---|
| 3–6 | 172 ± 0.5 | 60 ± 2 | 16.67 ± 0.6 | 35 ± 1 | 1.04 ± 0.009 |
| 6–9 | 450 ± 0.5 | 60 ± 2 | 16.67 ± 0.6 | 82 ± 1 | 1.46 ± 0.011 |
| 9–12 | 360 ± 0.5 | 30 ± 4 | 25.76 ± 1.2 | 85 ± 1 | 1.40 ± 0.012 |
| 12–15 | 34 ± 0.5 | 15 ± 5 | 30.30 ± 1.2 | 107 ± 1 | 0.42 ± 0.001 |
| 15–18 | 173 ± 0.5 | 15 ± 5 | 30.30 ± 1.5 | 61 ± 1 | 1.05 ± 0.010 |
| 18–21 | 50 ± 0.5 | 65 ± 2 | 15.15 ± 0.6 | 59 ± 1 | 0.50 ± 0.002 |
Table 9.
Values of the radii of influence as function of the distribution of joint families.
Table 9.
Values of the radii of influence as function of the distribution of joint families.
| Section | North | East | West | South | x | z | x | z | x | z | x | z |
|---|
| S-1 | T2 | T3 | T1-T4 | S-1 | S-1 | T-2 | T-2 | T-3 | T-3 | T1-T4 | T1-T4 |
|---|
| 3–6 | 1.22 | 0.56 | 1.65 | 1.39 | 0.86 | 0.86 | 0.43 | 0.36 | 0.77 | 1.46 | 0.56 | 1.28 |
| 6–9 | 2.28 | 1.05 | 3.09 | 2.60 | 1.62 | 1.62 | 0.80 | 0.67 | 1.44 | 2.73 | 1.045 | 2.38 |
| 9–12 | 1.27 | 0.58 | 1.72 | 1.45 | 0.90 | 0.90 | 0.45 | 0.37 | 0.80 | 1.52 | 0.58 | 1.33 |
| 12–15 | 0.47 | 0.21 | 0.63 | 0.53 | 0.33 | 0.33 | 0.16 | 0.14 | 0.29 | 0.56 | 0.21 | 0.49 |
| 15–18 | 1.29 | 0.59 | 1.74 | 1.47 | 0.91 | 0.91 | 0.41 | 0.38 | 0.81 | 1.54 | 0.59 | 1.34 |
| 18–21 | 1.38 | 0.63 | 1.87 | 1.58 | 0.98 | 0.98 | 0.48 | 0.41 | 0.87 | 1.66 | 0.63 | 1.44 |
| Publisher’s Note: MDPI stays neutral with regard to jurisdictional claims in published maps and institutional affiliations. |
© 2021 by the authors. Licensee MDPI, Basel, Switzerland. This article is an open access article distributed under the terms and conditions of the Creative Commons Attribution (CC BY) license (https://creativecommons.org/licenses/by/4.0/).


 ,
, 


