Article

A Study of Moist Air Condensation Characteristics in a Transonic Flow System

State Key Laboratory of Multiphase Flow in Power Engineering, Xi’an Jiaotong University, Xi’an 710049, China
*
Author to whom correspondence should be addressed.
Energies 2021, 14(13), 4052; https://doi.org/10.3390/en14134052
Submission received: 12 May 2021 / Revised: 23 June 2021 / Accepted: 30 June 2021 / Published: 5 July 2021

Abstract

:
When water vapor in moist air reaches supersaturation in a transonic flow system, non-equilibrium condensation forms a large number of droplets which may adversely affect the operation of some thermal-hydraulic equipment. For a better understanding of this non-equilibrium condensing phenomenon, a numerical model is applied to analyze moist air condensation in a transonic flow system by using the theory of nucleation and droplet growth. The Benson model is adopted to correct the liquid-plane surface tension equation for realistic results. The results show that the distributions of pressure, temperature and Mach number in moist air are significantly different from those in dry air. The dry air model exaggerates the Mach number by 19% and reduces both the pressure and the temperature by 34% at the nozzle exit as compared with the moist air model. At a Laval nozzle, for example, the nucleation rate, droplet number and condensation rate increase significantly with increasing relative humidity. The results also reveal the fact that the number of condensate droplets increases rapidly when moist air reaches 60% relative humidity. These findings provide a fundamental approach to account for the effect of condensate droplet formation on moist gas in a transonic flow system.

Graphical Abstract

1. Introduction

Non-equilibrium condensation of moist air has industrial applications in various fields such as aerospace engine intakes, high-speed rotating engine blades, Laval nozzles, as well as high-speed wind tunnels and turbines, etc. Condensate droplets can adversely affect the operational efficiency, promote separation of the constituent phases, and negatively impact the environment. In this section, we provide a review of non-equilibrium condensation phenomena in transonic flows.
During the last half century, a number of experimental studies [1,2,3,4,5,6] have analyzed vapor/gas condensation in a transonic flow condition. Schnerr [1] studied condensation events for transonic moist air flow in nozzles. Additionally, a theoretical model was proposed under the guidance of kinetic energy nucleation theory. The non-equilibrium condensation model proposed by Hill [2] applied a nucleation equation to calculate the homogeneous nucleation number of water vapor in transonic flow. In the formulation, both the critical radius of the droplet and the nucleation rate were influenced by the Gibbs free energy changes. Anisimov [3] reviewed and summarized a number of experimental results on transonic condensation. The author is strongly believed that, for the vast majority of cases, the non-condensable gas in the dominant gas phase acted as an inert medium and absorbed the heat generated by the vapor due to the phase change during supersonic condensation of vapor-gas fluids. The Laval nozzle has been employed in many previous experiments, while the pressure measurement has often served as the main method. The condensation process can be reflected by measuring the parameters of different positions of the nozzle centerline. The measurements of pressure distribution in a Laval nozzle condensation zone were presented by Moore et al. [4] and the experimental data have been widely used in the literature to validate numerical results. The condensation phenomenon under various expansion processes was tested on transonic moist air flows in nozzles by Pouring [5]. Peter [6] employed a nozzle to test droplet growth and the results showed that the release of latent heat could certainly produce a sudden pressure jump.
When moist air or pure steam expands in a nozzle, the point at which condensation occurs is thermodynamically referred to as the “Wilson point”. Sharifi [7] explored the Wilson point as well as the size and number of condensed droplets by varying the geometry of a nozzle with the aim of adjusting the vapor expansion rate; for rapid expansion in supersaturated vapor, the mass fraction of liquid phase produced by condensation ranged from 3.5 to 5% when re-equilibrating. Ding et al. [8] carried out theoretical analyses and numerical simulations of homogeneous nucleation of pure steam and other humid gases in rapid expansion, focusing on the changes of the Wilson point at low pressure in a Laval nozzle.
Accurate computational fluid dynamics (CFD) modeling of non-equilibrium condensation in a two-phase transonic flow system is quite challenging because of concurrent heat and mass transfer. A number of studies have simplified the transonic flow of water vapor to a single-phase flow where condensation does not occur. By assuming an ideal gas and single-phase flow, the literature [9,10,11] reported the performance of a transonic steam ejector, mainly focusing on the study of the entrainment ratio. Yang et al. [12,13] compared the dry gas isentropic expansion model with the non-equilibrium condensation model, and then summarized the physical characteristics of a condensation shock in a Laval nozzle. The numerical results showed that the dry gas model exaggerated the expansion characteristics of the nozzle by 22%. Liquid-plane surface tension is an important factor in droplet nucleation. In recent years, the Benson model [14] has been adopted to correct the liquid-plane surface tension equation and obtained realistic results [15,16]. According to a modified model, numerical simulation methods have been widely applied in studies to optimize the design of turbine blades [17], a steam ejector [18], the Laval nozzle [19], etc.
The relative humidity of moist air has a significant effect on the transonic non-equilibrium condensation. Several studies [20,21,22,23,24] have compared their investigations on the effect of relative humidity versus practical operation in a transonic flow system. Dykas et al. [20] found that modeling of the weak shock waves by using a dry air model would ultimately yield an unreasonable result when the relative humidity condition was over 70%. The irreversible loss caused by non-equilibrium conditions and phase change had an impact on the efficiency of the low-pressure section of the steam turbine. Patchell et al. [21] confirmed that the efficiency of a steam turbine decreased with increasing humidity proportionally, and corrosion occurred on the turbine blades. The relative air humidity has been shown to have a strong effect on the position and loss of condensation shocks in nozzles [22]. Under the condition of transonic flow, relative air humidity can affect the characteristics and performance of the airfoil [23]. Experimental equipment [24] equipped with high-precision sensors have been used to test the transonic flow of moist air condensation characteristics in a nozzle, which can ensure homogenous moist air with the same properties.
In this study, a non-equilibrium condensation model of moist air is developed for a transonic flow system by using a numerical approach. The theory of the nucleation and droplet growth is used to couple a non-equilibrium condensation model with the gas-liquid phase conservation equations. The Benson model is applied to correct the liquid-plane surface tension equation for realistic results. The heat and mass transfer associated with condensation are formulated as source terms in the energy and momentum equations. Relative humidity, nucleation mechanism, and other factors influencing the condensation process are introduced in the model, which can well predict the non-equilibrium condensation in the transonic flow of moist air. The results show that the distribution of pressure, temperature, and the Mach number of moist air are significantly different from those of dry air. At a Laval nozzle, for example, the nucleation rate, droplet number, and condensation rate increase significantly with increasing relative humidity. It is believed that findings of this study can provide theoretical guidance for the structural design and optimization of a transonic flow system in an atmospheric environment. This paper is comprised of four sections. In Section 1, we introduce the application of moist air non-equilibrium condensation, related research results, and the purpose of the study; in Section 2, we present the methodology; in Section 3, we validate the numerical results and compare the performances of dry air and moist air in transonic flow, in terms of temperature, pressure, and Mach number, additionally, the effects of relative air humidity on the condensation characteristics of moist air are also discussed; in Section 4, the conclusions are summarized.

2. Numerical Models

2.1. Conservation Equations

The radii of common condensate droplets mostly range from 10−10 m to 10−8 m, and the droplet mass fraction is relatively small, thus, the droplets are assumed to be evenly distributed in the flow field. The numerical simulation method requires the following assumptions:
(a)
Interactions between the droplets are negligible.
(b)
The volume of the droplets is negligible.
(c)
The droplets and the gas have the same velocity, i.e., the slip ratio is one.
(d)
Dalton’s law of partial pressure is applicable to the gas mixture of air and water vapor:
p = p a + p v
where p is the total pressure of the water vapor and air mixture, pa is the air partial pressure, and pv is the water vapor partial pressure.
(e)
The heat capacity of the droplet is negligible.
The equations of continuity, momentum and energy for the moist air flow are:
ρ t + x j ( ρ u j ) = m ˙
t ( ρ u i ) + x j ( ρ u j u i ) = p x j + τ i j x j u m ˙
t ( ρ E ) + x j [ u j ( ρ E + p ) ] = x j ( λ e f f T x j ) + x j ( u i τ i j ) h lg m ˙
t ( ρ Y A ) + x j ( ρ u j Y A ) = x j ( D ρ Y A x j ) m ˙
where ρ is the density; u is the velocity of the gas mixture; m ˙ is the mass flow rate per unit volume; p is the pressure of the gas mixture; E is the total specific energy; λeff is the effective thermal conductivity; T and hlg are the temperature and the latent heat of the droplets respectively. YA is the mass fraction of the water vapor and D is the mass diffusion coefficient of the water vapor.
The equations of the liquid phase consist of two transport equations, which are used to calculate the droplet number (N) and the liquid fraction (Y), respectively:
( ρ Y ) t + ( ρ Y u j ) x j = m ˙
( ρ N ) t + ( ρ N u j ) x j = ρ J
where Y is the liquid fraction, N is the droplet number, and J is the nucleation rate.
The m ˙ is the mass generation rate, and can be written as [25]:
m ˙ = 4 π r * 3 3 ρ l J + 4 π ρ l N r 2 d r d t
where r* is the critical radius, ρl is the density of the droplet; r is the droplet radius, and dr/dt is the growth rate of droplets.

2.2. Nucleation and Droplet Gowth Model

The r* is the Kelvin–Helmholtz critical droplet radius [25]:
r * = 2 σ ρ l R v T ln ( S )
where σ is the liquid-plane of the water, Rv is the gas constant of water vapor, and S is the supersaturation ratio defined as the ratio of vapor pressure to the equilibrium saturation pressure.
The nucleation rate, J, is defined as the number of supercritical droplets produced per unit mass of vapor at per unit time based on the classical nucleation theory [26]. J is expressed as:
J = 2 π σ m l 3 / 2 ρ v 2 ρ l exp ( Δ G * k T )
The Gibbs free energy ∆G* is given by:
Δ G * = 16 3 π [ m v ρ l ln ( S ) k T ] 2 σ 3
where mv is the mass of vapor molecules; ρv is the vapor density; and k is the Boltzmann constant, 1.380649 × 10⁻²³ J·K1.
The liquid-plane surface tension equation [27] is:
σ 0 = 0.2358 ( 1 T 647.3 ) 1.256 [ 1 0.625 ( 1 T 647.3 ) ]
According to the Gibbs surface tension theory, a high error will emerge when the surface tension is calculated for transonic condensation flows. For a more realistic result, the Benson model [13] is used to correct the liquid-plane surface tension equation, and is expressed as follows:
σ = σ 0 ( 1 ρ l / m 3 4.863 r )
The Hertz–Knudsen equation [28] is used for the determination of droplet growth rate, dr/dt, which is expressed as follows:
d r d t = α ρ l p v p s r 2 π R v T
where α is droplet growth rate correction factor and psr is the saturation pressure of the droplet surface.

2.3. CFD Solution Methodology

The ANSYS FLUENT platform is used for this simulation. The continuity, momentum and energy Equations (2)–(4) can be solved directly, while Equations (5)–(14) for the nucleation behavior are coded in C and incorporated as a user-defined function (UDF) in FLUENT. Turbulence is modeled via the standard k-ε model in this simulation. The double precision solver is used to solve the multiphase flow. The absolute convergence criterion for all equations is 10−6. In addition, pressure boundary conditions are adopted at the inlet and outlet boundaries. At the wall of the nozzle, a no-slip adiabatic wall condition is used.

3. Results and Discussions
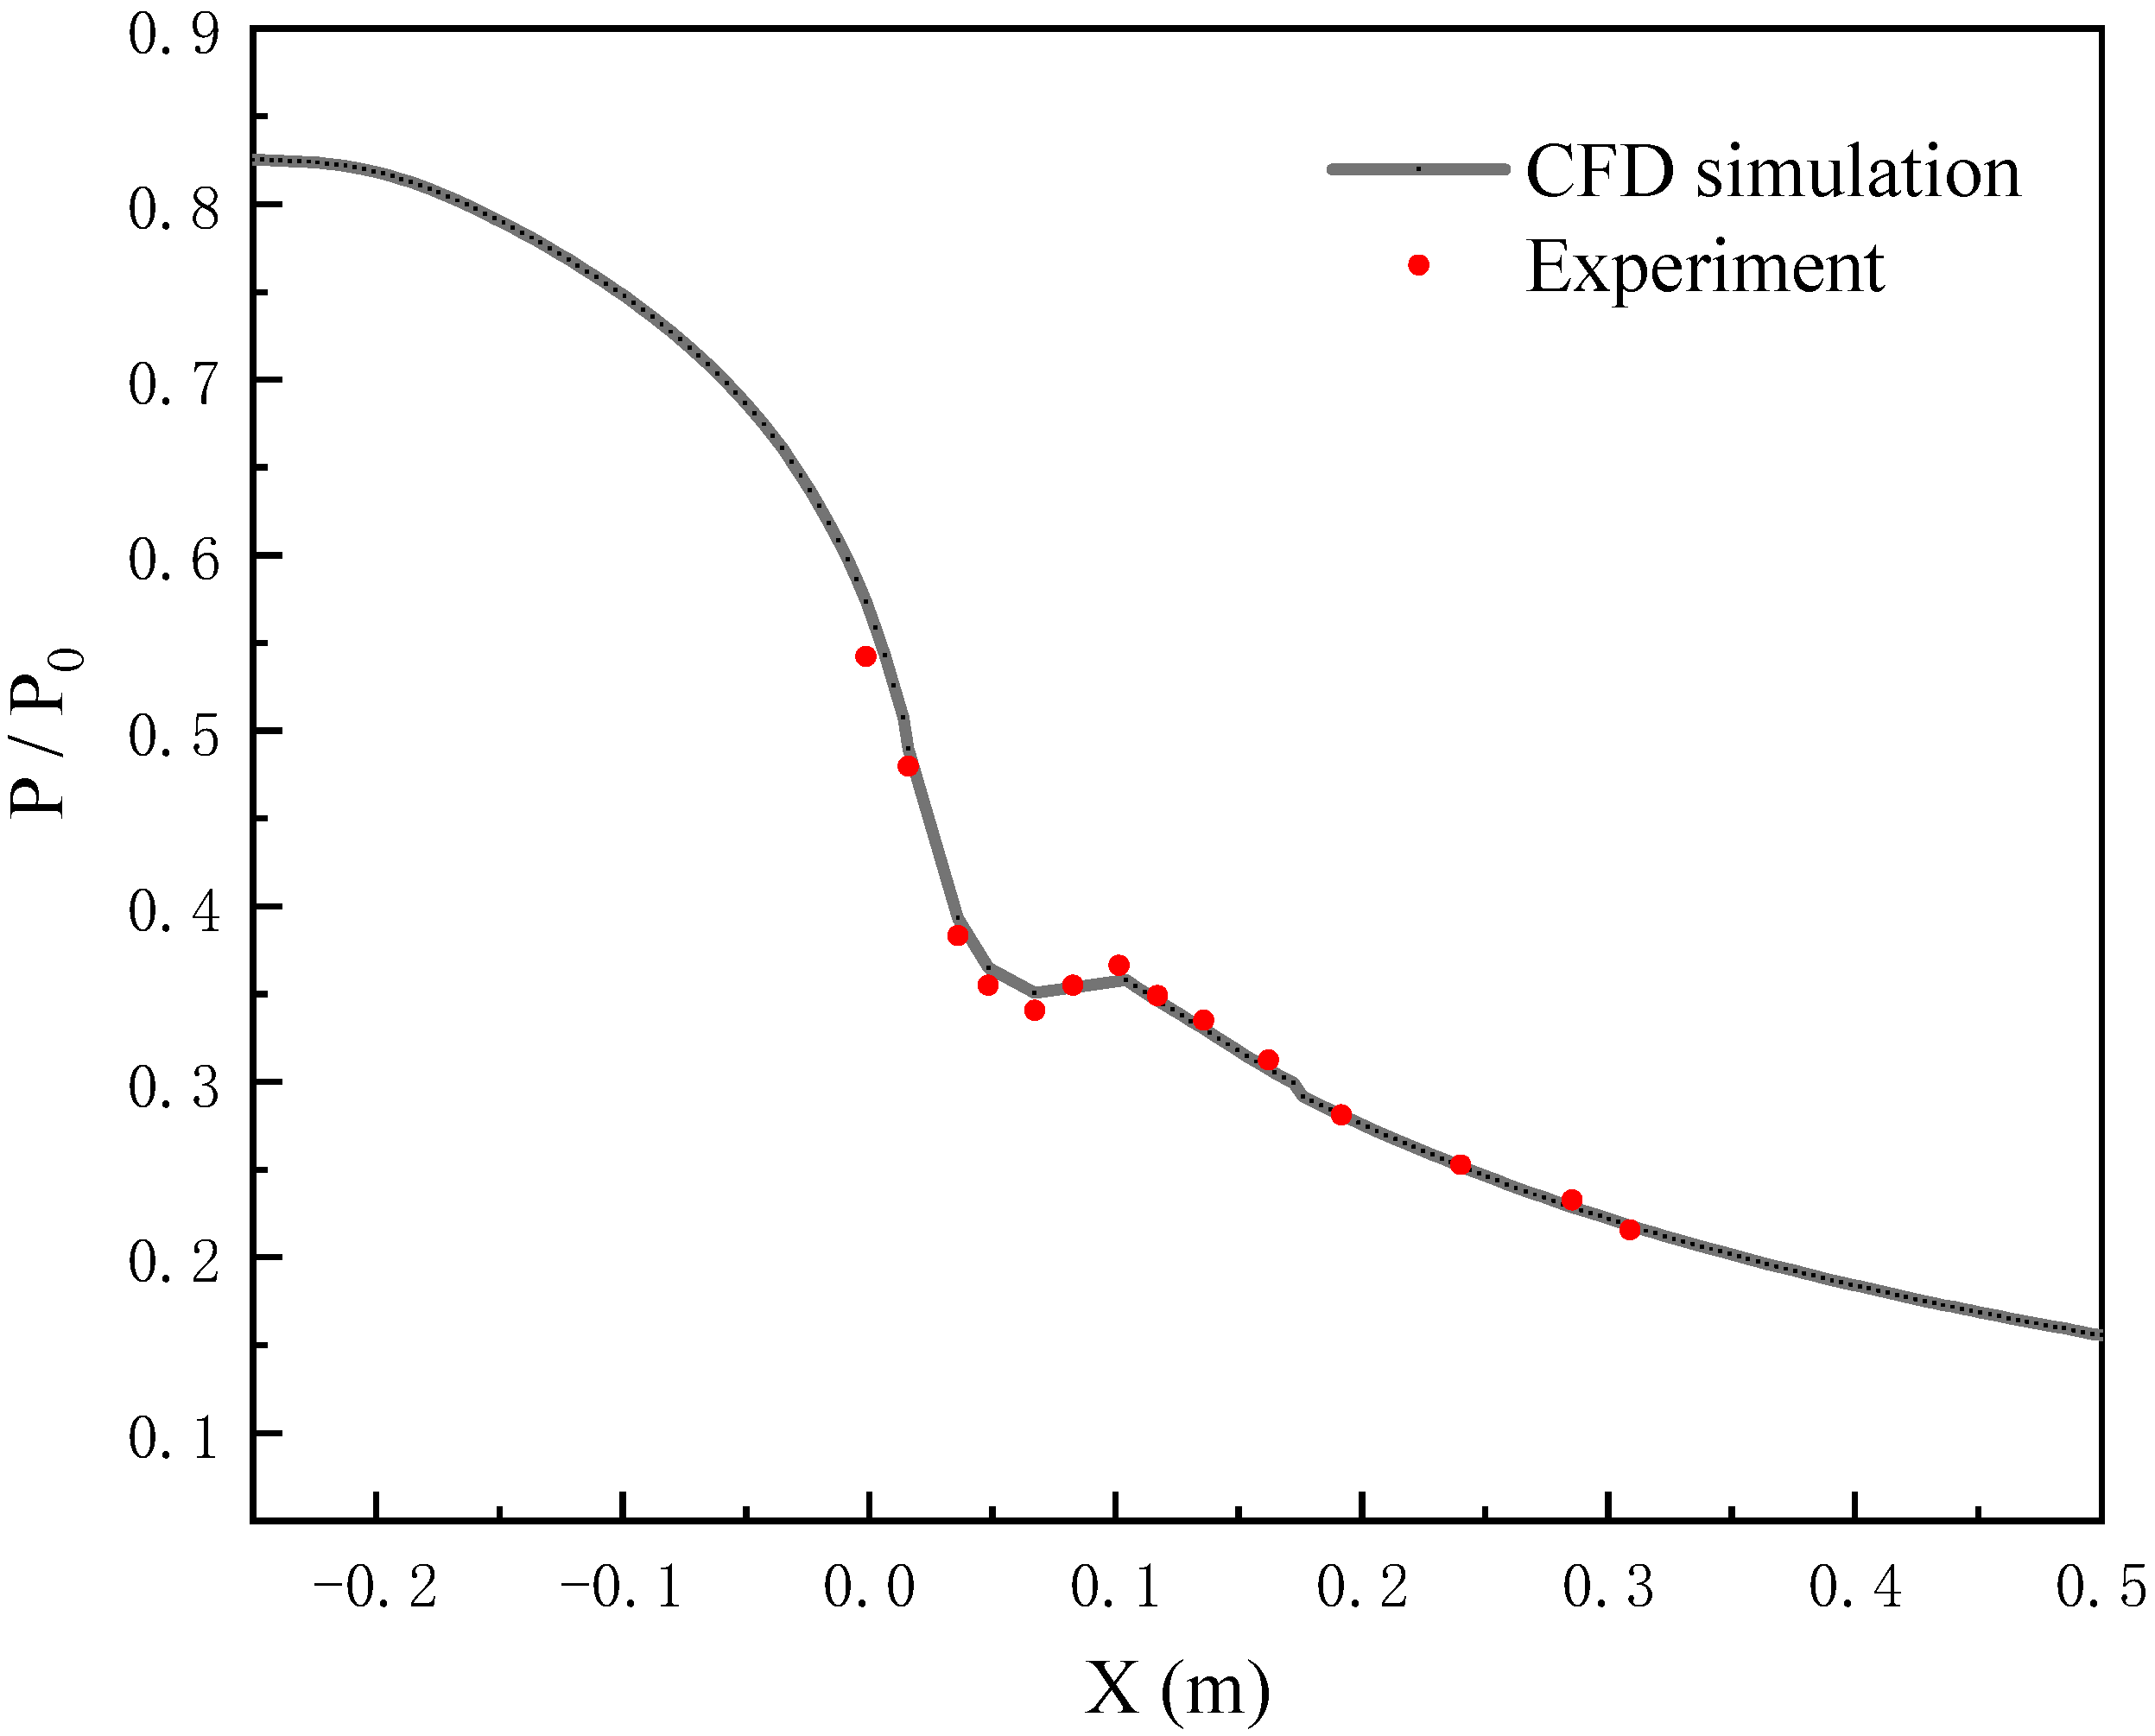
3.1. CFD Validation

Moore et al.’s experiment [4] was conducted in a wet steam tunnel. Superheated steam from a small impulse turbine was guided through a test section, where nozzles were formed by upper and lower liners between parallel Perspex side walls. There are few experiments about non-equilibrium condensation in nozzles reported in the literature. Therefore, Moore’s nozzle geometry “B” [4], as shown in Figure 1, has been employed to study the condensation of moist air in transonic flows. Due to the symmetry of the nozzle, half of the nozzle was selected as the calculation area. The results of the two-dimensional model and three-dimensional model were quite similar [29]. All the simulations conducted in the present research were two-dimensional with consideration of simulation efficiency.
Structured mesh was used to divide the computational domain. The X by Y high-quality mesh was further refined in the boundary layer of the nozzle wall, as shown in Figure 2. According to the analysis of mesh independent tests, approximately 15,000 cells were used for the numerical simulation.
To validate the performance of the numerical model for the Laval nozzle, the conditions of Moore et al.’s experimental data were selected: 25 kPa inlet pressure, 2.5 kPa outlet pressure, and 357.6 K inlet temperature. Figure 3 shows that the numerical results are in excellent agreement with the experimental data taken along the nozzle centerline. The validation provides a foundation for using the numerical model to study non-equilibrium condensation of the moist air in transonic flow.

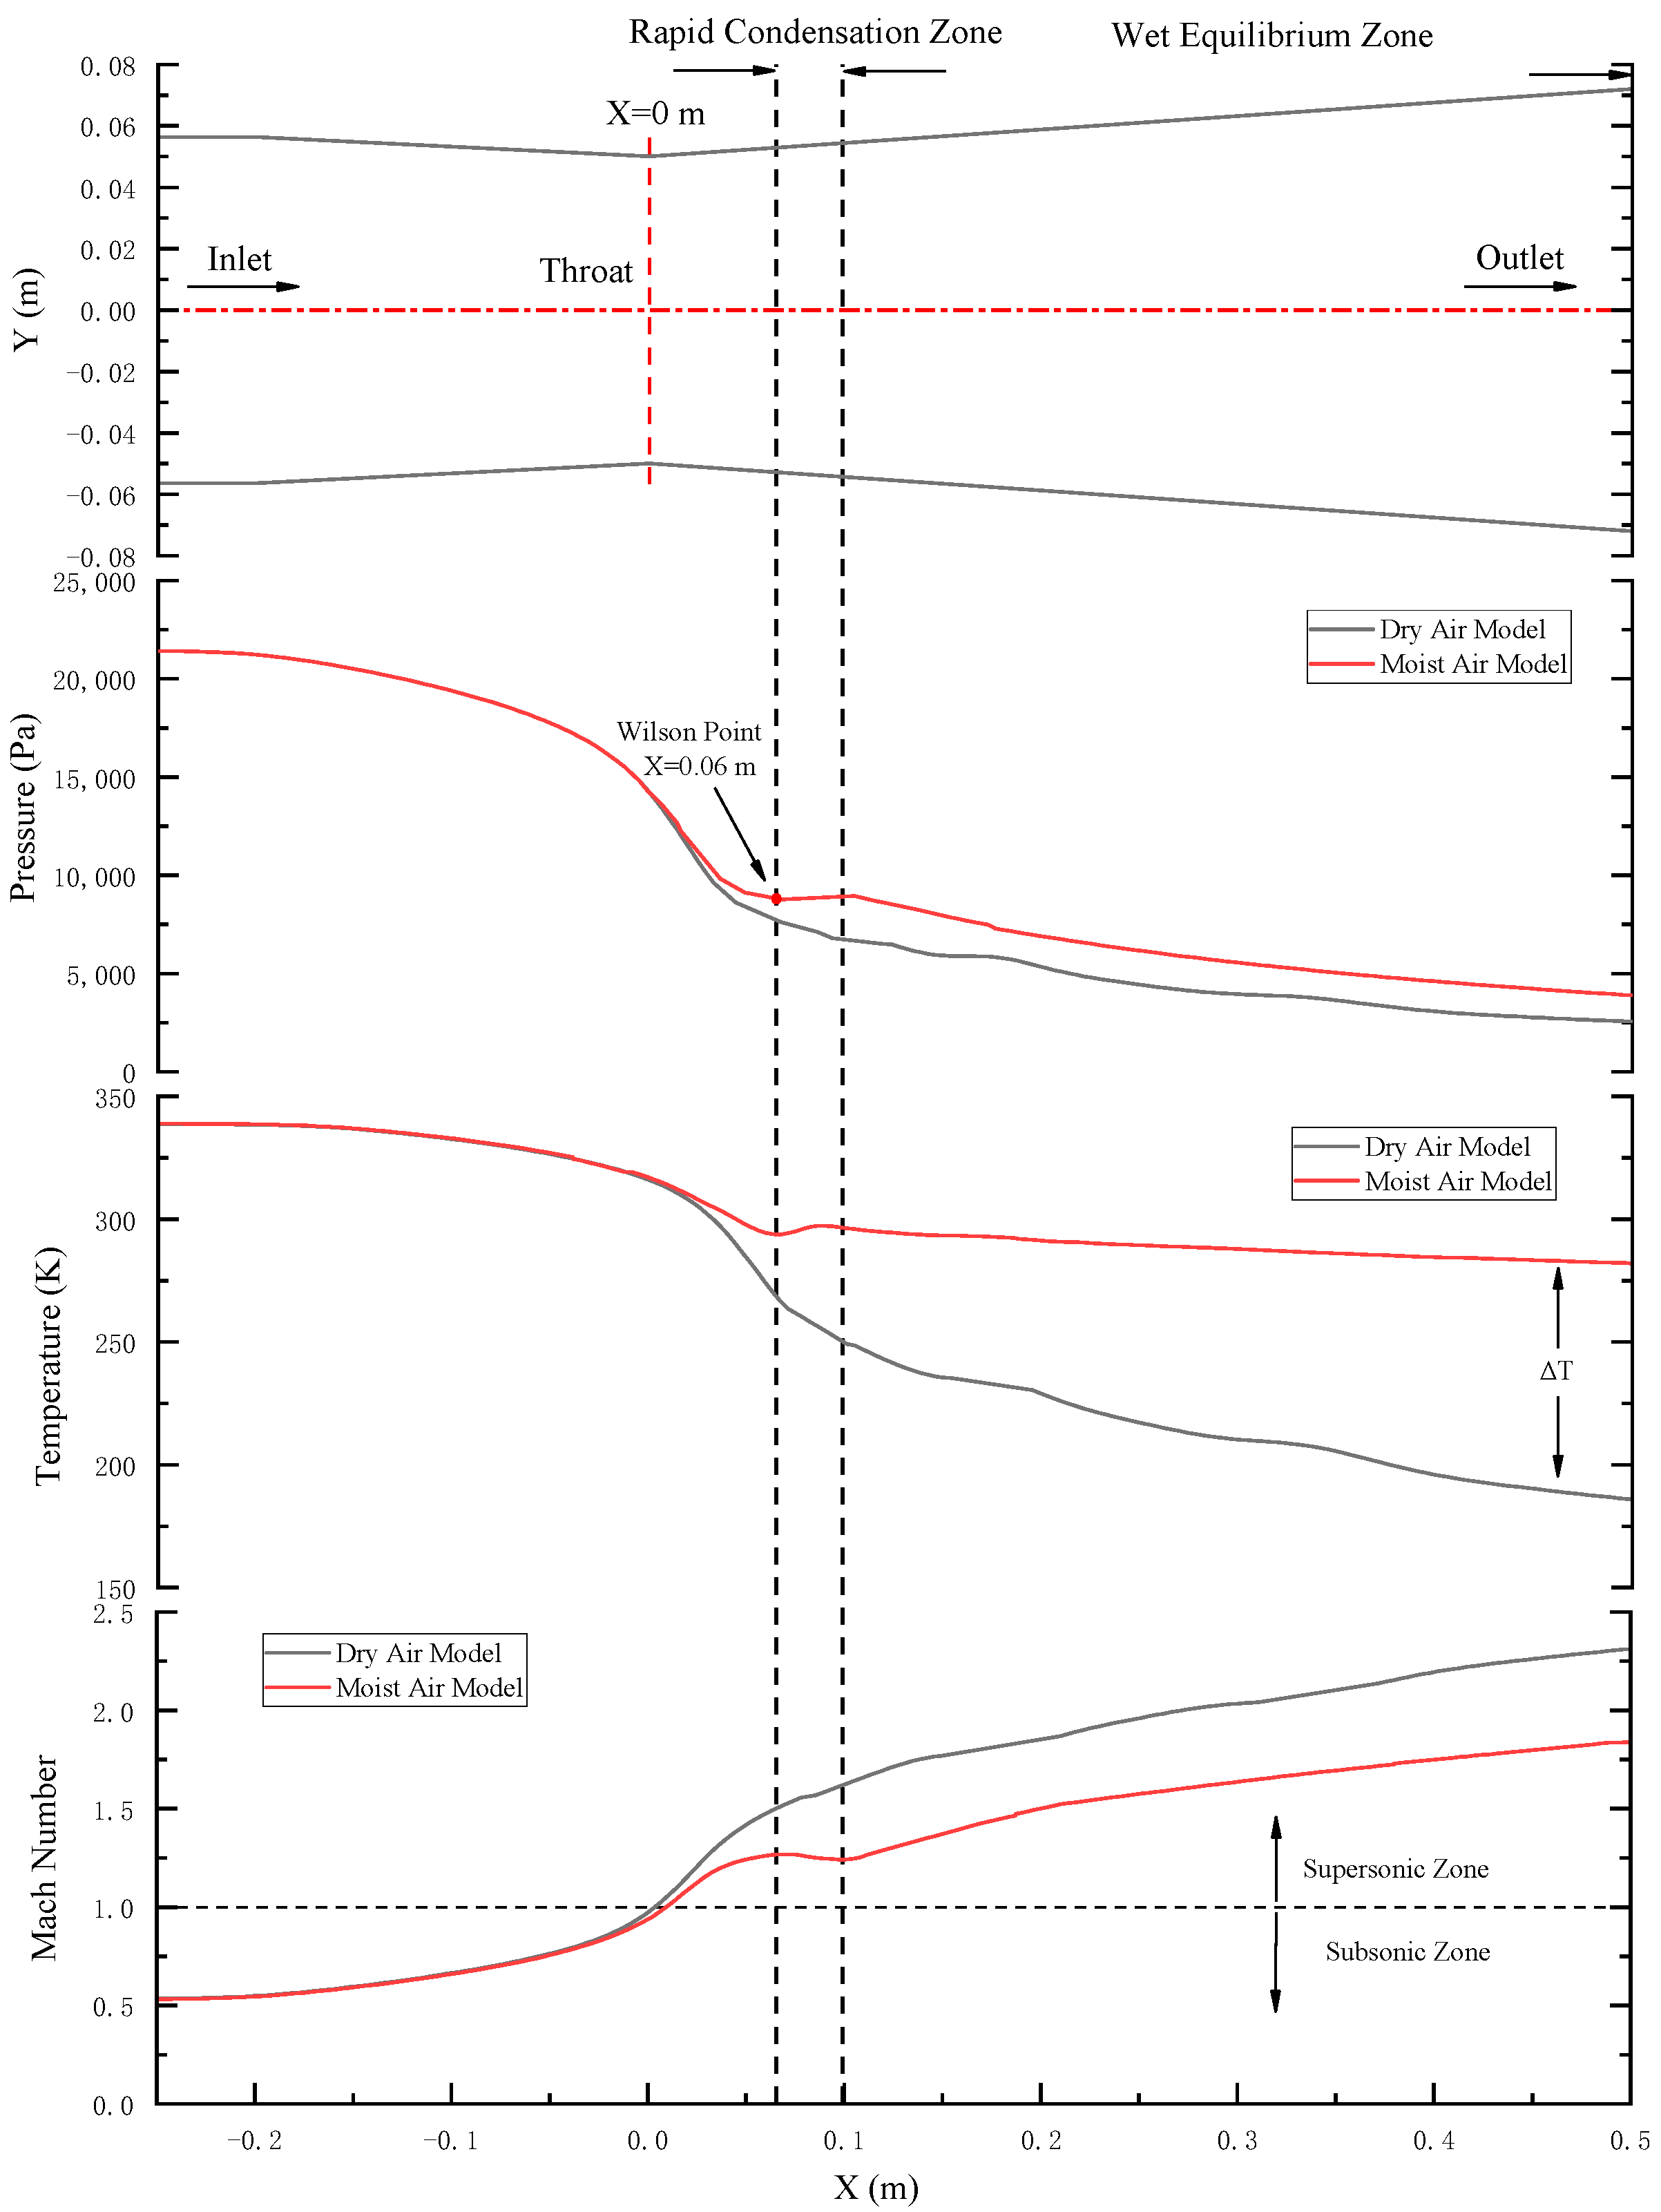
3.2. Performance of Dry Air and Moist Air in a Transonic Flow System

Figure 4 presents the comparison results of pressure, temperature, and Mach number of dry air and moist air (100% relative humidity) along the Laval nozzle centerline under an inlet pressure of 25 kPa and an inlet temperature of 357.6 K.
According to the vapor transonic non-equilibrium condensation theory [11] applied to the Laval nozzle, condensation occurs at the location behind the nozzle throat. When superheated moist air enters the nozzle at subsonic speed and is expanded, the pressure and temperature decrease rapidly, the Mach number increases dramatically, and then reaches the sonic speed at the throat. Under the condition of rapid expansion, moist air reaches the Wilson point and non-equilibrium condensation occurs. Downstream, the flow state gradually returns to the thermodynamic equilibrium state, and the two-phase flow continues to expand without condensation occurring.
Pressure is an important flow property in the nozzle, which can reflect the position and intensity change of condensation shock by an abrupt jump in pressure along the axis. Figure 4 shows that the pressure for dry air is 2.56 kPa at the nozzle exit, while that for the moist air is 3.90 kPa. The outlet pressure predicted by the dry air model is 34% smaller than that predicted by the moist air model. This differential pressure comes from the sudden condensation that occurs when the supersaturation limit point is reached due to rapid expansion. A large amount of latent heat released by condensation increases the temperature of the surrounding fluid, consequently leading to condensation shock waves and increased pressure.
As shown in Figure 4, a large temperature difference is observed between the two models after the throat. The temperature after condensing is much higher than that of non-condensing flow. At the exit of the nozzle, the temperature of the dry air case is 186.1 K, while that of moist air case is 281.4 K—significantly above the triple point of 273.15 K. The outlet temperature of the dry air case is 34% lower than that of the moist air case. This is due to the fact that after condensation of the water vapor, the droplets release a large amount of latent heat, which heats the mainstream mixture phase, resulting in a higher temperature in the nozzle. In addition, the temperature plot in Figure 4 demonstrates that the condensation of water vapor occurs instantaneously. After the condensation shock wave, the temperature still decreases monotonically along the flow direction, which indicates that the contribution of condensation latent heat released during droplet growth is not enough to meet the energy requirement of the expansion along the nozzle. Nevertheless the temperature reduction of moist air is obviously smaller than that of dry air. The difference ΔT between the calculated temperatures of the two models becomes greater and greater. Accordingly, the influence of vapor condensation on the temperature change in a transonic flow system cannot be ignored.
As shown in Figure 4, the Mach number distributions predicted by the two models both reach sonic speed at the nozzle throat. The largest slope of the Mach number curve is found at the throat of the nozzle where the largest velocity change rate is reached and the pressure decreases rapidly. The instantaneous release of condensation latent heat result increases the Mach number rapidly in a short period of time. The two Mach number curves increase gradually after the throat of the nozzle. The Mach number of dry air case is 19% higher than that of moist air case at the exit of the nozzle.
These data show that the moist air condensation process releases a lot of latent heat, which maintains the pressure, increases the temperature, and reduces the Mach number of the flow.

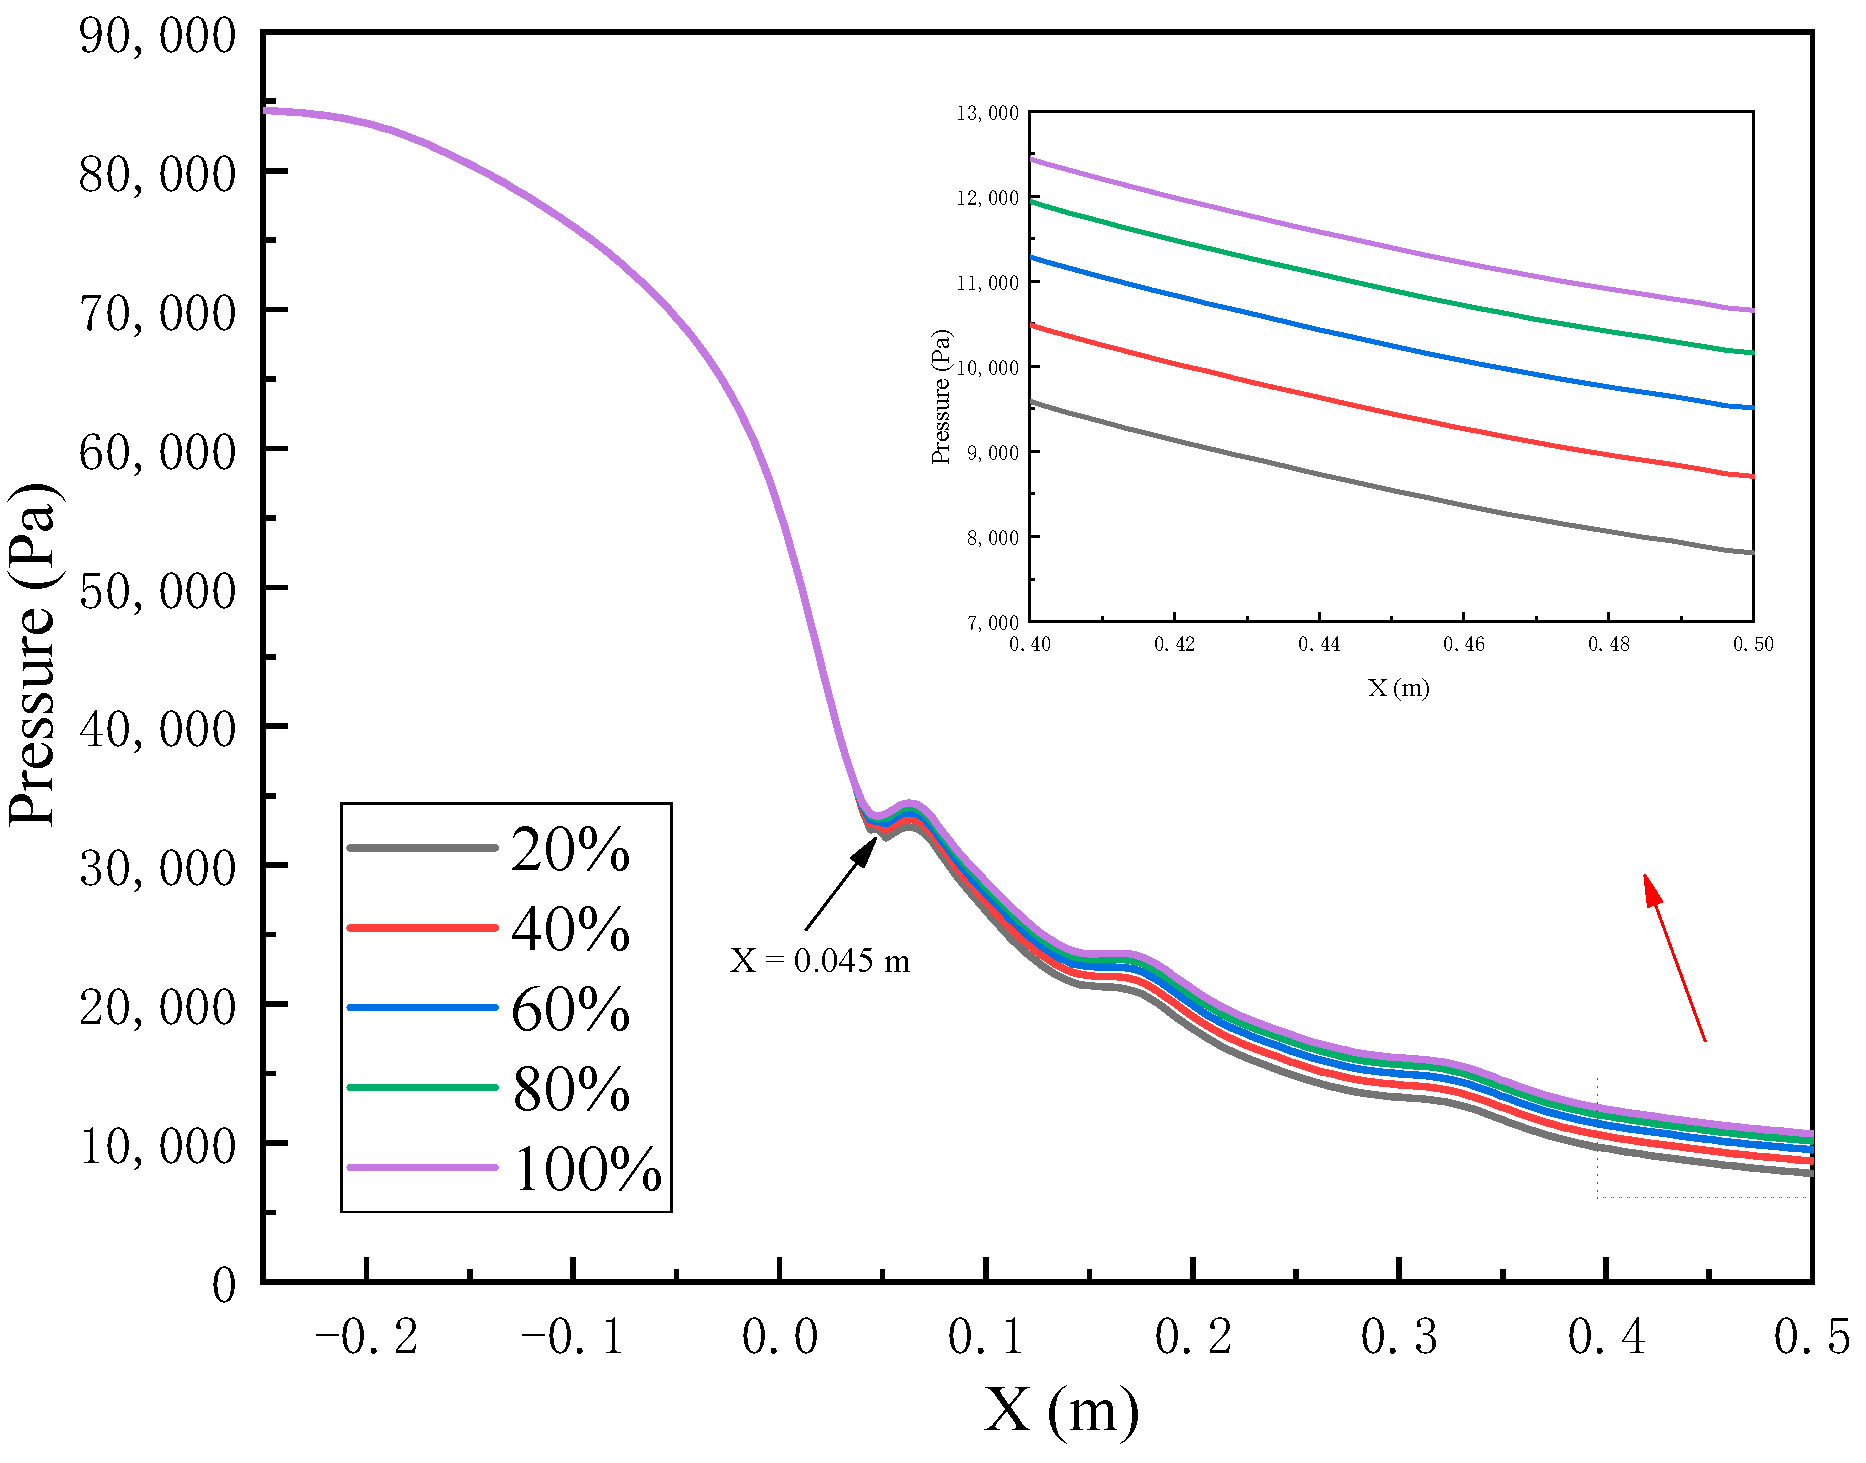
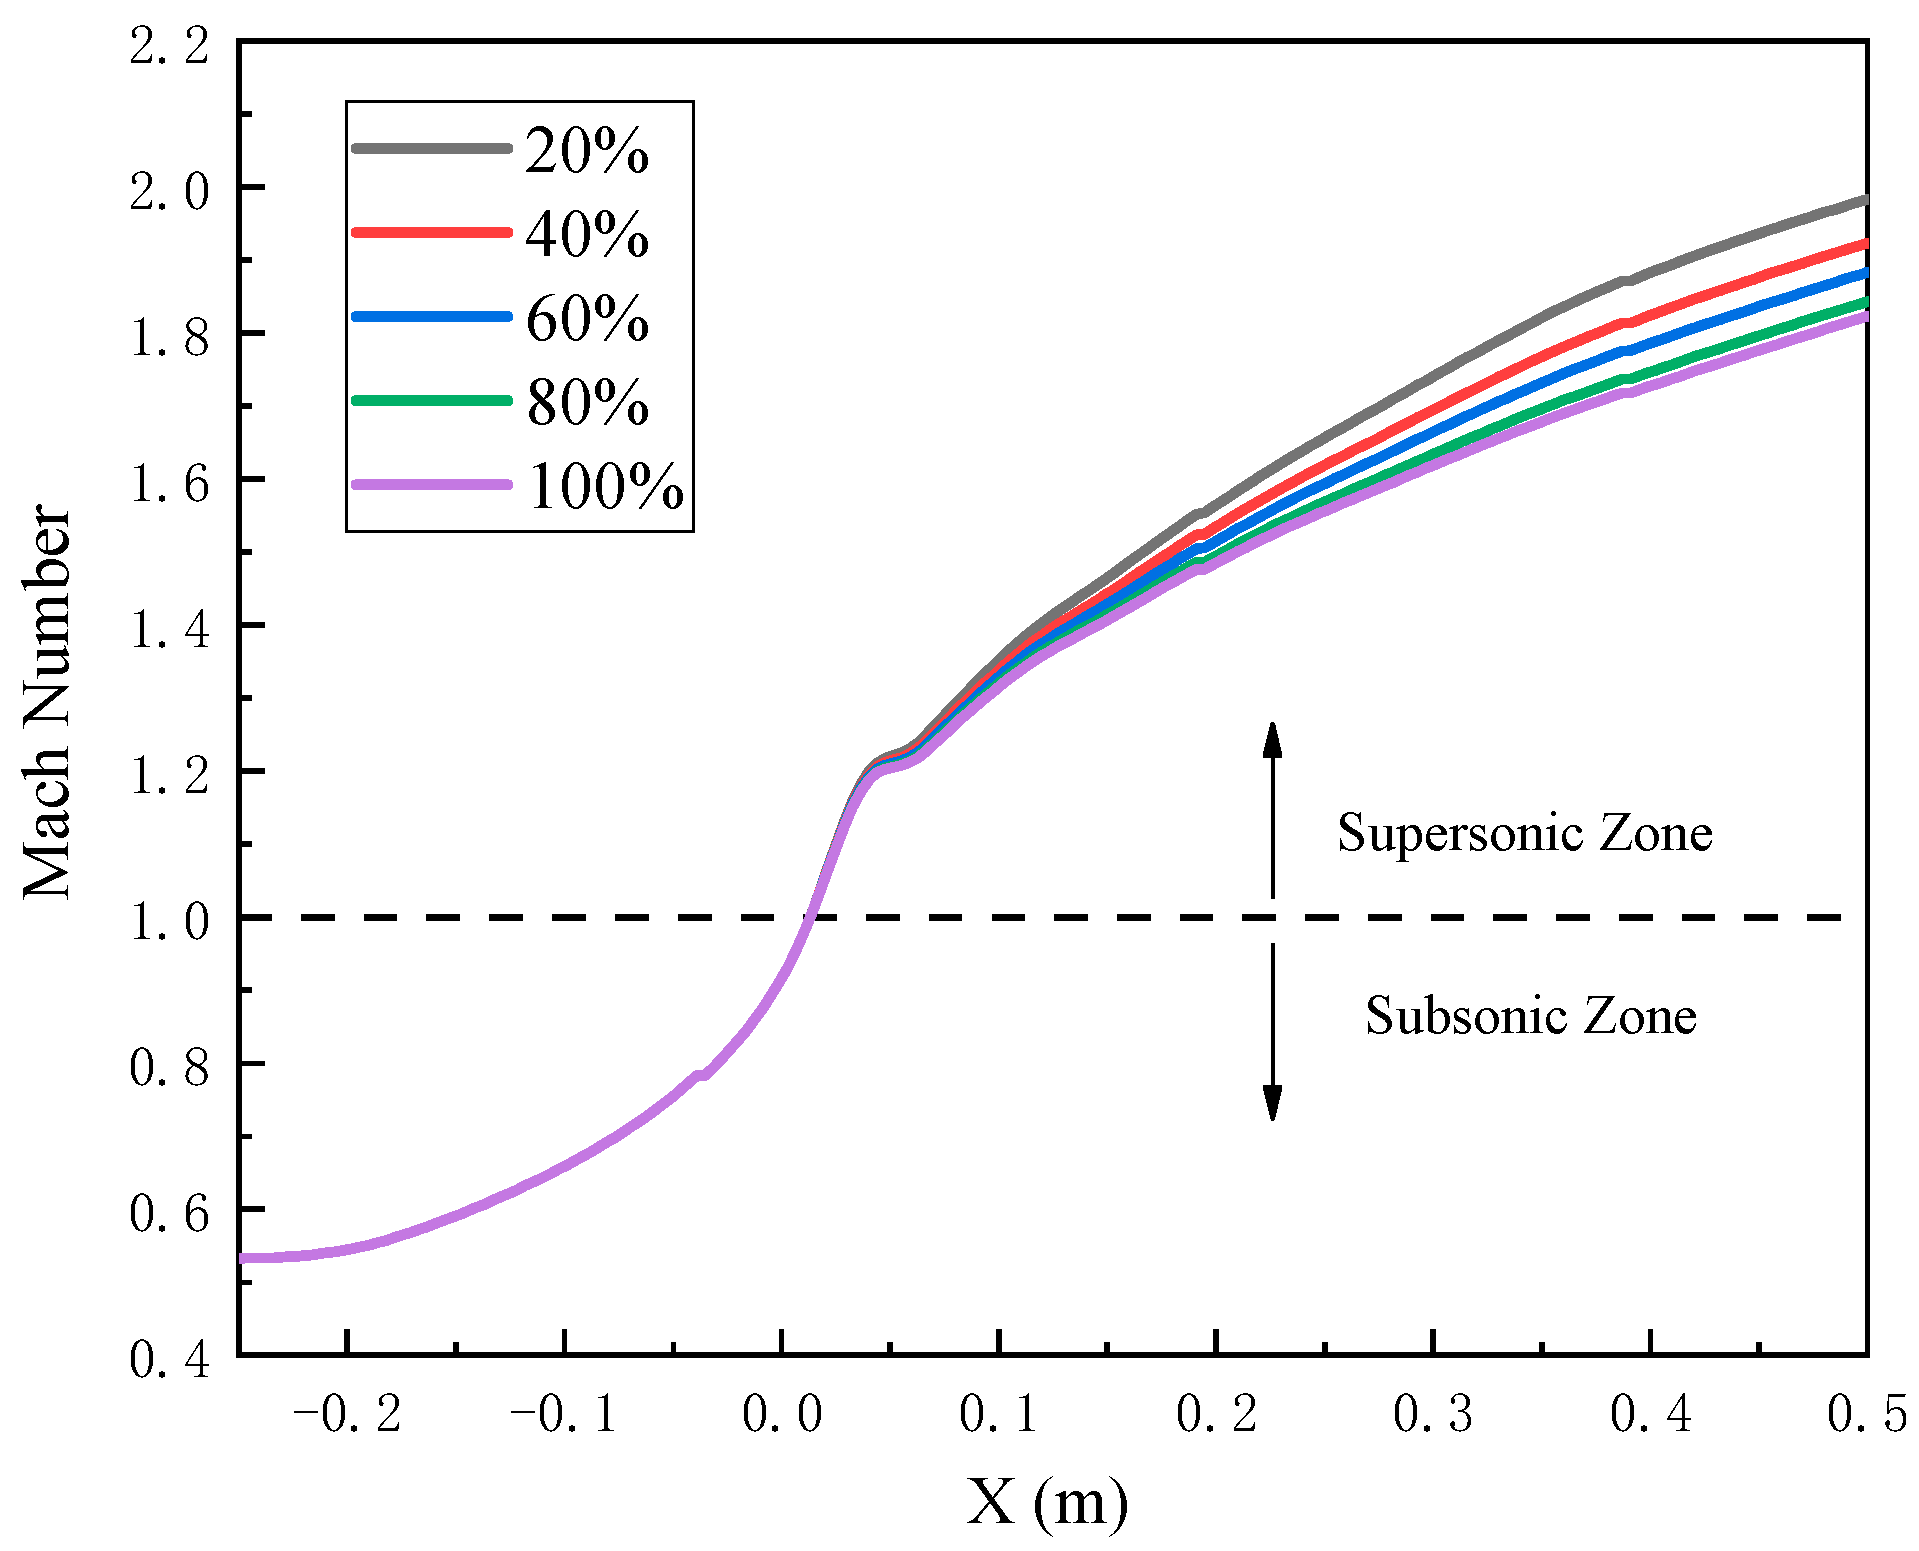
3.3. Effect of Relative Air Humidity on the Condensation Characteristic of Moist Air

With an inlet pressure of 101.325 kPa and an inlet temperature of 313.75 K with the supersonic outlet condition, Figure 5, Figure 6, Figure 7, Figure 8, Figure 9, Figure 10 show the predicted profiles of pressure, Mach number, temperature, liquid mass fraction, nucleation rate, and droplets per unit volume, respectively, for different relative humidity values of the inlet moist air along the Laval nozzle centerline.
The pressure at the exit of the nozzle increases with increasing relative humidity of the inlet moist air, as shown in Figure 5. The 100% humidity case has an exit pressure about 3 kPa higher than that of the 20% humidity case. The position of the Wilson point keeps good consistency for different relative humidity levels, which is located at x = 0.045 m. The effect of the relative humidity ratio on the Mach number profiles through the nozzle is shown in Figure 6. As the relative air humidity increases from 20% to 100%, the Mach number of the nozzle exit decreases from 2.00 to 1.83. Figure 7 shows that, while there is little change in temperature before the nozzle throat, an abrupt change occurs after the nozzle throat, due to the condensation shock waves. The temperature of nozzle exit gradually decreases from 246.1 to 206.9 K as the relative air humidity decreases from 100% to 20%.
In summary, an increase in relative humidity can cause an increase in the intensity of the condensation shock, which changes the properties at the Laval nozzle exit. The position of the Wilson point keeps good consistency for different relative humidity levels.
The nucleation phenomenon occurs with a small nucleation rate, both droplet number and liquid mass fraction have subtle changes. As the moist air supercooling increases, the nucleation rate increases rapidly until the moist air supercooling reaches its maximum, meanwhile, the nucleation rate reaches its maximum at the Wilson point. After the Wilson point, although the number of droplets remains constant, the droplet radius increases rapidly to restore moist air to an equilibrium state.
Figure 8 illustrates the nucleation rate distribution for different relative humidity levels. As seen from Figure 8, the zone of droplet nucleation is stretched, and the peak of nucleation rate is considerably increased with an increase in relative humidity. The maximum nucleation rate of 9.17 × 10²² m−3·s−1 is obtained at the relative air humidity of 100%, while at 20%, the maximum nucleation rate is an order of magnitude smaller, i.e., 1.36 × 10²¹ m−3·s−1.
The trend of droplets per unit volume versus relative humidity is shown in Figure 9. The plots show that relative air humidity has a strong impact on the condensate droplet number. In fact, the droplet number increases by a factor of 200 between the 20% and 100% relative humidity cases. Meanwhile, the positions of droplet generation keep pushing forward with an increase in relative humidity. Therefore, reducing relative humidity at the inlet of the nozzle can reduce the droplet number at the exit, especially when the inlet relative air humidity is greater than 60%.
The profiles of liquid mass fraction versus the different relative humidity levels are given in Figure 10. The liquid mass fraction increases with the increasing relative humidity of moist air. The maximum liquid mass fraction at the nozzle exit is 4.10%, when the relative air humidity is 100%; there is about an 80% decrease when the relative air humidity drops to 20%. Therefore, the difference in the relative air humidity at the Laval nozzle inlet can lead to significant differences in the properties at the Laval nozzle exit.

4. Conclusions

The phenomena and the mechanism of non-equilibrium condensation of moist air in a transonic flow system are analyzed using a CFD model of the flow with UDFs for the nucleation. On the basis of the numerical results and analytical data, the following conclusions can be drawn:
(1)
The predicted pressure profile matches the measured data reasonably well.
(2)
The comparison between the dry air model and the moist air model shows that the expansion performance of the transonic flow of moist air is greatly overpredicted by the dry air model. Compared with the moist air model, the dry air model exaggerates the Mach number by 19% and reduces both the pressure and the temperature by 34% at the nozzle exit. Therefore, condensation of moist air with non-equilibrium phenomenon in transonic flow should be considered in the design.
(3)
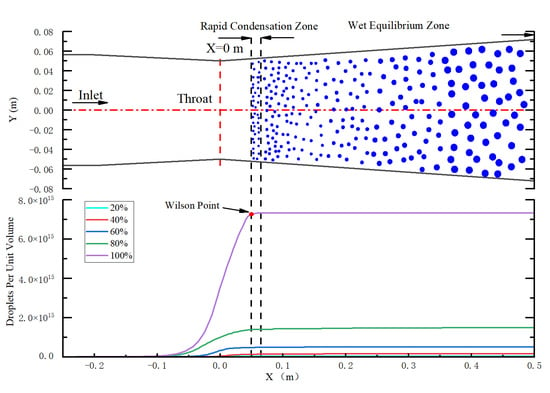
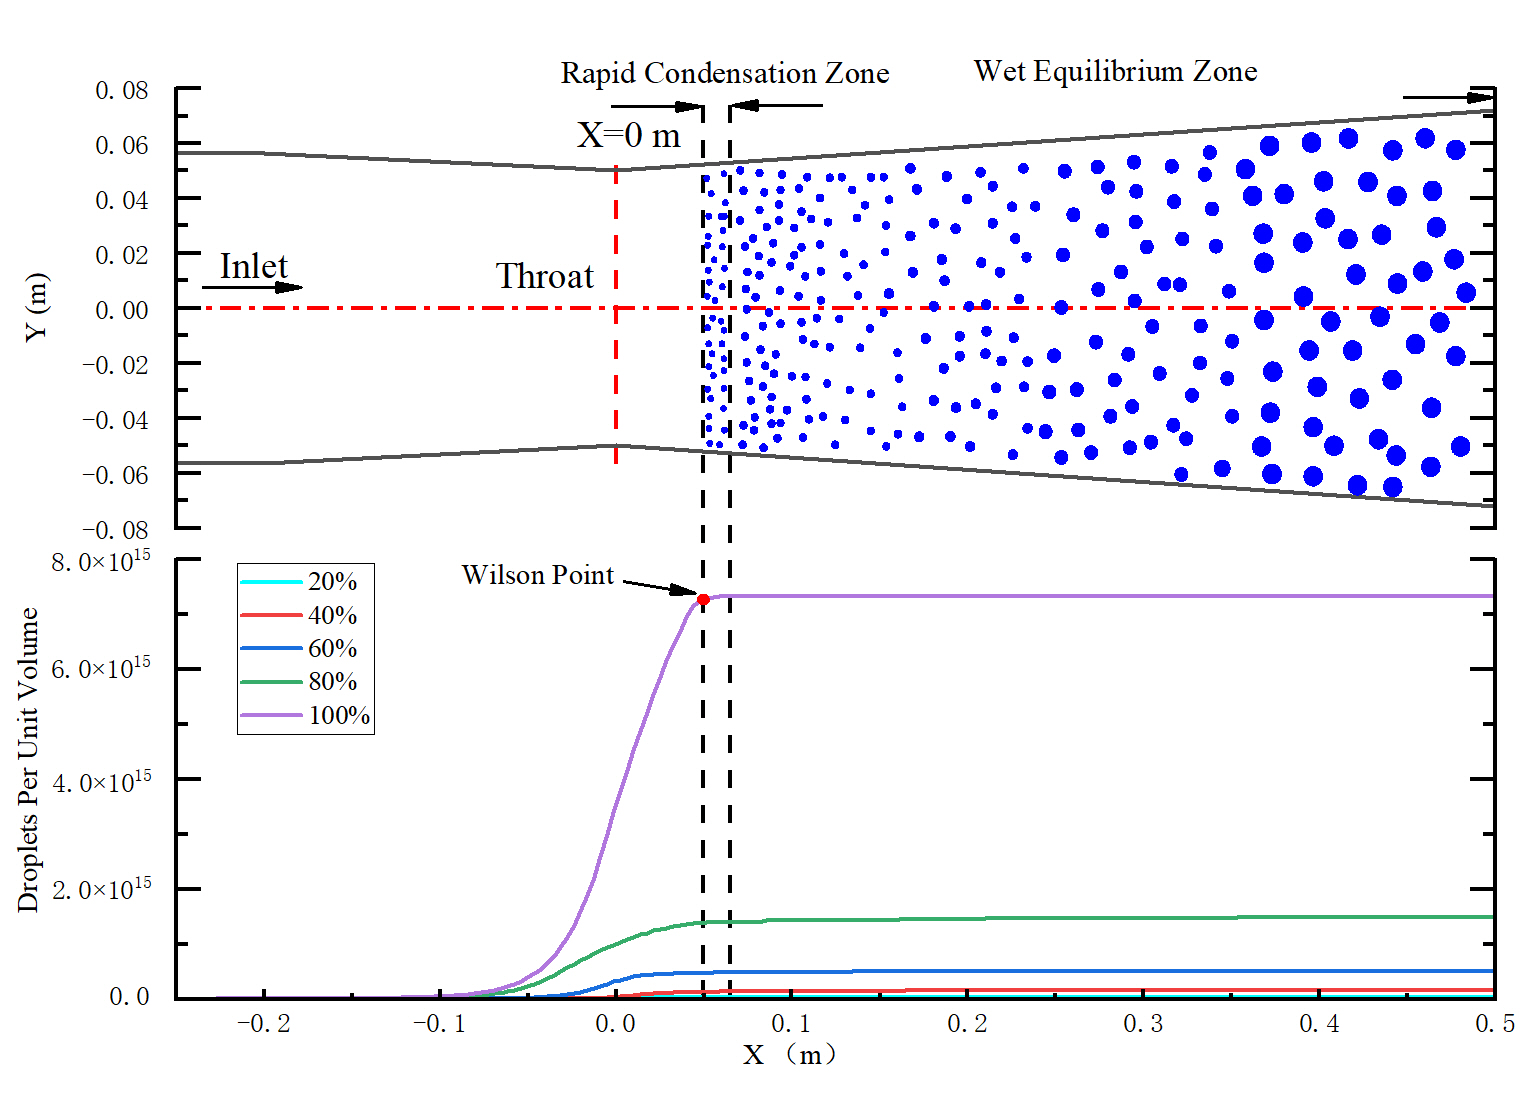
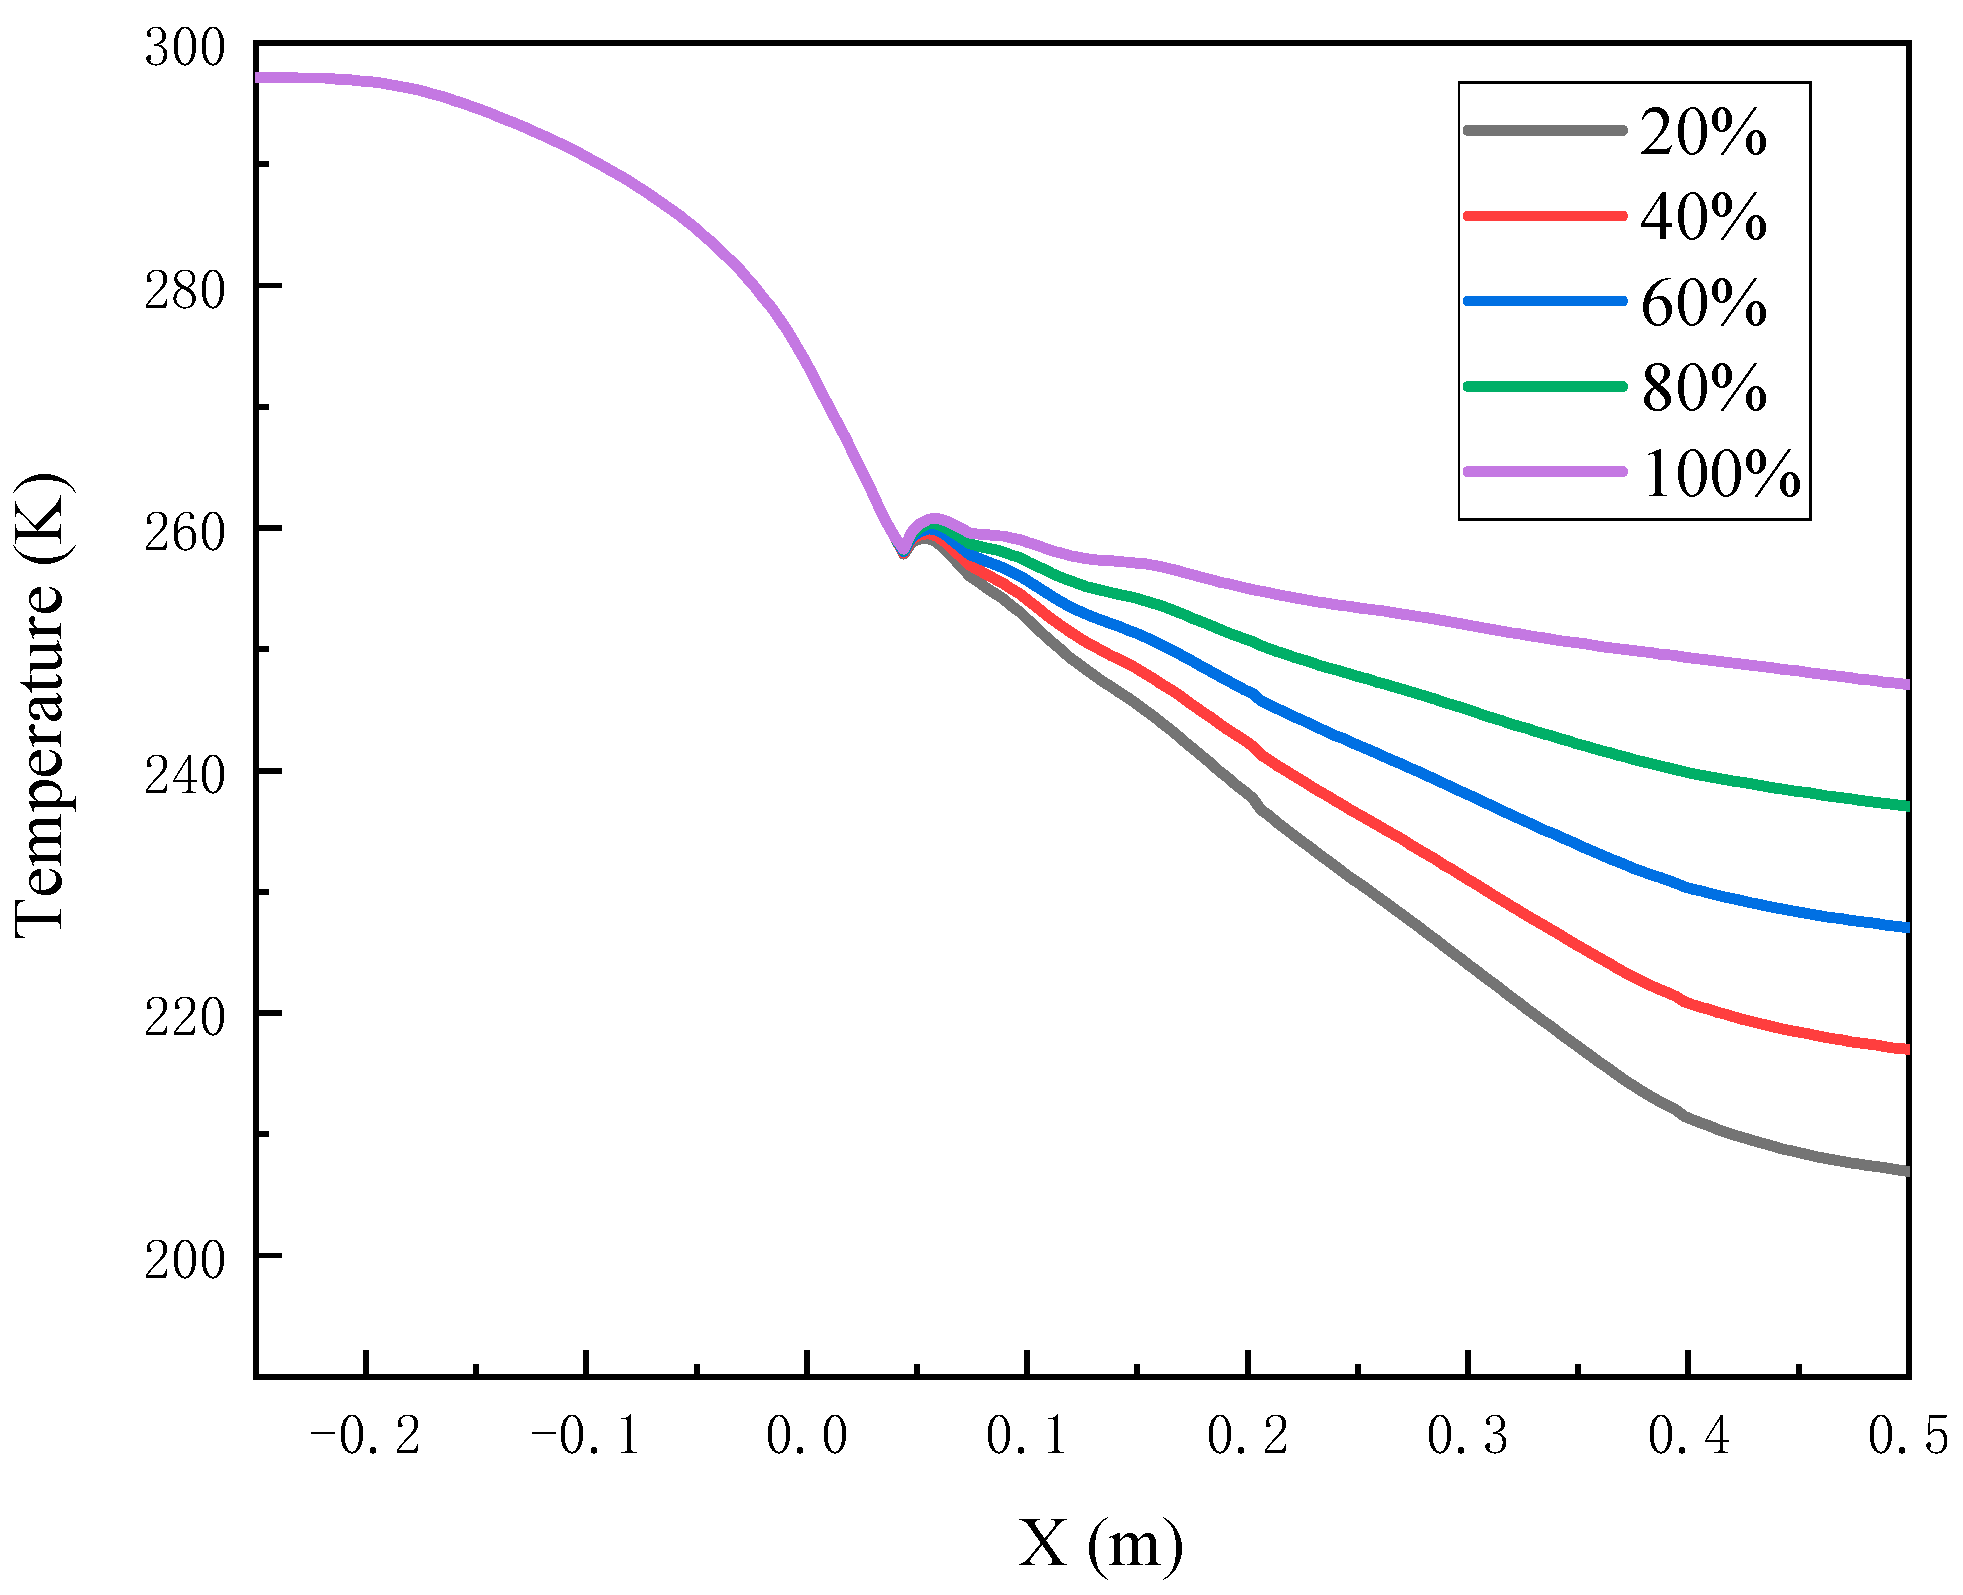
Different relative air humidity levels, at the Laval nozzle inlet, lead to significant differences in the properties at the Laval nozzle exit. At the same time, the position of the Wilson point keeps good consistency for different relative humidity levels.
(4)
An increase in the relative humidity value causes an increase in the intensity of the condensation shock. In the process of condensation, the nucleation rate of droplets increases rapidly. At the Wilson point, when the relative air humidity is 100%, the nucleation rate reaches the maximum value of 9.17 × 10²² m−3·s−1, which is 67 times that when the relative humidity is 20%.
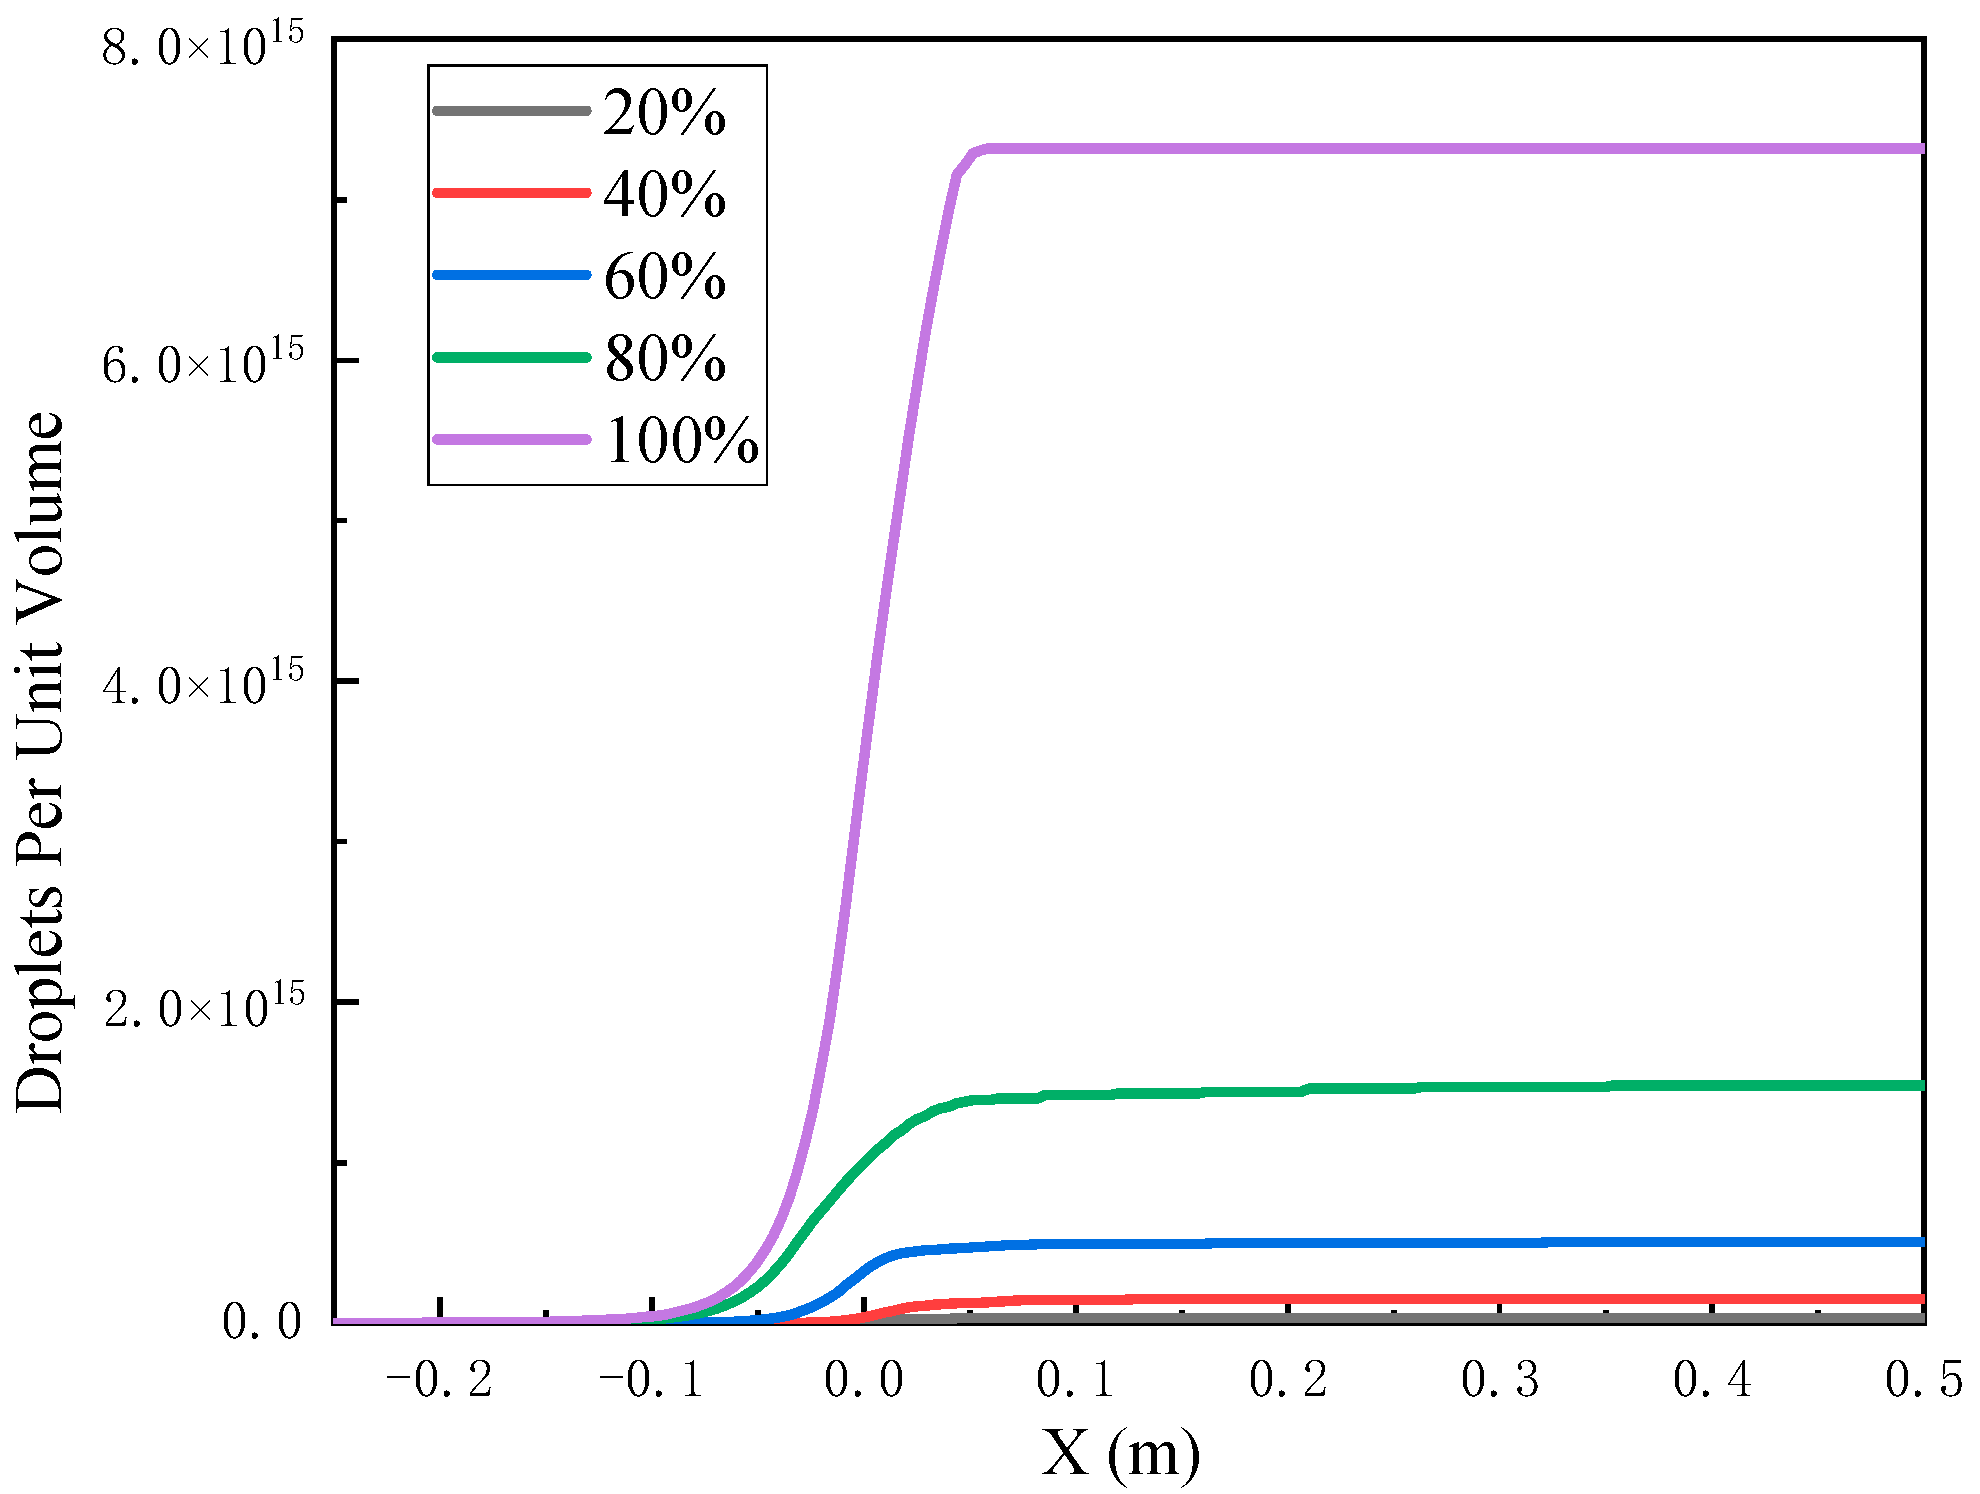
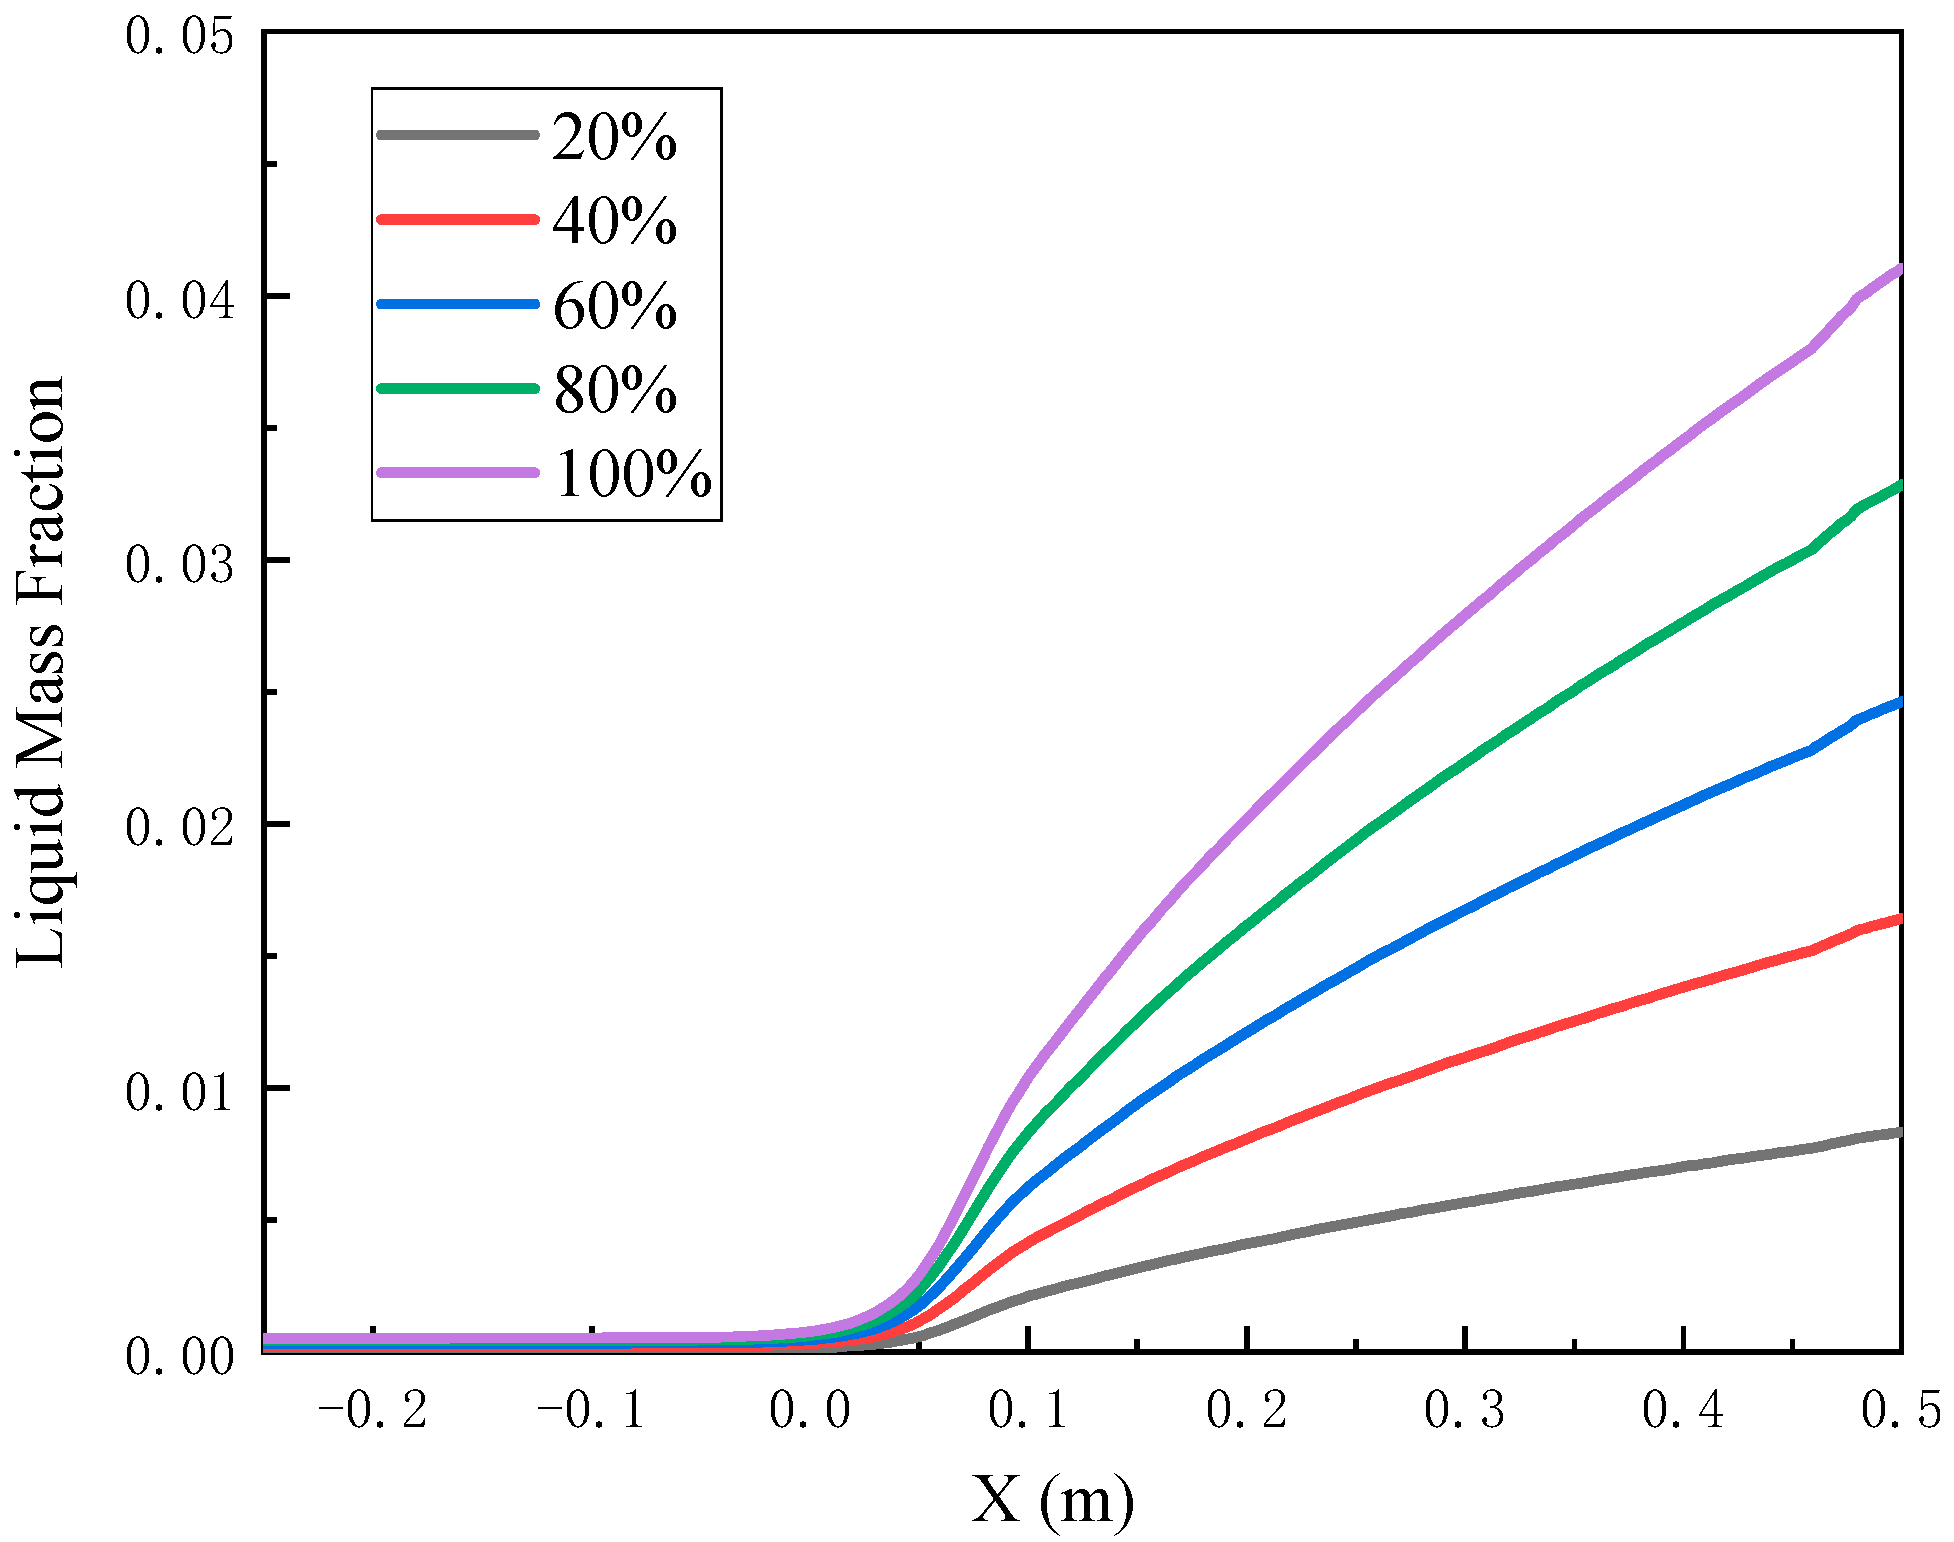
(5)
The results show that the number of condensate droplets increases rapidly when the air reaches 60% relative humidity. The condensation of moist gas in a transonic flow needs to be fully considered when the relative humidity is greater than 60%.
(6)
These findings provide theoretical guidance for the structural design and optimization of a transonic flow system in an atmospheric environment.

Author Contributions

Conceptualization, methodology, validation, formal analysis, investigation, data curation, and writing—original draft preparation, J.W.; writing—review and editing, supervision, project administration, H.G. All authors have read and agreed to the published version of the manuscript.

Funding

This research received no external funding.

Institutional Review Board Statement

Not applicable.

Informed Consent Statement

Not applicable.

Data Availability Statement

The data used to support the findings of this study are available from the corresponding author upon request.

Acknowledgments

Our deepest gratitude goes to the anonymous reviewers for their careful work and thoughtful suggestions that have helped improve this paper substantially.

Conflicts of Interest

The authors declare no conflict of interest.

References

  1. Schnerr, G.H. Transonic flow with energy supply by homogeneous condensation: Onset condition and 2-D structure of steady Laval nozzle flow. Exp. Fluids 1988, 7, 145–156. [Google Scholar] [CrossRef]
  2. Hill, P.G. Condensation of water vapour during supersonic expansion in nozzles. J. Fluid Mech. 1966, 25, 593–620. [Google Scholar] [CrossRef]
  3. Anisimov, M.P.; Fominykh, E.G.; Akimov, S.V.; Hopke, P.K. Vapor–gas/liquid nucleation experiments: A review of the challenges. J. Aerosol Sci. 2009, 40, 733–746. [Google Scholar] [CrossRef]
  4. Moore, M.J.; Walters, P.T.; Crane, R.I.; Davidson, B.J. Predicting the fog drop size in wet steam turbines. In Proceedings of the Wet Steam 4 Conference, University of Warwick, Coventry, UK, 3–5 April 1973. [Google Scholar]
  5. Pouring, A.A. An Experimental and Analytic Investigation of Homogeneous Condensation of Water Vapor in Air During Rapid Expansions. Ph.D. Thesis, Yale University, New Haven, CT, USA, 1963. [Google Scholar]
  6. Peters, F.; Meyer, K.A.J. Measurement and interpretation of growth of monodispersed water droplets suspended in pure vapor. Int. J. Heat Mass Transf. 1995, 38, 3285–3293. [Google Scholar] [CrossRef]
  7. Sharifi, N.; Sharifi, M. Reducing energy consumption of a steam ejector through experimental optimization of the nozzle geometry. Energy 2014, 66, 860–867. [Google Scholar] [CrossRef]
  8. Ding, H.; Wang, C.; Zhao, Y. An analytical method for Wilson point in nozzle flow with homogeneous nucleating. Int. J. Heat Mass Transf. 2014, 73, 586–594. [Google Scholar] [CrossRef]
  9. Tang, Y.; Liu, Z.; Shi, C.; Li, Y. A novel steam ejector with pressure regulation to dredge the blocked entrained flow for performance improvement in MED-TVC desalination system. Energy Convers. Manag. 2018, 172, 237–247. [Google Scholar] [CrossRef]
  10. Sriveerakul, T.; Aphornratana, S.; Chunnanond, K. Performance prediction of steam ejector using computational fluid dynamics: Part 1. Validation of the CFD results. Int. J. Therm. Sci. 2007, 46, 812–822. [Google Scholar] [CrossRef]
  11. Han, Y.; Wang, X.; Sun, H.; Zhang, G.; Guo, L.; Tu, J. CFD simulation on the boundary layer separation in the steam ejector and its influence on the pumping performance. Energy 2019, 167, 469–483. [Google Scholar] [CrossRef]
  12. Yang, Y.; Shen, S. Numerical simulation on non-equilibrium spontaneous condensation in supersonic steam flow. Int. Commun. Heat Mass Transf. 2009, 36, 902–907. [Google Scholar] [CrossRef]
  13. Yang, Y.; Zhu, X.; Yan, Y.; Ding, H.; Wen, C. Performance of supersonic steam ejectors considering the nonequilibrium condensation phenomenon for efficient energy utilisation. Appl. Energy 2019, 242, 157–167. [Google Scholar] [CrossRef] [Green Version]
  14. Benson, G.C.; Shuttleworth, R. The surface energy of small nuclei. J. Chem. Phys. 1951, 19, 130–131. [Google Scholar] [CrossRef]
  15. Han, X.; Han, Z.; Zeng, W.; Qian, J.; Wang, Z. Coupled Model of Heat and Mass Balance for Droplet Growth in Wet Steam Non-Equilibrium Homogeneous Condensation Flow. Energies 2017, 10, 2033. [Google Scholar] [CrossRef] [Green Version]
  16. Zhang, G.; Zhang, X.; Wang, F.; Wang, D.; Jin, Z. The relationship between the nucleation process and boundary conditions on non-equilibrium condensing flow based on the modified model. Int. J. Multiph. Flow 2019, 114, 180–191. [Google Scholar] [CrossRef]
  17. Zhang, G.; Zhang, X.; Wang, F.; Wang, D.; Jin, Z.; Zhou, Z. Design and optimization of novel dehumidification strategies based on modified nucleation model in three-dimensional cascade. Energy 2019, 187, 115982. [Google Scholar] [CrossRef]
  18. Zhang, G.; Dykas, S.; Yang, S.; Zhang, X.; Li, H.; Wang, J. Optimization of the primary nozzle based on a modified condensation model in a steam ejector. Appl. Therm. Eng. 2020, 171, 115090. [Google Scholar] [CrossRef]
  19. Zhang, G.; Zhang, X.; Wang, D.; Jin, Z.; Qin, X. Performance evaluation and operation optimization of the steam ejector based on modified model. Appl. Therm. Eng. 2019, 163, 114388. [Google Scholar] [CrossRef]
  20. Dykas, S.; Majkut, M.; Smołka, K. Influence of air humidity on transonic flows with weak shock waves. J. Therm. Sci. 2019, 29, 1551–1557. [Google Scholar] [CrossRef] [Green Version]
  21. Patchell, W.H.; Carnegie, A.Q.; Chattock, R.A.; Guy, H.L.; Fedden, S.E.; Pochobradsky, B.; Kaula, R.J.; Samuelson, F.; Baumann, K.; Stoney, G. Some recent developments in large steam turbine practice. J. Inst. Electr. Eng. 1921, 59, 565–623. [Google Scholar] [CrossRef]
  22. Wiśniewski, P.; Dykas, S.; Yamamoto, S.; Pritz, B. Numerical approaches for moist air condensing flows modelling in the transonic regime. Int. J. Heat Mass Transf. 2020, 162, 120392. [Google Scholar] [CrossRef]
  23. Wiśniewski, P.; Dykas, S.; Yamamoto, S. Importance of air humidity and contaminations in the internal and external transonic flows. Energies 2020, 13, 3153. [Google Scholar] [CrossRef]
  24. Ding, H.; Wang, C.; Chen, C. Non-equilibrium condensation process of water vapor in moist air expansion through a sonic nozzle. Flow Meas. Instrum. 2014, 40, 238–246. [Google Scholar] [CrossRef]
  25. Sun, W.; Niu, L.; Chen, L.; Chen, S.; Zhang, X.; Hou, Y. Numerical study on the spontaneous condensation flow in an air cryogenic turbo-expander using equilibrium and non-equilibrium models. Cryogenics 2016, 73, 42–52. [Google Scholar] [CrossRef]
  26. Girshick, S.L.; Chiu, C.P. Kinetic nucleation theory: A new expression for the rate of homogeneous nucleation from an ideal supersaturated vapor. J. Chem. Phys. 1990, 93, 1273–1277. [Google Scholar] [CrossRef]
  27. Xu, T.; Huang, Y. Development of experimental device for spontaneous condensation of supersaturated water vapor and determination of Wilson position of actual flow. J. Xi’an Jiaotong Univ. 1984, 4, 56–68. [Google Scholar]
  28. Frenkel, J. Kinetic Theory of Liquids; The Clarendon Press: Oxford, UK, 1946. [Google Scholar]
  29. Wang, C.; Wang, L.; Zhao, H.; Du, Z.; Ding, Z. Effects of superheated steam on non-equilibrium condensation in ejector primary nozzle. Int. J. Refrig. 2016, 67, 214–226. [Google Scholar] [CrossRef]
Figure 1. Diagram of the Moore type “B” Laval nozzle.
Energies 14 04052 g001
Figure 2. Moore type “B” nozzle meshing.
Energies 14 04052 g002
Figure 3. Pressure distribution along the Moore type “B” nozzle centerline as compared with experimental data (Moore et al. [4]).
Energies 14 04052 g003
Figure 4. Pressure, temperature and Mach number distribution along the Moore type “B” nozzle centerline.
Energies 14 04052 g004
Figure 5. Pressure profile along the Moore type “B” nozzle centerline for several relative air humidity levels.
Energies 14 04052 g005
Figure 6. Mach number profile along the Moore type “B” nozzle centerline for several relative air humidity levels.
Energies 14 04052 g006
Figure 7. Temperature distribution along the Moore type “B” nozzle centerline for several relative air humidity levels.
Energies 14 04052 g007
Figure 8. Nucleation rate distribution for several relative air humidity ratios along the Moore type “B” nozzle centerline.
Energies 14 04052 g008
Figure 9. Droplets per unit volume distribution along the Moore type “B” nozzle centerline for several relative air humidity levels.
Energies 14 04052 g009
Figure 10. Liquid mass fraction distribution along the Moore type “B” nozzle centerline for several relative air humidity levels.
Energies 14 04052 g010
Publisher’s Note: MDPI stays neutral with regard to jurisdictional claims in published maps and institutional affiliations.

