Article

Reactivity Effect Evaluation of Fast Reactor Based on Angular-Dependent Few-Group Cross Sections Generation

School of Nuclear Science and Technology, Xi’an Jiaotong University, Xi’an 710049, China
*
Author to whom correspondence should be addressed.
Energies 2021, 14(13), 4042; https://doi.org/10.3390/en14134042
Submission received: 29 May 2021 / Revised: 30 June 2021 / Accepted: 2 July 2021 / Published: 4 July 2021
(This article belongs to the Special Issue Computational Techniques of Nuclear Reactor Physics)

Abstract

:
Among all the possible occurring reactivity effects of a fast reactor, the situations whereby the control rod was inserted, or the coolant was voided could lead to strong anisotropy of neutron flux distribution, therefore the angular dependence on neutron flux should be considered during the few-group cross-sections generation. Therefore, the purpose of this paper is to compare the influence whether the angular dependence on neutron flux is considered in the calculation of few-group cross sections for the reactivity effect calculation. In the study, the 1-D SN finite difference neutron transport equation solver was implemented in the TULIP of SARAX code system so that the high-order neutron flux could be obtained. Meanwhile, the improved Tone’s method was also applied. The numerical results were obtained based on three experimental FR cores, the JOYO MK-I core, ZPPR-9 core, and ZPPR-10B core. Both control rod worth and sodium void reactivity were calculated and compared with the measurement data. By summarizing and comparing the results of 46 cases, significant differences were found between different consideration of the neutronic analysis. The consideration of angular dependence on neutron flux distribution in the few-group cross-sections generation was beneficial to the neutronic design analysis of FR, especially for the reactivity effect calculation.

1. Introduction

Fast reactors (FR), including the sodium-cooled fast reactor, the gas-cooled fast reactor, and the lead-cooled fast reactor, are the main candidates in developing the next generation of advanced nuclear reactor. The research and development of FR are based on the neutronic numerical analysis. Since the two-step method is still the mainstream for the design work, noticeable progress of code development has been made around the world. In the two-step method, the few-group cross sections of each material were obtained through assembly-wise transport calculation. Then the power distribution of 3-D core was calculated by solving the 3-D neutron transport/diffusion equation with obtained few-group cross sections.
Considering that the neutron behavior of FR is quite different from the light water reactor, many codes for FR calculation specifically have been developed. Owing to the long mean free path of fast neutron, the equivalent 1-D assembly model is applied to take the heterogeneity effect into account during the calculation of few-group cross sections. As a result, the energy group could be divided into thousands of groups so that the resonance could be well treated. In order to balance the efficiency, the collision probability method (CPM) is widely used, such as ECCO [1], MC2-3 [2], and SLAROM-UF [3].
In the two-step calculation of FR, the neutron flux is used as weight function in order to get the few-group cross sections. According to the homogenization theory, the anisotropy of neutron flux could be well treated by using the angular neutron flux weighted total cross sections and scattering matrices [4,5]. However, in the derivation of CPM, the isotropic assumption of the scattering and fission source term was applied so that only the neutron scalar flux could be obtained. When facing problems with obvious anisotropic neutron flux distribution, such as the coolant void case or control rod insertion case, such an assumption of CPM could introduce significant differences. In order to solve this problem, the neutron transport equation with anisotropic scattering should be solved during the few-group cross sections calculation. The utilization of another neutron transport method could be an effective way to solve this problem, such as the SN method or the MOC method.
The SARAX code system [6], which was developed by Xi’an Jiaotong University, considers the requirements in modeling different kinds of reactors designed in China, including the critical and subcritical systems with sodium or lead as the coolant. The SARAX code consists of four parts: The cross-sections generation module TULIP [7], the reactor steady-state analysis module LAVENDER [8], the reactor transient analysis module DAISY [9], and the neutron spectrum modification and shielding design module HYDRA [10]. Many verification and validation works have been conducted during the code development stage, such as the OECD/NEA sodium-cooled fast reactors benchmark, the JOYO MK-I zero power experiments, and several assembly layouts of zero power physics reactor (ZPPR) series experiments [11,12,13].
In the original TULIP code, the CPM was also used to obtain the neutron flux. Therefore, the motivation of current study was to improve the accuracy of reactivity effect calculation, especially for the sodium void reactivity and control rod worth. In order to be compatible with current SARAX code system, the 1-D SN finite difference solver of Hydra code was implemented in the TULIP code. At the same time, the background cross sections of resonance treatment were calculated by using 1-D SN solver based on the improved Tone’s method [14], which is similar to APOLLO3 [15] or EXUS-F [16] code.
The remainder of this paper is organized as follows. Section 2 briefly describes the new development about latest TULIP code. The numerical results based on JOYO MK-I [17], ZPPR-9 [18], and ZPPR-10B [19] reactors are summarized in Section 3. The conclusion of current study is drawn in Section 4.

2. New Development in TULIP Code

Originally, the CPM was used in the TULIP code for the resonance and transport calculation. In the resonance calculation, Tone’s method [20] was applied in order to obtain region, nuclide, and energy group-wise background cross sections, as shown in Equation (1)
σ 0 , i , r , g = j k i P j r , g N k , j σ t , k V j j P j r , g N i , j V j
where σ 0 , i , r , g is the background cross section of nuclide i, region r, and group g. P j r , g is the collision probability from region j to region r of group g. N is the nuclide density and V is volume, respectively. The subscript t stands for the total cross sections.
Once the background cross sections are obtained, the group-wise escape cross sections Σ e , g , i , r and self-shielded cross sections σ ¯ x , r , i , g are calculated by using following equations under narrow resonance approximation:
Σ e , g , i , r = N i , r σ 0 , g , i , r k i Σ t , g , k , r
σ ¯ x , r , i , g = Δ E g 1 E σ x , r , i ( E ) Σ t , r ( E ) + Σ e , g , i , r d E / Δ E g 1 E 1 Σ t , r ( E ) + Σ e , g , i , r d E
After finishing the resonance calculation, the neutron flux is calculated by using 1-D CPM solver. As a consequence, the few-group cross sections are calculated with following equations:
σ ¯ x , i , G , n = g G σ ¯ x , i , g , n ϕ g , 0 g G ϕ g , 0 x = t o t a l
σ ¯ x , i , G = g G σ ¯ x , i , g ϕ g , 0 g G ϕ g , 0 x = f i s s i o n , c a p t u r e , a b s o r p t i o n
σ ¯ s , i , G G , n = g G g G σ ¯ s , i , g g , n ϕ g , 0 g G ϕ g , 0
In the above equations, the subscript n indicates the order number of Legendre polynomials, and the summation of volume is ignored. In the right-hand-side of Equations (4) and (6), the nth order expansions of the total and scattering cross sections are calculated based on the following equation.
σ ¯ x , i , g , n = Δ E g σ x , i ( E ) ϕ n + 1 ( E ) d E / Δ E g ϕ n + 1 ( E ) d E ϕ n + 1 ( E ) = 1 E 1 Σ t , r ( E ) + Σ e , g , i , r
In order to take the anisotropic neutron flux distribution into account, the 1-D SN finite difference solver was implemented in the TULIP code. Therefore, according to the improved Tone’s method, the background cross sections can be alternatively obtained with two fixed-source equations, which could be solved by using SN solver:
Ω ϕ 1 , i , g ( r , Ω ) + Σ t , g ( r ) ϕ 1 , i , g ( r , Ω ) = k i Σ t , g , k ( r ) Ω ϕ 2 , i , g ( r , Ω ) + Σ t , g ( r ) ϕ 2 , i , g ( r , Ω ) = N i ( r )
Furthermore, the background cross sections are determined by using the solution of above equations:
σ 0 , i , r , g = V r d V 4 π d Ω ϕ 1 , i , g ( r , Ω ) V r d V 4 π d Ω ϕ 2 , i , g ( r , Ω ) = ϕ 1 , i , r , g ϕ 2 , i , r , g
By solving neutron transport equation with 1-D SN solver, the angular neutron flux could be obtained, and the Equations (4) and (6) change into the following form:
σ ¯ t , i , G , n = g G σ ¯ t , i , g , n m = n n ϕ n , g m Y n m ( Ω ) g G m = n n ϕ n , g m Y n m ( Ω )
σ ¯ s , i , G G , n = g G g G σ ¯ s , i , g g , n m = n n ϕ n , g m Y n m ( Ω ) g G m = n n ϕ n , g m Y n m ( Ω )
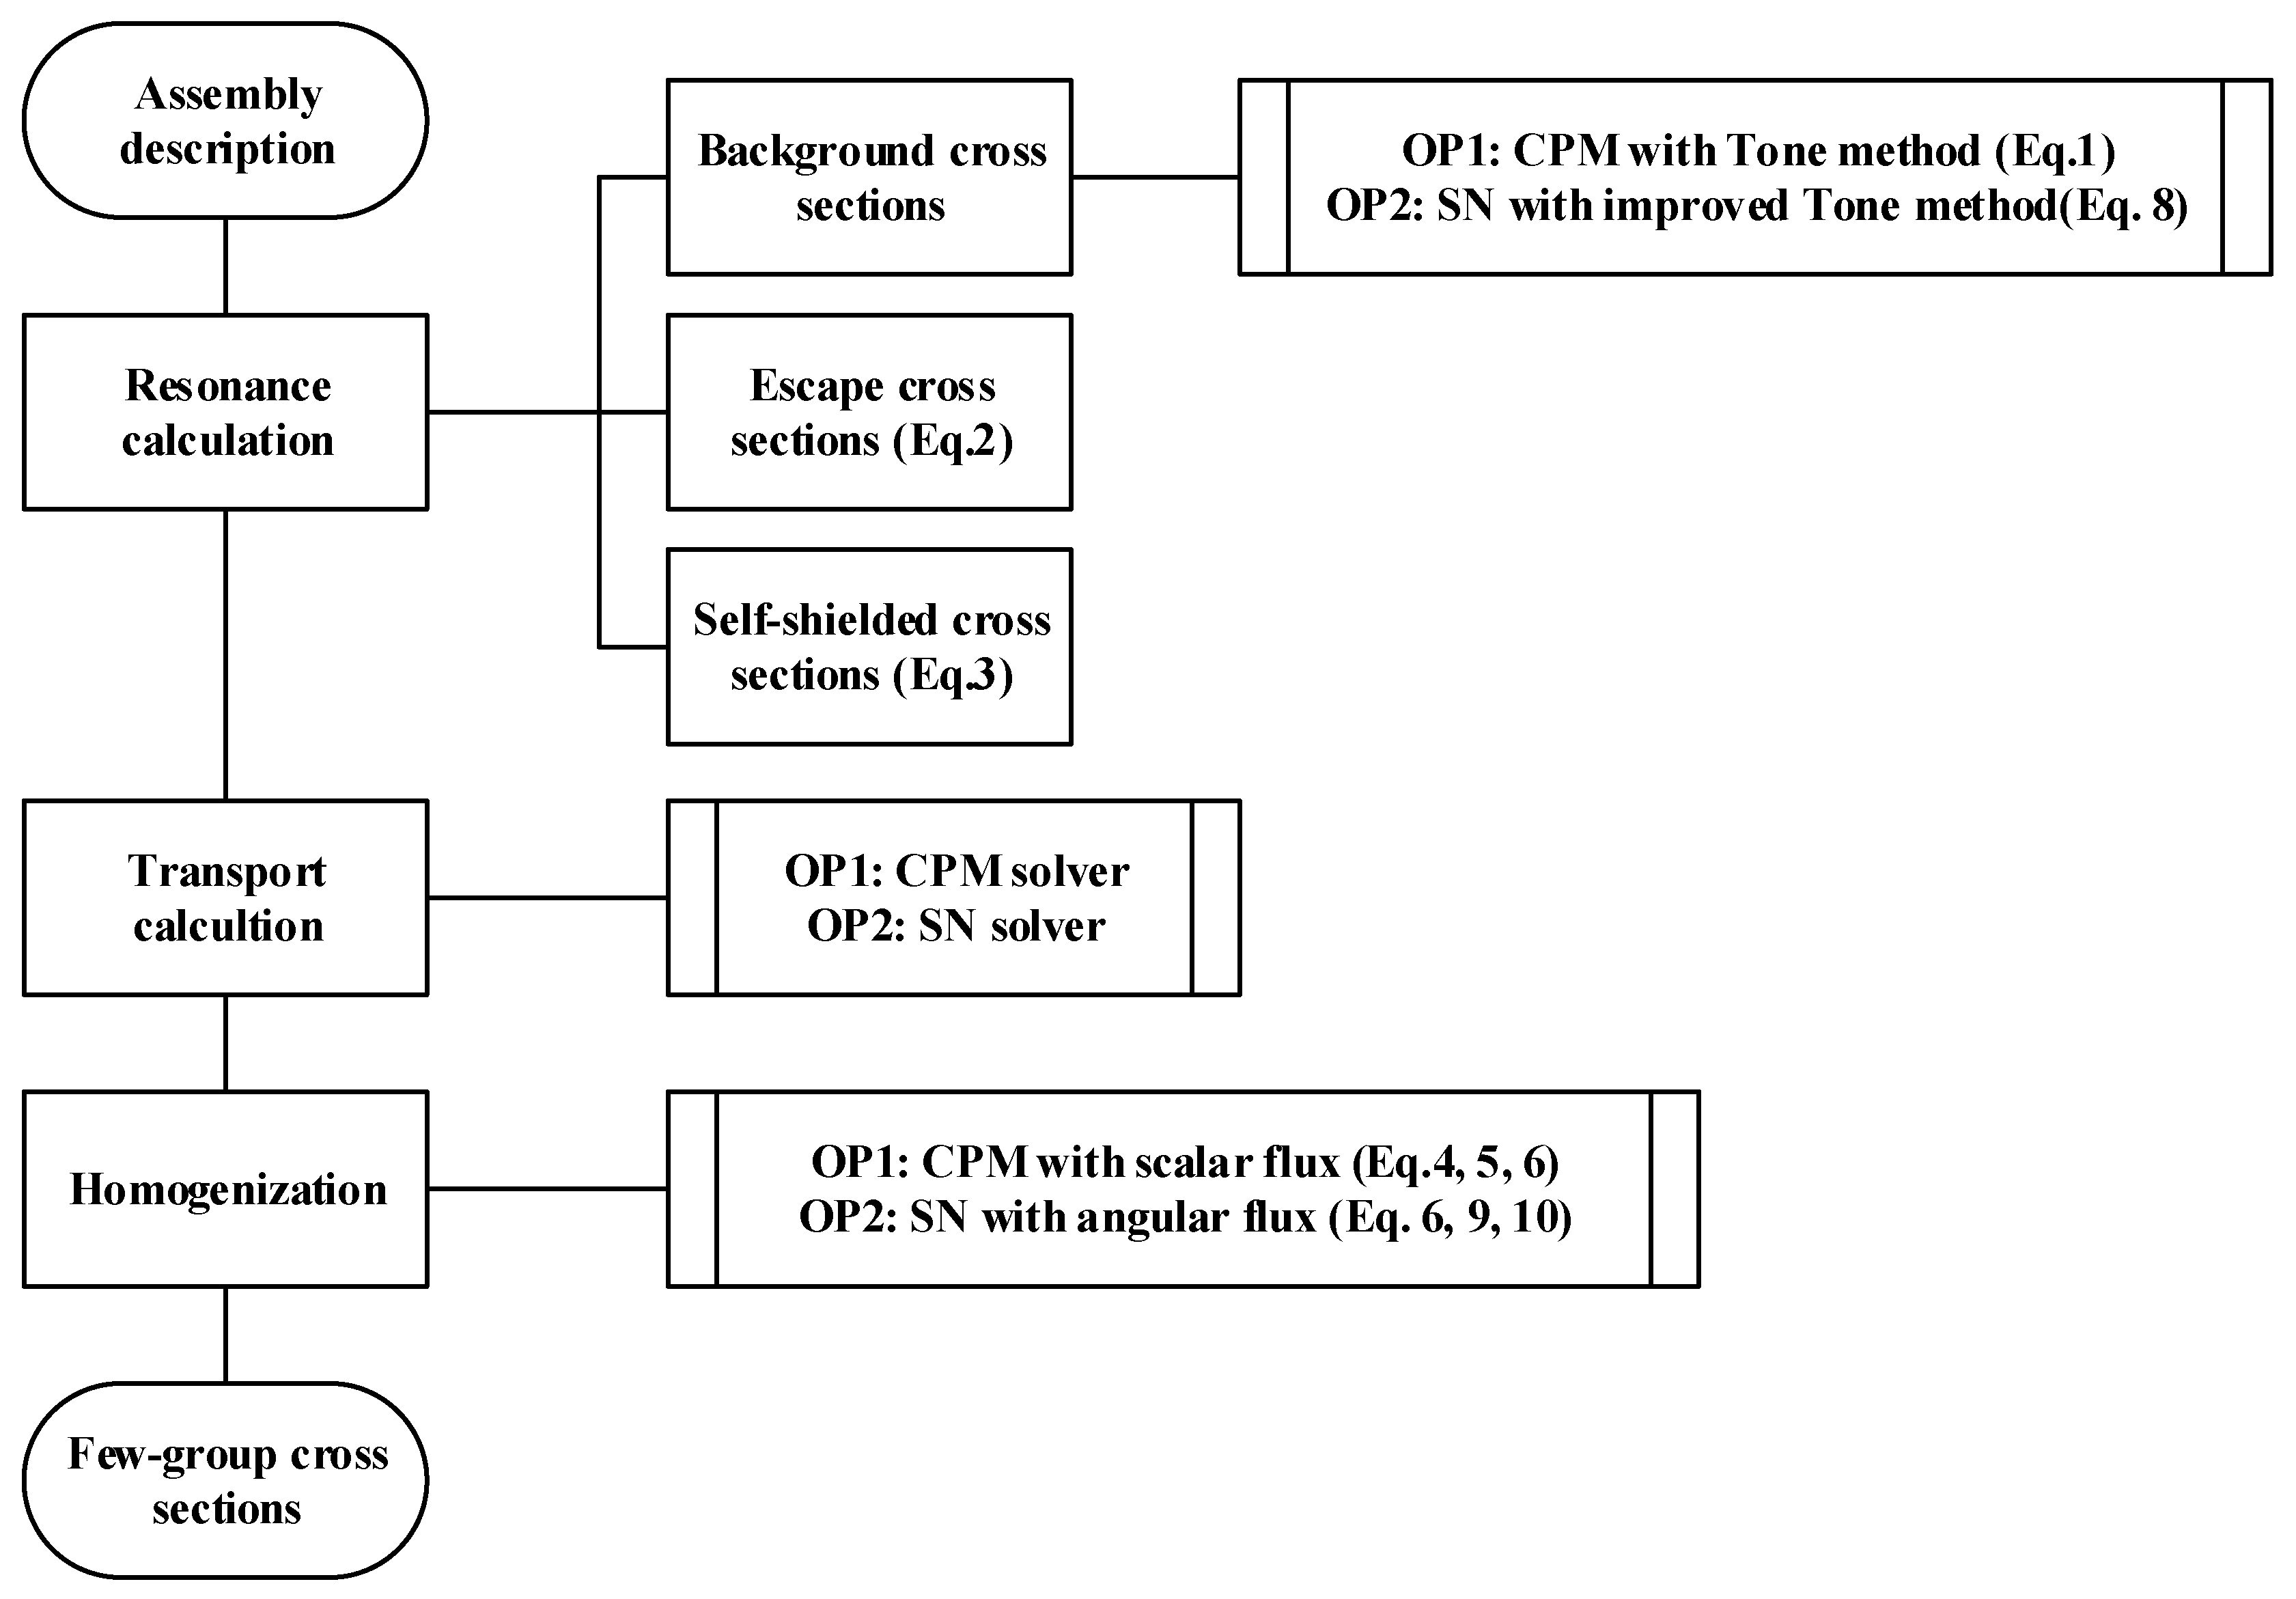
Based on this, the 1-D SN solver and improved Tone’s method were implemented into original TULIP code, and the computational flow chart of updated TULIP code is shown in Figure 1. In this figure, the OP1 and OP2 are the CPM and SN methods discussed above. The biggest difference between OP1 and OP2 is the consideration of angular dependence on neutron flux. The SARAX code system has a three-step standard procedure for steady-state analysis, which is TULIP-HYDRA-LAVENDER. It should be noted that during the HYDRA calculation, the global-wise space- and angular-dependent neutron flux is obtained. Therefore, in the previous validation studies, the angular dependence is actually considered. In order to discuss the effect of angular dependence on neutron flux, the TULIP-LAVENDER sequence is applied to the following section’s calculation and the few-group cross sections are obtained directly from the TULIP code. Considering that the CPM method and SN method has the different convergence properties of spatial discretization, in the following calculation, a different mesh was used in the TULIP code to make sure the neutron flux solved by OP1 or OP2 was converged.

3. Numerical Results

In this section, several experimental reactors with measurement data were calculated and the difference between different options was compared.

3.1. JOYO MK-I Experimental Tests

JOYO is Japan’s first experimental fast reactor that was constructed at the O-arai Engineering Center of the Power Reactor and Nuclear Fuel Development Corporation to acquire various aspects of data relating to actual fast reactor performances. The core was loaded with MOX fuel and surrounded by radial and axial blanket of depleted UO2. Several experiments were performed based on JOYO MK-I core, including critical measurements and reactivity effects measurements. Since the control rod and sodium void introduce high angular dependence on neutron flux, in the following calculation, the control rod worth and the sodium void reactivity of JOYO MK-I reactor were calculated and analyzed.

3.1.1. Control Rod Worth Calculation of JOYO MK-I Core

In the JOYO MK-I core, the six control rod assemblies were divided into two groups, regulating control rod (RR) and safety control rod (SR). These two groups and the radial position of each control rod assembly are shown in Figure 2. The control rod worth was obtained from two SARAX criticality calculations. The first one was obtained by full withdrawal of all six control rods, and the second one was obtained by full insertion of a specific control rod. The Equation (12) gives the definition of final control rod worth (CRW) results. The effective delayed neutron fraction was 521 pcm from benchmark report.
CRW = k 1 k 2 k 1 k 2 1 β e f f × 100
In the equation, subscript 1 indicates the full withdrawal case and 2 indicates the insertion of one specific rod. The effective delayed neutron fraction was 521 pcm according to the benchmark report.
The calculated CRW values of each control rod assembly are summarized in Table 1. Compared with measurement, the SR1 has the biggest relative difference in −5.91% of OP1 and −3.00% of OP2, respectively. It can be seen from the results that the relative difference calculated by OP2 is generally less than that calculated by OP1, and all the results calculated by OP2 are within the uncertainty of the experimental results of each control rod worth measurement.

3.1.2. Sodium Void Reactivity Calculation of JOYO MK-I Core

Figure 3 shows the position of voided assemblies during the measurement. In total, six assemblies were voided in the experiment. The labels of each voided assembly are [000], [1F1], [2F1], [3F1], [4F1], and [6F1]. Equation (13) was used to obtain the sodium void reactivity (SVR) value. Subscript 1 and 2 indicate the voided case and normal case. During the measurement, two RRs were inserted into the core and all the SRs were out of the core. The position of each control rod assembly is shown in Table 2.
SVR = k 1 k 2 k 1 k 2 1 β eff × 100
By using different options of few-group cross sections generation, the calculated SVR value and the comparison are listed in Table 3. For such a small reactor core, the neutron leakage effect is the main contributor to the SVR in fuel region so that the SVR values are negative. In the blanket region, the positive SVR value is caused by the harden of neutron spectrum. The calculated SVR value of both OP1 and OP2 are within the uncertainty of the experimental results.

3.2. ZPPR Series Experimental Tests

Experiments at the ZPPR aimed to provide an initial data base for assessment of physics issues in large liquid metal fast breeder reactor cores. These experiments belong to a joint program, called the Japanese-United States Program of Integral Tests and Experimental Research (JUPITER). The JUPITER program consisted of twenty-one experimental assemblies. In this section, one clean benchmark core (ZPPR-9) and one engineering mockup core (ZPPR-10B) based on JUPITER-I were selected. The specifications of ZPPR-9 and ZPPR-10B are illustrated in Figure 4 and Figure 5. According to the configuration of ZPPR-9 and ZPPR-10B, more types of drawers were loaded in the ZPPR-10B reactor core.
Unlike the JOYO MK-I core, the ZPPR cores were assembled from several types of small plates into stainless steel drawers, such as depleted uranium, Pu-U-Mo fuel, sodium, and stainless steel. In the calculation, the as-built drawers were simplified into one-dimensional plate-stretch models, as shown in Figure 6. In addition, the canned sodium plates in drawers in the affected zone were replaced by void cans during the sodium void reactivity experiment, and the affected zone contained at least 9 drawers for each case. Therefore, the special design and specific experiment of ZPPR made the neutron flux of core more anisotropic. Consequently, the control rod worth and sodium void reactivity experiment of two cores were calculated in the following sections.

3.2.1. Control Rod Worth Calculation of ZPPR Cores

There were 14 and 6 cases of control rod worth experiment for ZPPR-9 and ZPPR-10B, respectively. The worth of absorber and follower at different position were measured. Table 4 and Table 5 show the calculated CRW values for two cores. Results of the CRW calculation were normalized to a unit dollar, of which the normalized factor is 343.6p cm in the benchmark report. The definition of each case could be found in the benchmark report [18,19].
By comparing with measurement of ZPPR-9 core, the results of OP1 have relative differences ranging from 3% to 11%, while the results of OP2 have relative differences ranging from −1% to 7%. In the calculation of CRW, the relative difference of the method used in OP2 is generally smaller than that of OP1. In this case, only the follower part is inserted into the core, such as Cr-4, Cr-5, and Cr-13, and the differences between OP1 and OP2 are around 1%. On the contrary, the differences between two options become larger when absorber is inserted. Therefore, OP2 has a better performance on the treatment of the stronger absorber.
For the ZPPR-10B core, the results obtained by using OP2 have also improved around 7%. Compared with ZPPR-9 core, the fuel drawer distribution tends to be more non-uniform. Therefore, the environment effect could lead to the discrepancy, especially for control rod drawer in outside fuel region. In the current 1-D assembly calculation, it is hard to rigorously take the environment effect into account. However, it still could be concluded that the utilization of OP2 could obtain better results.

3.2.2. Sodium Void Reactivity Calculation of ZPPR Core

During the experiment, the voided region was expanded step-by-step, as illustrated in Figure 7 and Figure 8. The results of each step are summarized in Table 6 and Table 7.
For the case of small sodium void reactivity of ZPPR-9 core, i.e., Step-1, Step-2, and Step-3, the relative difference of SVR value of OP1 is 7%, and that of OP2 is 16%. It should be noted that the difference between OP1 and OP2 of Step-1 is only 0.3 cent, which is less than 1 pcm and is smaller than the keff convergence criteria. Therefore, for the case of small sodium void reactivity, it could be concluded that OP1 and OP2 have comparable results. For the case of large value, i.e., Step-4, Step-5, and Step-6, the maximum relative difference of the method based on OP1 is up to 40%. At that time, the maximum relative difference of the method based on OP2 is only 8%. Since the last two steps of this experiment have a larger void region, the OP2 gives accurate results because of the treatment of anisotropic neutron flux distribution. In addition, for all the cases of this experiment, the absolute values of relative difference based on OP1 and OP2 are in the range of 1%~40% and 5%~16%, respectively. It can be seen from the results that the treatment of anisotropic neutron flux distribution in few-group cross-sections generation could receive stable results.
From the results of ZPPR-10B, the maximum relative difference of SVR of the method based on OP1 is 38% while the maximum relative difference of the method based on OP2 is 6%. The comparison of these two options shows that the use of OP2 greatly improves the calculation results of sodium void reactivity. From the results of ZPPR-10B, both ZPPR-10B and ZPPR-9 could reach the same conclusion, which is for the case of strong anisotropy, where the relative difference of the method based on angular-dependent neutron flux is smaller and the accuracy is higher than that based on scalar neutron flux.

4. Summary and Conclusions

The evaluation of reactivity effect is important to FR neutronic design. Among all the possible occurring reactivity effects, the control rod insertion or coolant void could lead to strong anisotropy of neutron flux distribution. In order to simulate this anisotropy accurately, the angular-dependent neutron flux should be used in the process of the generation of few-group cross sections based on homogenization theory.
Therefore, the purpose of this paper is to compare the influence regarding whether the angular dependence on neutron flux is considered in the calculation of few-group cross sections for the reactivity effect calculation. In the study, the 1-D SN finite difference neutron transport equation solver was implemented in the TULIP code so that the high-order neutron flux could be obtained during the assembly calculation. Meanwhile, the improved Tone’s method was applied in terms of implementation of SN solver.
The numerical results were obtained based on three experimental FR cores, JOYO MK-I core, ZPPR-9 core, and ZPPR-10B core. Both control rod worth and sodium void reactivity were calculated and compared with the measurement. 
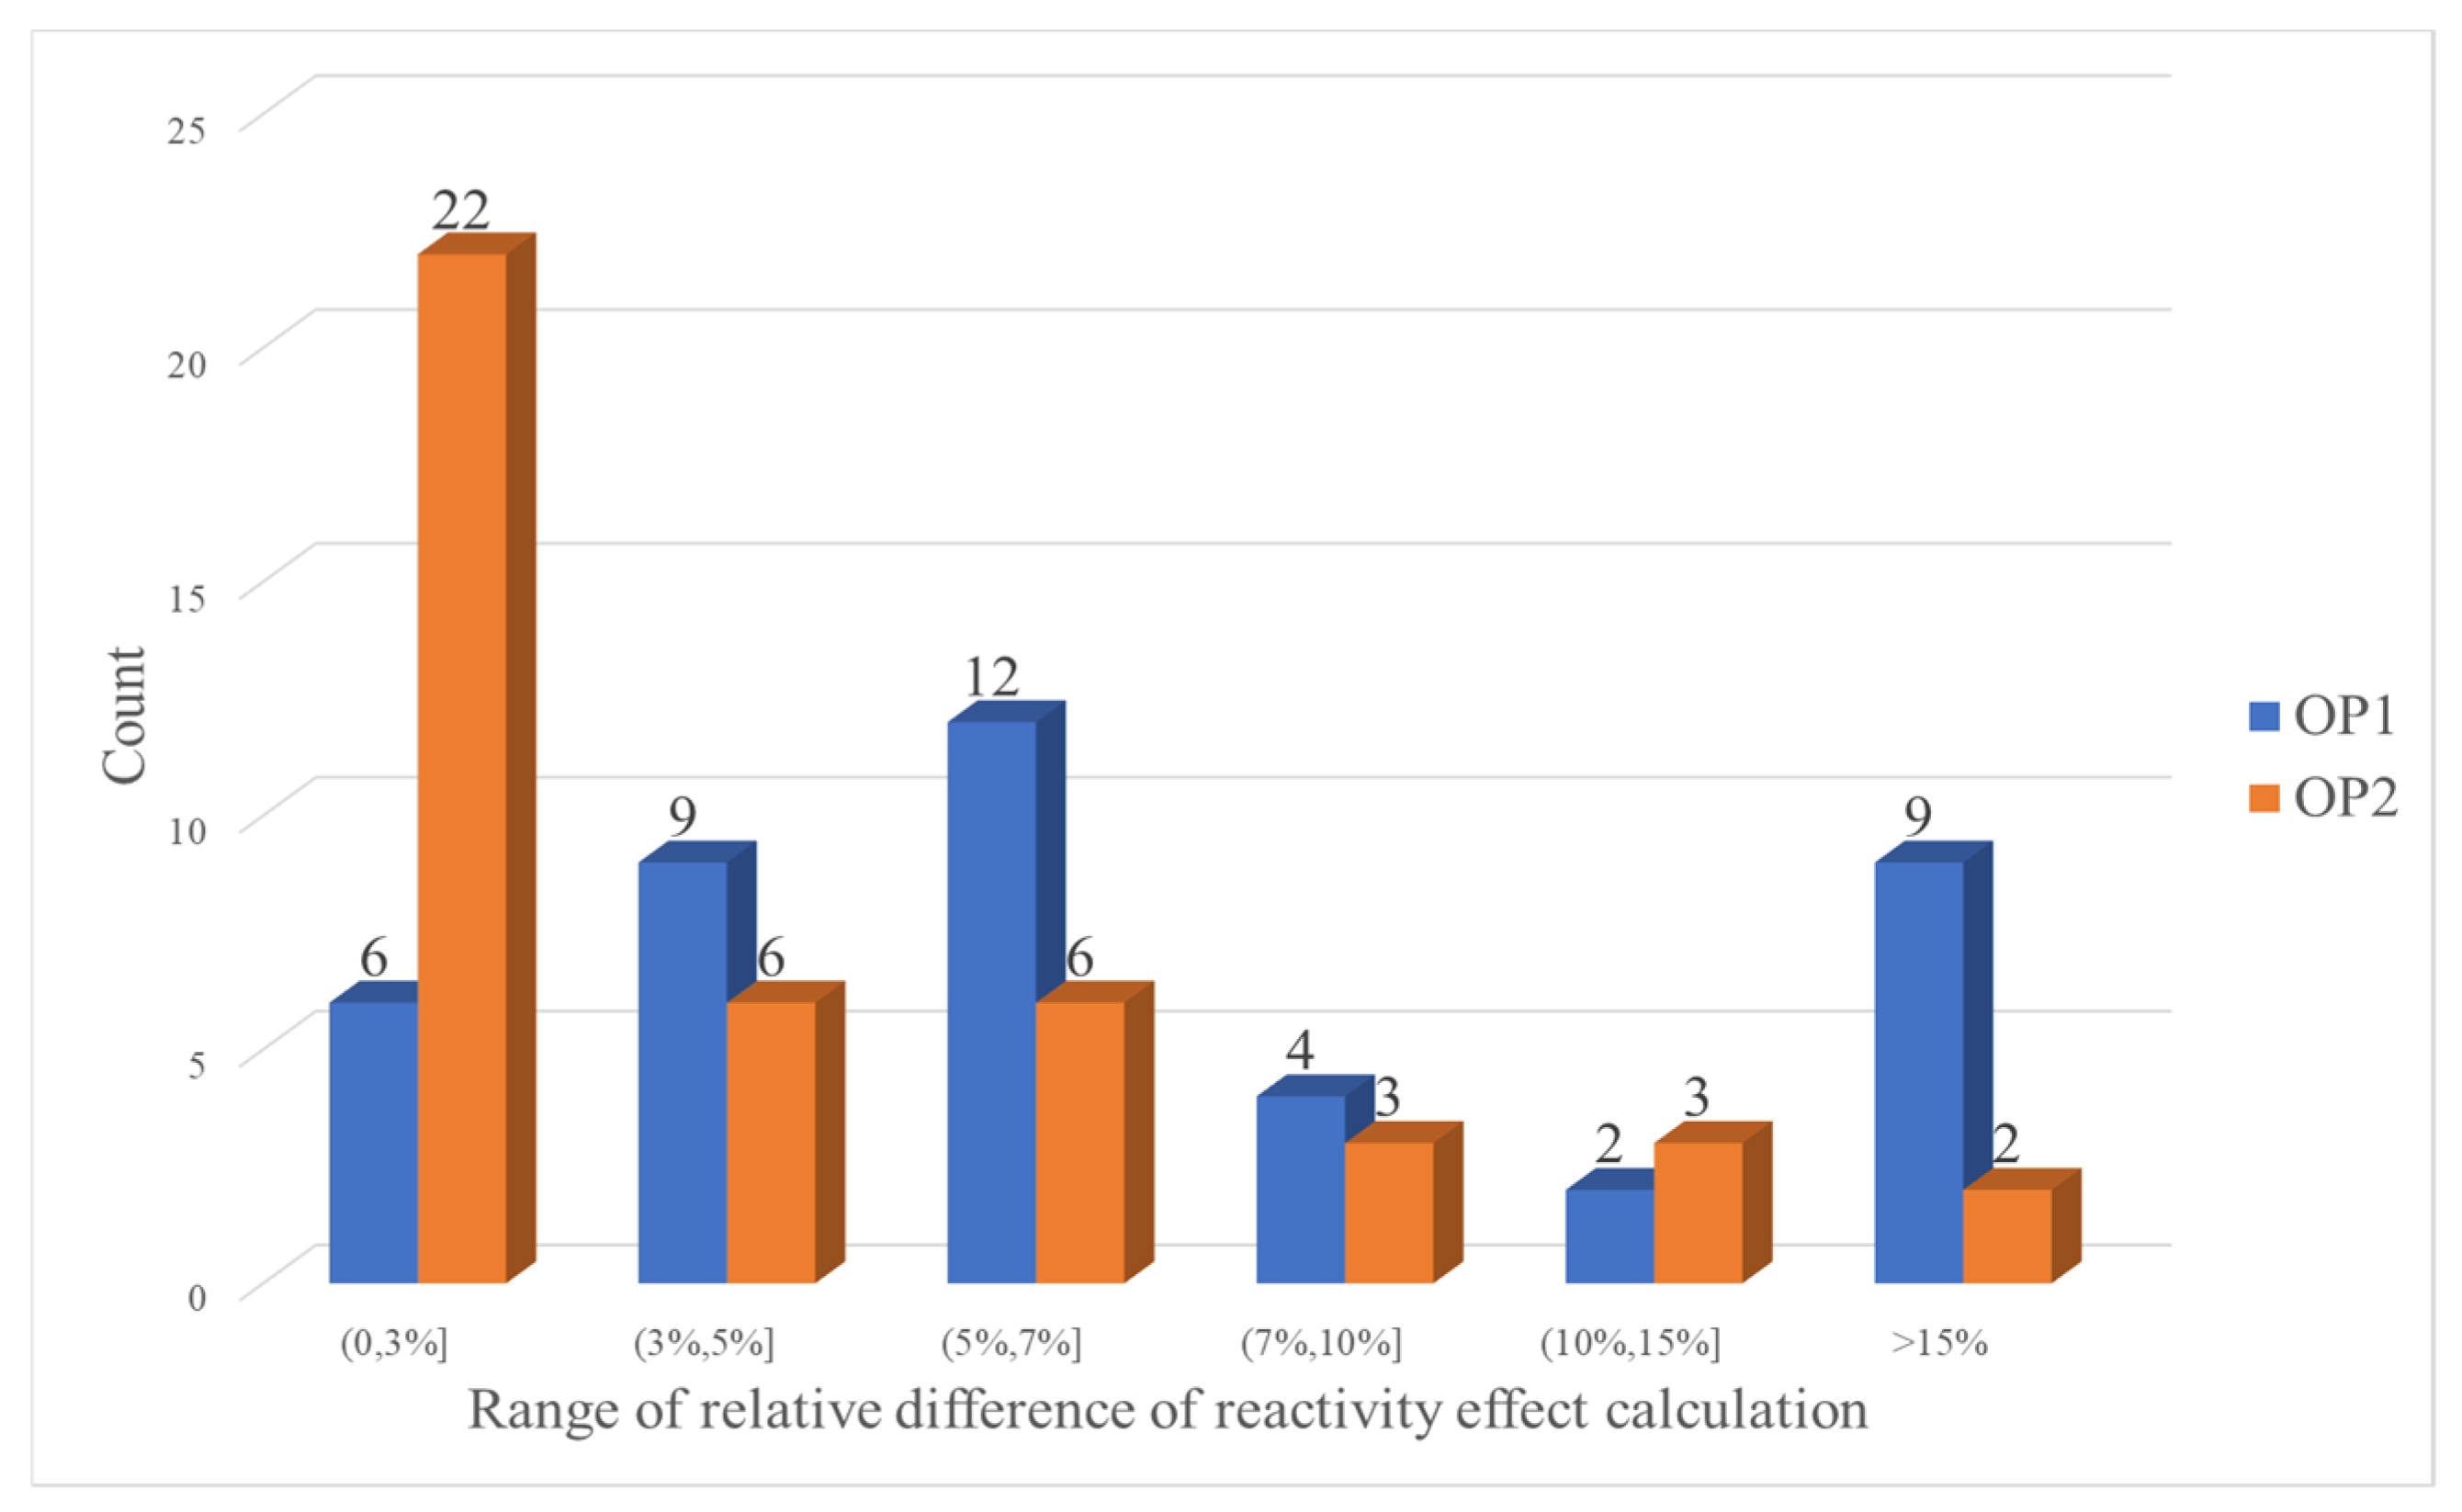
Figure 9 summarizes all the numerical results and illustrated as the statistical histogram in terms of relative difference. In total, 46 cases were calculated and compared in this study. When the few-group cross sections are generated based on OP1, only six cases have small deviation compared with measured data within the range from 0% to 3%. At the same time, the relative differences of 15 cases are larger than 7%. Considering the angular dependence by using the OP2, nearly half of these cases have small deviation. At the same time, the number of cases of largest difference (>15%) has decreased obviously. We should note that the OP1 and OP2 obtained comparable results in a few cases, which only happened when the control rod follower part was inserted into the active core. That is to say, OP1 works well only at the condition that neutron flux distribution is not that anisotropic.
To sum up, the consideration of angular dependence on neutron flux distribution during the few-group cross sections generation is beneficial to the neutronic design analysis of FR, especially for the reactivity effect calculation.

Author Contributions

Conceptualization, X.D. and Y.Z.; methodology, X.D. and X.W.; software and validation, X.W.; writing—original draft preparation, X.D.; writing—review, Y.W.; supervision, Y.Z. All authors have read and agreed to the published version of the manuscript.

Funding

This work was partially supported by the National Key Research and Development Project of China grant number 2019YFB1901102, and the National Natural Science Foundation of China, grant number 12005160.

Institutional Review Board Statement

Not applicable.

Informed Consent Statement

Not applicable.

Data Availability Statement

Not applicable.

Conflicts of Interest

The authors declare no conflict of interest.

References

  1. Rimpault, G. Algorithmic features of the ECCO cell code for treating heterogeneous fast reactor subassemblies. In Proceedings of the International Topical Meeting on Reactor Physics and Computations, Portland, OR, USA, 1–5 May 1995. [Google Scholar]
  2. Lee, C.; Yang, W.S. MC2-3: Multigroup cross section generation code for fast reactor analysis. Nucl. Sci. Eng. 2017, 187, 268–290. [Google Scholar] [CrossRef]
  3. Hazama, T.; Chiba, G.; Sugino, K. Development of a Fine and Ultra-Fine Group Cell Calculation Code SLAROM-UF for Fast Reactor Analyses. J. Nucl. Sci. Technol. 2012, 43, 908–918. [Google Scholar] [CrossRef]
  4. Vidal, J.F.; Archier, P.; Calloo, A. An improved energy-collapsing method for core-reflector modelization in SFR core calculations using the PARIS platform. In Proceedings of the PHYSOR, American Nuclear Society, Knoxville, TN, USA, 15–20 April 2012; pp. 4136–4149. [Google Scholar]
  5. Vidal, J.-F.; Archier, P.; Faure, B.; Jouault, V.; Palau, J.-M.; Pascal, V.; Rimpault, G.; Auffret, F.; Graziano, L.; Masiello, E.; et al. APOLLO3@ homogenization techniques for transport core calculations application to the ASTRID CFV core. In Proceedings of the M&C, Jeju, Korea, 16–20 April 2017. [Google Scholar]
  6. Zheng, Y.Q.; Du, X.; Xu, Z.; Zhou, S.; Liu, Y.; Wan, C.; Xu, L. SARAX: A new code for fast reactor analysis part I: Methods. Nucl. Eng. Des. 2018, 340, 421–430. [Google Scholar] [CrossRef]
  7. Du, X.; Cao, L.; Zheng, Y.; Wu, H. A hybrid method to generate few-group cross sections for fast reactor analysis. J. Nucl. Sci. Technol. 2018, 55, 931–944. [Google Scholar] [CrossRef]
  8. Zhou, S.; Wu, H.; Cao, L.; Zheng, Y.; Huang, K.; He, M.; Li, X. LAVENDER: A steady-state core analysis code for design studies of accelerator driven subcritical reactors. Nucl. Eng. Des. 2014, 278, 434–444. [Google Scholar] [CrossRef]
  9. He, M.; Wu, H.; Zheng, Y.; Wang, K.; Li, X.; Zhou, S. Beam transient analyses of Accelerator Driven Subcritical Reactors based on neutron transport method. Nucl. Eng. Des. 2015, 295, 489–499. [Google Scholar] [CrossRef]
  10. Xu, L.; Cao, L.; Zheng, Y.; Wu, H. Development of a new parallel SN code for neutron-photon transport calculation in 3-D cylindrical geometry. Prog. Nucl. Energy 2017, 94, 1–21. [Google Scholar] [CrossRef]
  11. Du, X.; Cao, L.; Zheng, Y.; Wu, H. The analysis of OECD/NEA SFR benchmarks with SARAX code. In Proceedings of the M&C, Jeju, Korea, 16–20 April 2017. [Google Scholar]
  12. Zheng, Y.; Qiao, L.; Zhai, Z.; Du, X.; Xu, Z. SARAX: A new code for fast reactor analysis part II: Verification, validation and uncertainty quantification. Nucl. Eng. Des. 2018, 331, 41–53. [Google Scholar] [CrossRef]
  13. Du, X.N.; Zheng, Y.Q.; Wang, Y.P.; Zhai, Z.A.; Zhou, H. Validation of SARAX code system using the SFR operational tests. Ann. Nucl. Energy 2020, 147, 107744. [Google Scholar] [CrossRef]
  14. Lee, C.H.; Yang, W.S. An Improved Resonance Self-shielding Method for Heterogeneous Fast Reactor Assembly and Core Calculations. In Proceedings of the M&C 2013, Sun Valley, ID, USA, 5–9 May 2013. [Google Scholar]
  15. Mao, L.; Zmijarevic, I.; Sanchez, R. Resonance Self-Shielding Methods for Fast Reactor Calculations—Comparison of a New Tone’s Method with the Subgroup Method in APOLLO3. Nucl. Sci. Eng. 2017, 188, 1–18. [Google Scholar] [CrossRef]
  16. Lim, C.H.; Joo, H.G.; Yang, W.S. Development of a fast reactor multigroup cross section generation code EXUS-F capable of direct processing of evaluated nuclear data files. Nucl. Eng. Technol. 2018, 50, 340–355. [Google Scholar] [CrossRef]
  17. Jewell, K.; Ivanova, T.; Morman, J. Japan’s Experimental Fast Reactor JOYO MK-I Core: Sodium-Cooled Uranium-Plutonium Mixed Oxide Fueled Fast Core Surrounded by UO2 Blanket; OECD/NEA: Paris, France, 2014; NEA/NSC/DOC(2006)1. [Google Scholar]
  18. ZPPR-9 EXPERIMENT: A 650MWe-Class Sodium-Cooled MOX-Fueled FBR Core Mock-Up Critical Experiment with Clean Core of Two Homogeneous Zone; OECD/NEA: Paris, France, 2014; NEA/NSC/DOC(2006)1.
  19. ZPPR-10B EXPERIMENT: A 650MWe-Class Sodium-Cooled MOX-Fueled FBR Homogeneous Core Mock-Up Critical Experiment with Two Enrichment Zones, Seven Control Rods and Twelve Control Rod Positions; OECD/NEA: Paris, France, 2014; NEA/NSC/DOC(2006)1.
  20. Tone, T. A Numerical Study of Heterogeneity Effects in Fast Reactor Critical Assemblies. J. Nucl. Sci. Technol. 1975, 12, 467–481. [Google Scholar] [CrossRef]
Figure 1. The computational flow chart of TULIP code.
Energies 14 04042 g001
Figure 2. Radial layout of control rod worth calculation.
Energies 14 04042 g002
Figure 3. Radial layout of sodium void reactivity calculation.
Energies 14 04042 g003
Figure 4. Specifications of ZPPR-9 core.
Energies 14 04042 g004
Figure 5. Specifications of ZPPR-10B core.
Energies 14 04042 g005
Figure 6. Plate-stretch simplification of drawers in ZPPR cores.
Energies 14 04042 g006
Figure 7. Arrangement of ZPPR-9 core fore sodium void reactivity evaluation.
Energies 14 04042 g007
Figure 8. Arrangement of ZPPR-10B core fore sodium void reactivity evaluation.
Energies 14 04042 g008
Figure 9. Summary of all the numerical results.
Energies 14 04042 g009
Table 1. Results and comparison of CRW value of JOYO MK-I.
CaseMeasurement, ¢OP1, ¢Rel.Diff of OP1OP2, ¢Rel.Diff of OP2
SR1407.0(±4.0%)382.9−5.91%394.8−3.00%
SR2410.7(±3.0%)389.6−5.13%401.6−2.21%
SR3396.4(±4.0%)376.8−4.93%388.3−2.04%
SR4400.3(±3.0%)383.1−4.29%394.8−1.38%
RR1387.5(±2.1%)374.2−3.44%385.5−0.53%
RR2385.8(±3.2%)368.3−4.54%379.6−1.62%
Table 2. Control rod position during sodium void reactivity measurement.
RR1RR2SR1SR2SR3SR4
Position, mm340.0340.0910.0910.0910.0910.0
Table 3. Results and comparison of SVR value of JOYO MK-I.
CaseMeasurement, ¢OP1, ¢Rel.Diff of OP1OP2, ¢Rel.Diff of OP2
000−6.32(±28.5%)−6.909.24%−6.726.40%
1F1−7.06(±24.5%)−6.90−2.21%−6.92−2.03%
2F1−7.41(±25.7%)−7.10−4.24%−7.30−1.47%
3F1−5.93(±30.0%)−5.940.25%−5.960.44%
4F1−5.53(±30.0%)−5.37−2.90%−5.570.75%
6F10.58(±240%)1.34131.36%1.1598.68%
Table 4. Results and comparison of CRW value of ZPPR-9.
CaseMeasurement, $OP1, $Rel.Diff of OP1OP2, $Rel.Diff of OP2
Cr-10.556(±1.4%)0.5774%0.5621%
Cr-23.328(±1.2%)3.67710%3.4102%
Cr-32.863(±1.2%)3.17111%2.9613%
Cr-41.004(±1.3%)1.0686%1.0525%
Cr-50.755(±1.3%)0.8128%0.8087%
Cr-60.836(±1.2%)0.8633%0.8765%
Cr-76.530(±1.2%)7.0418%6.5651%
Cr-84.390(±1.2%)4.6656%4.4562%
Cr-92.016(±1.2%)2.1014%2.0522%
Cr-103.054(±1.2%)3.2316%3.1714%
Cr-1116.750(±1.2%)17.8176%16.7710%
Cr-1217.260(±1.2%)18.1785%17.170−1%
Cr-132.730(±1.1%)2.9117%2.9036%
Cr-1417.670(±1.2%)18.8066%17.8691%
Table 5. Results and comparison of CRW value of ZPPR-10.
CaseMeasurement, $OP1, $Rel.Diff of OP1OP2, $Rel.Diff of OP2
Cr-11.82(±1.6%)2.1418%2.0111%
Cr-21.18(±1.7%)1.256%1.202%
Cr-39.32(±1.3%)11.0619%10.3111%
Cr-411.38(±1.3%)13.6520%12.8313%
Cr-57.74(±1.3%)7.62−2%7.34−5%
Cr-611.04(±1.4%)10.32−7%9.91−10%
Table 6. Results and comparison of SVR value of ZPPR-9.
CaseMeasurement, ¢OP1, ¢Rel.Diff of OP1OP2, ¢Rel.Diff of OP2
Step-13.03(±3.6%)2.83−7%2.54−16%
Step-211.53(±2.1%)11.03−4%10.44−9%
Step-329.18(±1.7%)28.82−1%27.64−5%
Step-436.92(±1.7%)39.547%34.97−5%
Step-531.3(±1.7%)36.7217%28.77−8%
Step-624.24(±1.7%)33.9040%25.957%
Table 7. Results and comparison of SVR value of ZPPR-10B.
CaseMeasurement, ¢OP1, ¢Rel.Diff of OP1OP2, ¢Rel.Diff of OP2
Step-116.82(±2.4%)20.3321%17.806%
Step-235.92(±1.8%)39.8711%36.552%
Step-345.14(±1.8%)55.4523%44.84−1%
Step-437.28(±1.8%)51.4438%35.04−6%
Publisher’s Note: MDPI stays neutral with regard to jurisdictional claims in published maps and institutional affiliations.

