
MPC Based Energy Management System for Hosting Capacity of PVs and Customer Load with EV in Stand-Alone Microgrids

 , , ,
, , ,
Abstract
:1. Introduction
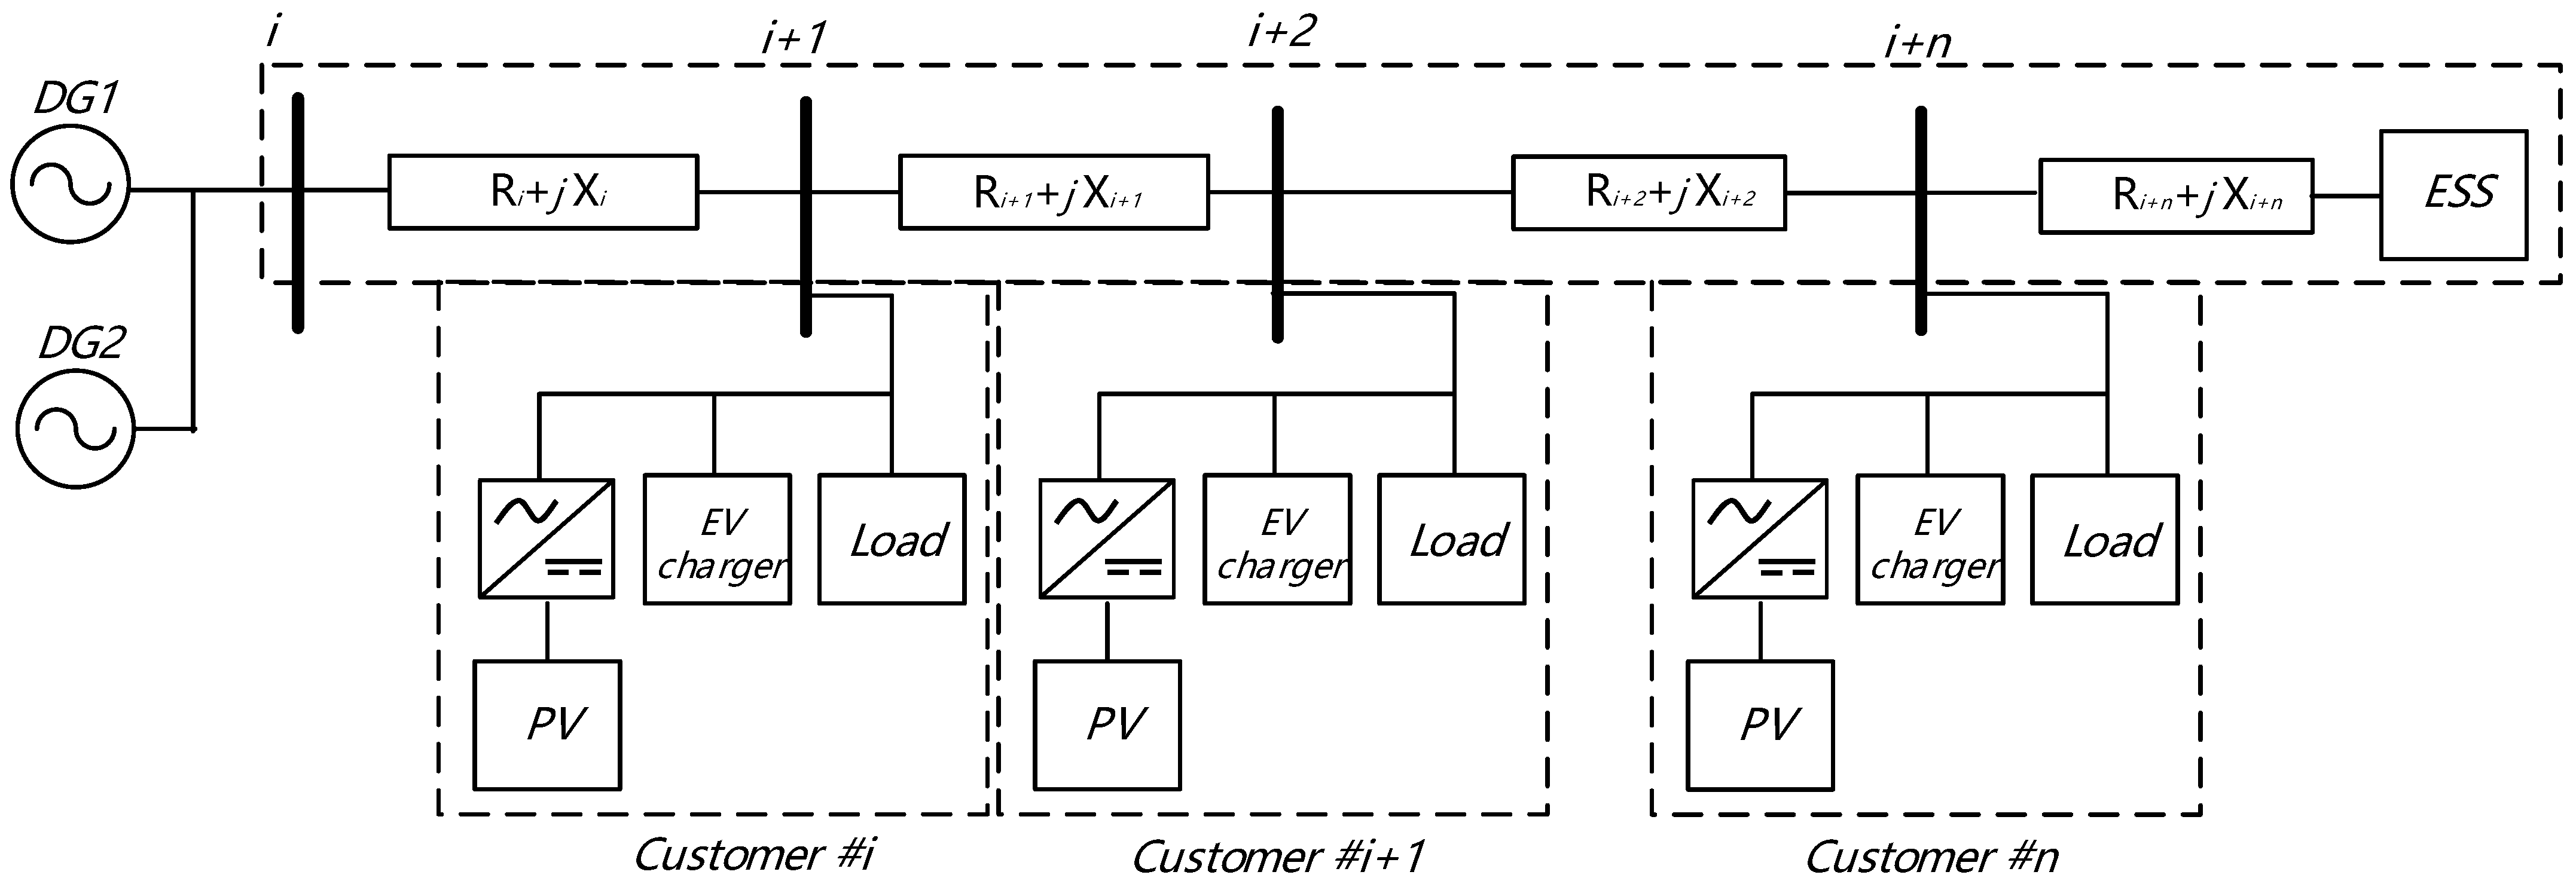
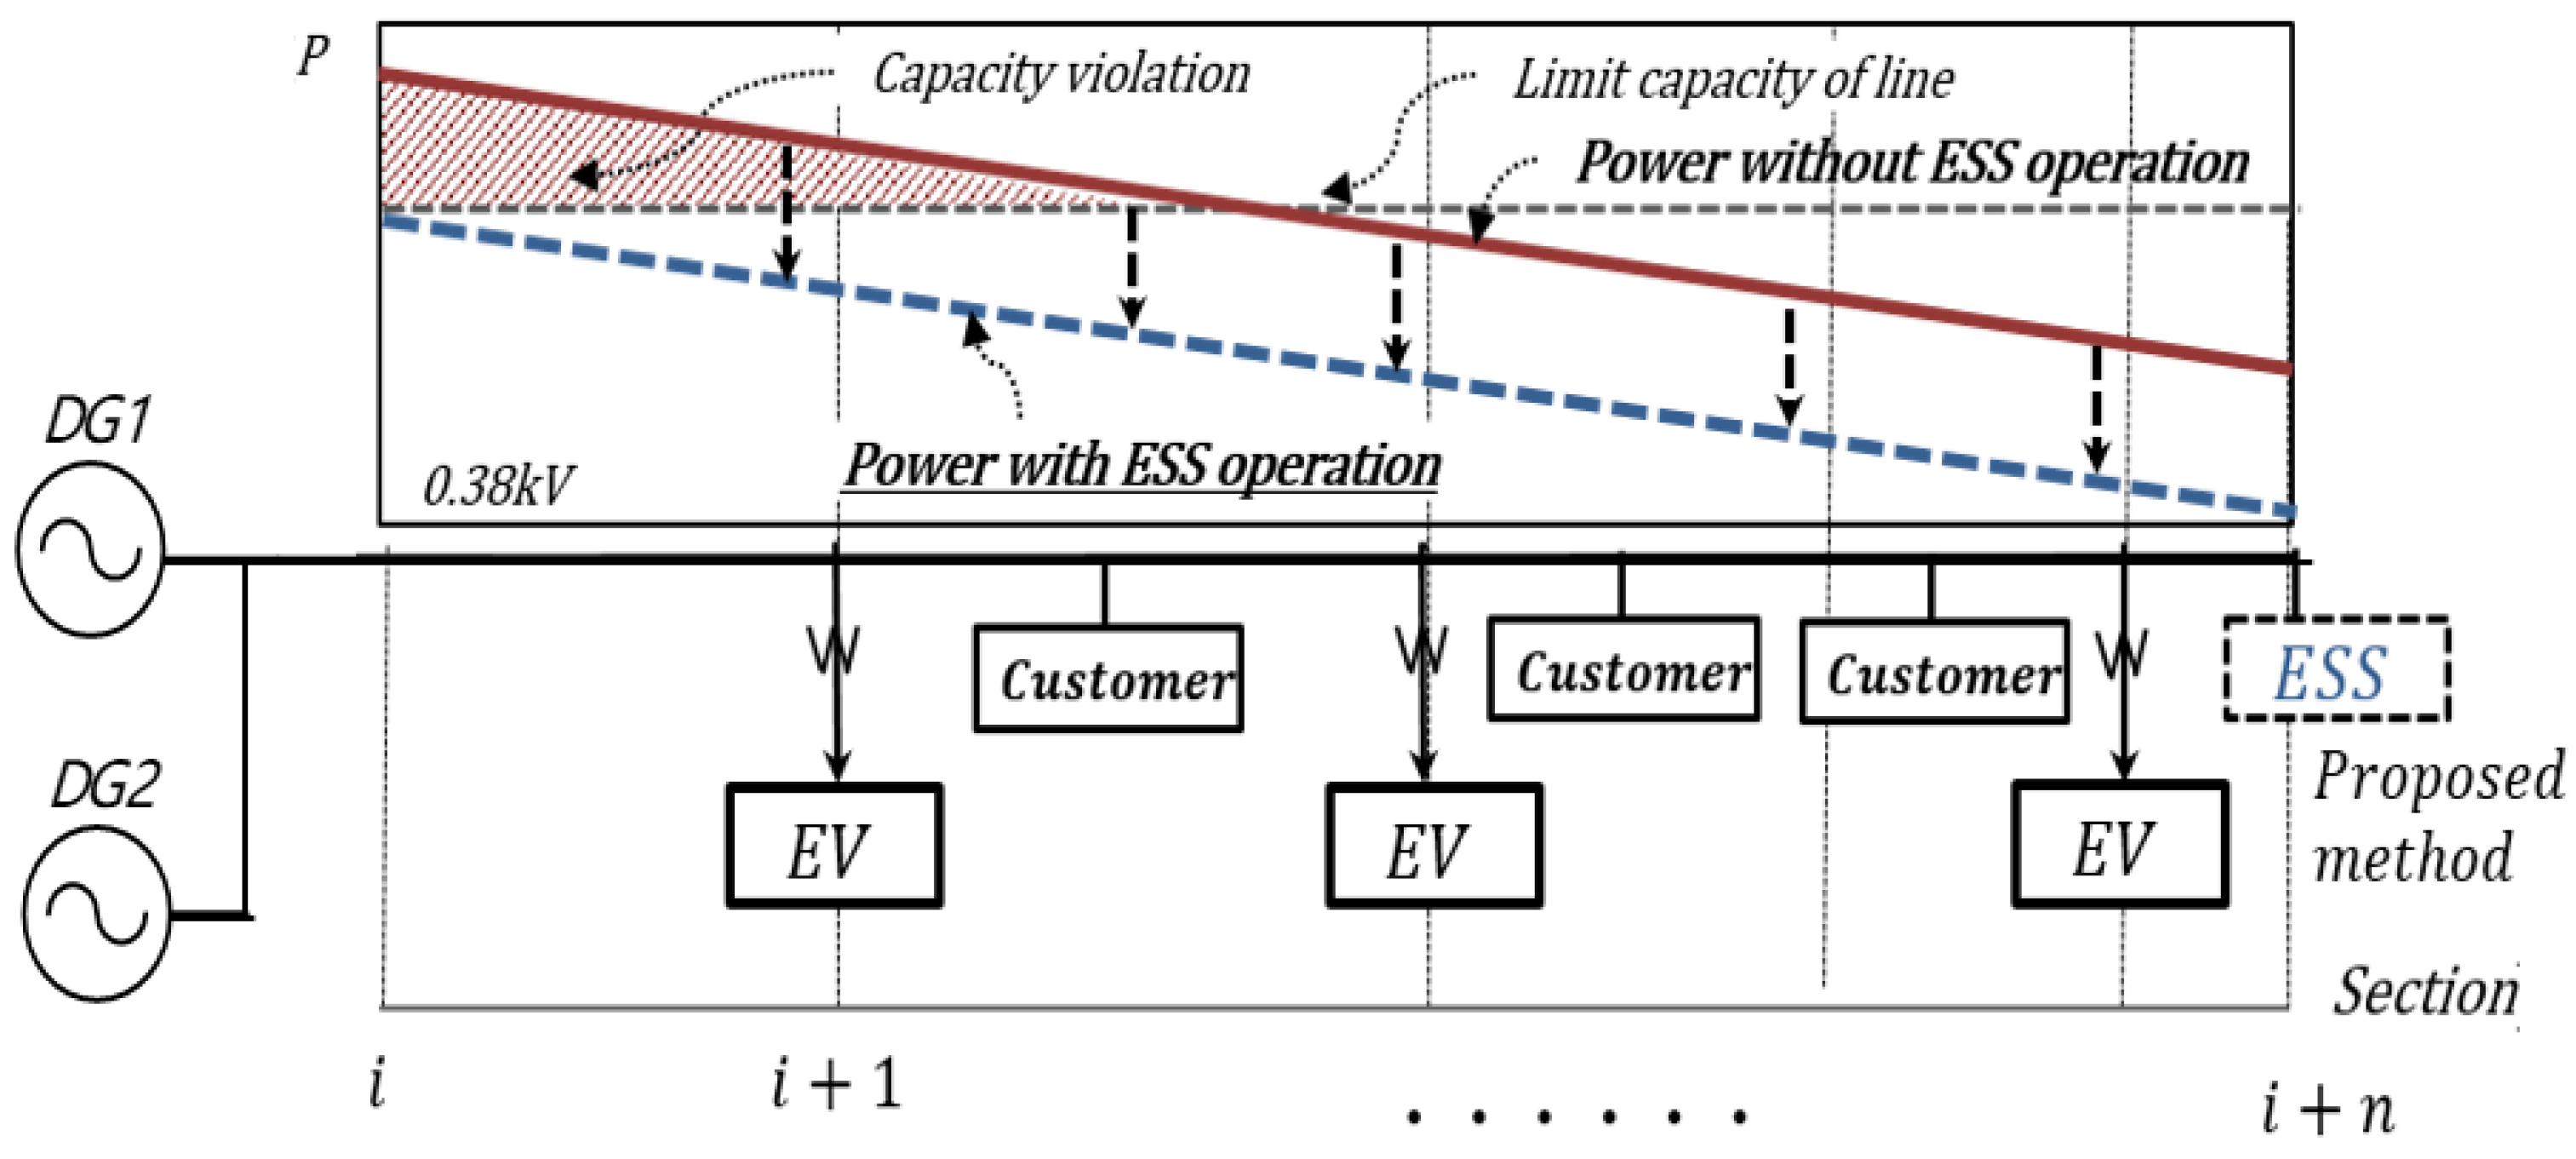
2. Power Control of ESS for Hosting Capacity in Stand-Alone MG
3. MPC Based EMS in Stand-Alone MG
3.1. Predictive Model of Stand-Alone MG
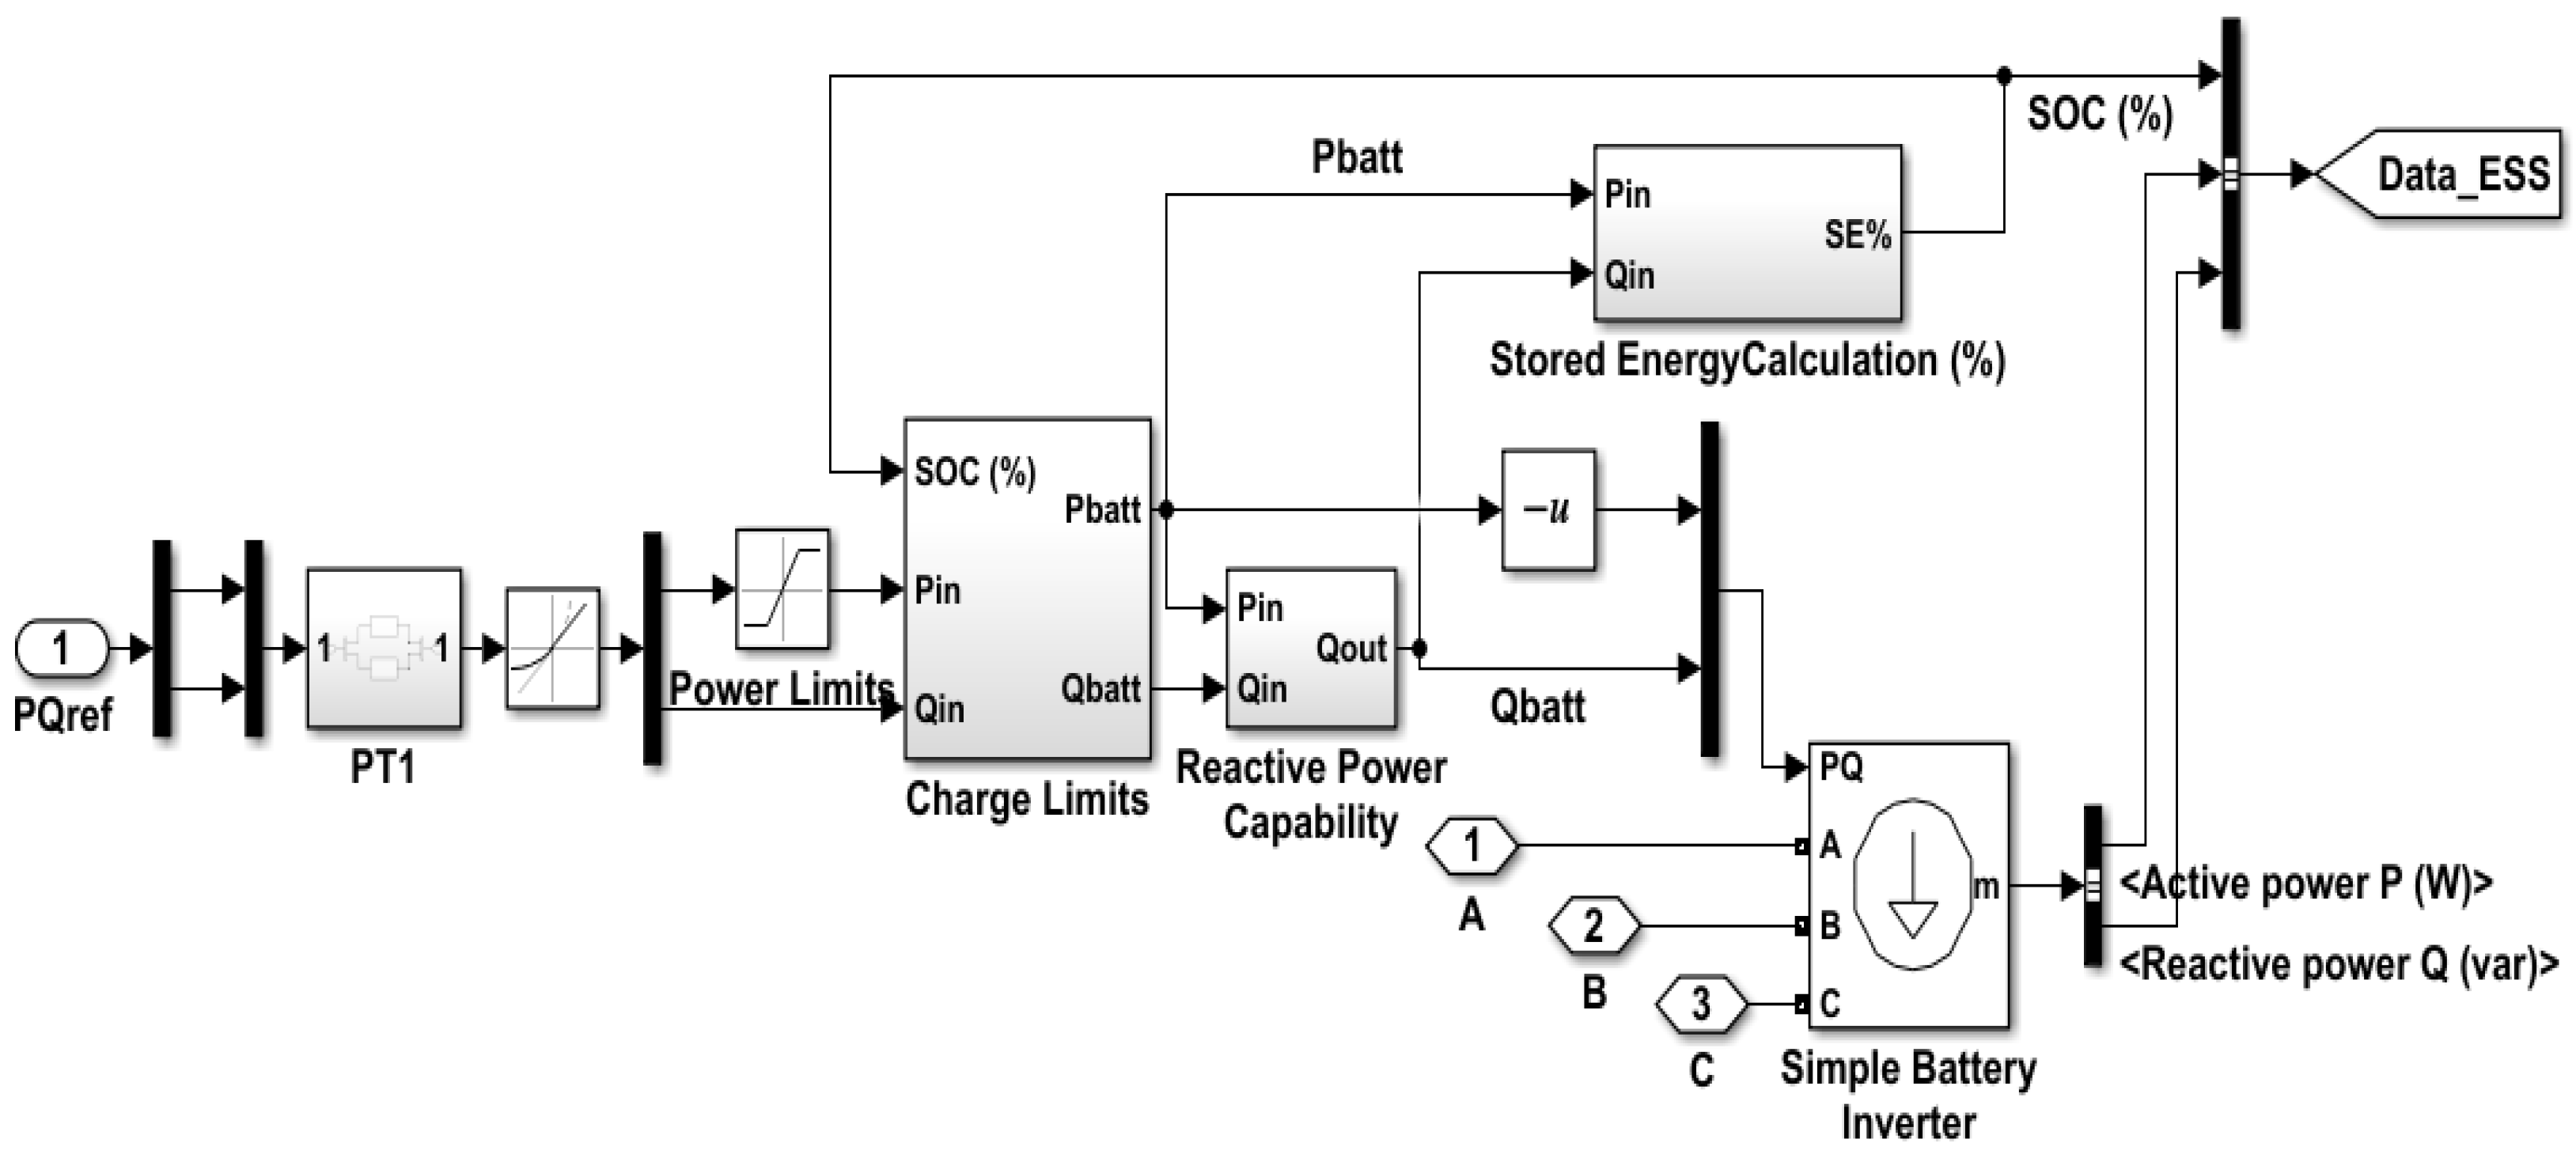
3.1.1. Energy Storage System
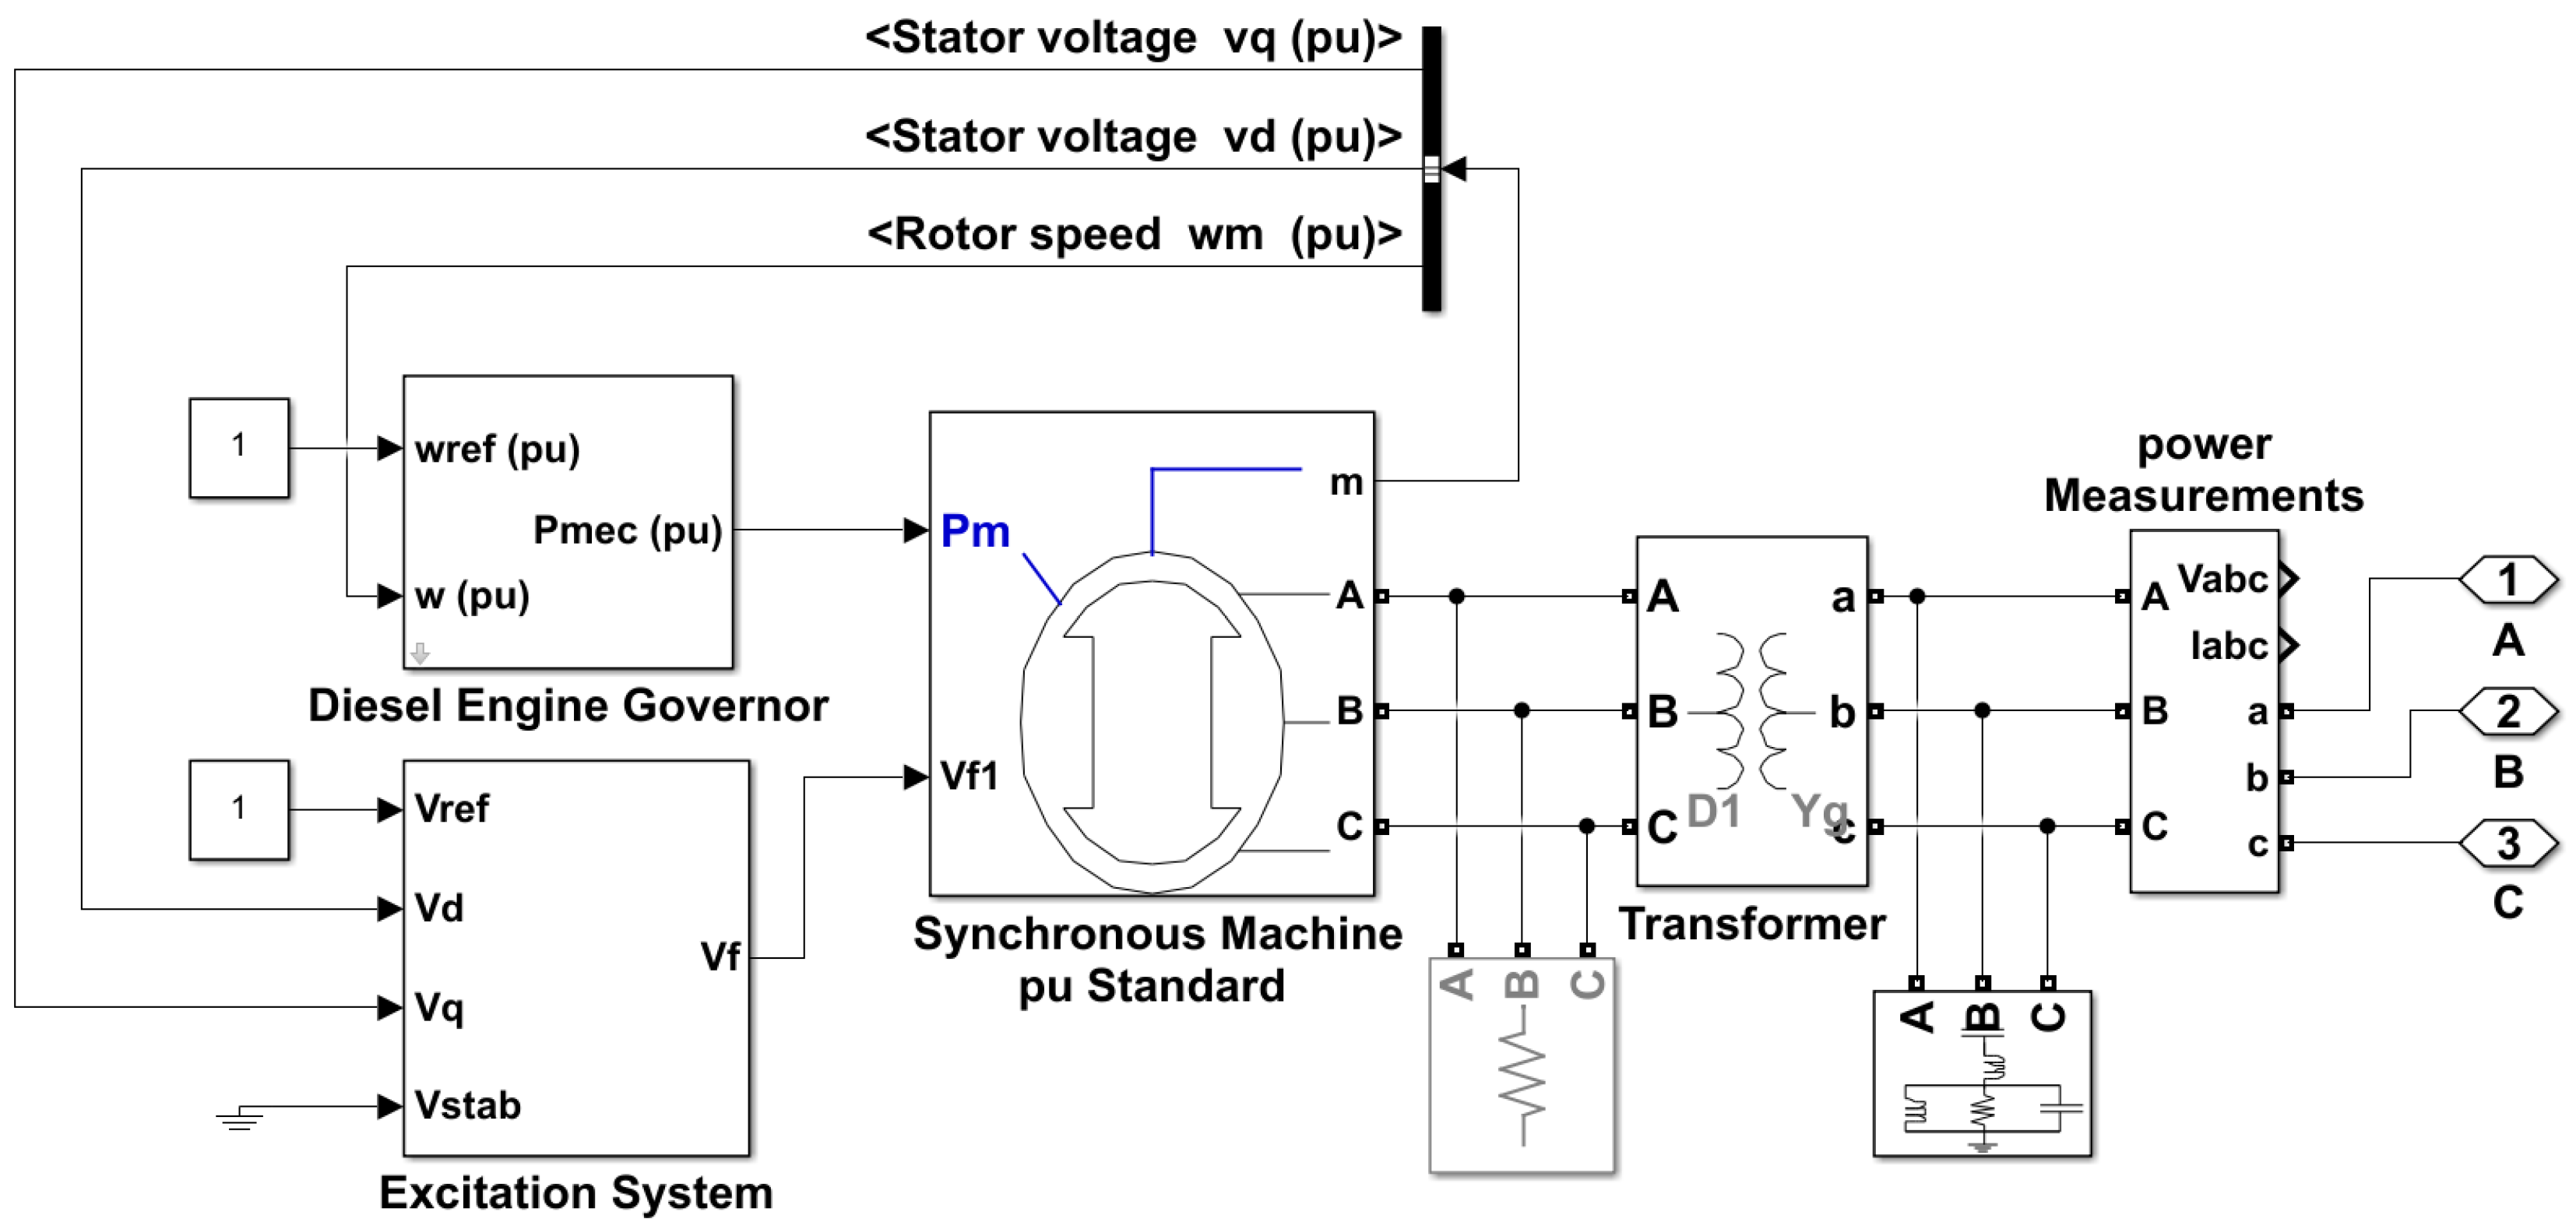
3.1.2. Diesel Generator
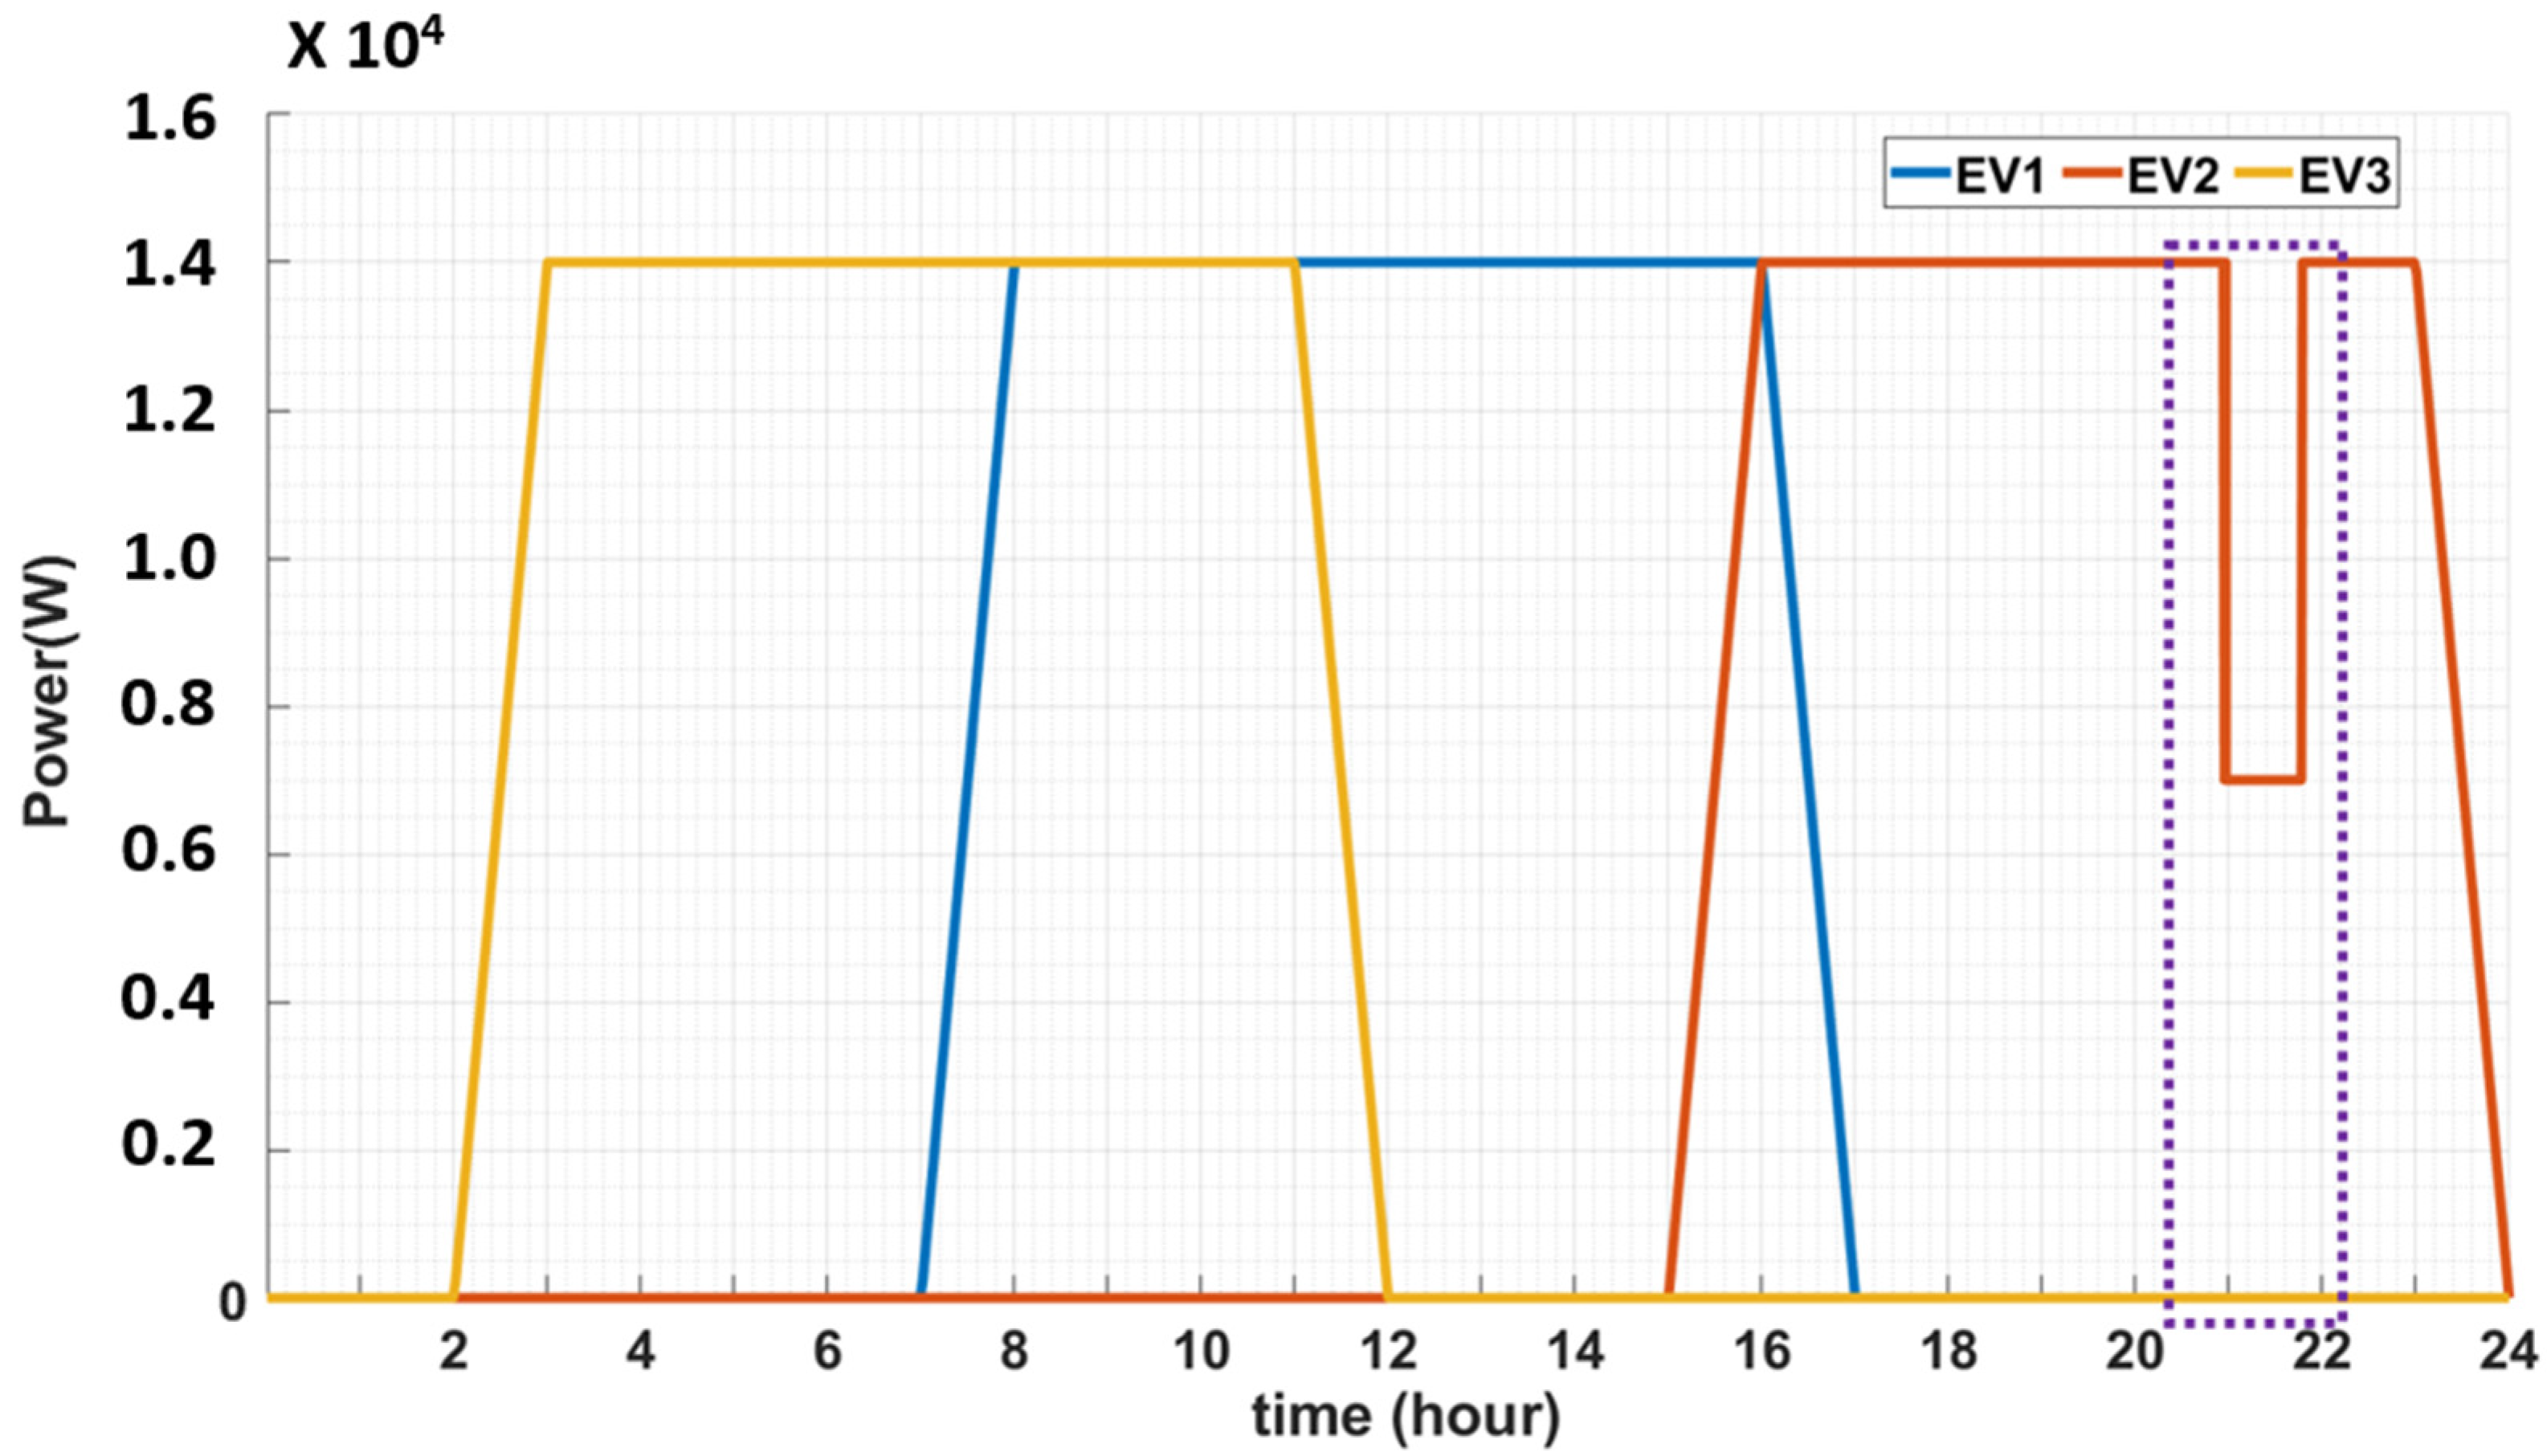
3.1.3. EV System
3.2. MPC Based Energy Management Strategy
3.3. Optimal Power Control of ESS for Hosting Capacity of EV and PVs
- Step 1.
- Charging/discharging mode of ESS
- Step 2.
- On/Off control of diesel generator DG2
- Step 3.
- Power control of EV charger
4. Case Studies
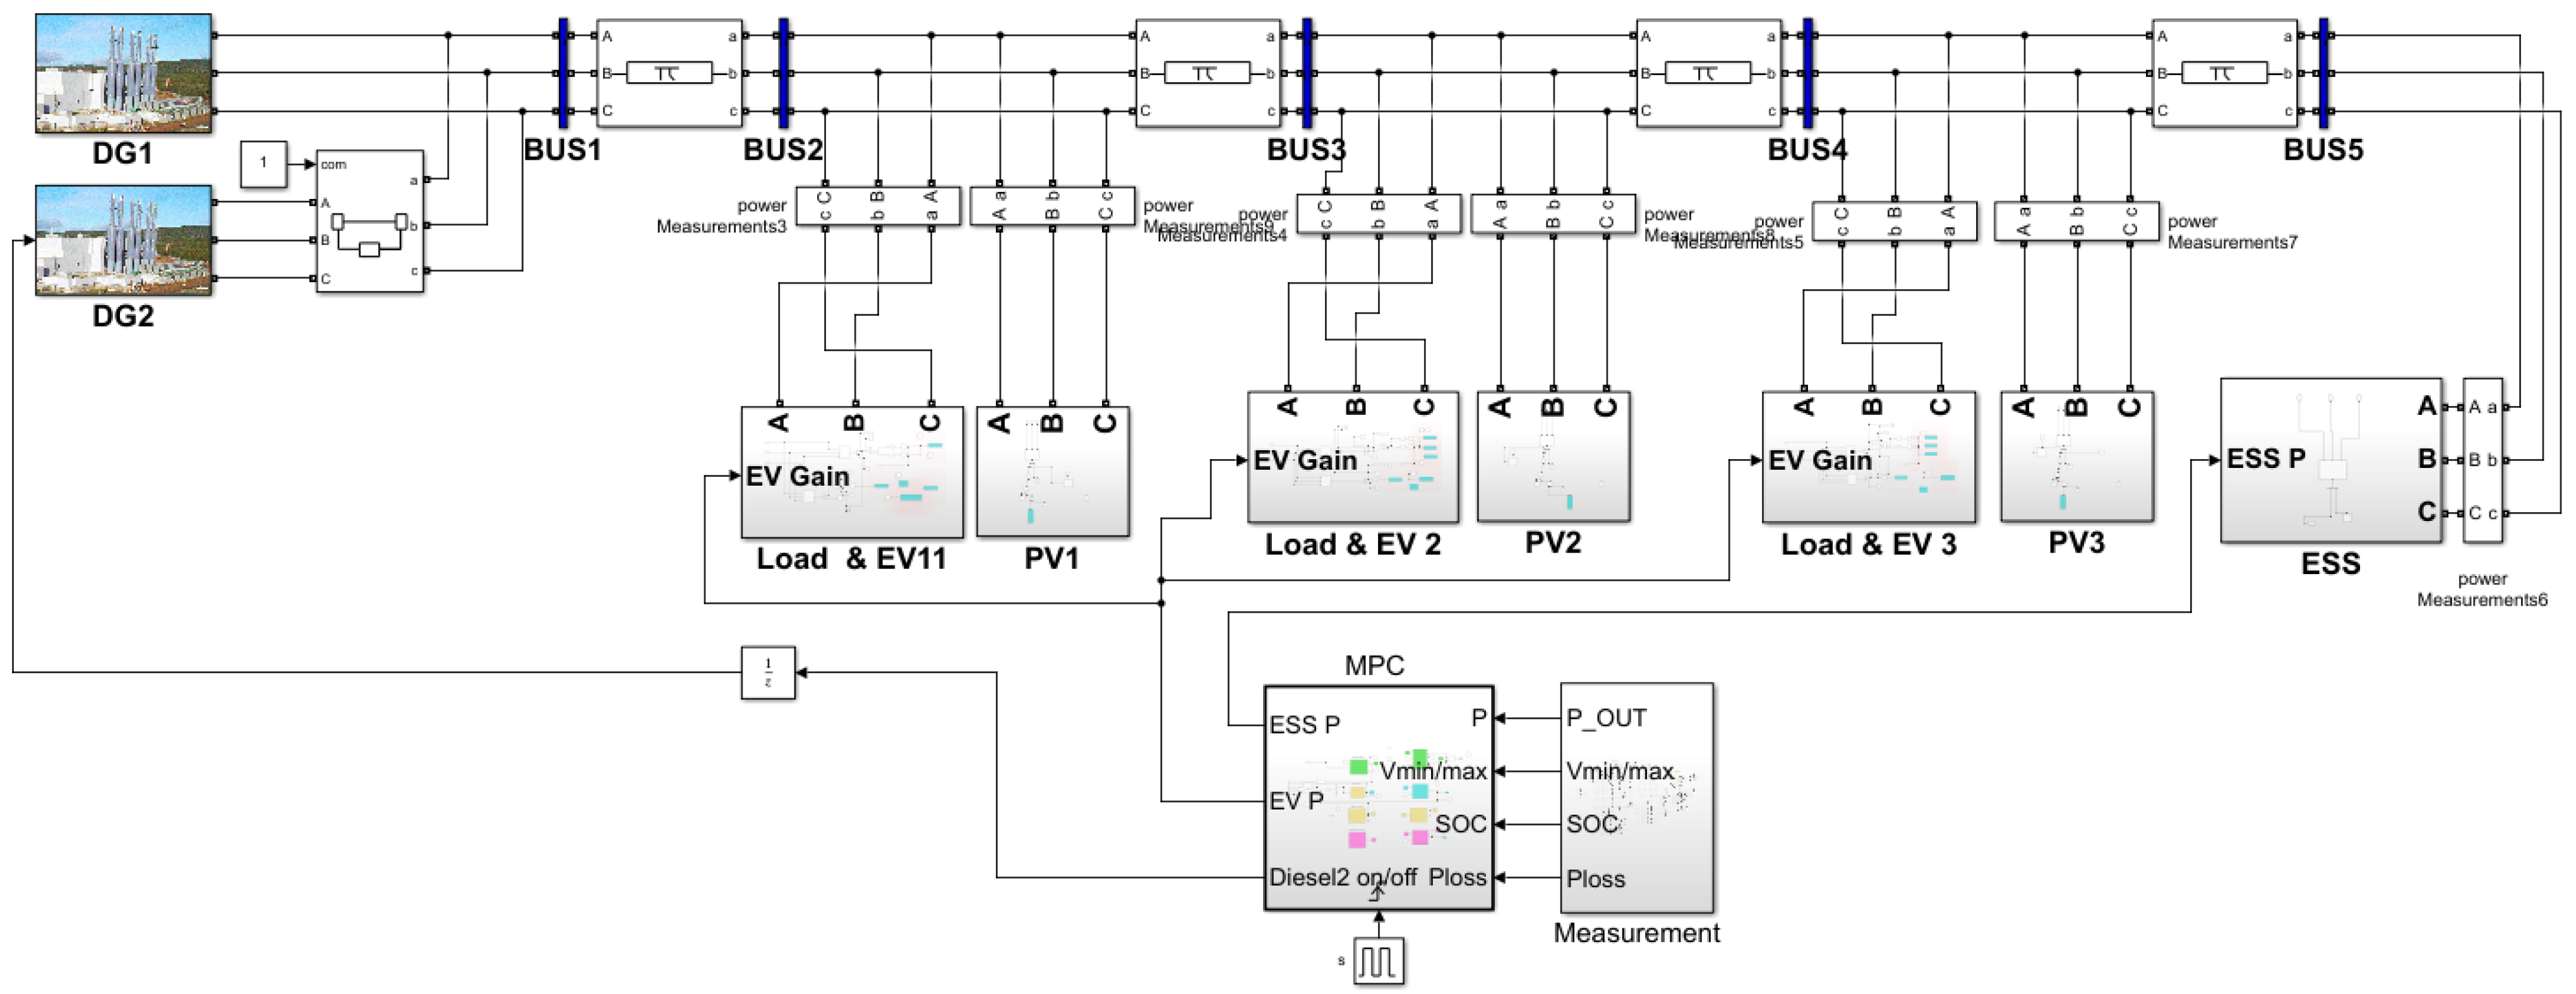
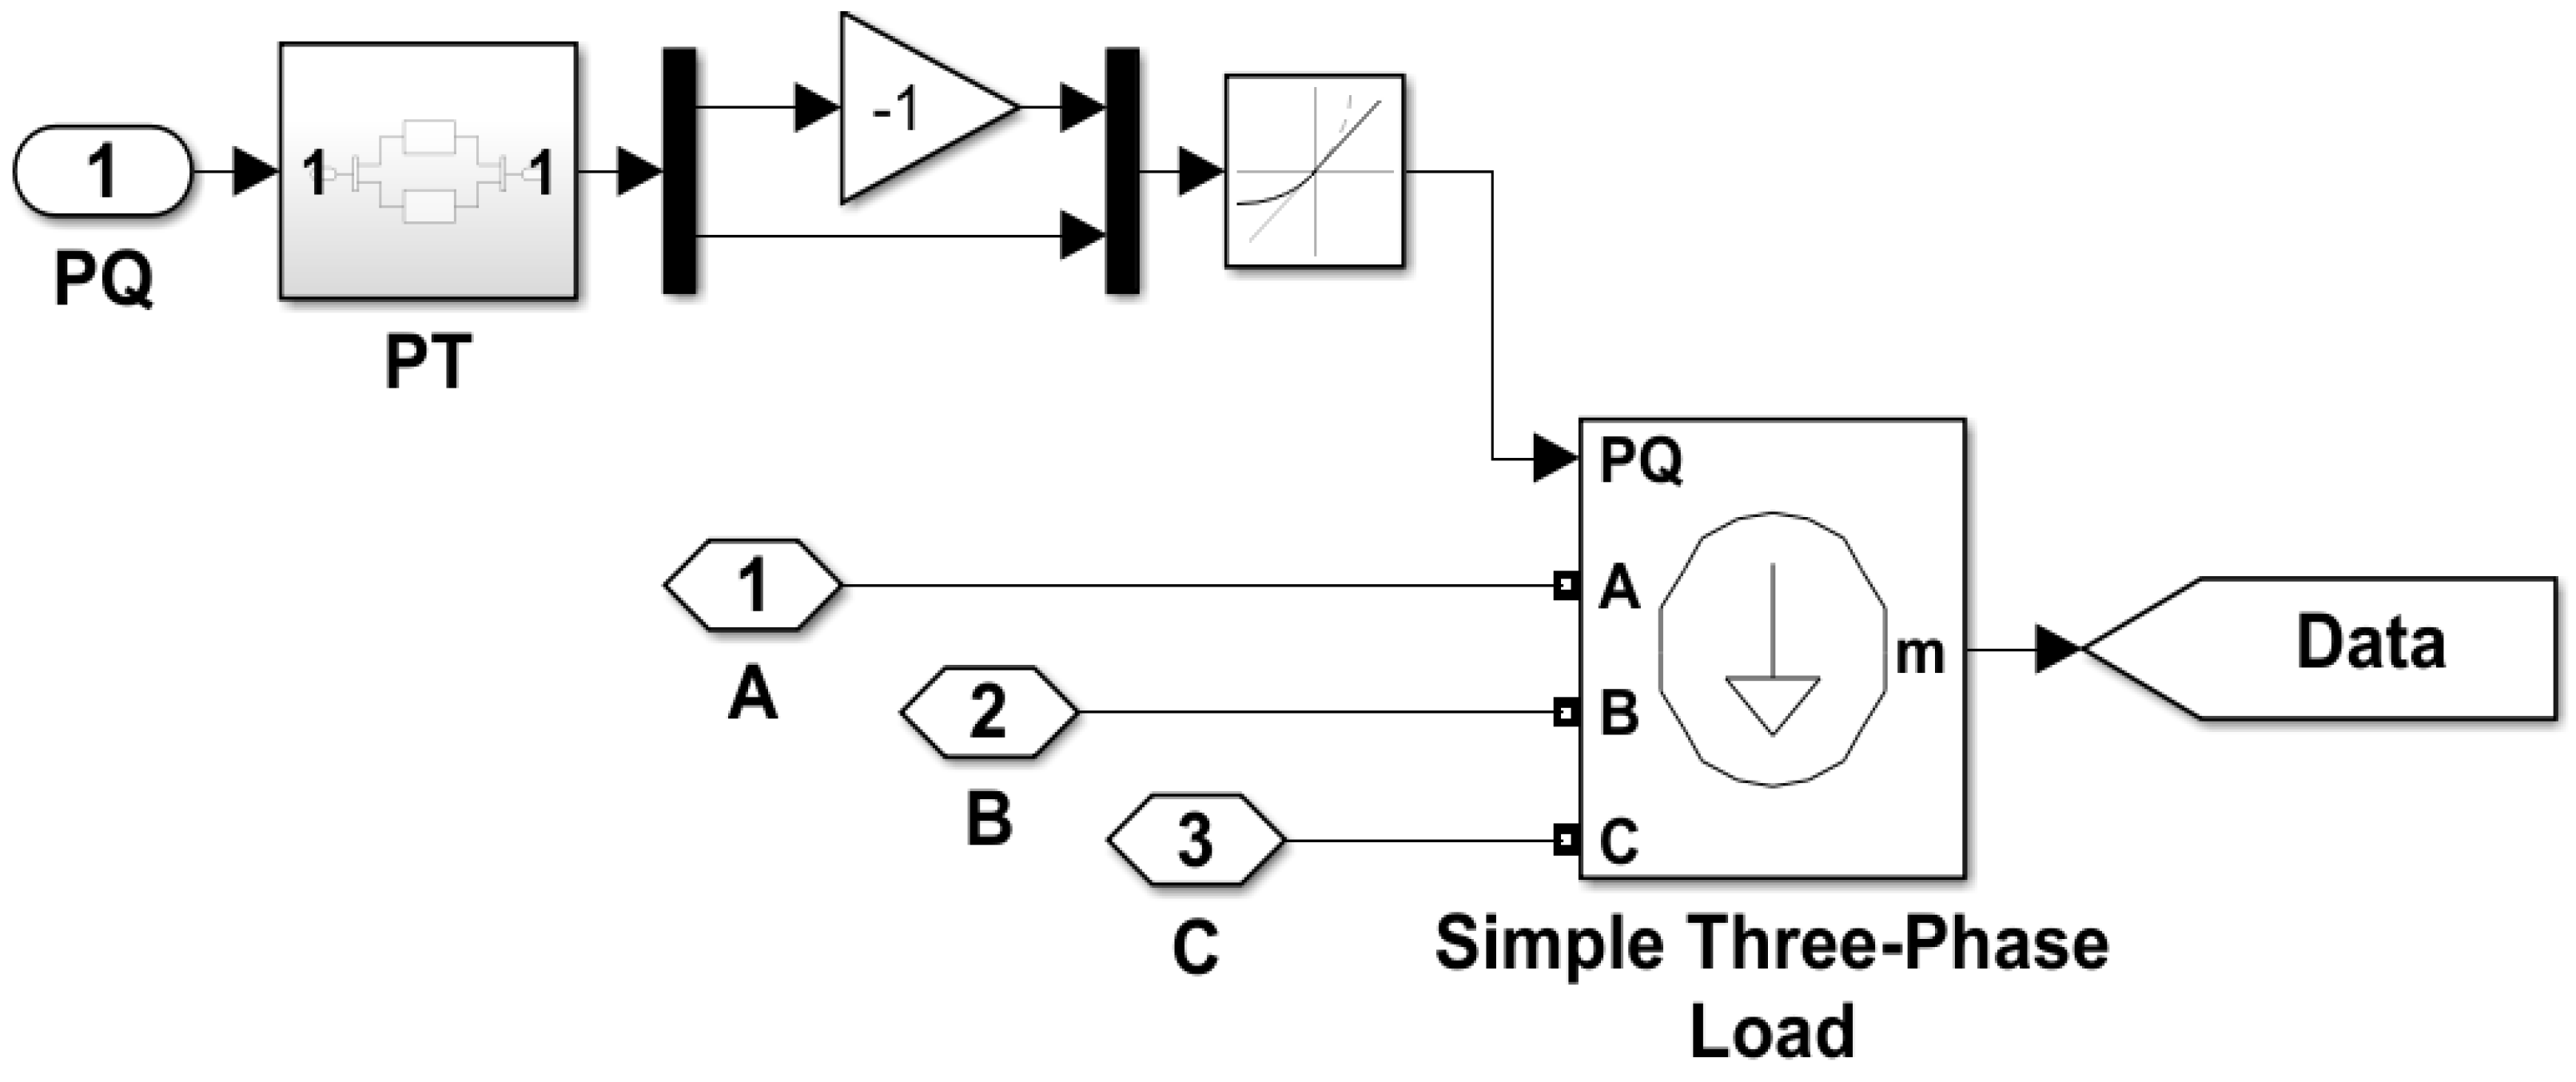
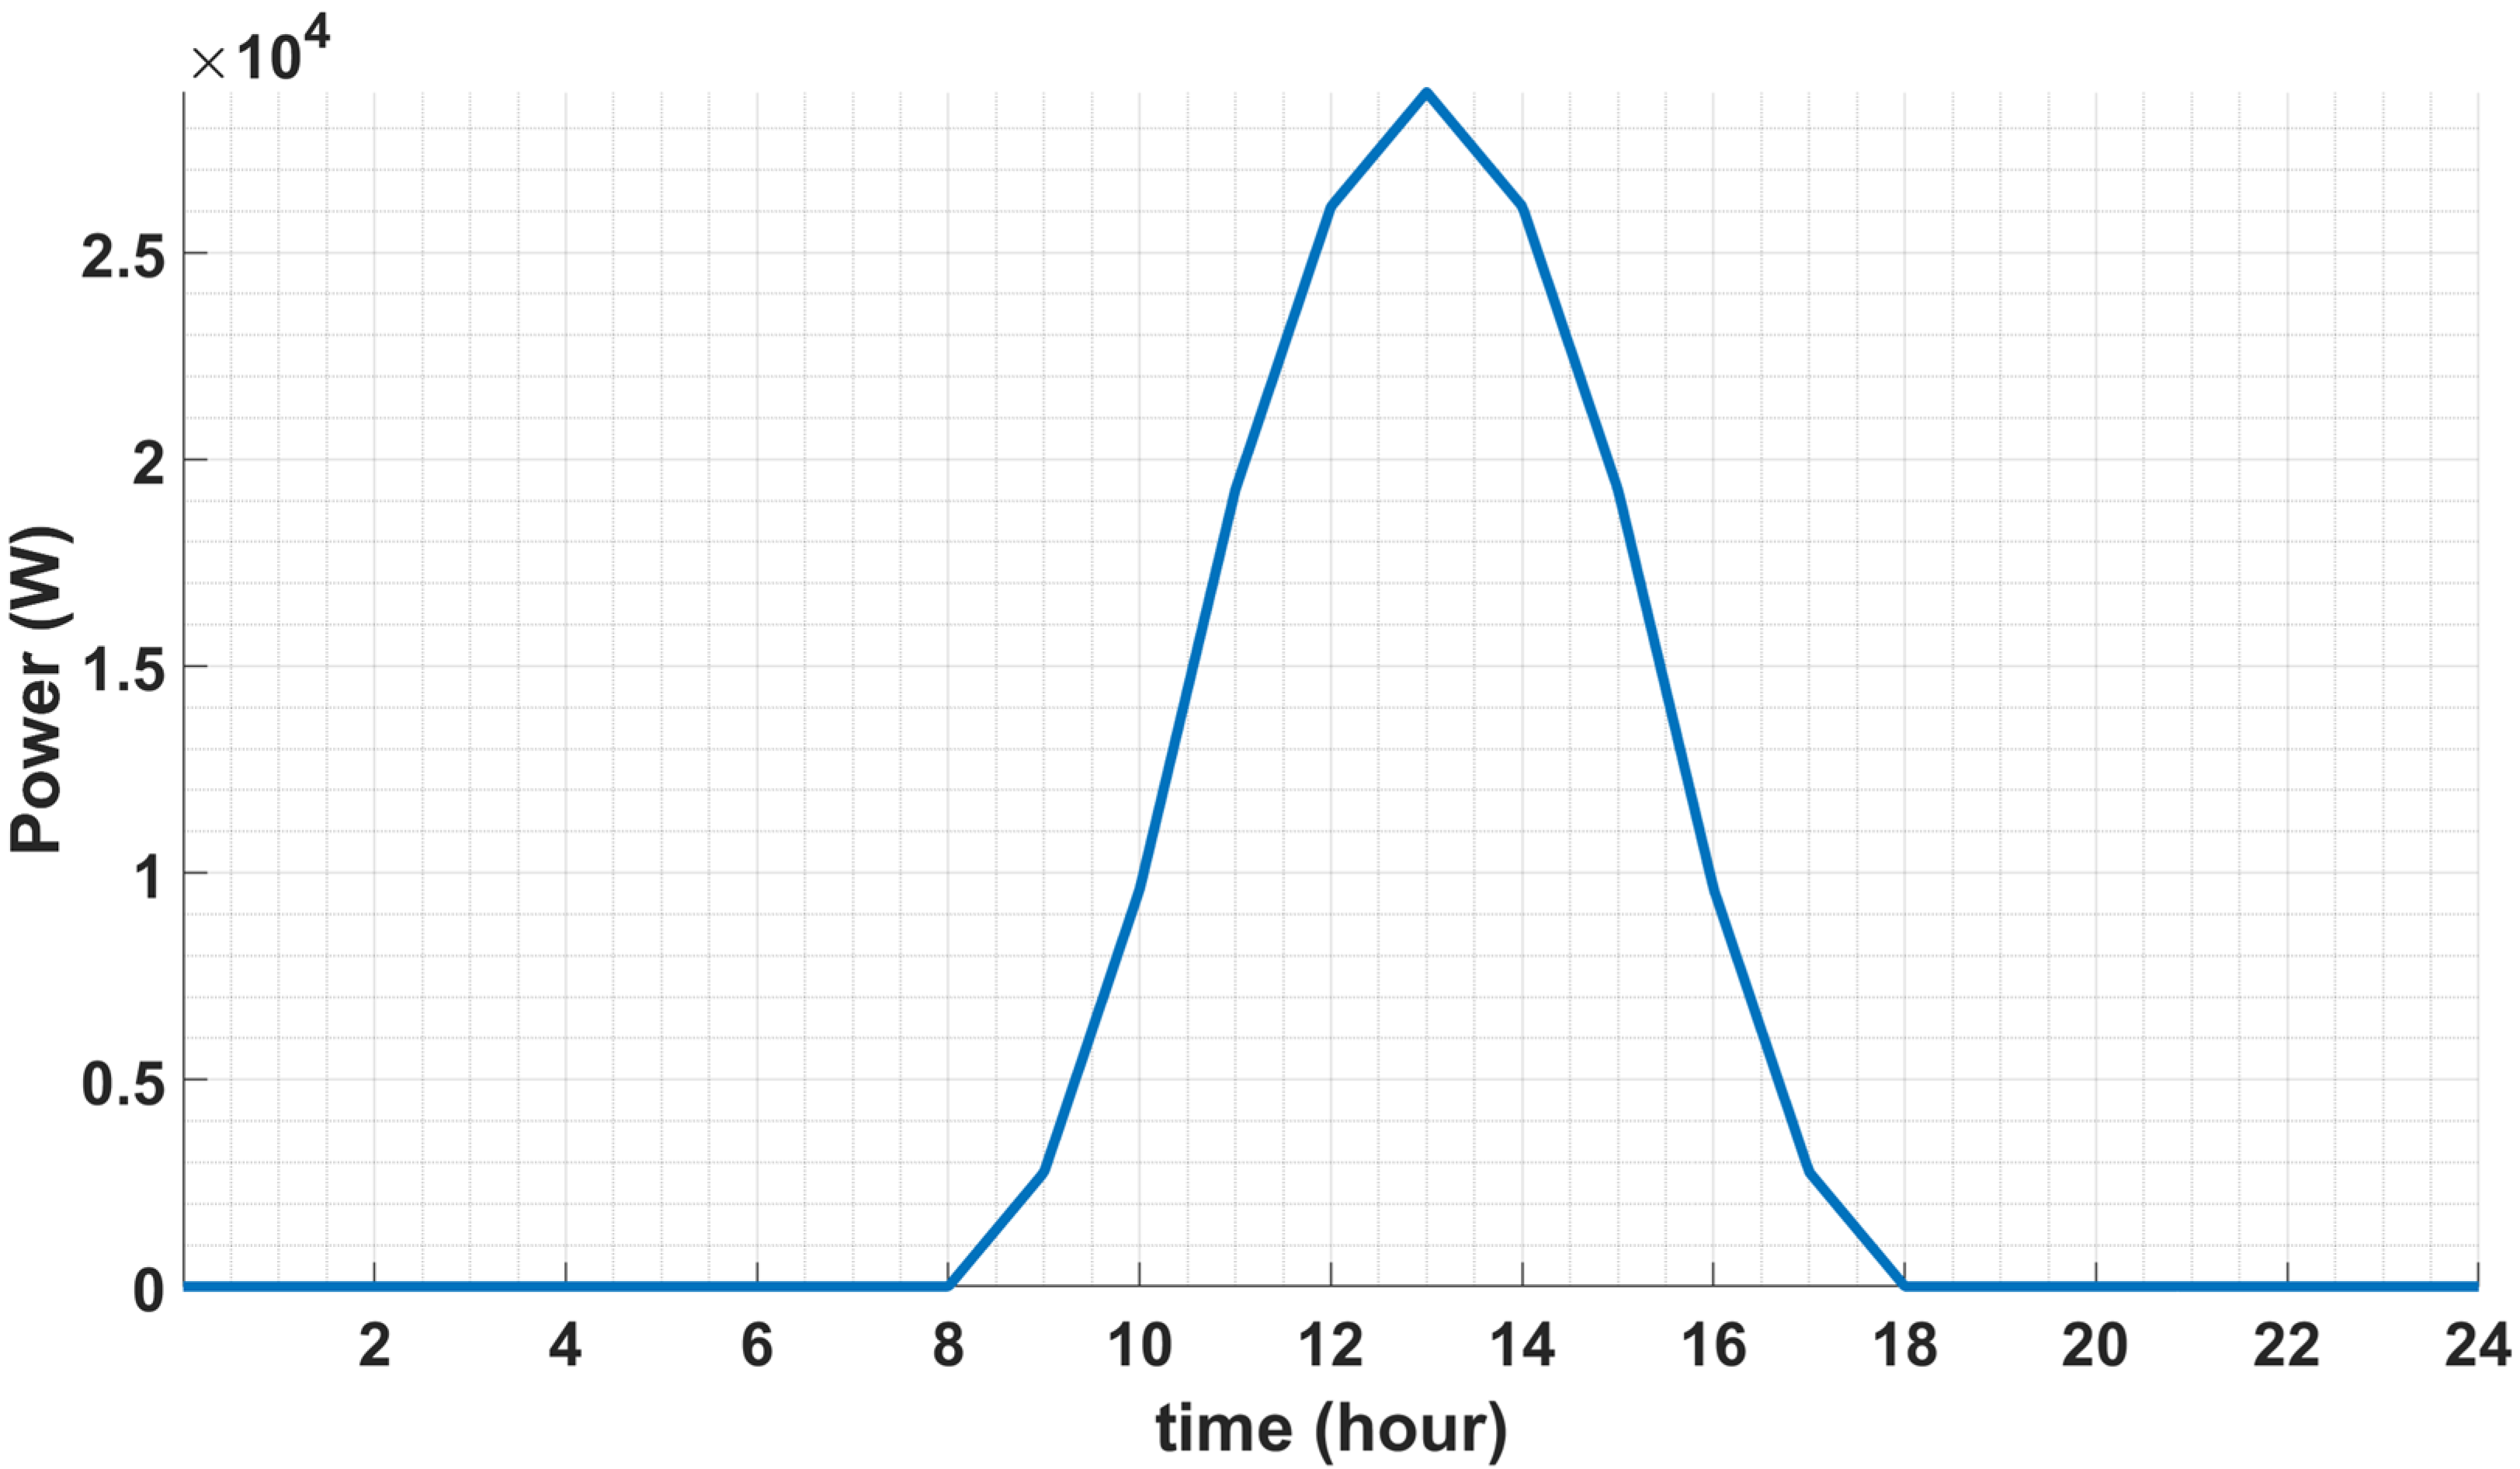
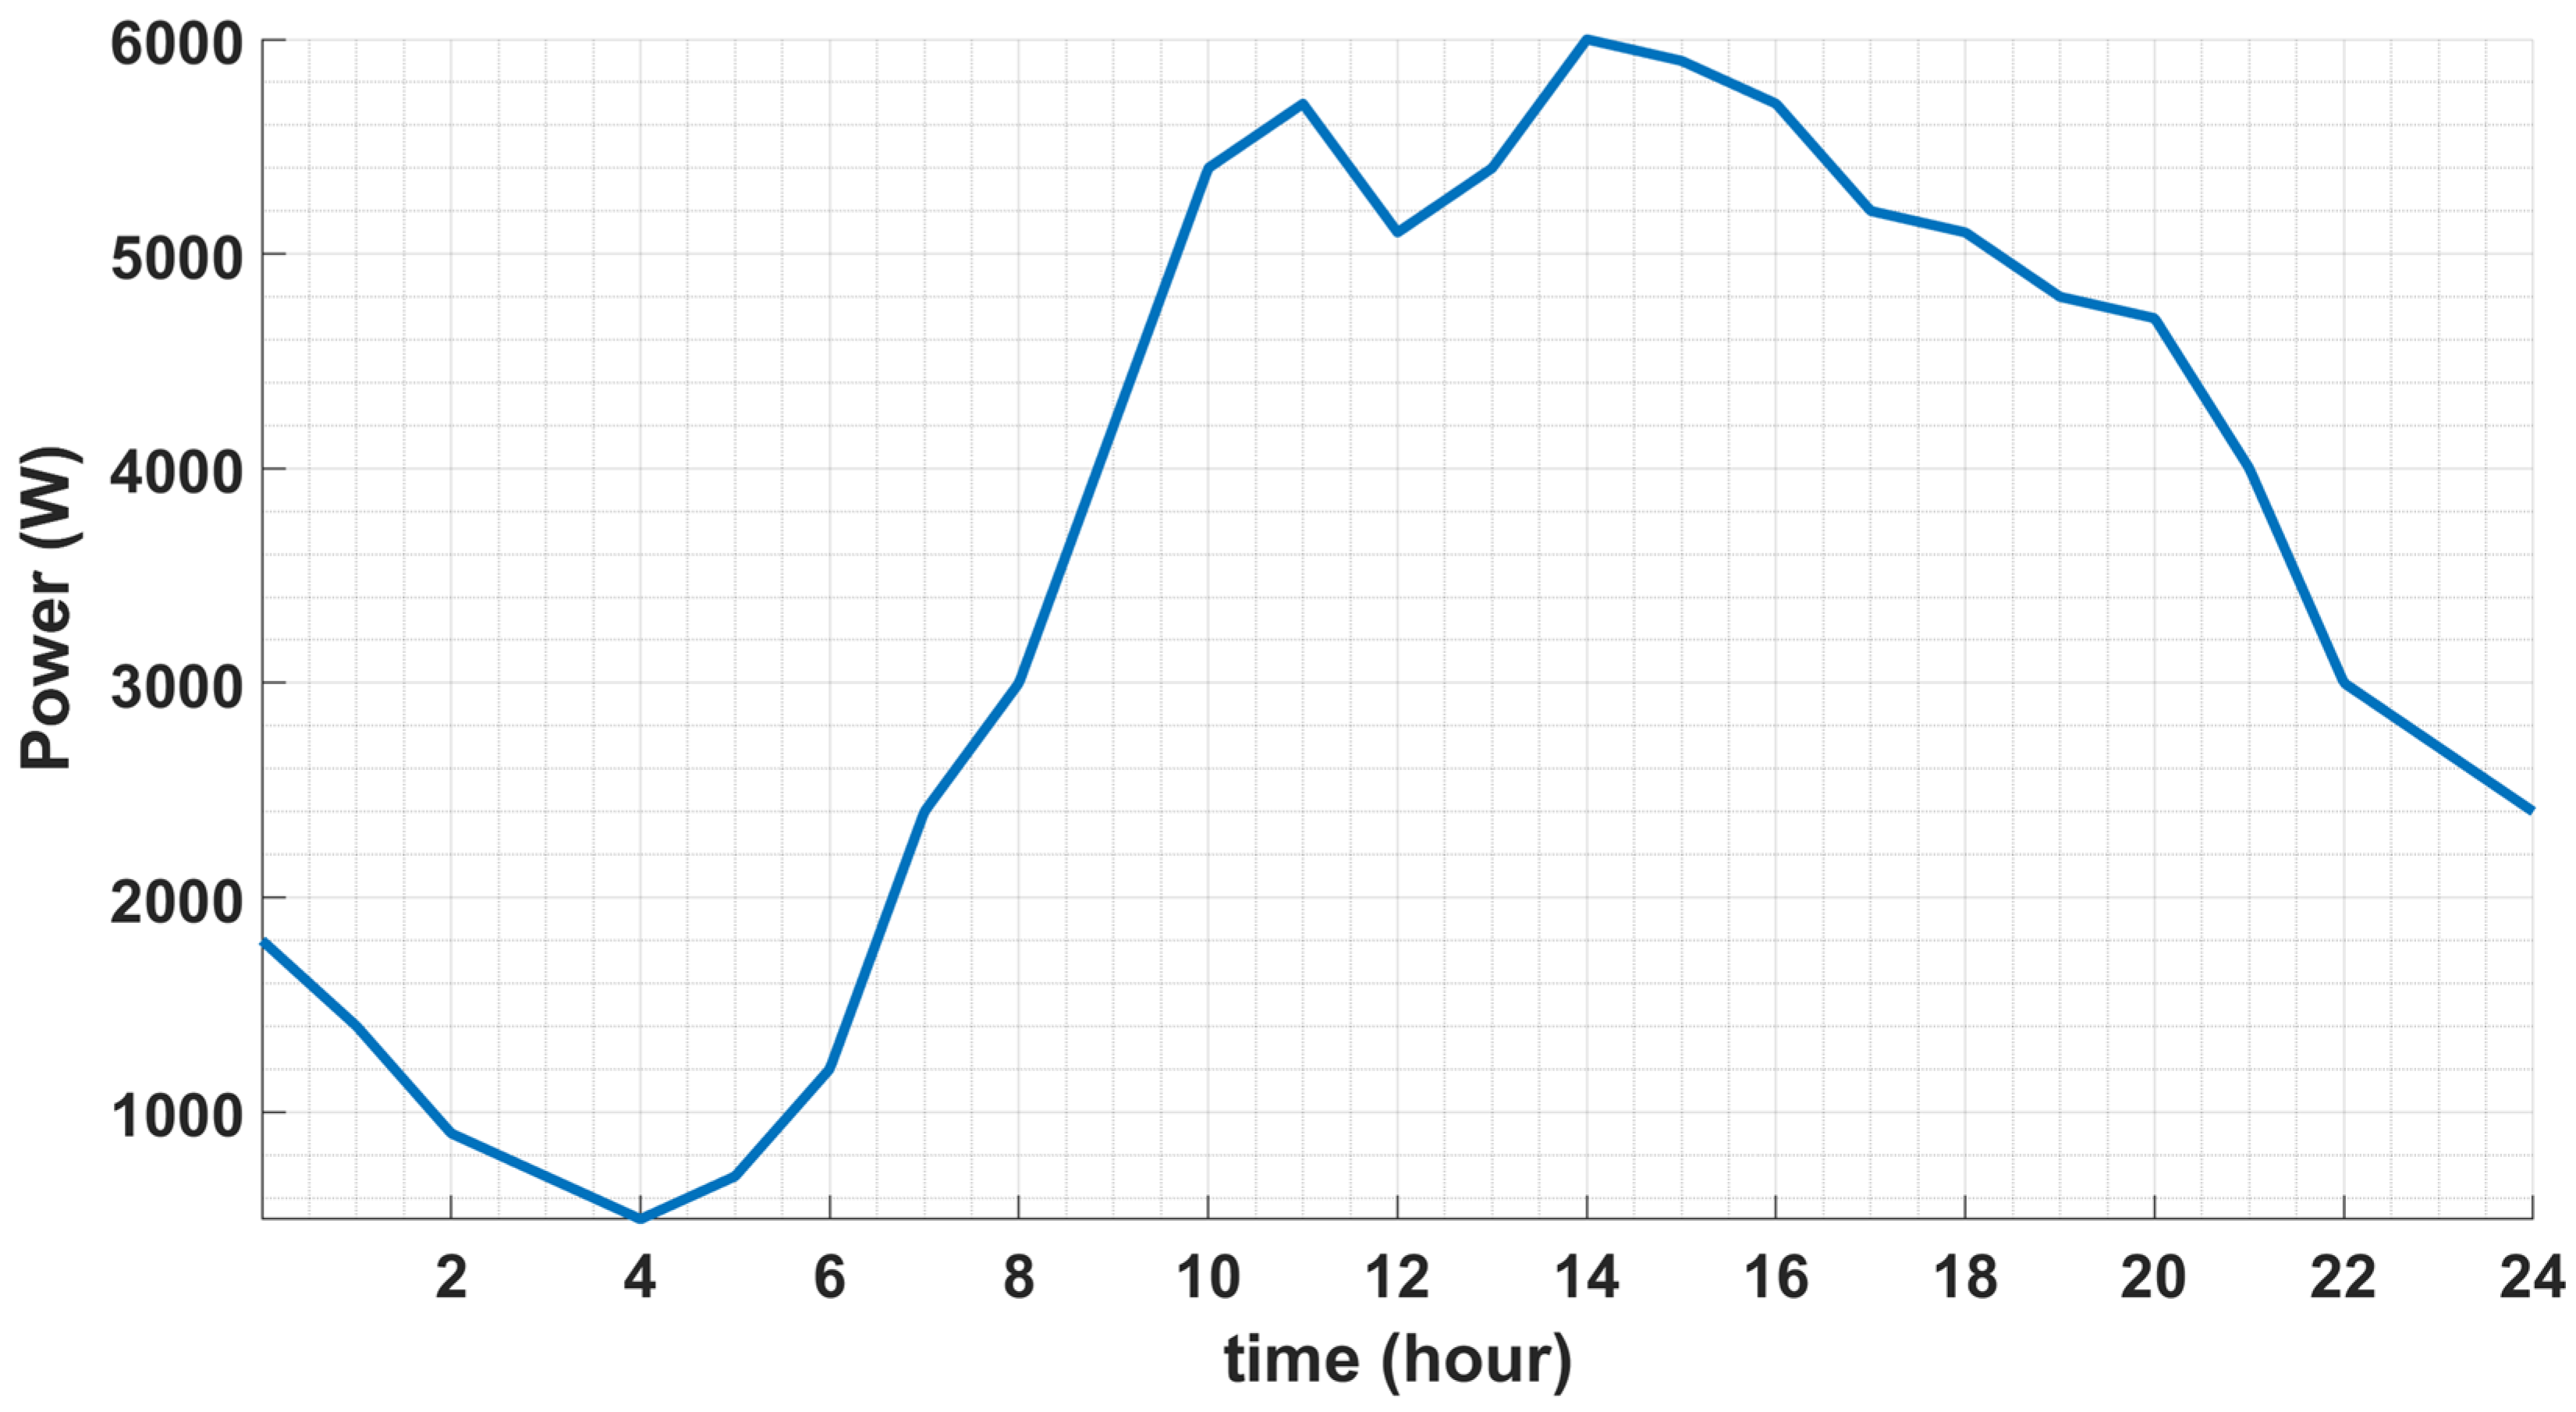
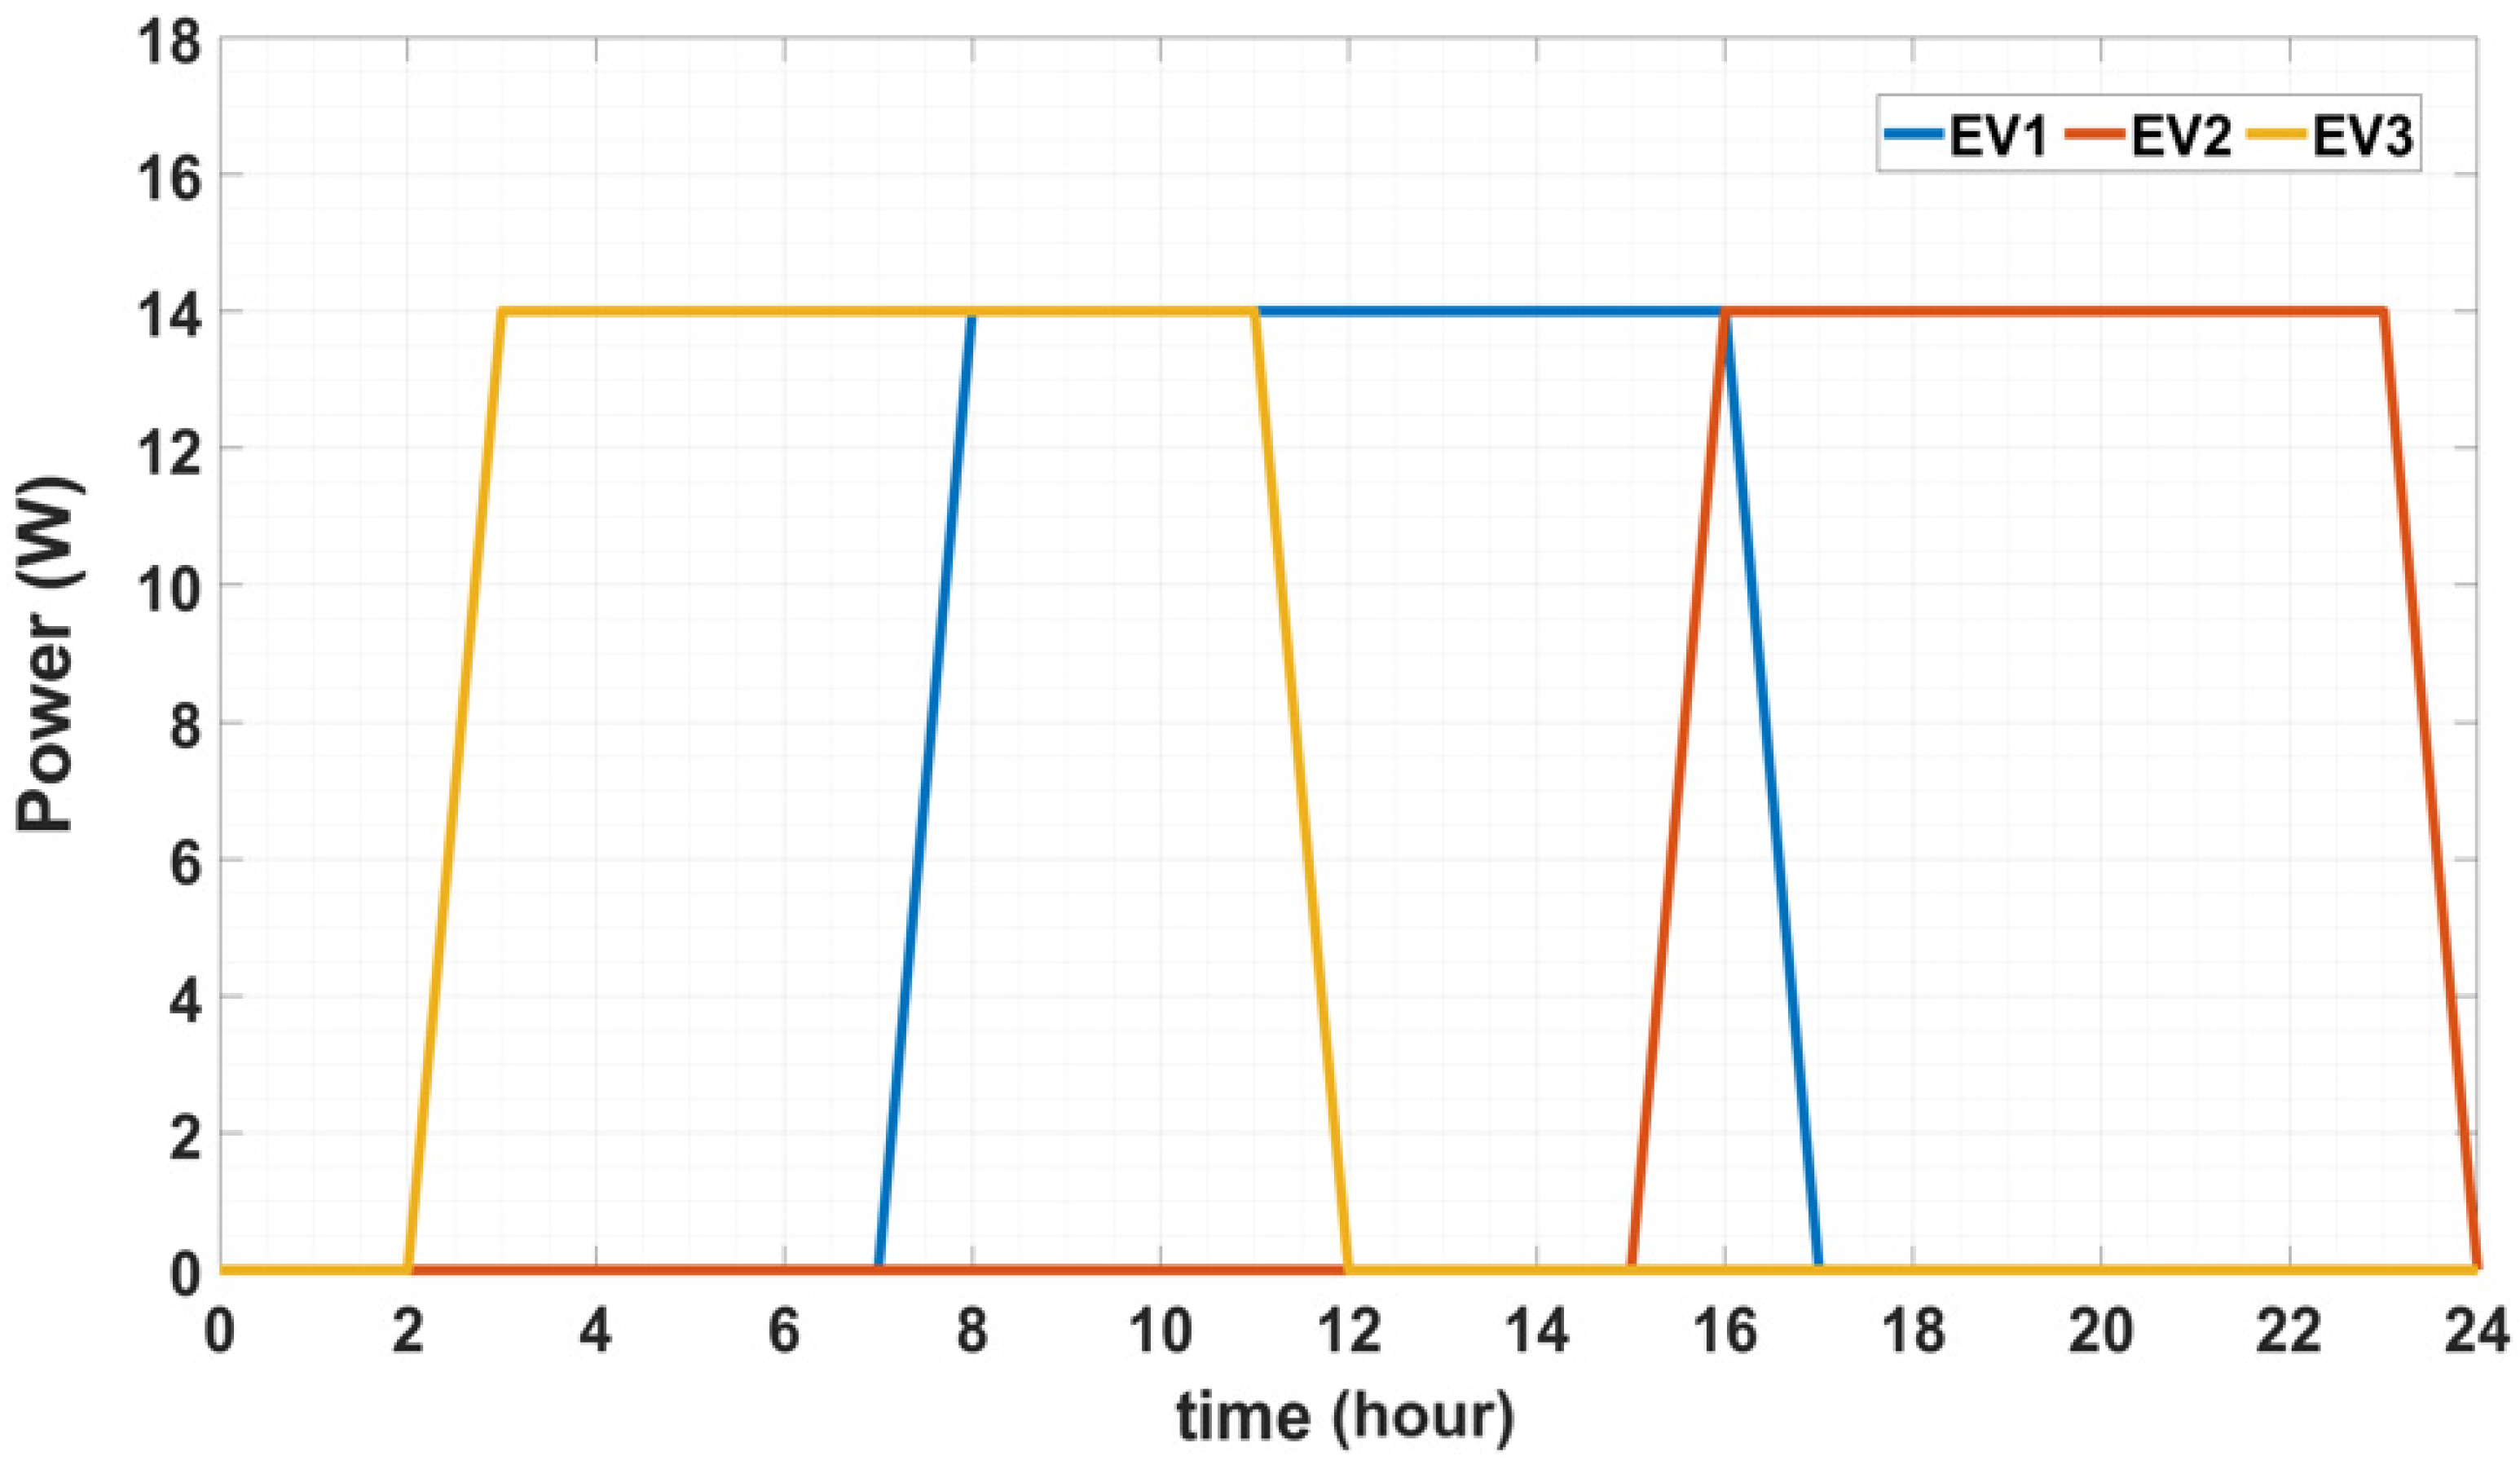
4.1. Simulation Model
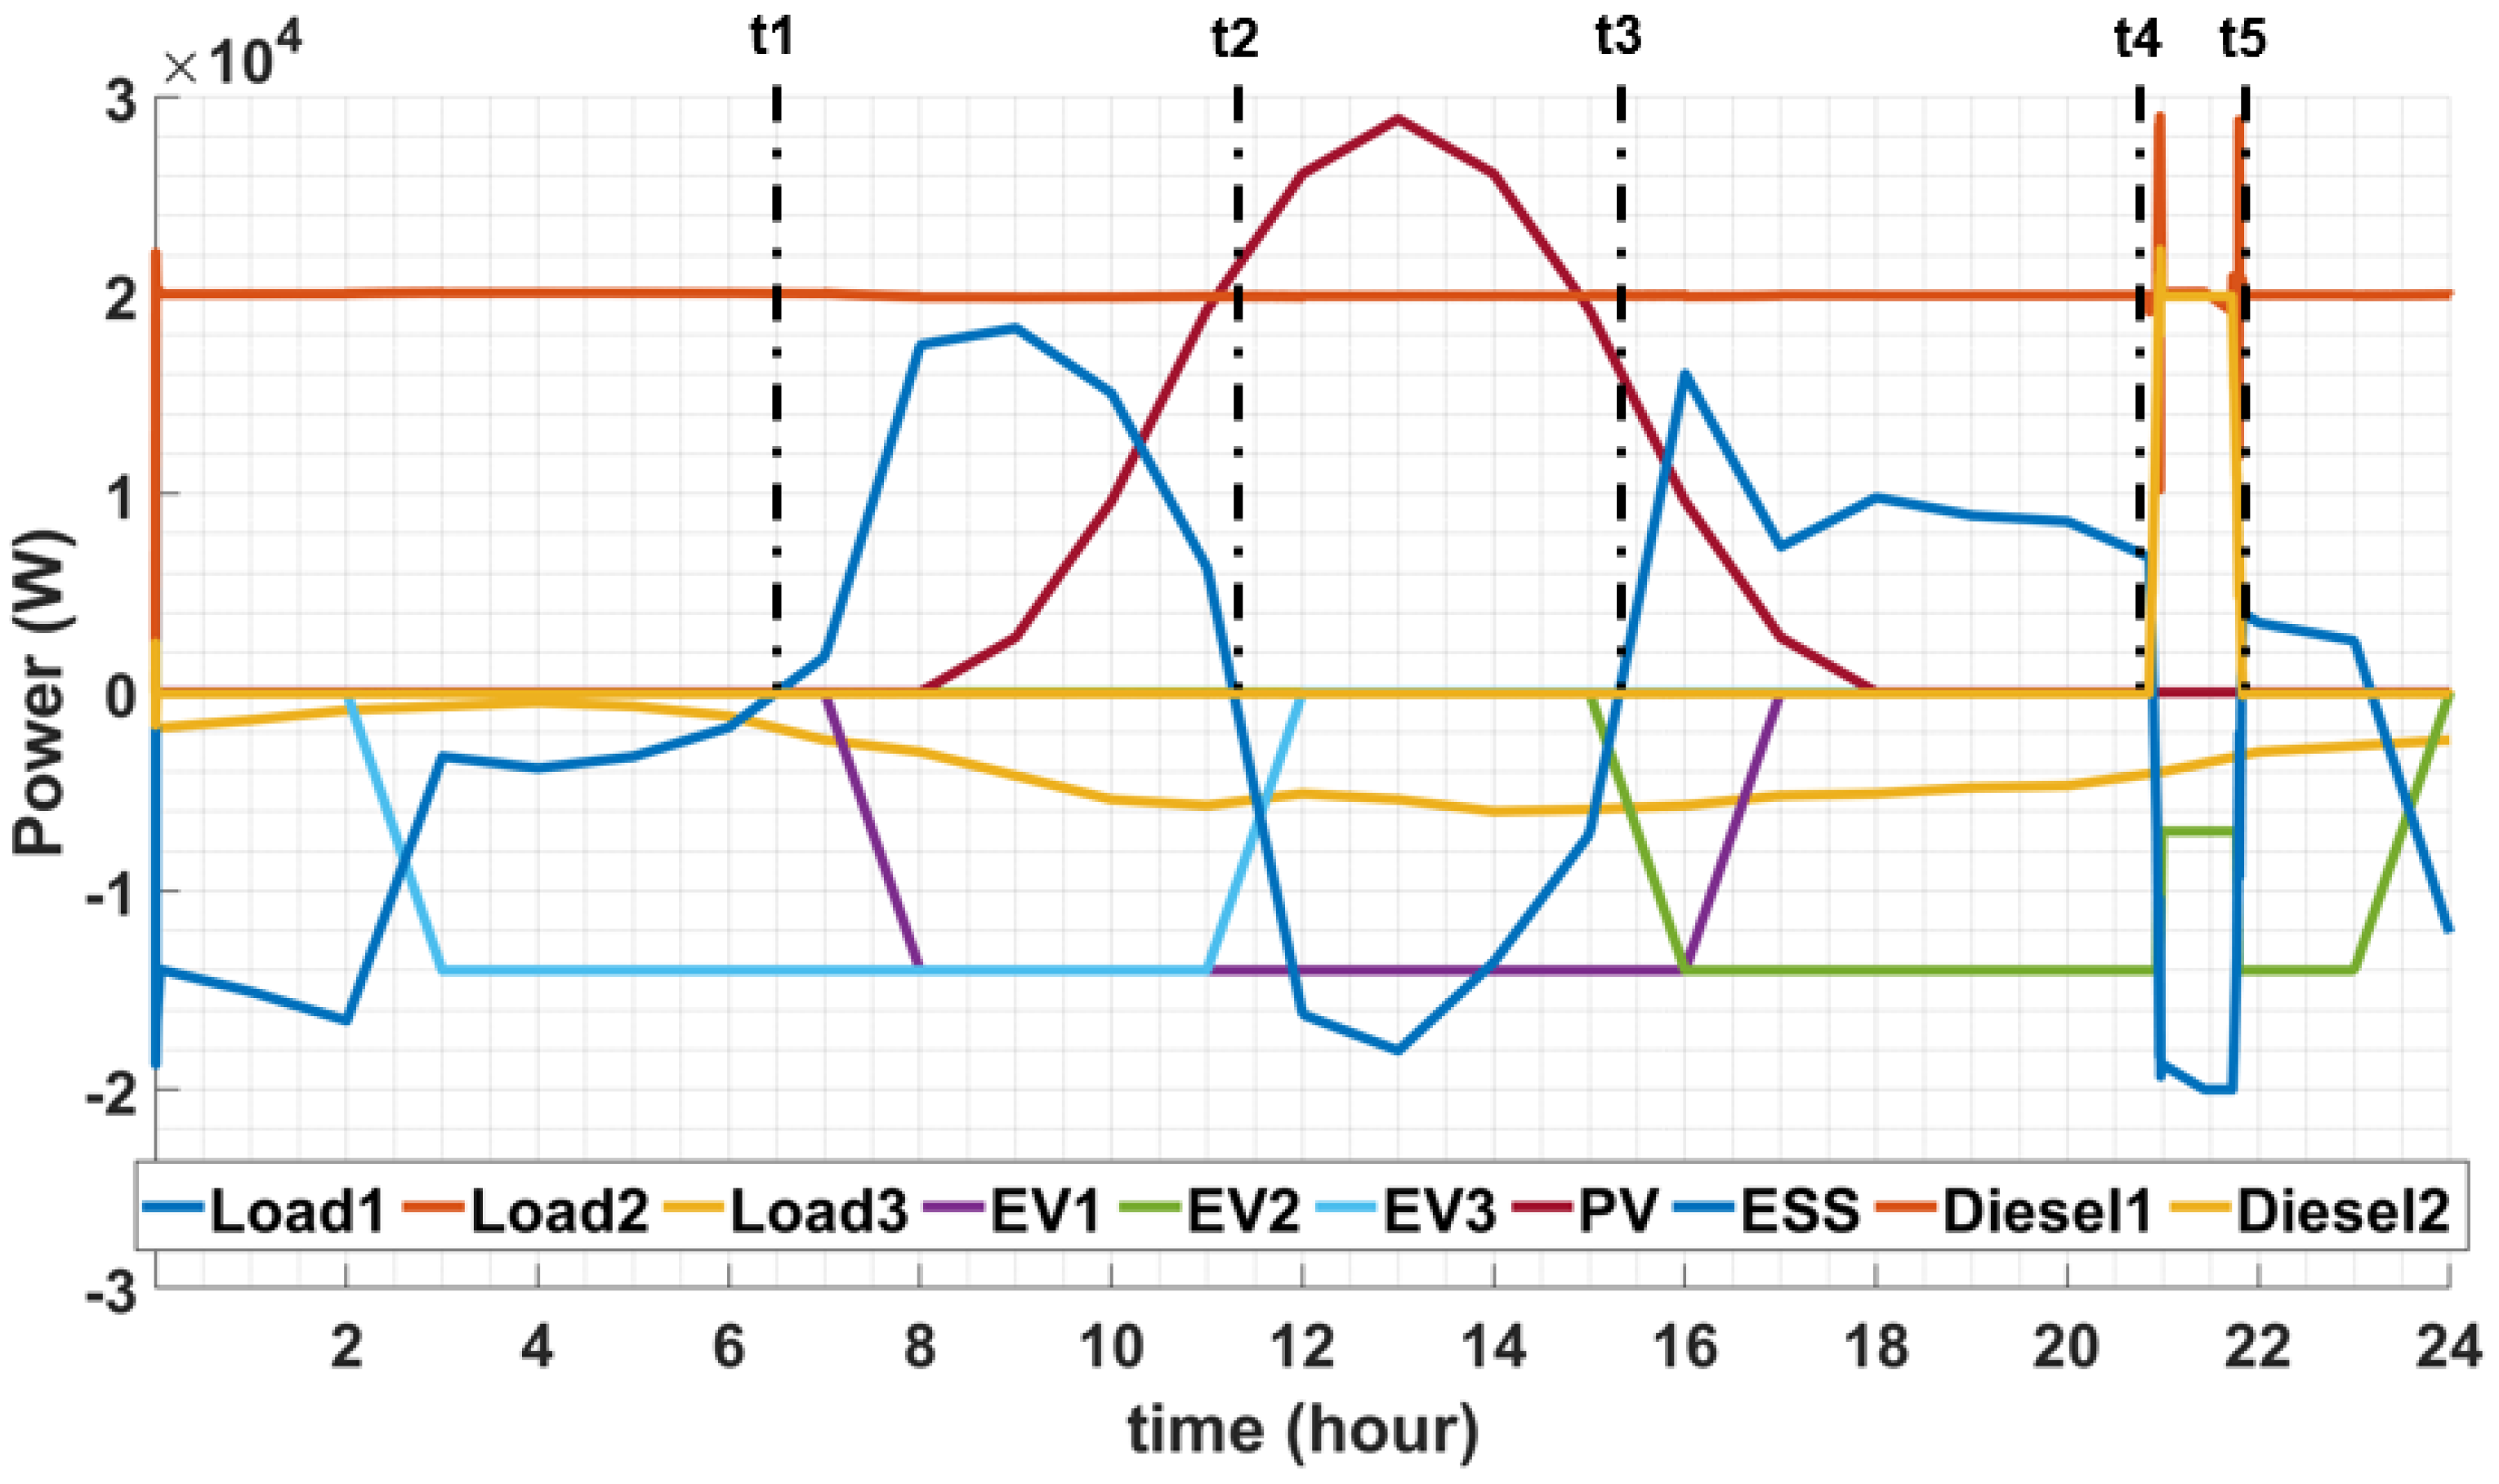
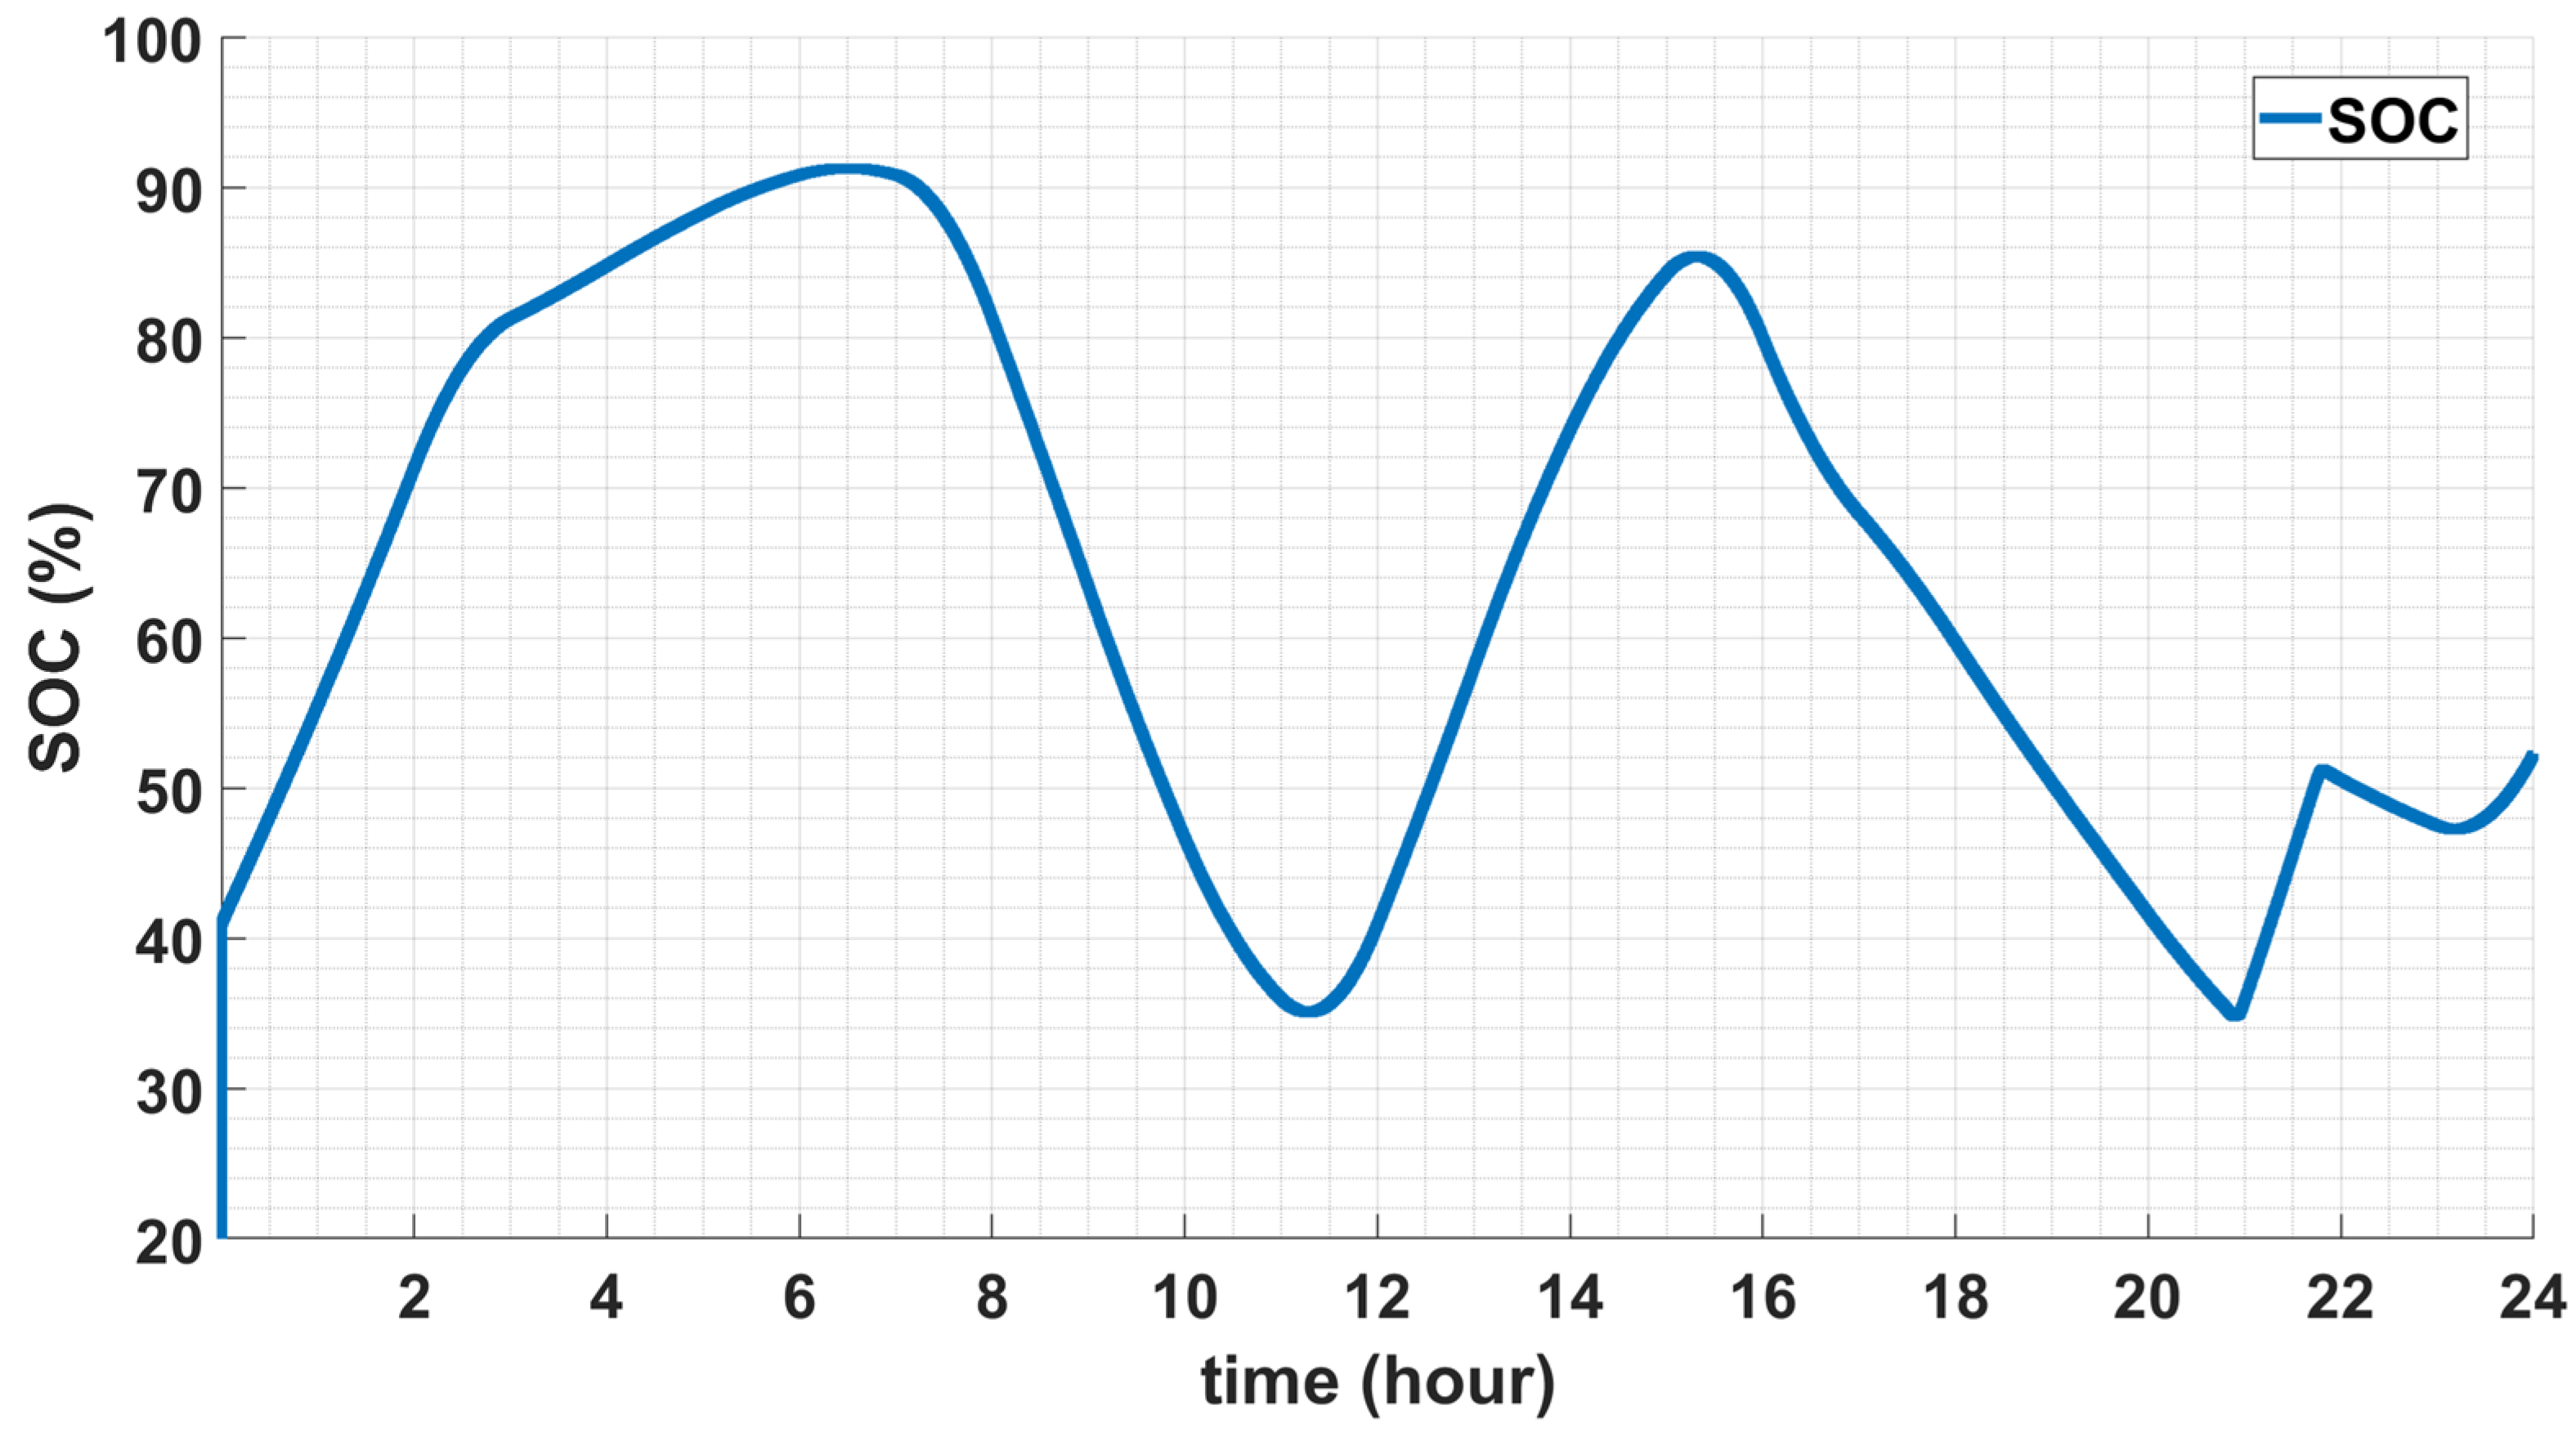
4.2. Power Characteristic of Stand-Alone MG with EV Charger and ESS
- (1)
- Operation characteristics of a stand-alone MG with EV charger and ESS
- -
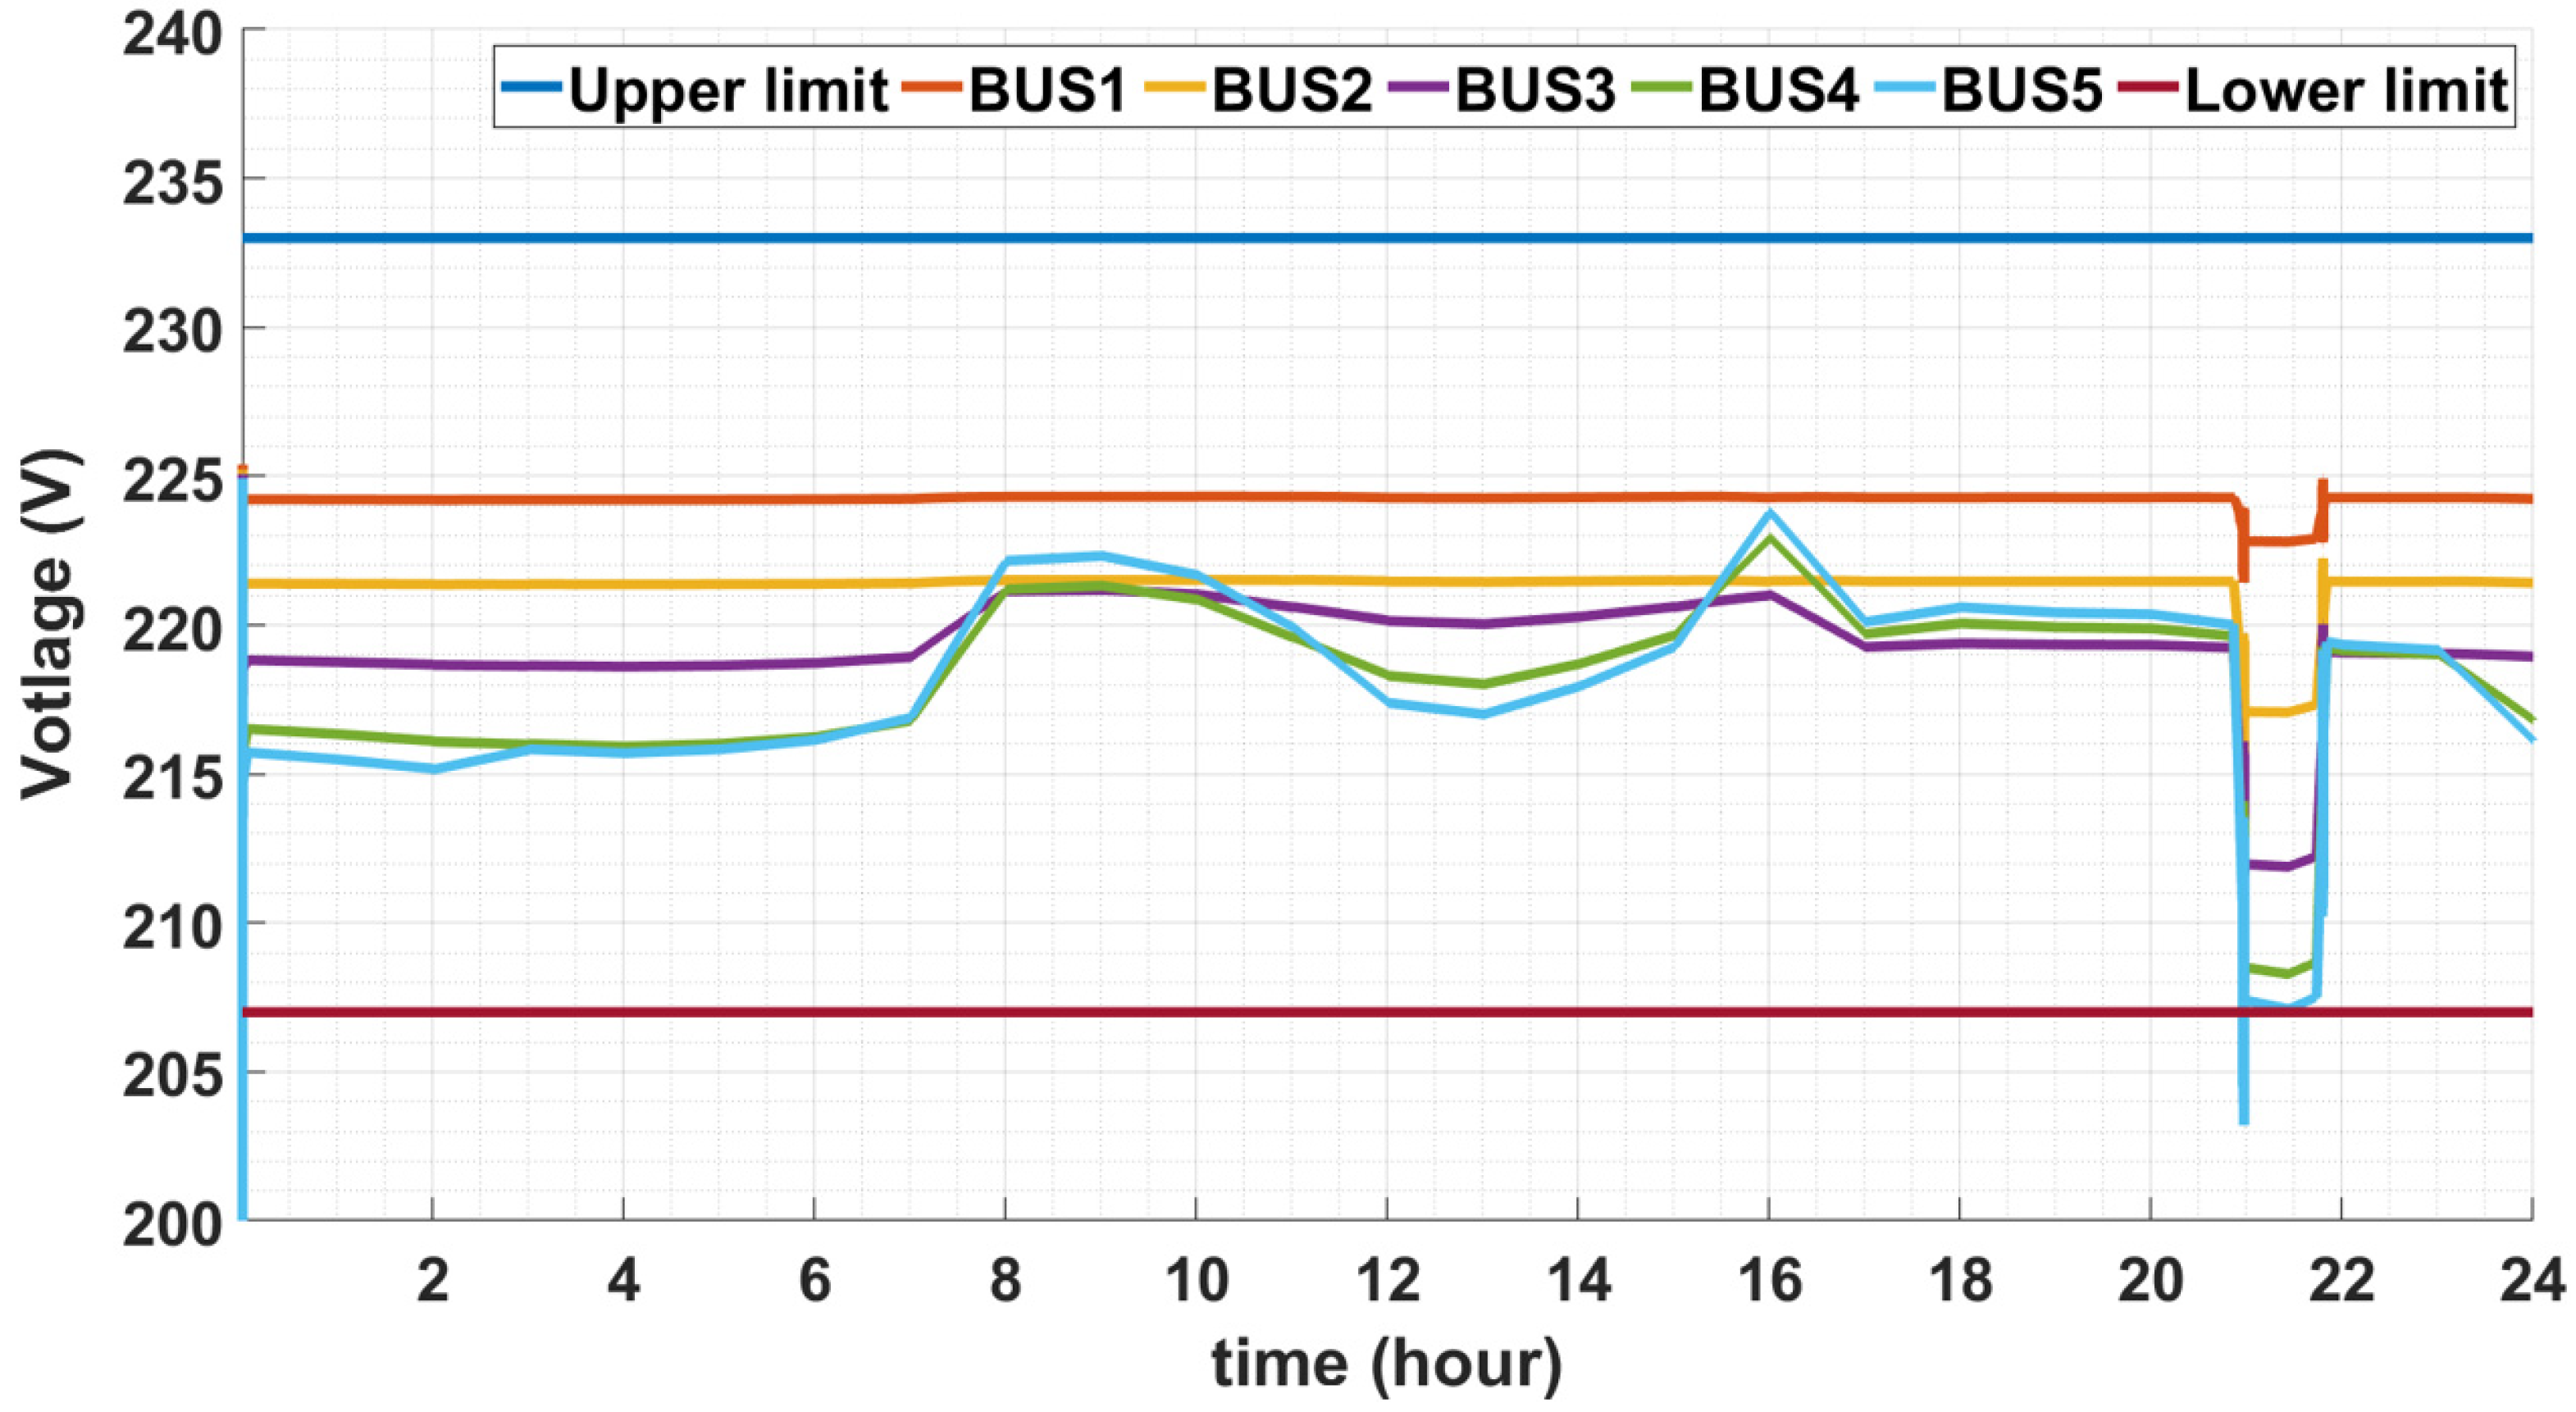
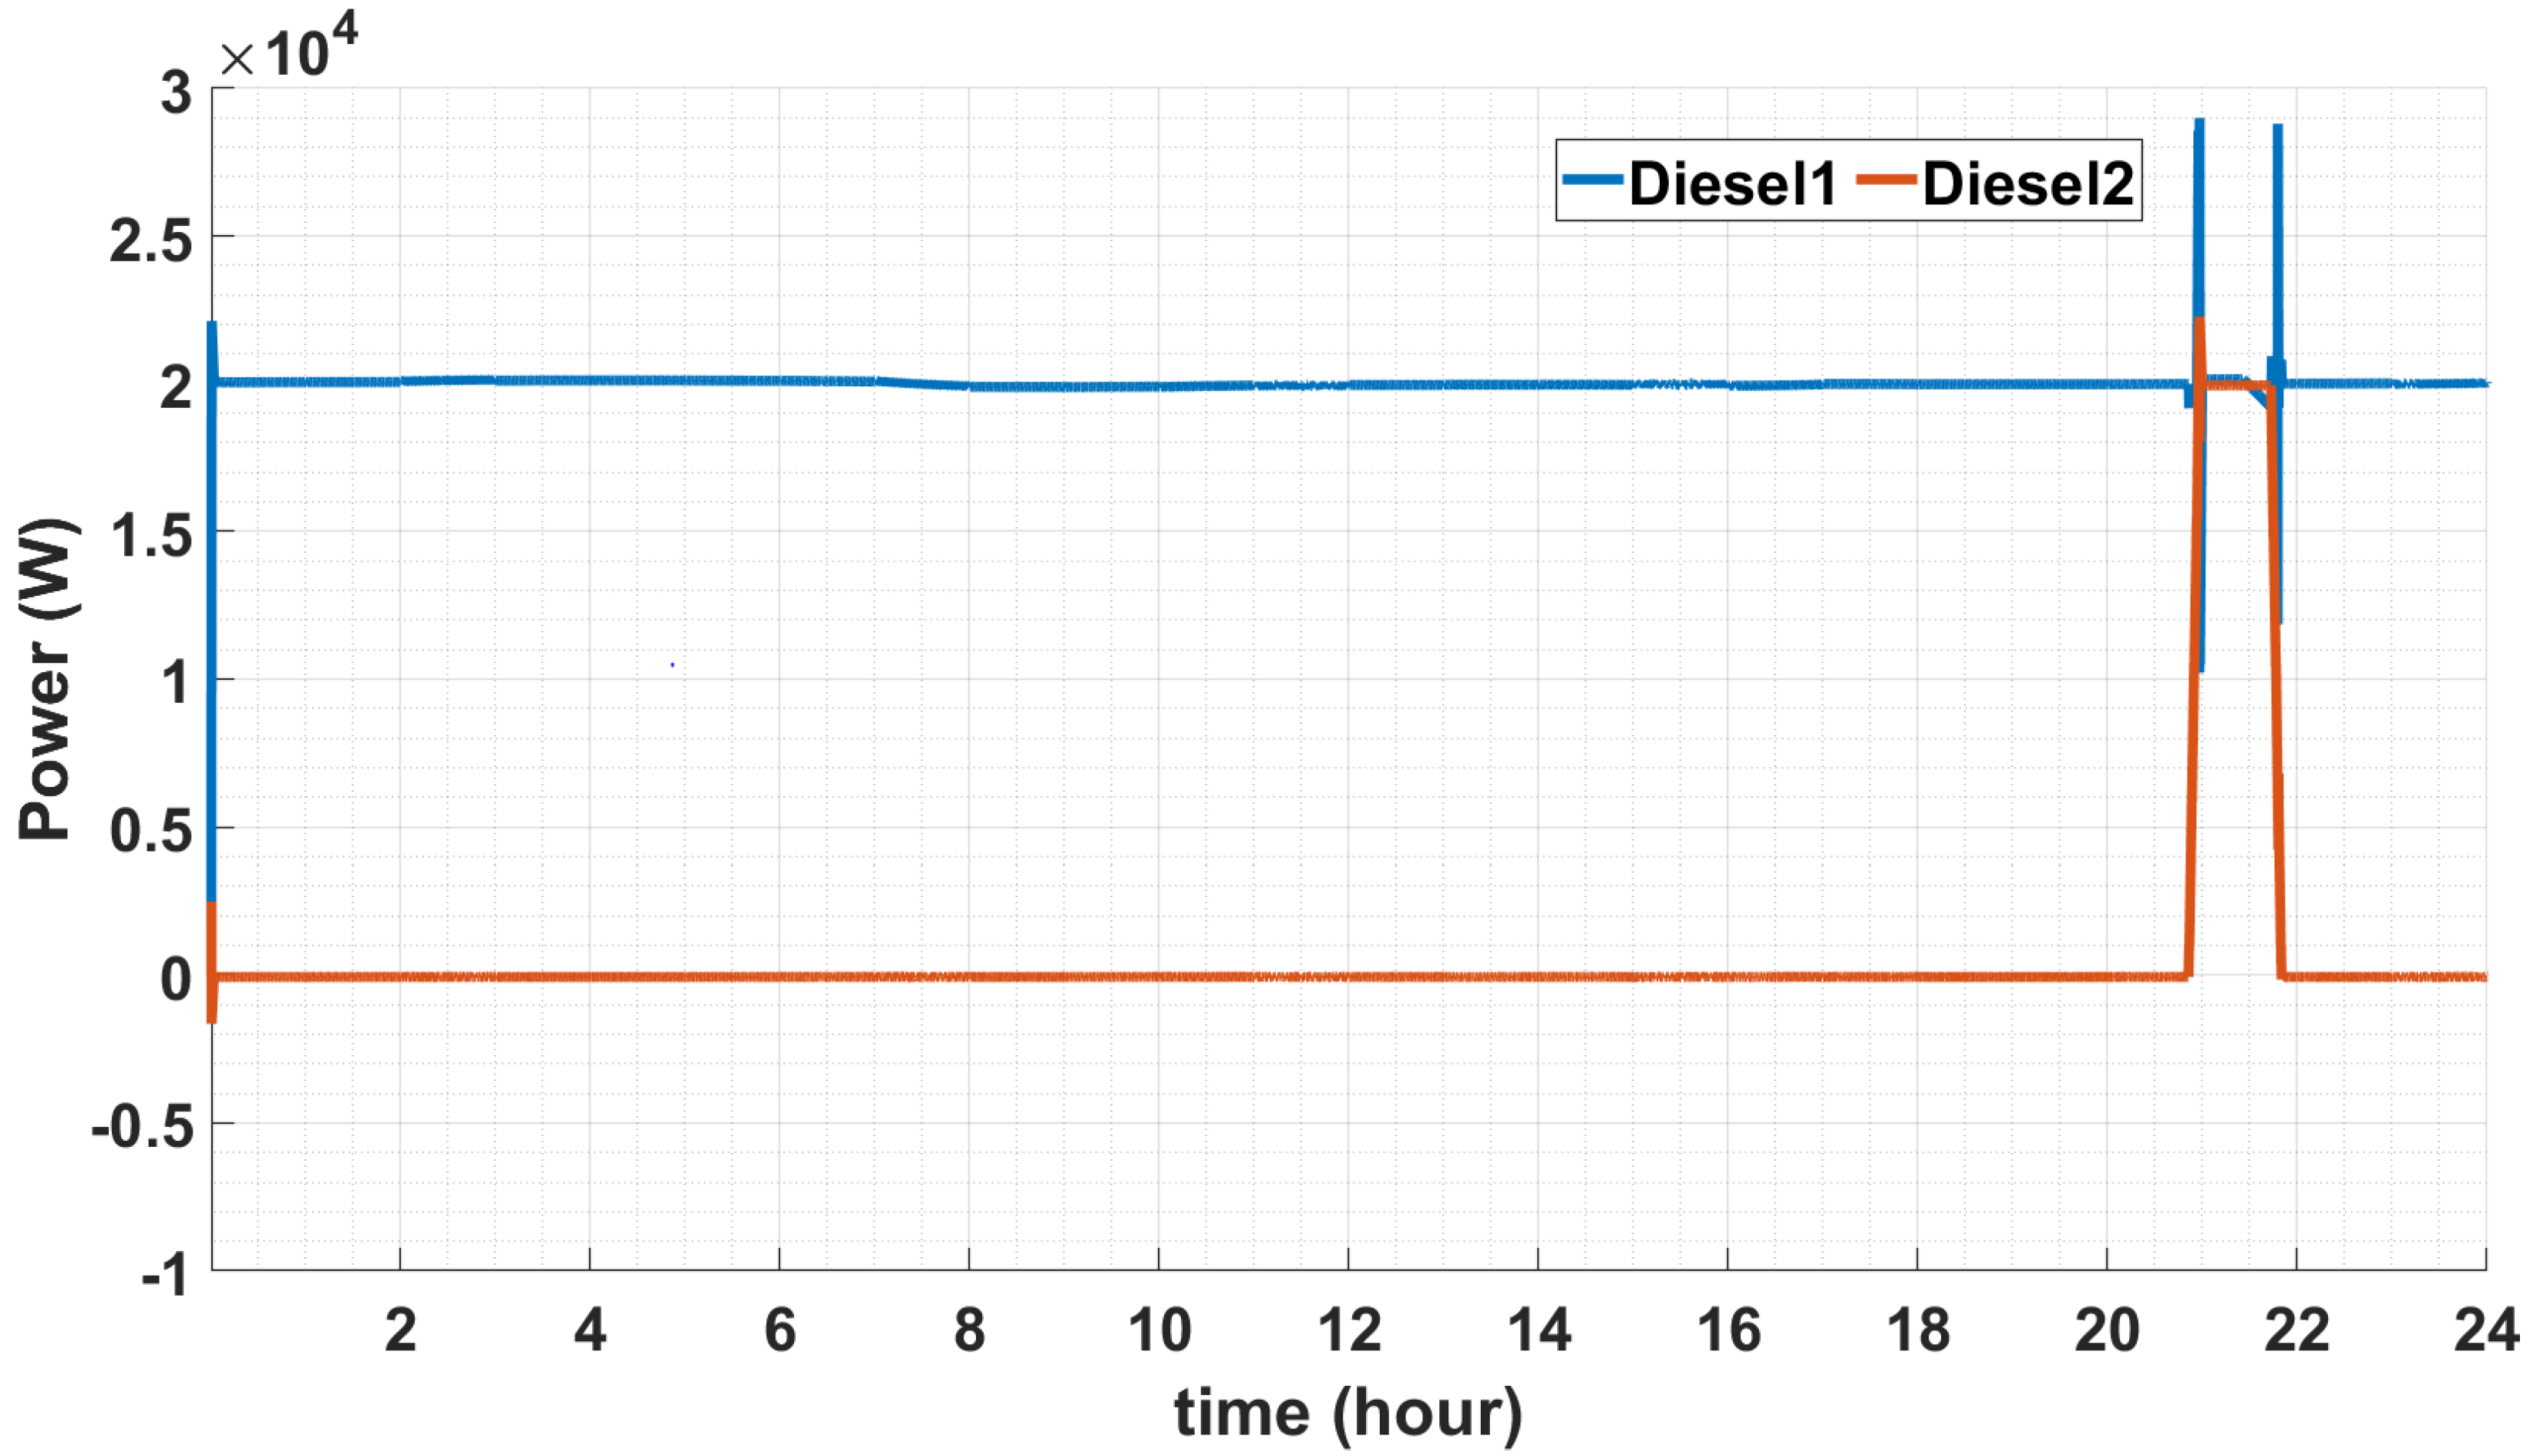
- DG1 always supplies rated power (20 kW) to the load as a main power source and stops only when the SOC of the ESS reaches its maximum value ().
- -
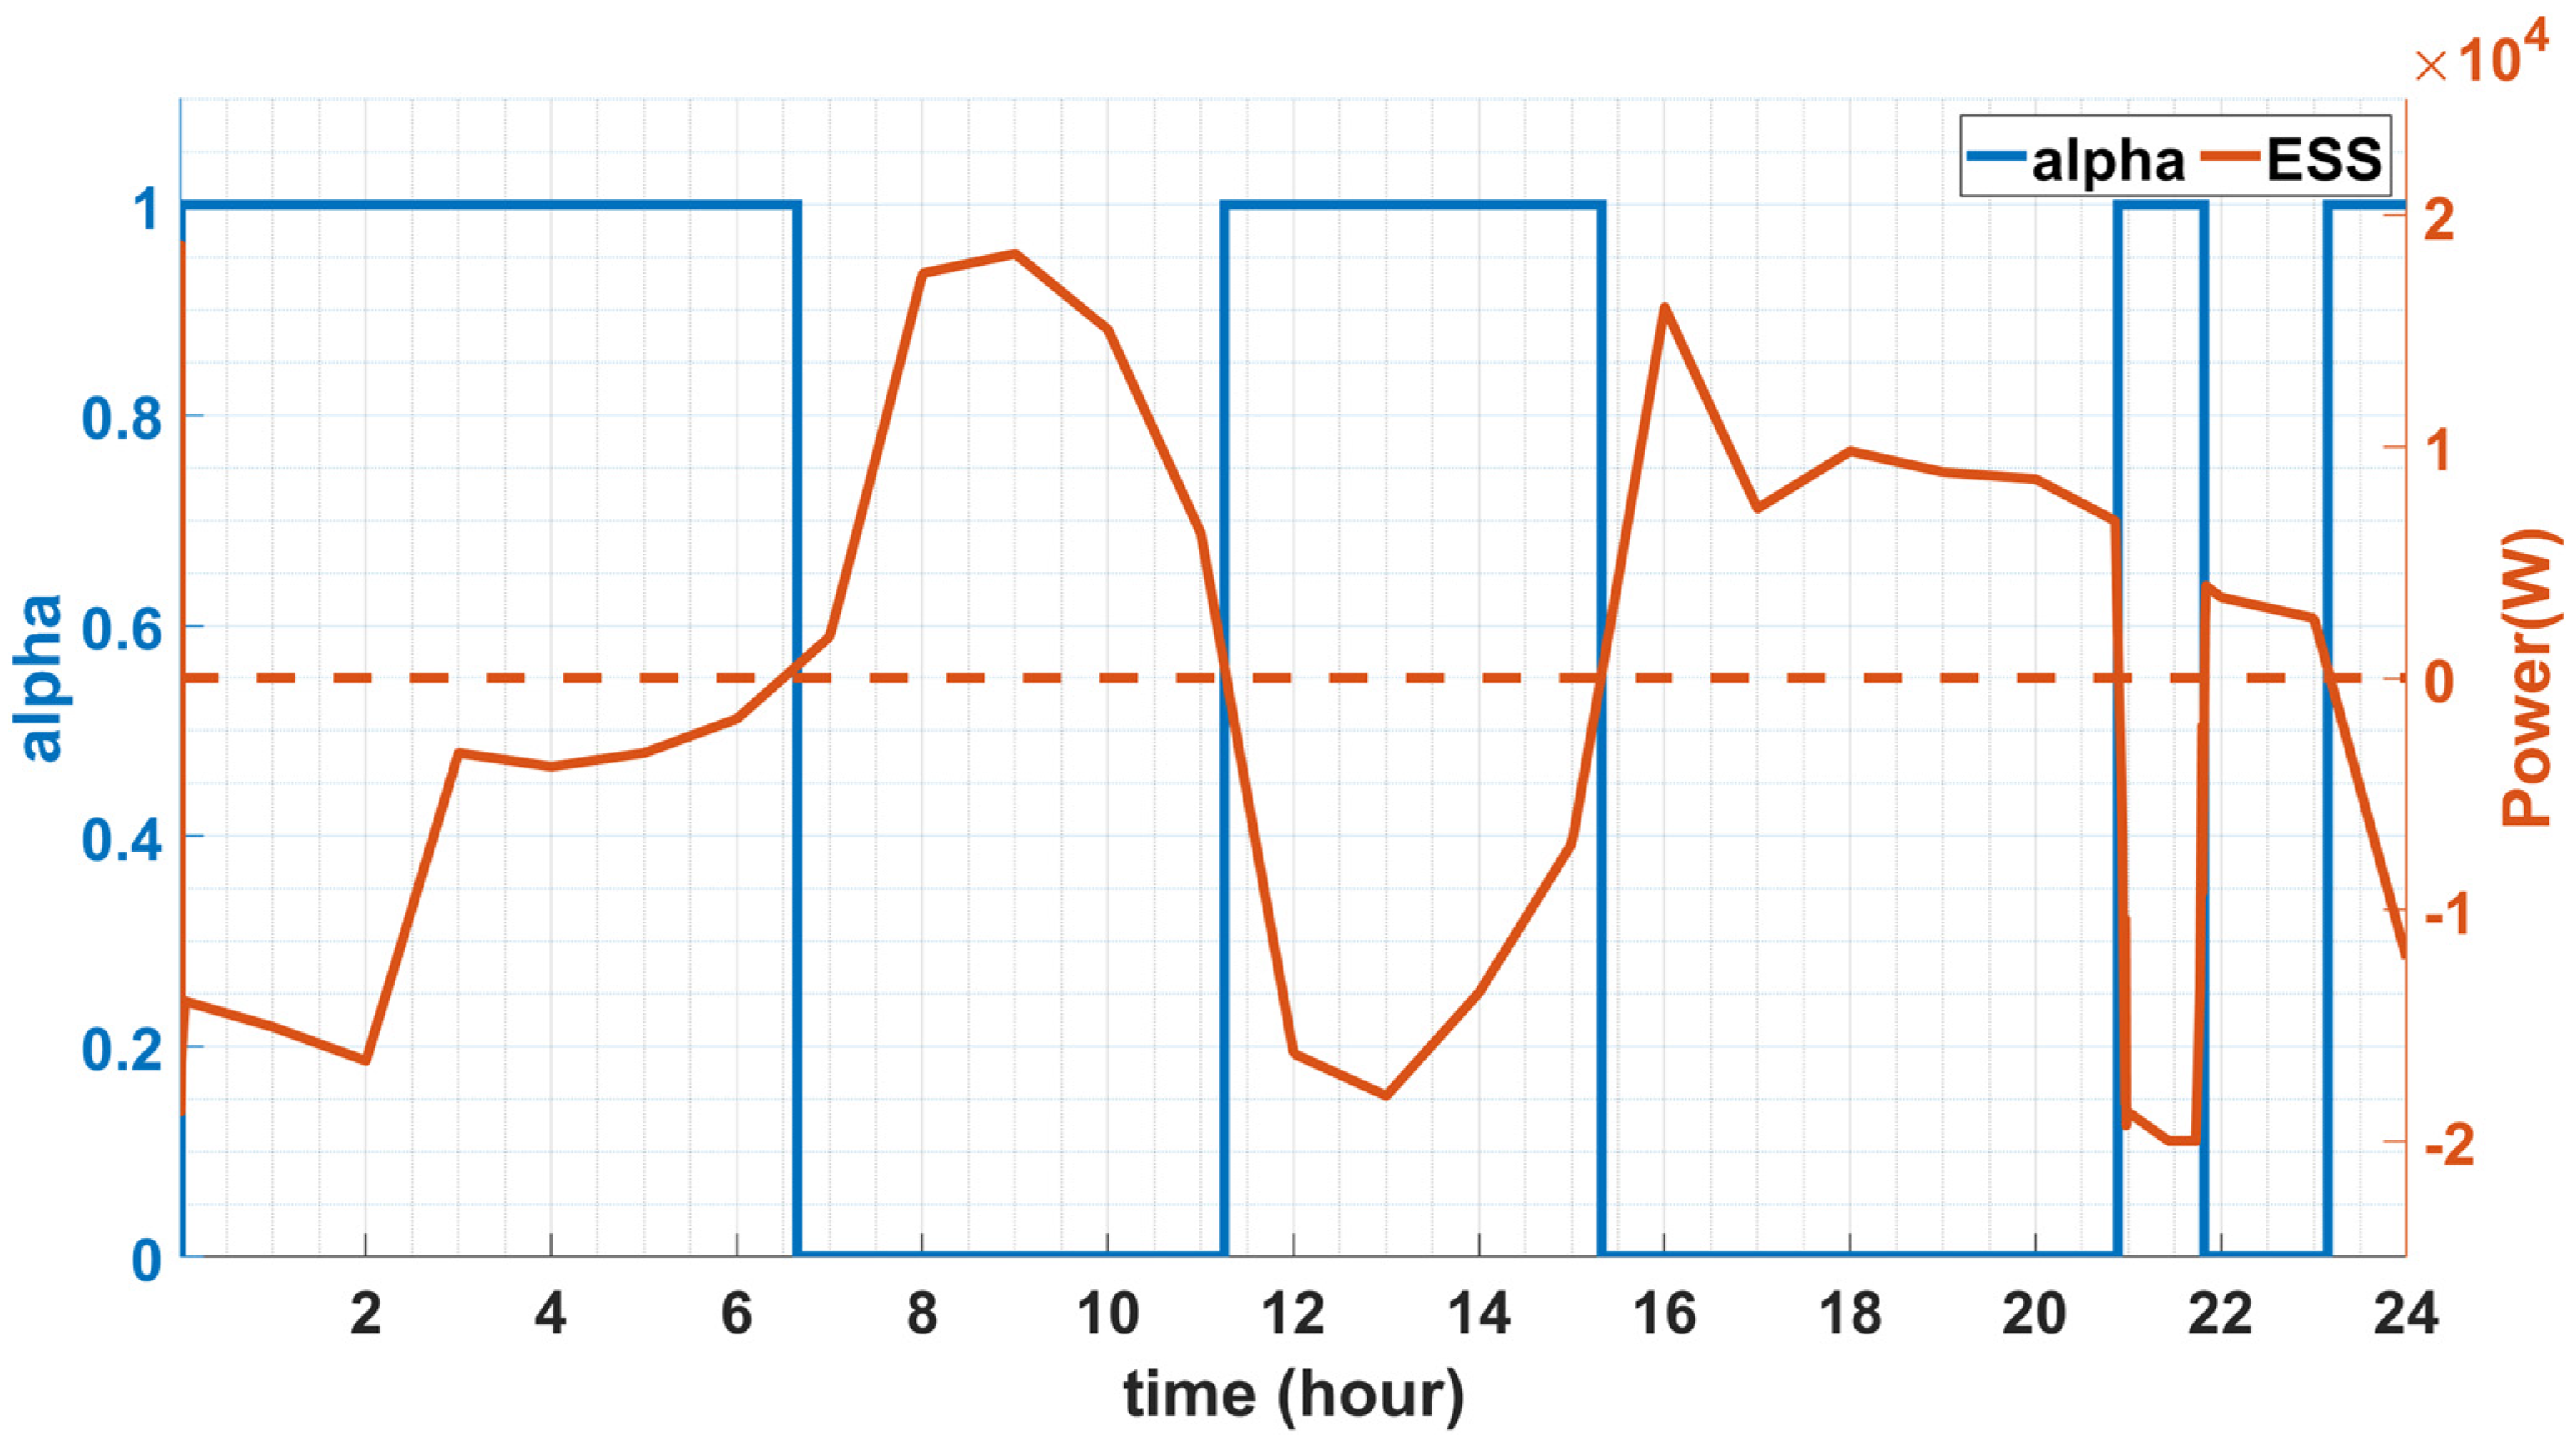
- The ESS operates according to the value. If the power consumption by the customer load and EV is less than the power generation by DG1 and PVs, is 1 and the ESS is charged. Conversely, when is 0, the ESS is discharged.
- -
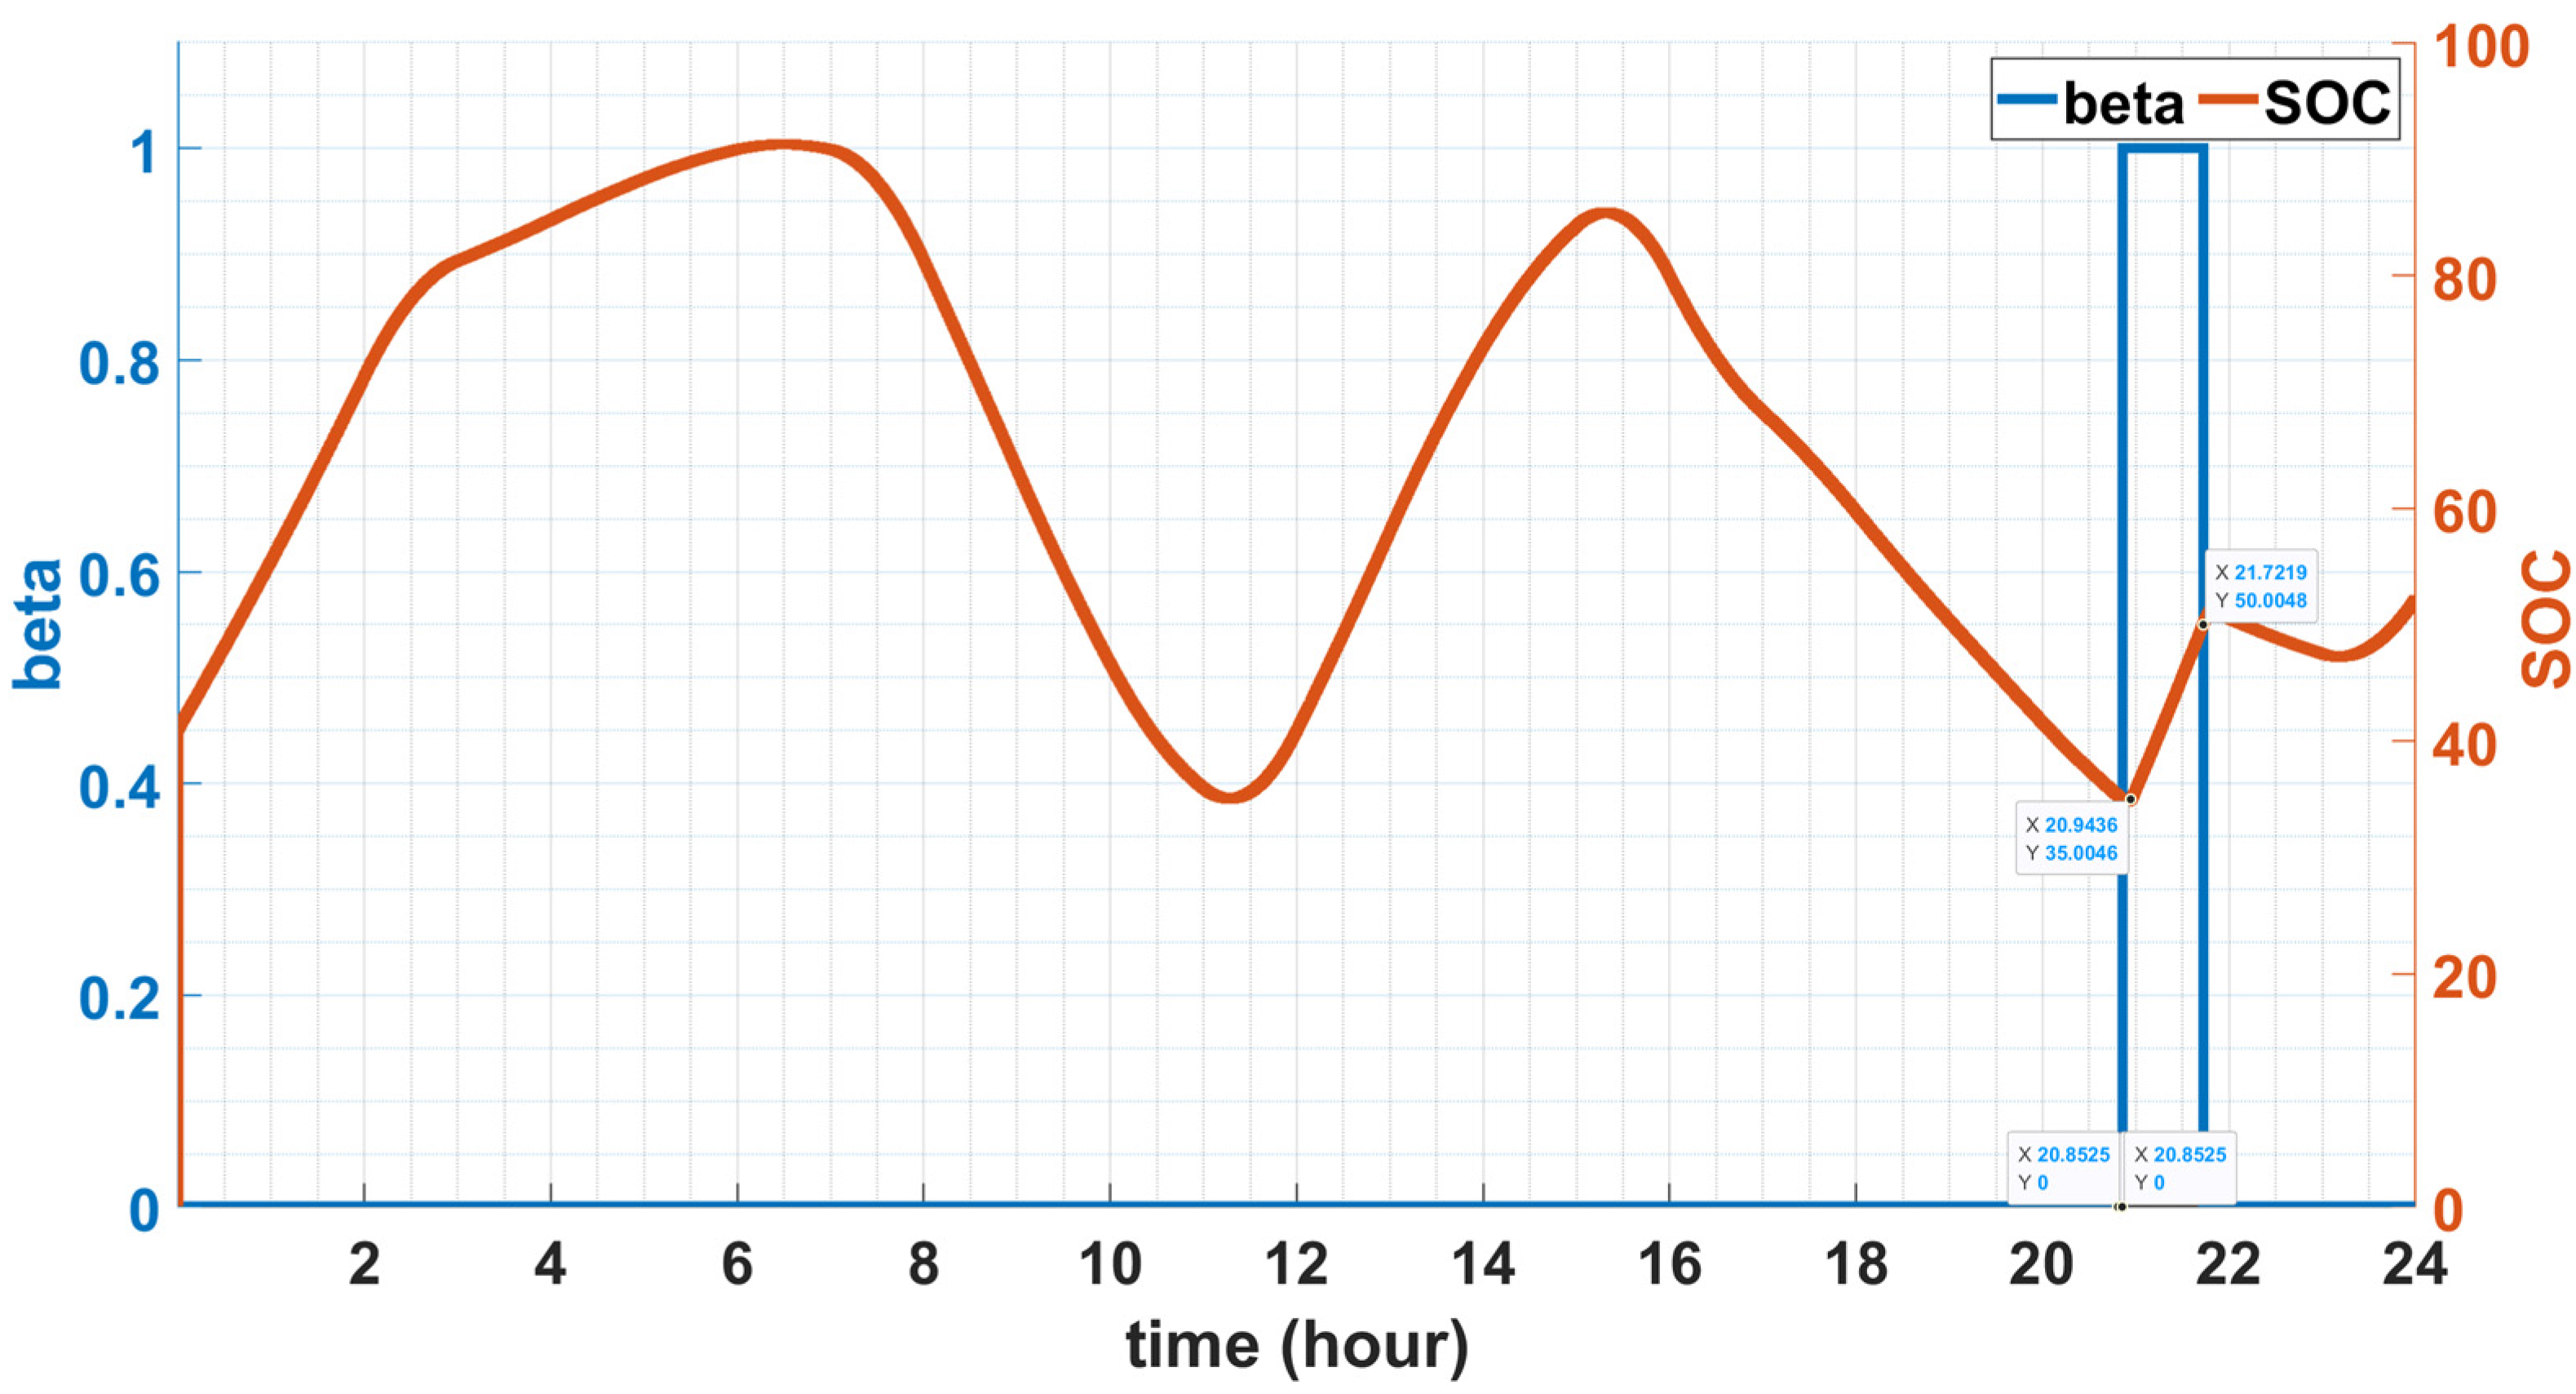
- When the SOC decreases to 35% in the ESS discharging mode, becomes 1, and DG2 operates. DG2 is a dispatchable generator, and when the SOC reaches 50% in the ESS charging mode, DG2 stops.
- -
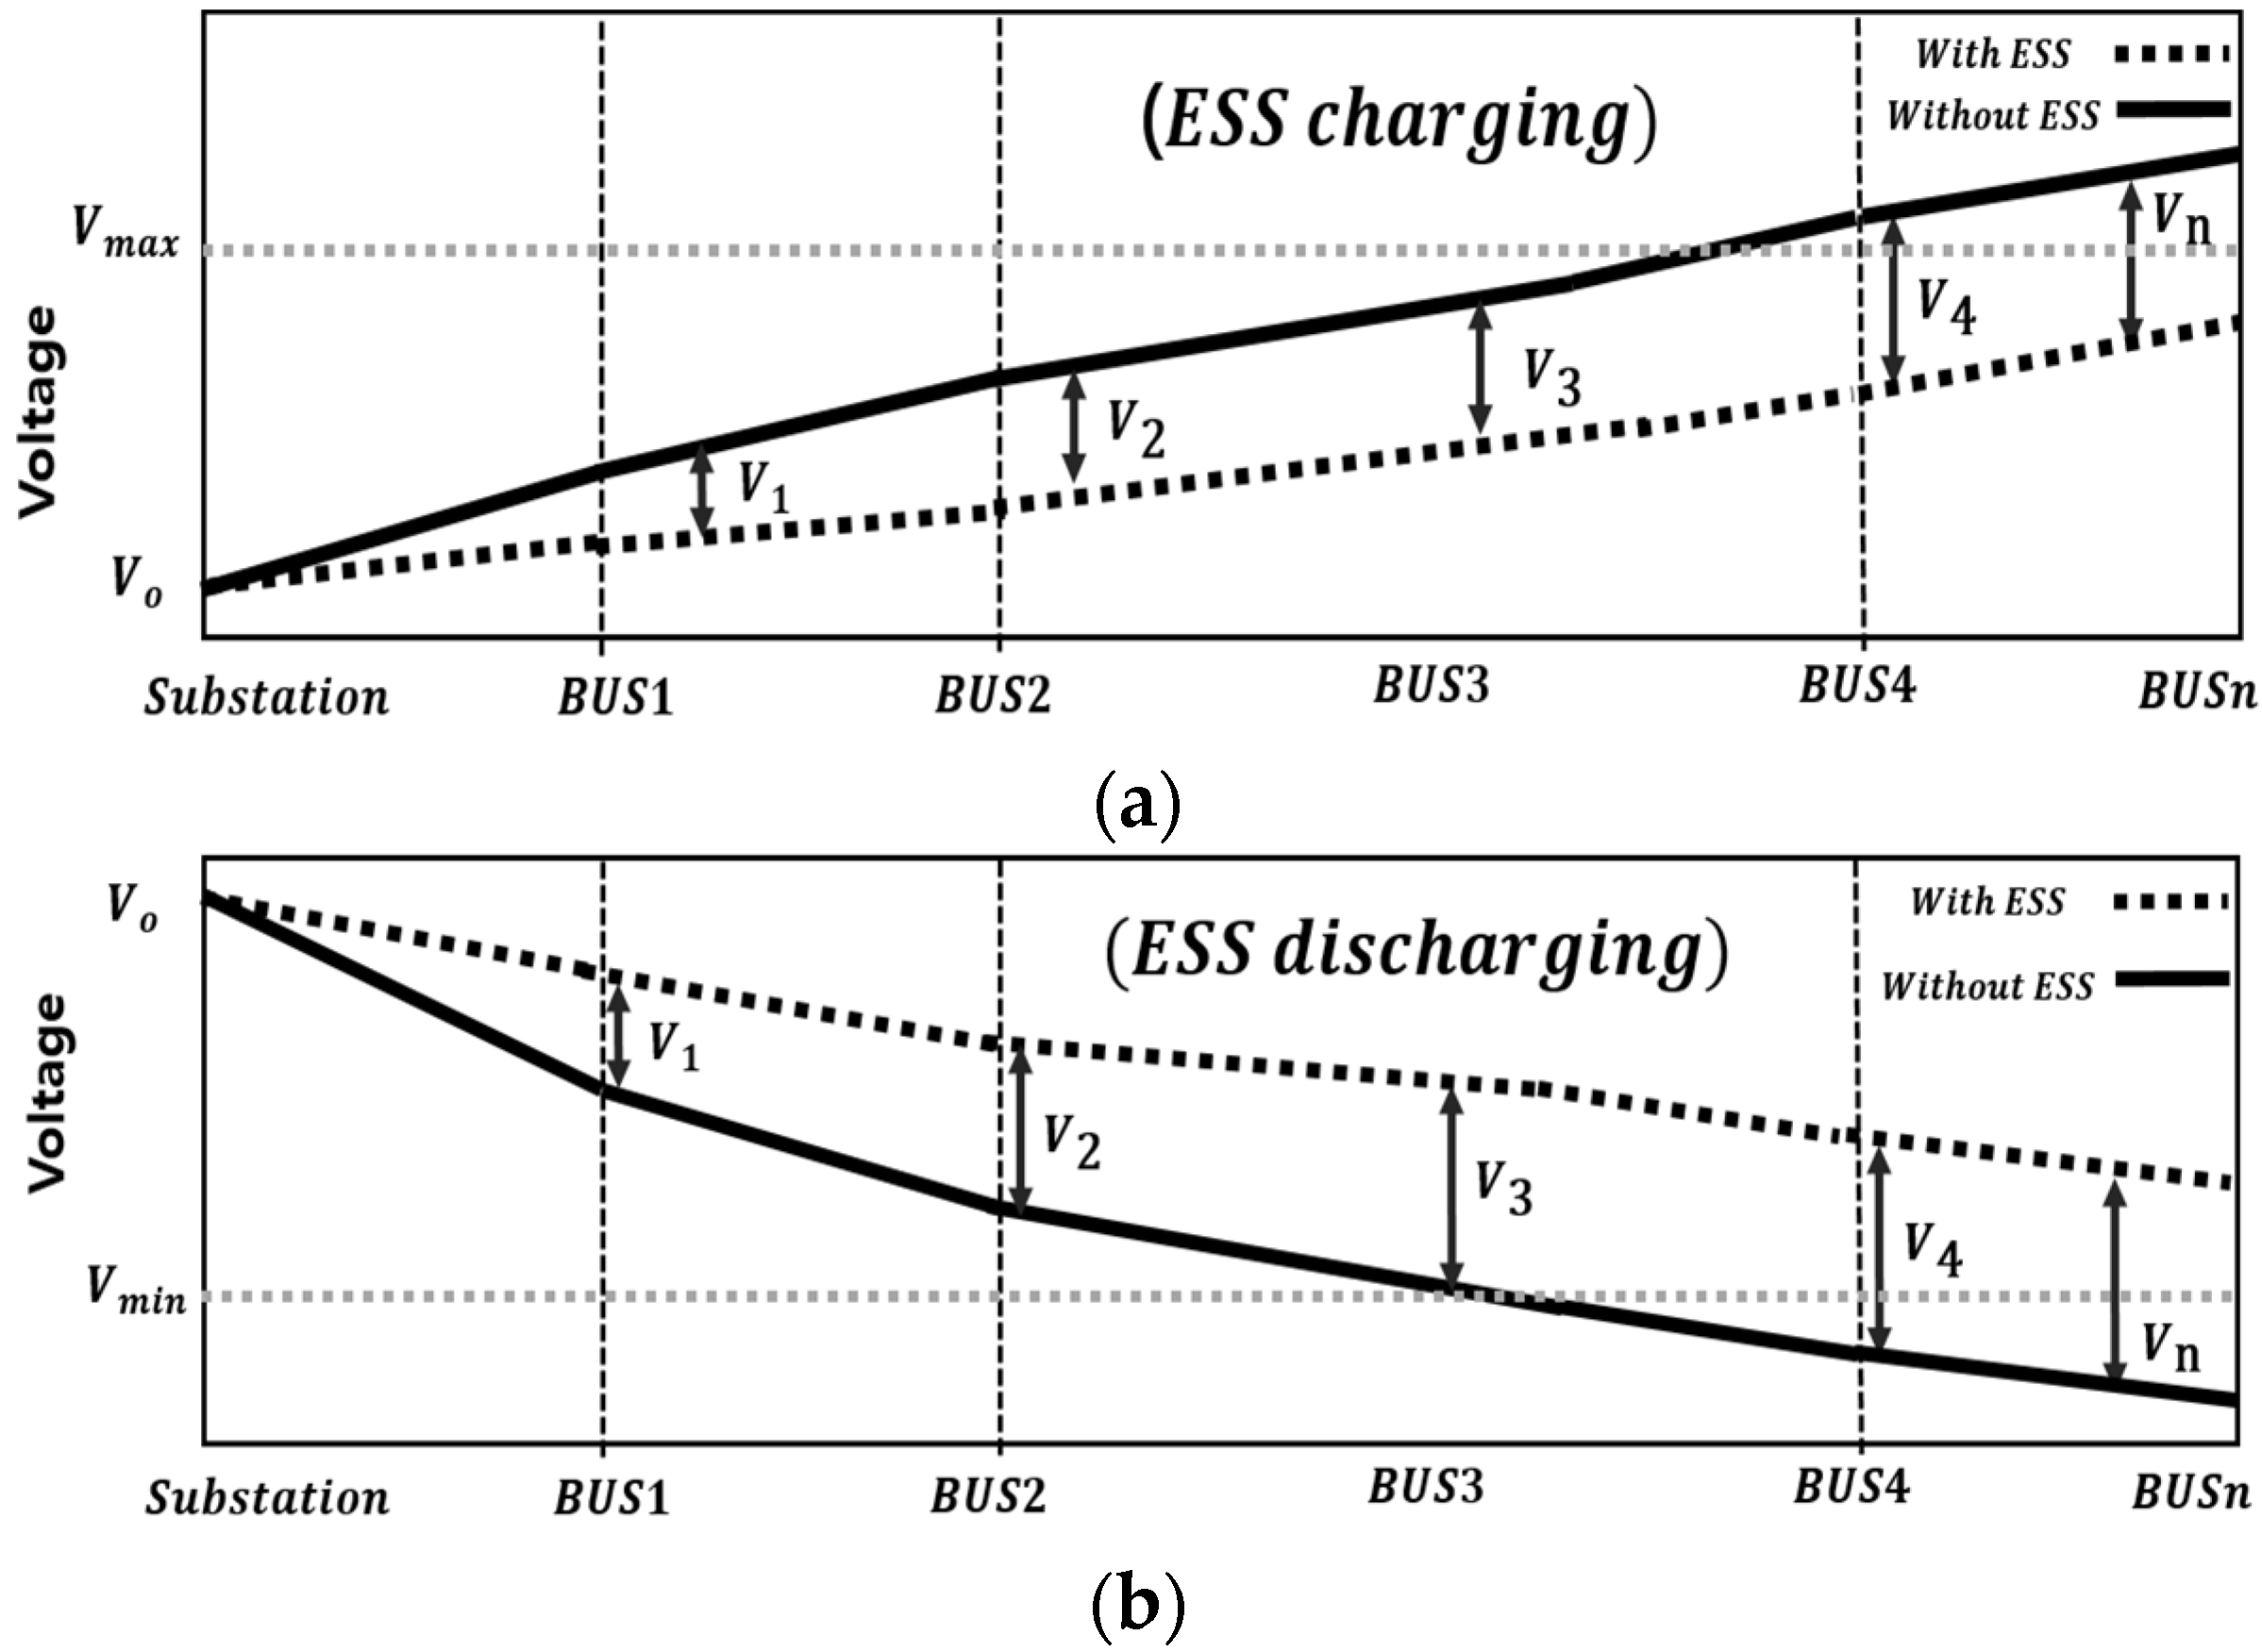
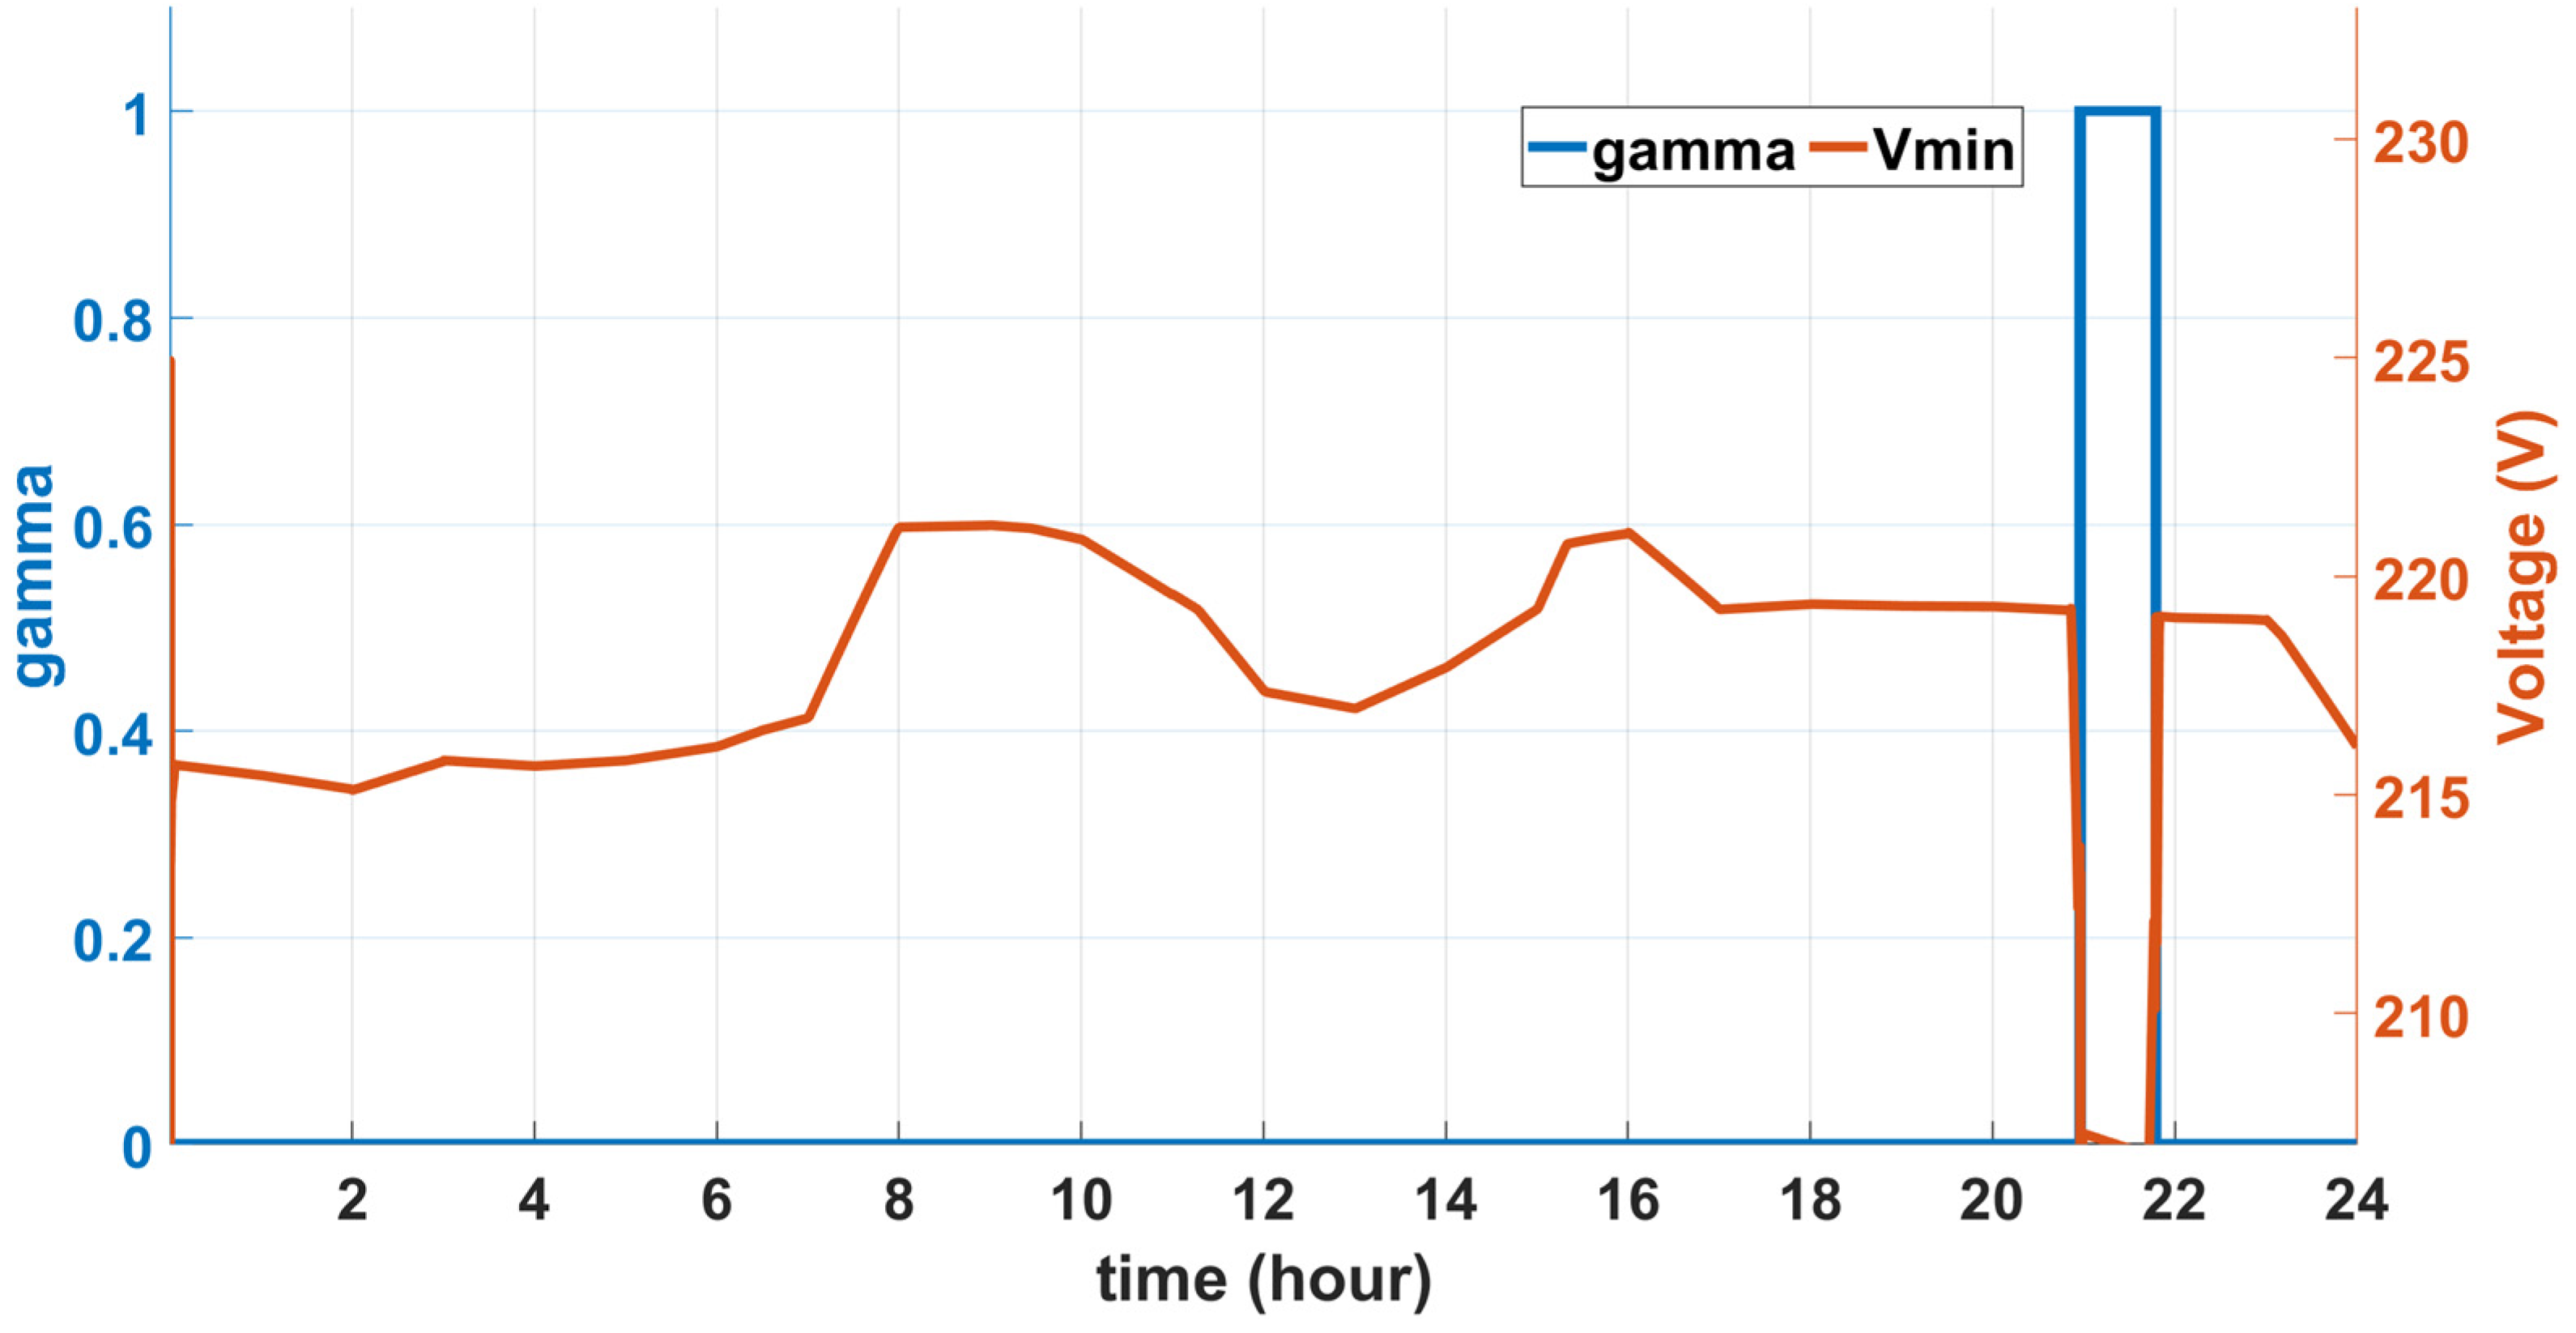
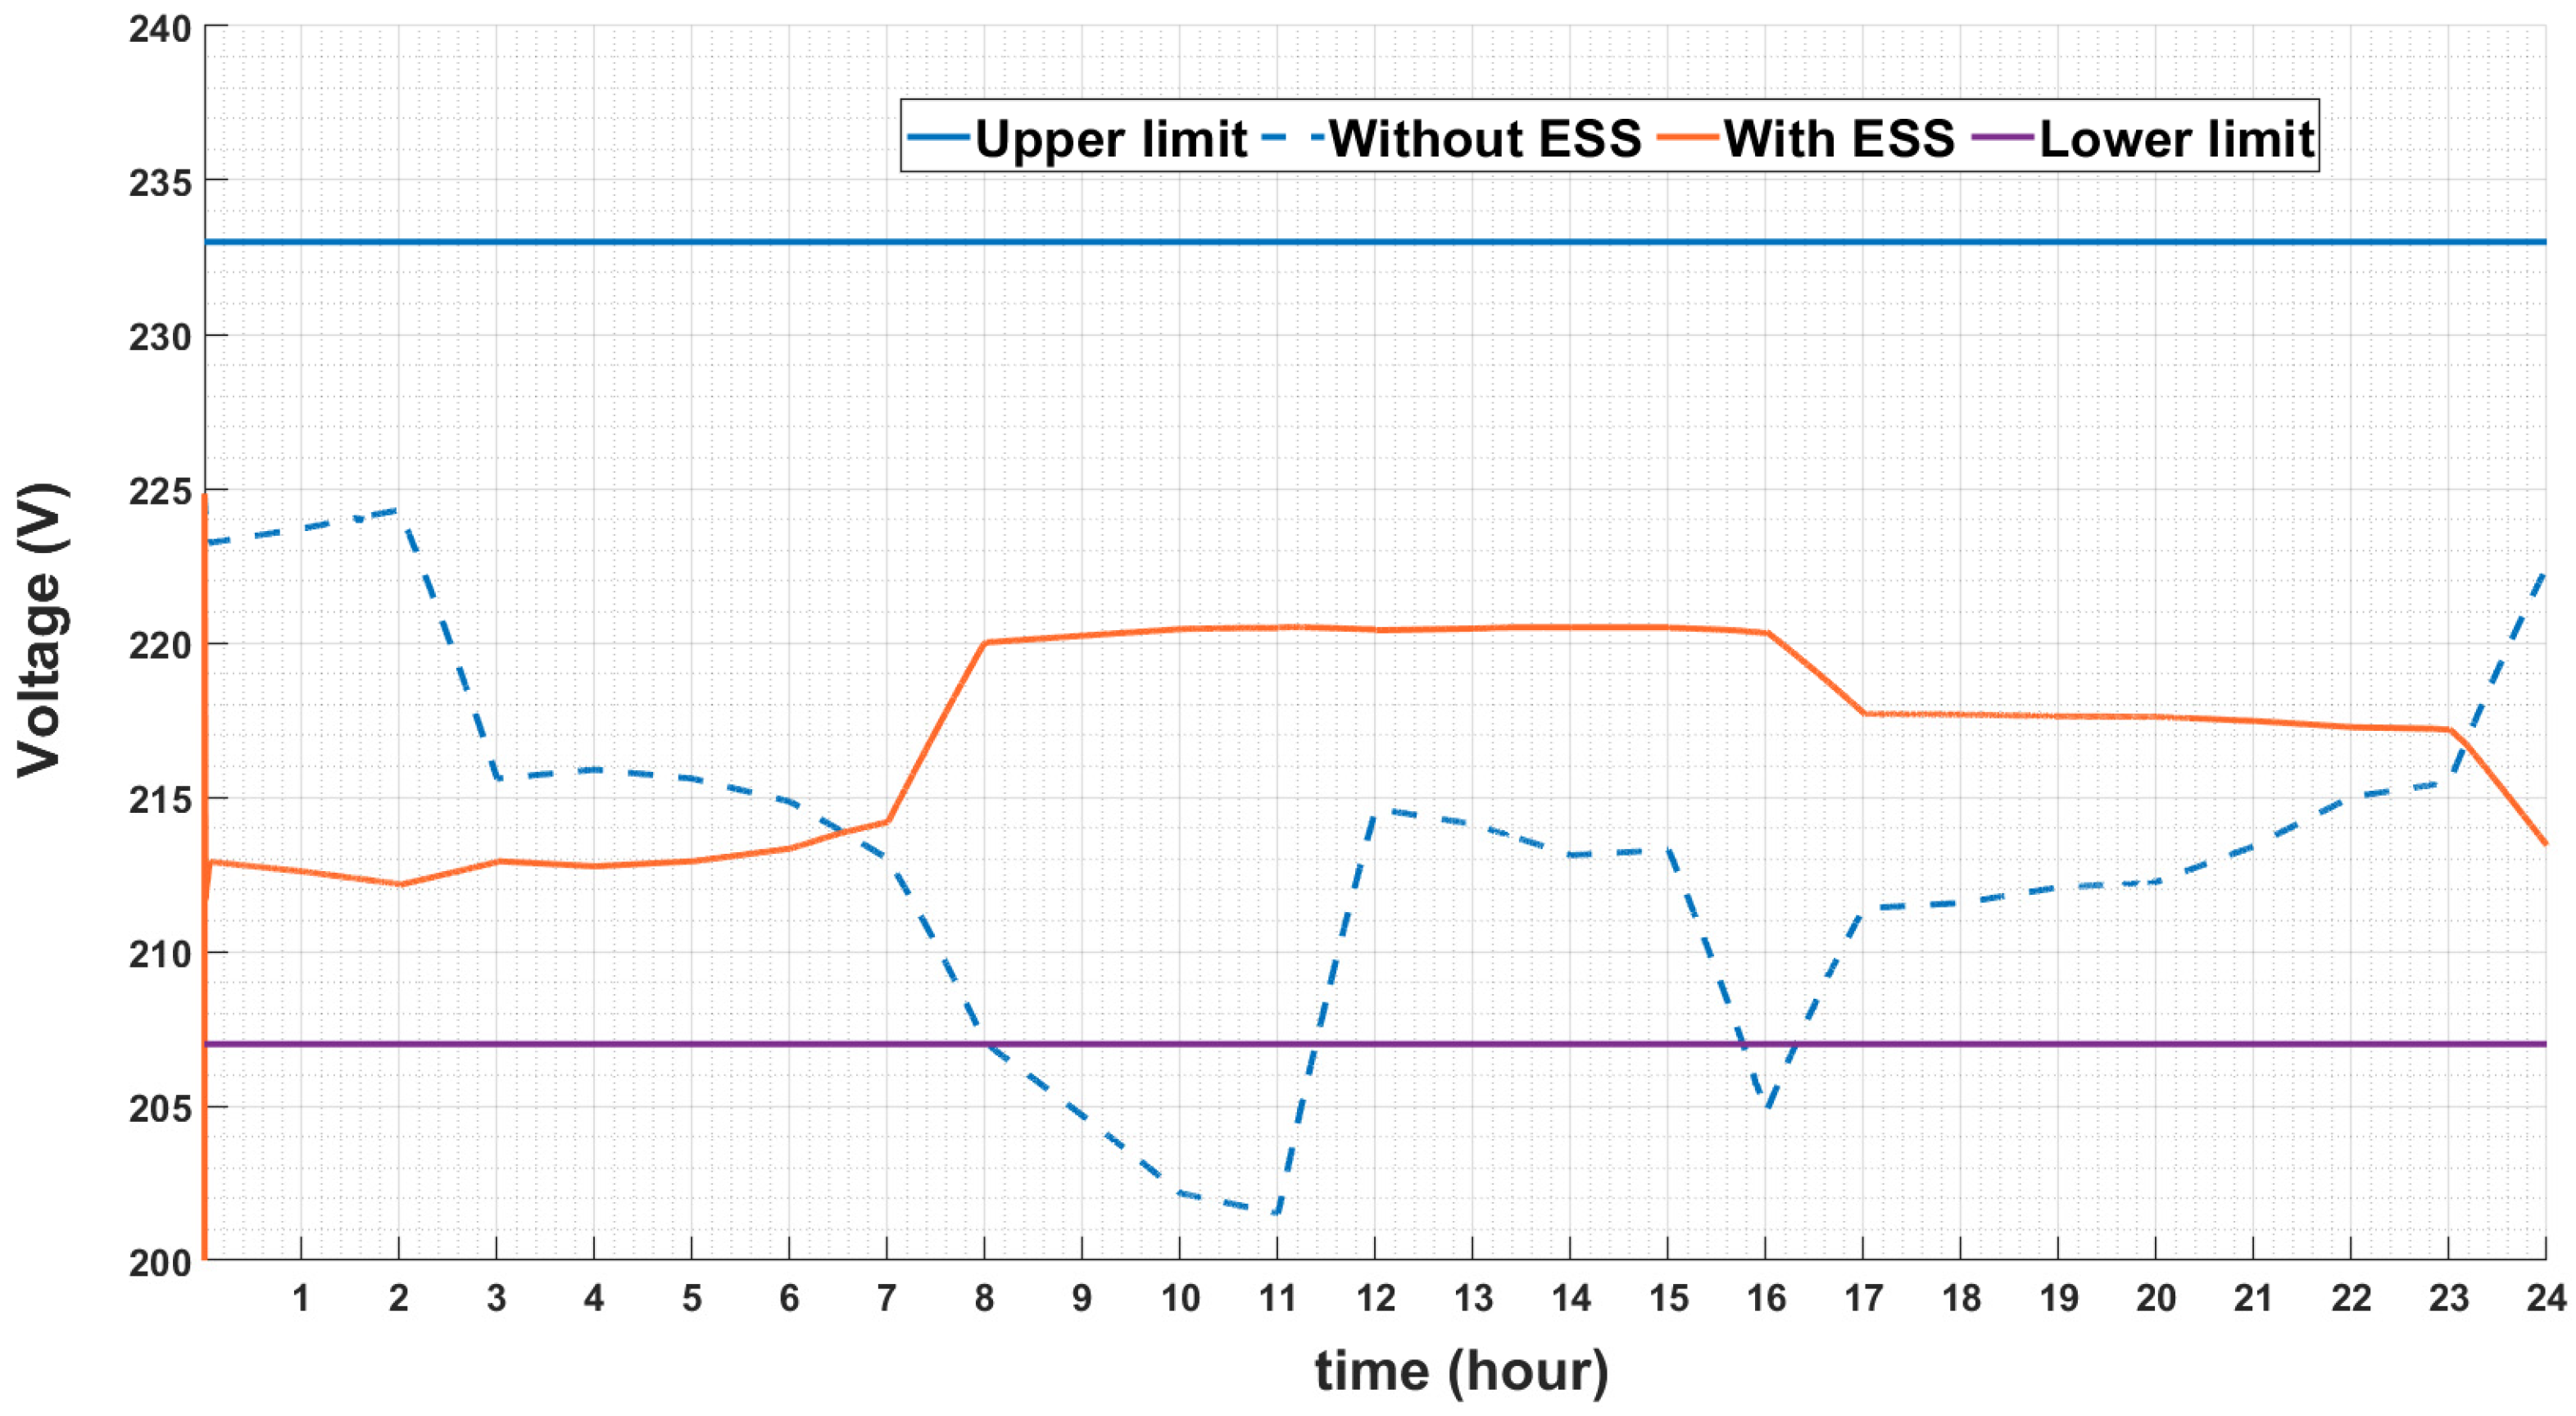
- EMS always monitors the bus voltage at each feeder, and when the minimum voltage is less than the set value (211 V), becomes 1 and the EV charging power is reduced to 50%. When the BUS voltage reaches 217 V while the EV is charging, the EV charging power becomes 100%. In order to satisfy the voltage condition in Equation (12), the reduction in EV charging to 50% for a short period of time (within 1 h) can be used to increase the voltage.
- (2)
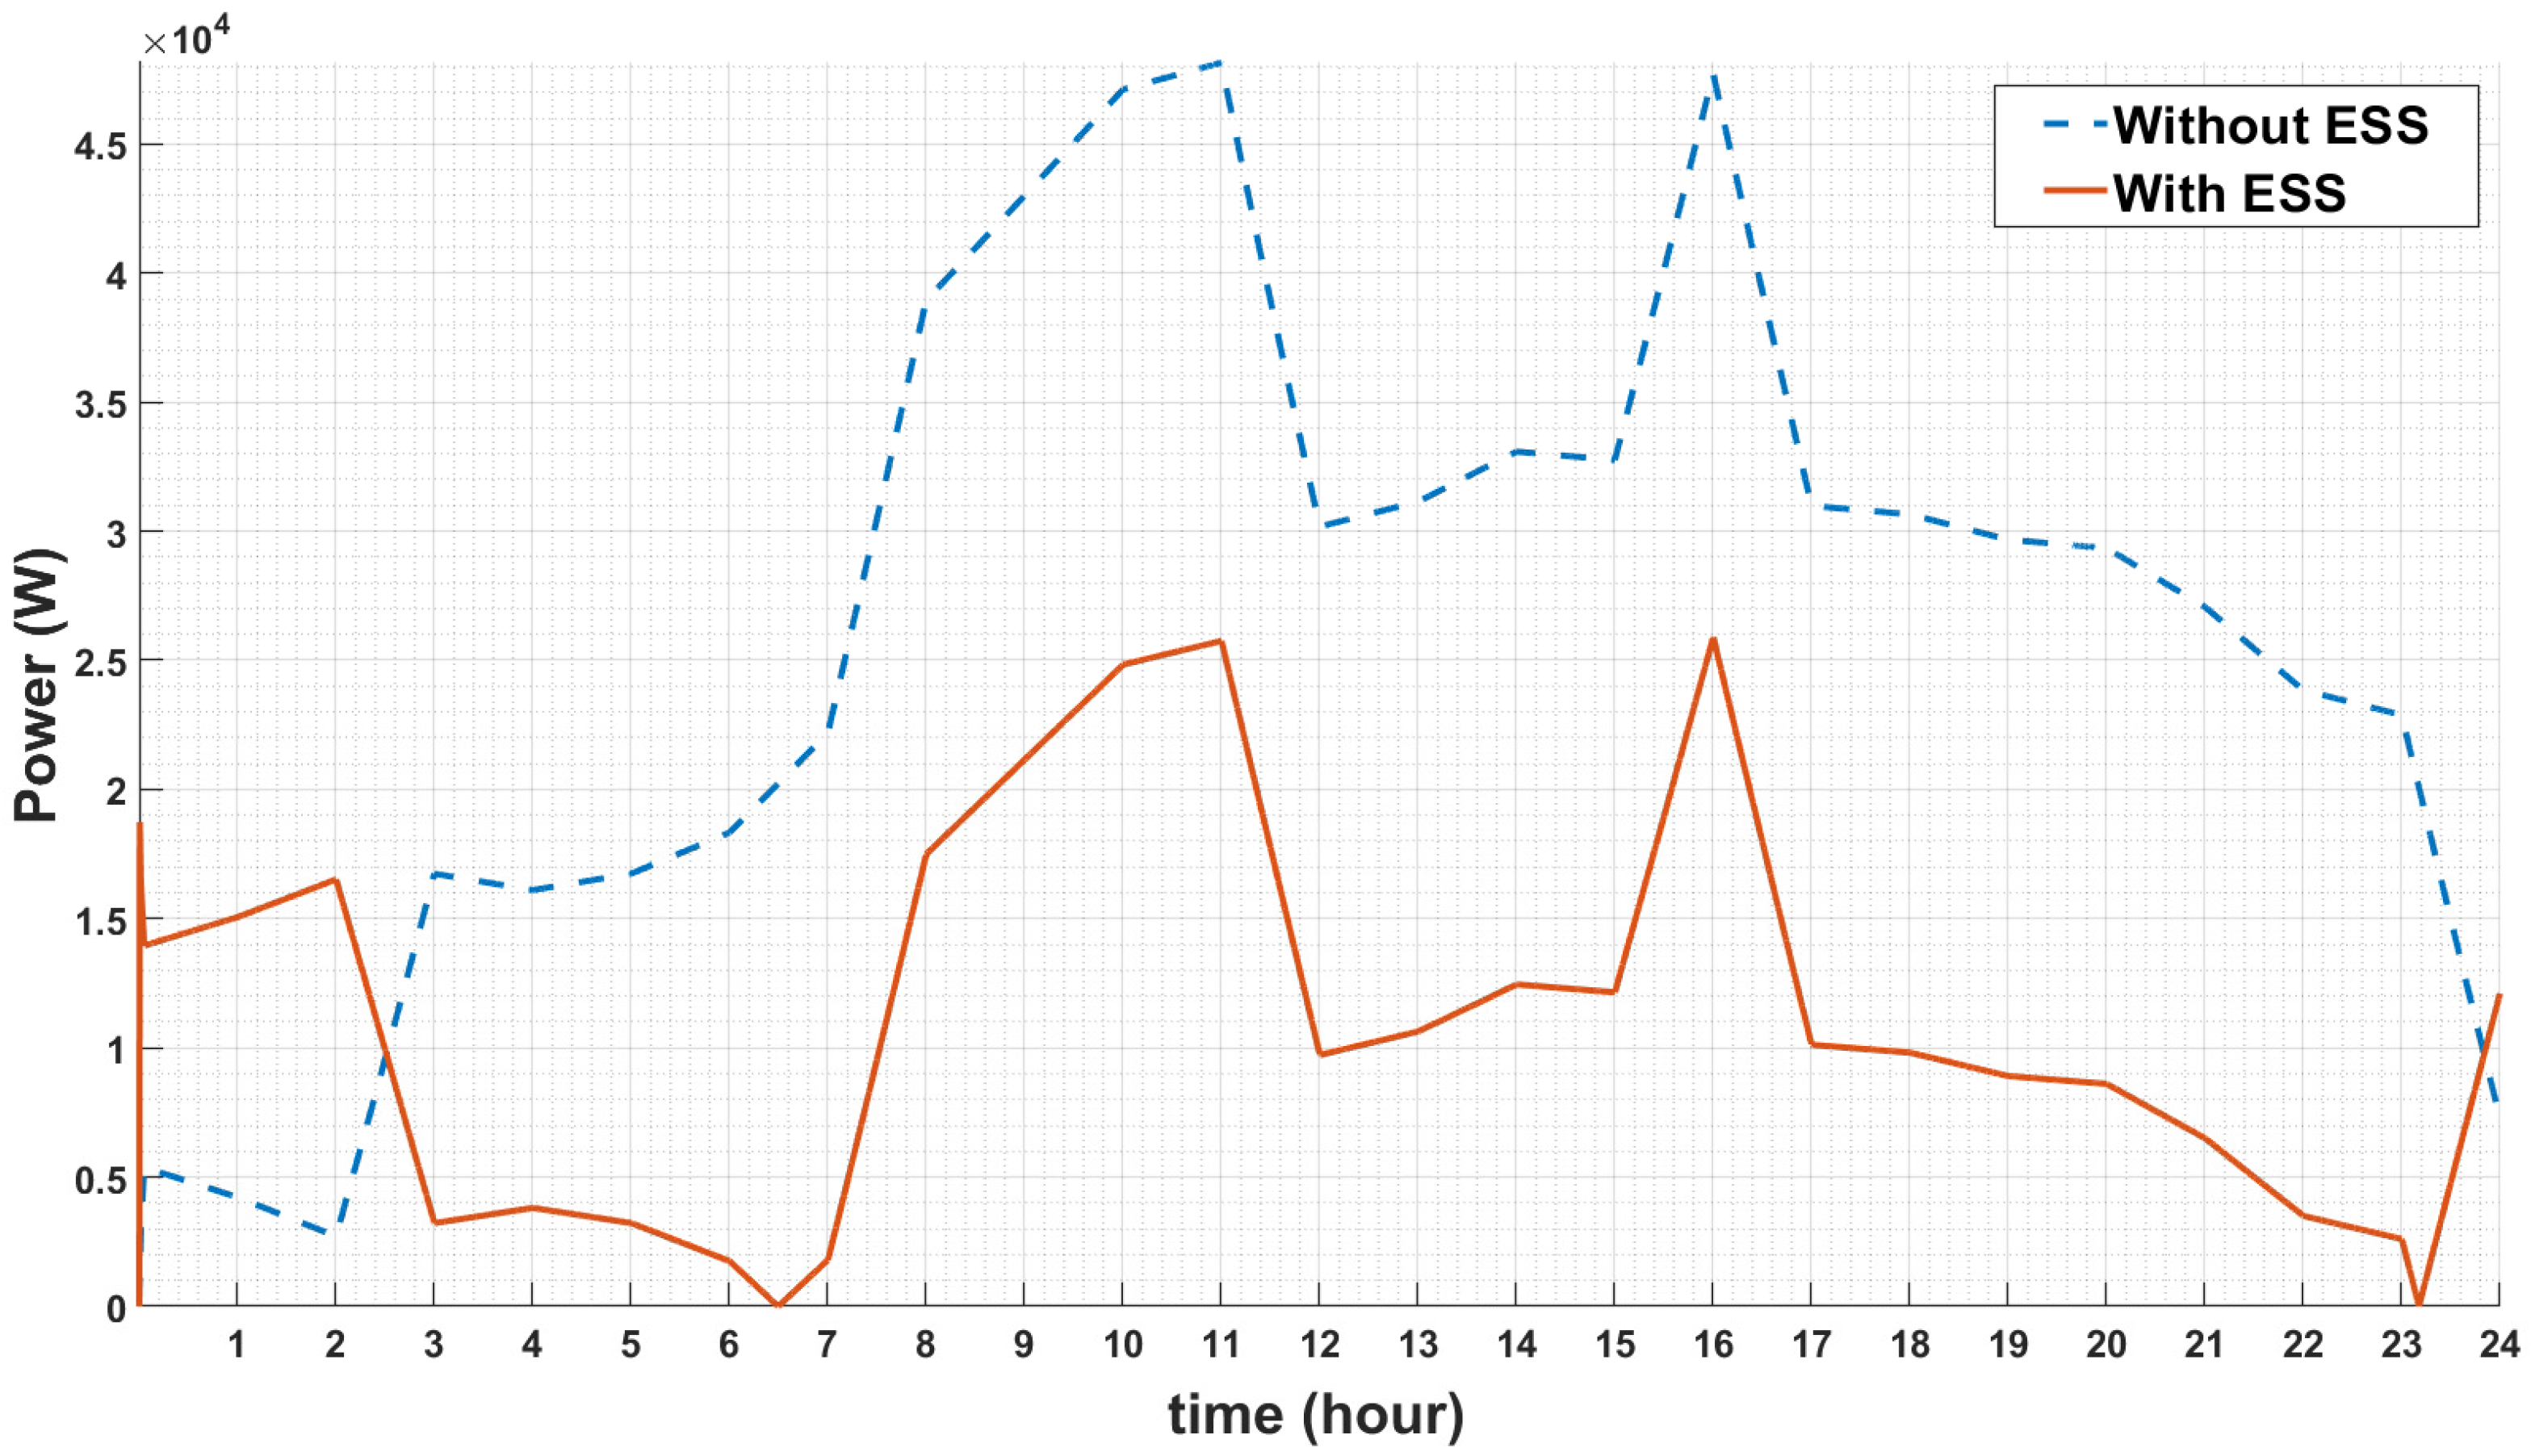
- Hosting capacity simulation
5. Conclusions
- (1)
- In a stand-alone MG, by installing an ESS at the end of the feeder and using the proposed ESS optimal operation algorithm, the capacity of PVs and EV connected to the bus could be extended up to twice the capacity of the main power source.
- (2)
- A simulation model for a stand-alone MG consisting of an ESS, a DG, PVs, an EV charger and load using Matlab/Simulink is presented. We verify that the voltage is maintained within the limits, even for the case when the load and EV capacity is larger than the one of the diesel generators.
- (3)
- In addition, it was confirmed that when the generation of DG and PVs is greater than the consumption of the load and EV charging, all the BUS voltages are kept within the allowable limit by the ESS.
Author Contributions
Funding
Conflicts of Interest
References
- Park, M.S.; Barrett, M.; Cassarino, T.G. Assessment of future renewable energy scenarios in South Korea based on costs, emissions and weather-driven hourly simulation. Renew. Energy 2019, 143, 1388–1396. [Google Scholar] [CrossRef]
- Ghasemi, A.; Enayatzare, M. Optimal energy management of a renewable-based isolated microgrid with pumped-storage unit and demand response. Renew. Energy 2018, 123, 460–474. [Google Scholar] [CrossRef]
- Belila, A.; Benbouzid, M.; Berkouk, E.M.; Amirat, Y. On energy management control of a PV-Diesel-ESS based microgrid in a stand-alone context. Eenergies 2018, 11, 2164. [Google Scholar] [CrossRef] [Green Version]
- Choi, D.H. Improvement of variable renewable energy penetration of stand-alone microgrid hosting capacity by using energy-storage-system based on power sensitivity. J. JAITC 2020, 10, 91–101. [Google Scholar] [CrossRef]
- Reza, H.; Hedayat, S. Emergence of hybrid energy storage systems in renewable energy and transport applications—A review. Renew. Sustain. Energy Rev. 2016, 65, 11–23. [Google Scholar]
- Ji, Z.; Huang, X.; Xu, C.; Sun, H. Accelerated model predictive control for electric vehicle integrated microgrid energy management: A hybrid robust and stochastic approach. Eenergies 2016, 9, 973. [Google Scholar] [CrossRef]
- Ryu, K.S.; Kim, D.J.; Nam, Y.H.; Ko, H.S.; Kim, B.K.; Kim, H.C. An innovative operation strategy of ESS for capacity expansion of renewable energy and customer load with electric vehicle chargers in low voltage distribution systems. Eenergies 2019, 12, 4668. [Google Scholar] [CrossRef] [Green Version]
- Bidram, A.; Davoudi, A. Hierarchical structure of microgrids control system. IEEE Trans. Smart Grid 2012, 3, 1963–1976. [Google Scholar] [CrossRef]
- Firestone, R.; Marnay, C. Energy Manager Design for Microgrids; Technical Report; Ernest Orlando Lawrence Berkeley National Laboratory: Berkeley, CA, USA, 2005. [Google Scholar]
- Alvarado-Barrios, L.; Rodriguez del Nozal, A.; Tapia, A.; Martinez-Ramos, J.L.; Reina, D. An evolutionary computational approach for the problem of unit commitment and economic dispatch in microgrids under several operation modes. Eenergies 2019, 12, 2143. [Google Scholar] [CrossRef] [Green Version]
- Bordons, C.; Garcia-Torres, F.; Ridao, M.A. Model Predictive Control of Microgrids; Springer: Berlin/Heidelberg, Germany, 2020. [Google Scholar]
- Clarke, W.C.; Manzie, M.; Brear, M.J. An economic MPC approach to microgrid control. In Proceedings of the 2016 Australian Control Conference, Newcastle, Australia, 3–4 November 2016; pp. 276–281. [Google Scholar]
- Kim, Y.S.; Kim, E.S.; Moon, S.I. Frequency and voltage control strategy of standalone microgrids with high penetration of intermittent renewable generation systems. IEEE Trans. Power Syst. 2016, 31, 718–728. [Google Scholar] [CrossRef]
- Simpson-Porco, J.W.; Shafiee, Q.; Dörfler, F.; Vasquez, J.C.; Guerrero, J.M.; Bullo, F. Secondary frequency and voltage control of islanded microgrids via distributed averaging. IEEE Trans. Ind. Electron. 2015, 62, 7025–7038. [Google Scholar] [CrossRef]
- Schiffer, J.; Seel, T.; Raisch, J.; Sezi, T. Voltage stability and reactive power sharing in inverter-based microgrids with consensus-based distributed voltage control. IEEE Trans. on Control. Syst. Technol. 2016, 24, 96–109. [Google Scholar] [CrossRef] [Green Version]
- Zifa, L.; Yixiao, C.; Ranqun, Z.; Hongjie, J. Energy storage capacity optimization for autonomy microgrid considering CHP and EV scheduling. Appl. Energy 2018, 210, 1113–1125. [Google Scholar]
- Bhatti, A.R.; Salam, Z.; Ashique, R.H. Electric vehicle charging using photovoltaic based microgrid for remote islands. Energy Procedia 2016, 103, 213–218. [Google Scholar] [CrossRef]
- Falvo, M.C.; Grasselli, U.; Manganelli, M.; Modesto, A. Small scale ESS for LV prosumers: An economic feasibility and sensitivity analysis. In Proceedings of the 2015 IEEE EEEIC, Rome, Italy, 10–13 June 2015; pp. 950–955. [Google Scholar]
- Elham, S.; Shahram, J. Cost reduction and peak shaving through domestic load shifting and DERs. Energy 2017, 124, 146–159. [Google Scholar]
- Rho, D.S.; Kook, K.S.; Wang, Y.P. Optimal algorithms for voltage management in distribution systems interconnected with new dispersed sources. JEET 2011, 6, 192–201. [Google Scholar] [CrossRef] [Green Version]
- Kim, B.K.; Nam, Y.H.; Ko, H.S.; Park, C.H.; Kim, H.C.; Ryu, K.S.; Kim, D.J. Novel voltage control method of the primary feeder by the energy storage system and step voltage regulator. Energies 2019, 12, 3357. [Google Scholar] [CrossRef] [Green Version]
- Ela, E.; Milligan, M.; Kirby, B. Operating Reserves and Variable Generation; Technical Report; National Renewable Energy Laboratory: Berkeley, CA, USA, 2011. [Google Scholar]
- Nair, U.R.; Costa-Castello, R. A model predictive control-based energy management scheme for hybrid storage system in islanded microgrids. EIEEE Access 2020, 8, 97809–97822. [Google Scholar] [CrossRef]
- Moeini, A.; Kamwa, I.; Brunelle, P.; Sybille, G. Synchronous machine stability model, an update to IEEE Std 1110-2002 data translation technique. In Proceedings of the 2018 IEEE Power and Energy Society General Meeting, Portland, OR, USA, 5–10 August 2018; pp. 950–955. [Google Scholar]
- IEEE. IEEE®®® Standard 421.5-1992: Recommended Practice for Excitation System Models for Power System Stability Studies; IEEE, 1992; Available online: https://ieeexplore.ieee.org/document/7553421 (accessed on 10 May 2021).
- LeSage, J. Microgrid Energy Management System (EMS) Using Optimization; 2021; Available online: https://github.com/jonlesage/Microgrid-EMS-Optimization (accessed on 10 May 2021).
- Kim, C.H. Analysis of Electricity Load Pattern by Daily and Time Zone; Korea Energy Economics Institute: Ulsan, Korea, 2013. [Google Scholar]


| Signal | Definition | Condition | =1 | =0 |
|---|---|---|---|---|
| α | ESS Mode | Gen. P > Con. P | Charge | Discharge |
| β | DG2 On/Off | SOC < Set value | On | Off |
| γ | EV charger control | < Set value | 50% | 100% |
| Category | Parameters |
|---|---|
| DG1 | 20 kVA, 230 V |
| DG2 | 20 kVA, 230 V |
| ESS | 30 kW/100 kWh |
| Line Impedance 1 | Z = 0.73 + j0.085 /km |
| Line Impedance 2 | Z = 0.549 + j0.072 /km |
| Load | 18 kW |
| EV charger | 42 kW |
| PVs | 30 kW |
| PF | 1 |
| 1 |
Publisher’s Note: MDPI stays neutral with regard to jurisdictional claims in published maps and institutional affiliations. |
© 2021 by the authors. Licensee MDPI, Basel, Switzerland. This article is an open access article distributed under the terms and conditions of the Creative Commons Attribution (CC BY) license (https://creativecommons.org/licenses/by/4.0/).
Share and Cite
Ryu, K.-S.; Kim, D.-J.; Ko, H.; Boo, C.-J.; Kim, J.; Jin, Y.-G.; Kim, H.-C. MPC Based Energy Management System for Hosting Capacity of PVs and Customer Load with EV in Stand-Alone Microgrids. Energies 2021, 14, 4041. https://doi.org/10.3390/en14134041
Ryu K-S, Kim D-J, Ko H, Boo C-J, Kim J, Jin Y-G, Kim H-C. MPC Based Energy Management System for Hosting Capacity of PVs and Customer Load with EV in Stand-Alone Microgrids. Energies. 2021; 14(13):4041. https://doi.org/10.3390/en14134041
Chicago/Turabian StyleRyu, Kyung-Sang, Dae-Jin Kim, Heesang Ko, Chang-Jin Boo, Jongrae Kim, Young-Gyu Jin, and Ho-Chan Kim. 2021. "MPC Based Energy Management System for Hosting Capacity of PVs and Customer Load with EV in Stand-Alone Microgrids" Energies 14, no. 13: 4041. https://doi.org/10.3390/en14134041