1. Introduction
Nearly 100 years ago, in 1922, the Swedish engineer Frederick Ljungström invented the first rotary heat exchanger (RHX) made of steel for power plants [
1]. This is a type of heat exchanger whose compact design works efficiently, and it was patented in 1930 [
2]. Since then, researchers have continued to improve its design and operation based on expertise in thermodynamics, fluid dynamics, and structure engineering [
1]. RHX became one of the most efficient types of heat exchangers for gas–gas streams and were later produced in aluminum in new applications for ventilation or paint shops [
3,
4,
5]. According to Warren, “The story of this development work is a good example of how a basically simple idea can be developed and refined by coordinated efforts in countries around the world into the carefully engineered product that it is today” [
1]. Until today, it has thus been used intensively in specific industrial processes [
1] and in heating, ventilation, and air-conditioning (HVAC) in buildings [
3] as a key element in heat recovery systems (HRS). Heat exchangers in general have been optimized over the years in order to improve their performance, especially tube-shell heat exchangers [
6,
7,
8]. Other types of heat exchangers are also available in HVAC applications, such as regenerative heat exchangers and membrane heat exchangers [
9]. Regenerative heat exchangers are the most efficient for HVAC purposes [
4]. Regenerative heat exchangers, which is the classification in which RHXs belong, are challenging in terms of mathematical modeling [
10]. Other authors have also tried to integrate economical or environmental aspects into the optimization of RHXs, but based on closed methods [
11], which are limited in accuracy [
12].
Nowadays, many manufacturers worldwide produce RHXs with different designs and efficiency levels. This efficiency is independently tested and certified by the organization Eurovent and their results are publicly available online. Thousands of different models made by various manufacturers from around the world have been certified [
13].
The European Commission has passed laws governing ventilation systems over the last decade that increase HRS thermal efficiency above 67% starting in 2016 and above 73% as of 2018 for new buildings [
14]. Thermal efficiency is defined by this law [
14] as:
where
η is the HRS thermal efficiency, and
ϑ is the temperature for the corresponding stream in ° C;
ϑ2.
2 is the temperature of the supply air leaving the HRS and entering the room,
ϑ2.
1 is temperature of the ambient air, and
ϑ1.
1 is temperature of the process air, leaving the room and entering the HRS [
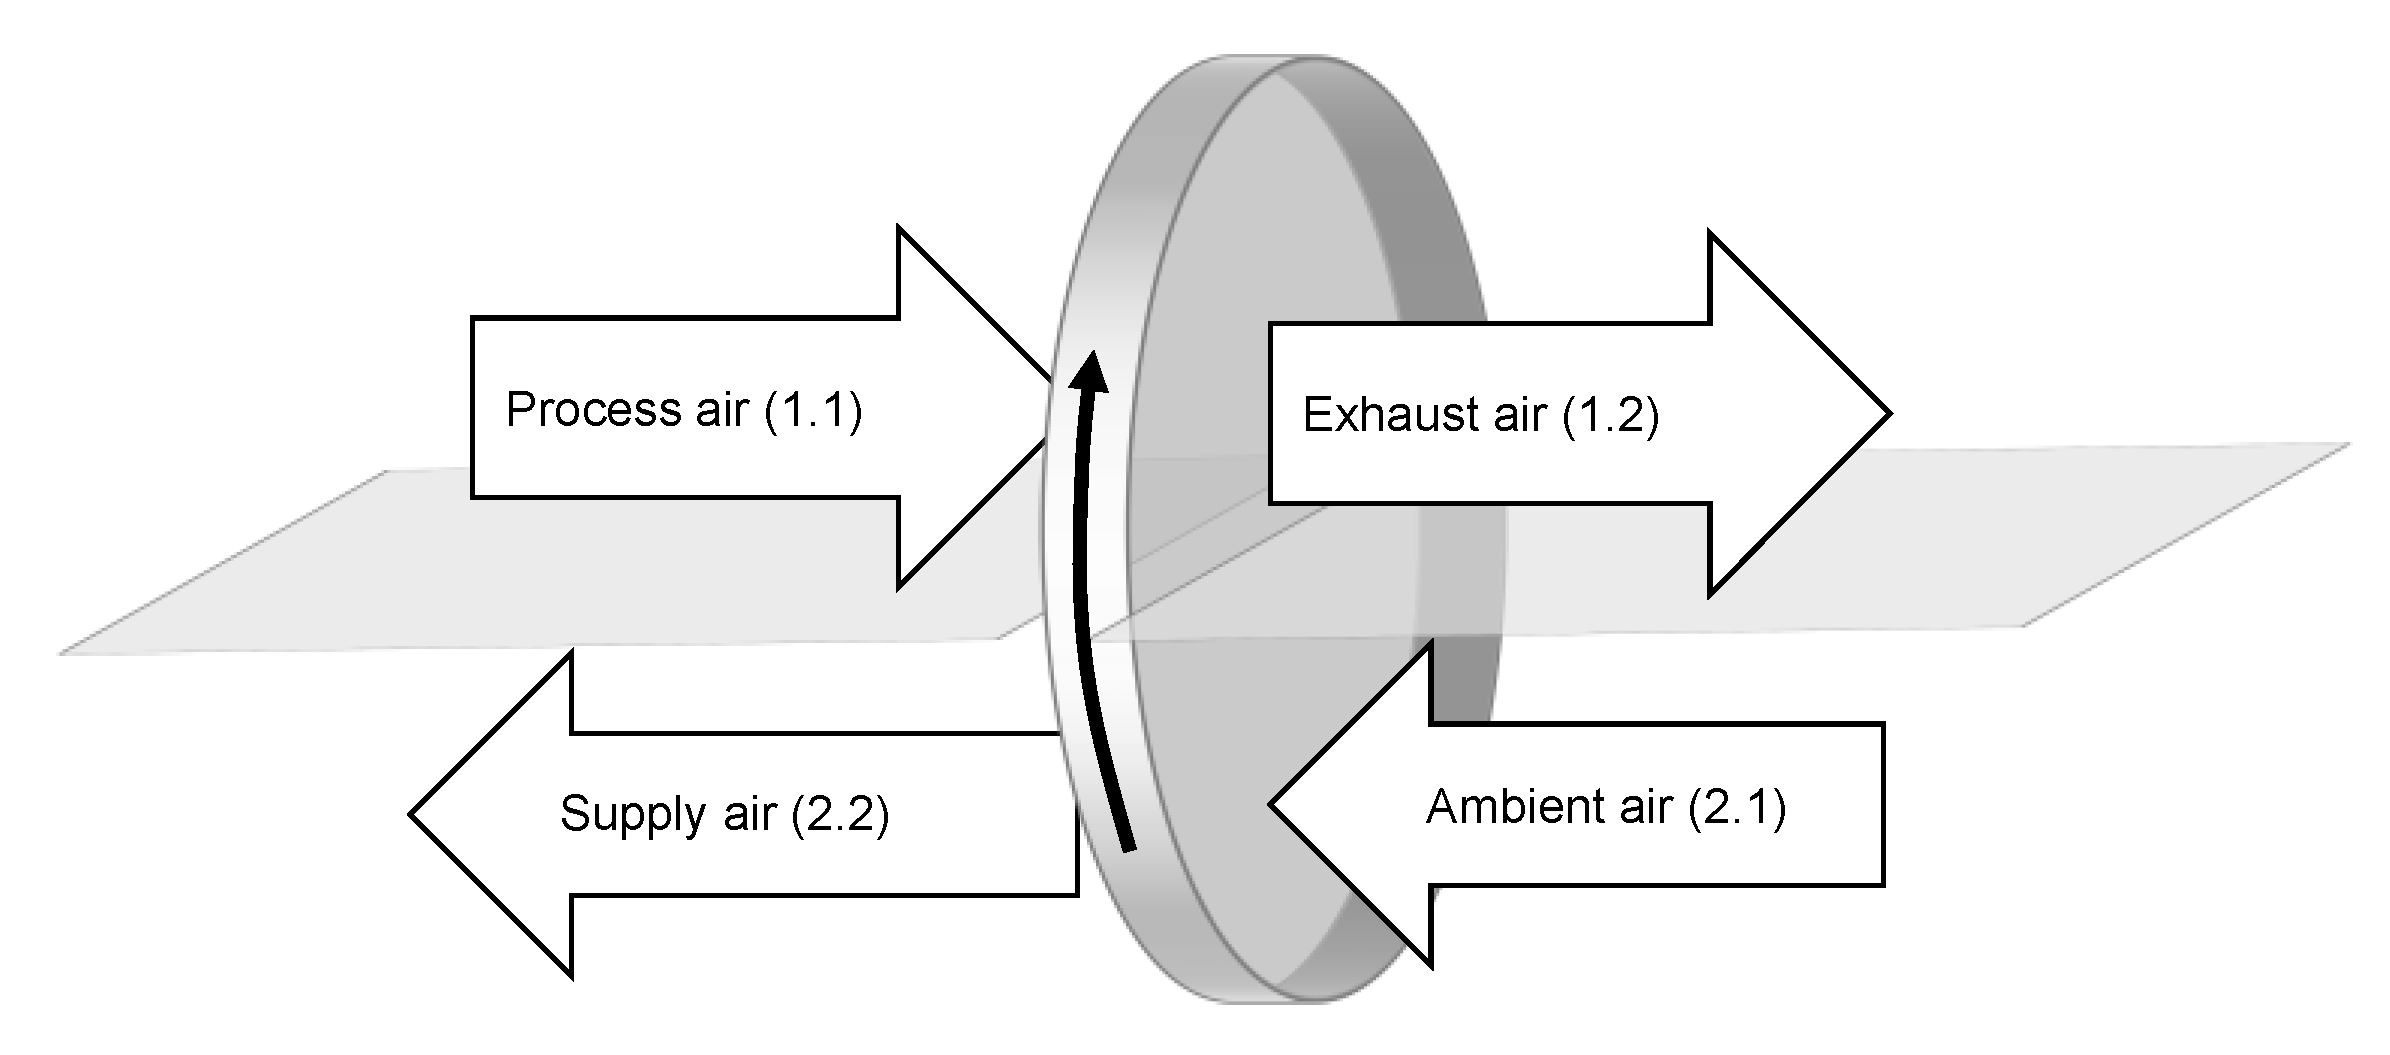
14]. Schematics of the streams are depicted in
Figure 1, where the type of HRS is an RHX and
>
>
>
when the RHX is used as a preheater. When the RHX is used for cooling, then
>
>
>
is used, but the definition of efficiency from Equation (1) is still valid. Kaup [
15] advises that the European Union could further increase thermal efficiency
requirements, since it is assumed that the requirements in the enacted legislation will need to be reviewed.
A further political influence is a price increase in taxes for emissions of greenhouse gases (GHG), which are measured in €/t CO
2 Equivalents and regularly referred to as “CO
2 pricing.” As of now, in Germany, this only applies to industries and the energy sector, whereas in the future, it would also apply to buildings. This price increase will start with 25 €/t CO
2 Eq. in 2021 and will gradually increase until 2026, when the price should be between 55 and 65 €/t CO
2 Eq. [
16]. Including buildings in CO
2 pricing creates both an opportunity and a challenge for further improving RHX design and operation.
For manufacturers, the challenge to produce competitive and affordable RHXs becomes more difficult because highly efficient heat exchangers frequently need more material [
12] and are more expensive to manufacture. From the customer’s point of view, many RHX models already on the market comply with the EU requirements [
14]. However, since there is a myriad of RHX models and multiple possible operational points, it is not clear which is the best option to choose in light of the upcoming challenges. Furthermore, not all customers are completely aware of the conflict between the operation (heating and ventilation costs and energy monetary savings due to the HRS) and investment costs for their facilities. Therefore, customers might invest in a cheaper system in the construction stage of the project but then are forced to pay high heating costs when operating the facility. This is a short-sighted view. Hence, the entire product life cycle should be assessed in terms of economics and the environment, taking into account the thermodynamics and fluid mechanics aspects that have an impact on the RHX thermal efficiency.
The authors of this article have previously successfully developed a model for life cycle assessment (LCA) and cash flow analysis to calculate net present value (NPV) and internal rate of return (IRR) for RHXs [
17]. This previous model shows the magnitude of the trade-off when optimizing either the economic or ecological aspects of RHXs. In that study, RHXs efficiently saved on GHGs and were economically less appealing (5% IRR) while RHXs were more economically appealing (70% IRR) and saved around 40% less GHGs than the aforementioned case [
17]. This conflict arises from the fact that electricity is required to operate the RHX. Ventilators have to overcome the pressure drop produced by the RHX are therefore the largest energy consumers. Since heat and electricity have different prices and different GHG emissions per energy unit, basing a purchase on pure energetic optimization is short-sighted. Additionally, some RHXs that require more material to manufacture produce greater amounts of GHG emissions during the production process and also entail higher investment costs, but they are often more efficient during the use phase. This is an additional trade-off worth investigating.
Therefore, the purpose of this work and the innovation of this article is to carry out an economic optimization of RHXs design parameters and operating conditions. Furthermore, the ecological aspect is taken into account by monetizing the GHGs. This optimization is based on a fluid dynamic and thermodynamics simulation while considering the economic and ecological aspects by assigning different scenarios for CO2 pricing. The idea of these scenarios is to study how sensitive the design and operating parameters are to the CO2 pricing.
It is worth noting that no previous work has been found within RHX literature that studies this economic or ecological optimization conflict. Unfortunately, scientific research on this topic is relatively scarce and further improvements proven by empirical evidence are restricted to individual cases and limited on the optimization scope to improving heat transfer efficiency [
18,
19,
20,
21,
22]. This is probably due to the difficulty of simulating RHXs and the very specific technology, almost unknown outside its niche applications. Nevertheless, ventilation systems are gaining awareness in the general population, and the pressure on energy recovery and CO
2 savings is continuously increasing. Rotary heat exchangers can be part of the solutions on these topics.
2. Materials and Methods
RHXs are sometimes referred to as “thermal wheels,” “Kyoto wheels,” “heat recovery wheel,” “rotary air-to-air enthalpy wheel”, or “heat recovery wheel,” depending on the field of application, but the functioning principle is always the same. The working principle of RHX is based on the capacity of materials to store heat. Since heat is to be recovered from a specific gas stream (process air 1.1 in
Figure 1), this stream flows through one sector of the RHX. At the same time, another gas stream (ambient air 2.1 in
Figure 1) needs to be heated and flows in the opposite direction through the other sector of the RHX. The two streams are separated by sealings and a wall, which are integrated into a housing (not illustrated in
Figure 1). Only the RHX, which is continuously rotating inside the housing, comes into contact with both streams. In this sense, it always absorbs heat in the one sector and releases heat in the other sector.
2.1. RHX Simulation: Design and Operational Parameters
RHX are manufactured by simultaneously coiling flat and a corrugated aluminum sheets as depicted in previous work [
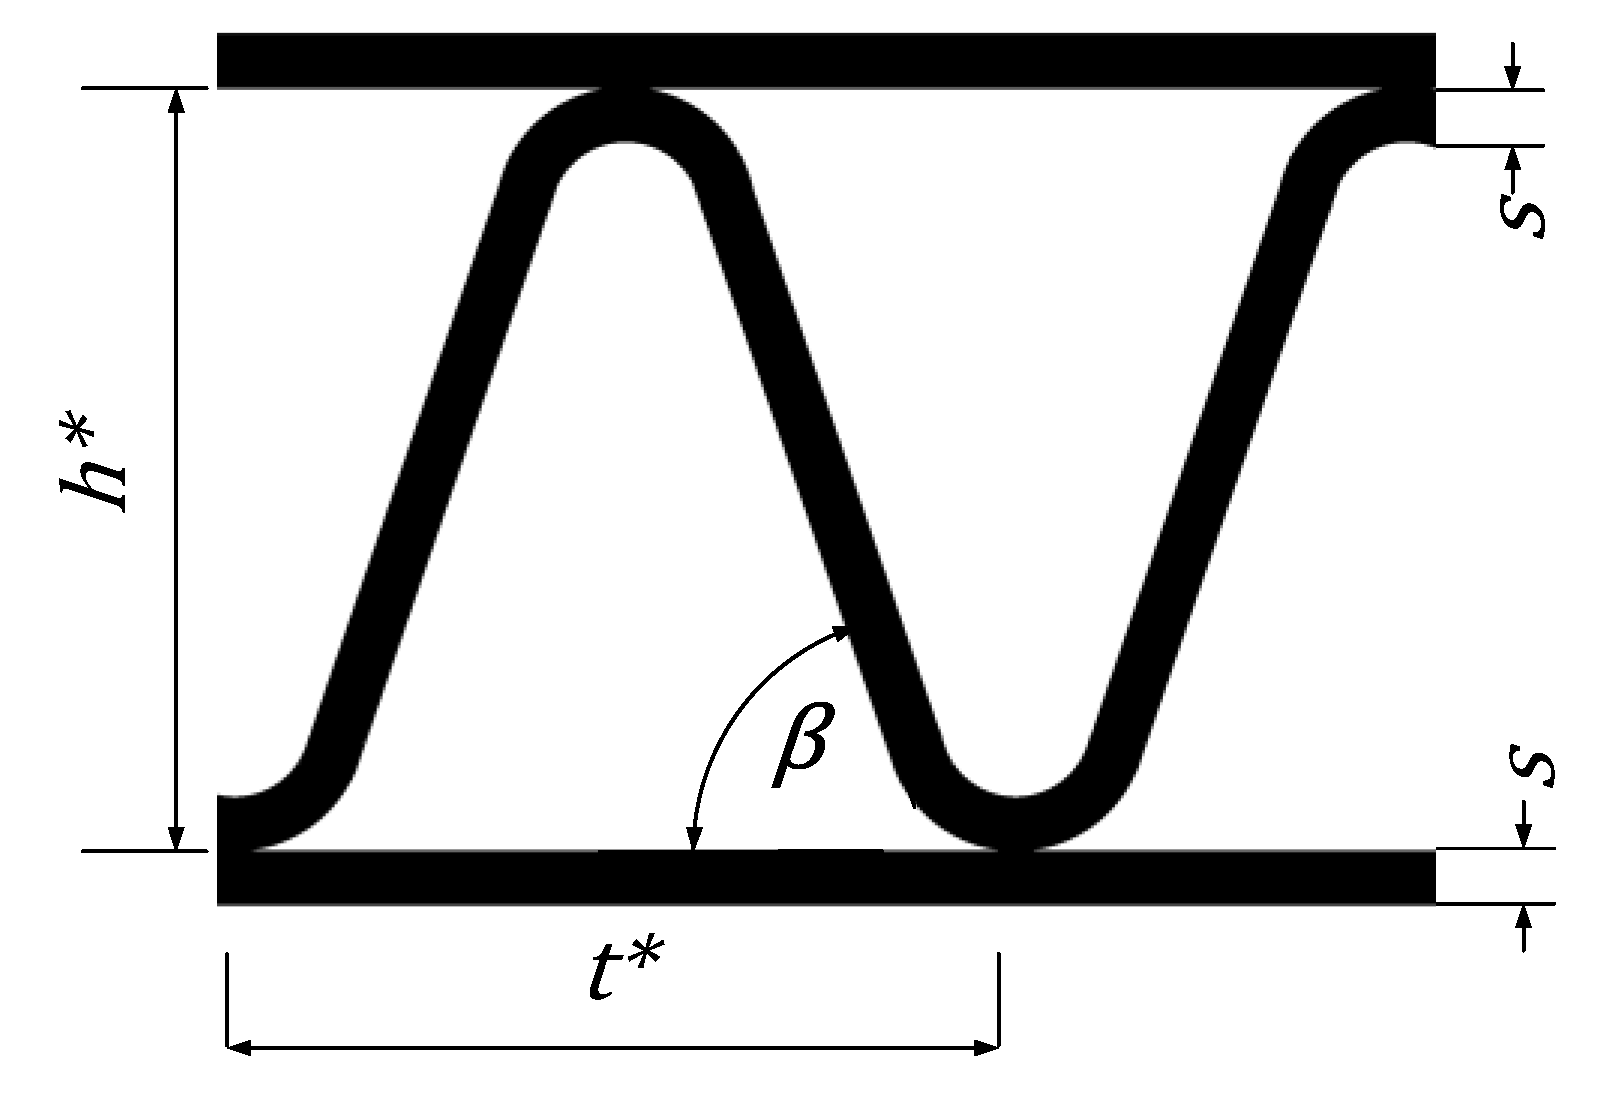
17]. The result is a “honeycomb” structure as shown in
Figure 2. Operational parameters and design parameters influence the thermal efficiency
and the pressure drop of the RHX. Previous research conducted by the authors of this article [
12] yielded a successfully developed simulation using the LINUS (Local Internal Nusselt Number for Sine Ducts) model for RHX, based on thermodynamic and fluid dynamic aspects that take these design and operational parameters into account. The simulation with the LINUS model was validated using empirical data from a pilot plant and data from the Eurovent database. This simulation makes it possible for a given set of design and operational parameters to predict the thermal efficiency
and pressure drop of the RHX within acceptable real-life limits. Furthermore, this simulation using the LINUS model delivers the most accurate predictions in thermal efficiency
found in literature [
12]. This simulation is the basis for predicting heat energy savings and electricity costs. Following the same logic as in the previous work [
12,
17], the parameters for optimizing RHXs are:
Wave height
: Distance between two metal sheets in which the waves are formed as shown in
Figure 2.
Wave angle
: Refers to the angle formed between the straight segment of the wave and the flat aluminum layer, also shown in
Figure 2.
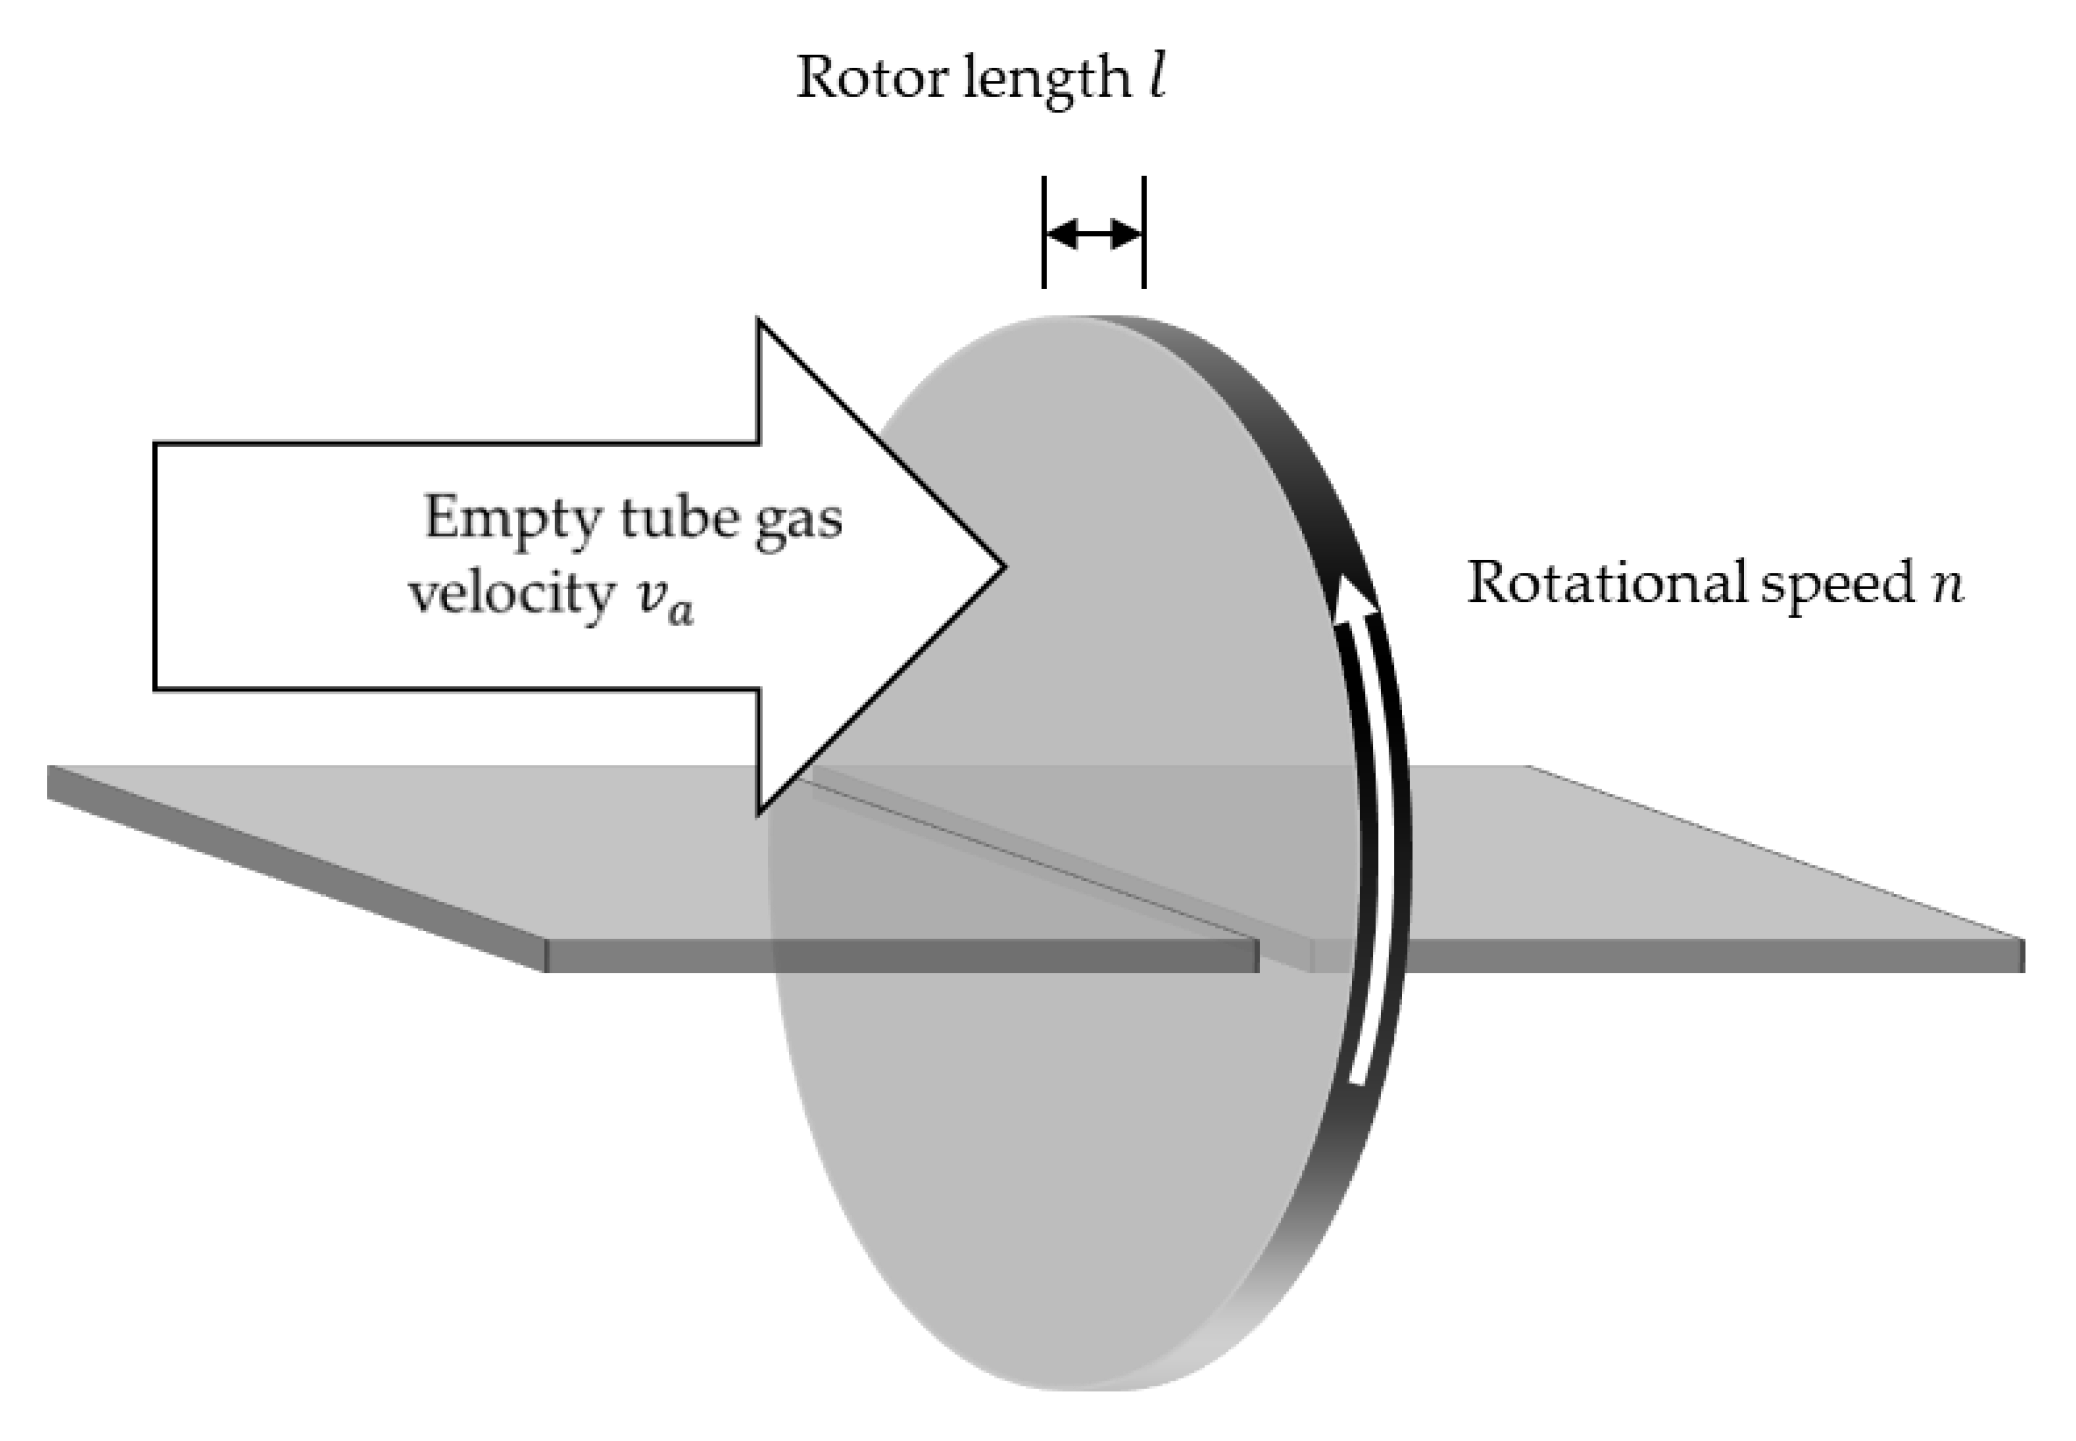
RHX length
: Distance that the gas flows inside the RHX, as shown in
Figure 3.
Empty tube gas velocity
: The gas velocity measured just before or after the RHX as shown in
Figure 3. Since gas velocity is a parameter that is temperature dependent, it changes the value from ambient air (2.1) to supply air (2.2) or from process air (1.1) to exhaust air (1.2). Therefore, in this work, it will only refer to the empty tube gas velocity of the ambient air (2.1)
. Moreover, since the RHX partially covers the flow area, the internal gas velocity is higher. This aspect has been already covered in previous work [
12]. In this work, it is also assumed that no air flow takes place through the RHX seal clearances (no sealing leakages) and that the mass flow through both flow sides is identical (no infiltration). Hence, mass flow
is identical (no purge) to the four streams depicted in
Figure 1. Furthermore, it is assumed that the flow to the RHX is evenly distributed, and as a consequence, the mass flow per surface area
is also constant, which is equal to the product of the empty tube gas velocity
and density
of the corresponding stream.
Often in the literature, other parameters are considered to have an influence on heat exchangers thermal efficiency . However, for the following reasons, they are not considered in this work on RHX optimization:
Wavelength
shown in
Figure 2: Since its value is directly dependent on wave height
and wave angle
, it is not necessary to be included. However, this is the method Eurovent uses to report their data [
13].
Material thickness
, shown in
Figure 2: The developed simulation [
12] demonstrated that RHXs with a smaller material thickness (
= 60 µm) have a higher thermal efficiency than thicker ones (
= 100–200 µm). This effect is consistent with the Eurovent data [
13]. Additionally, thicker material requires more aluminum mass and therefore increases the RHX price and GHG emissions [
17]. Consequently, there is no economic or ecological conflict in this parameter. In addition, our cooperation industrial partner suggested the constructive challenges of material thinner than 60 µm be used. As a result, the material thickness
was set to 60 µm.
Rotational speed
of the RHX shown in
Figure 3: Higher rotation speed means higher thermal efficiency. This is consistent with simulation experimental data [
12] and the literature [
5]. Since the RHX drive train’s power consumption is several orders of magnitude smaller than the ventilators’ power consumption, rotational speed
does not significantly affect the system’s electrical demand and therefore does not significantly affect the operation costs or the GHG emissions. Moreover, after a given rotational speed
, which is dependent on the RHX design and operational parameters [
12], thermal efficiency is not further increased [
5,
23]. Therefore, rotational speed
was set to a constant value of 24 rpm for the purposes of this study.
2.2. Ecological and Economic Assessment Methods
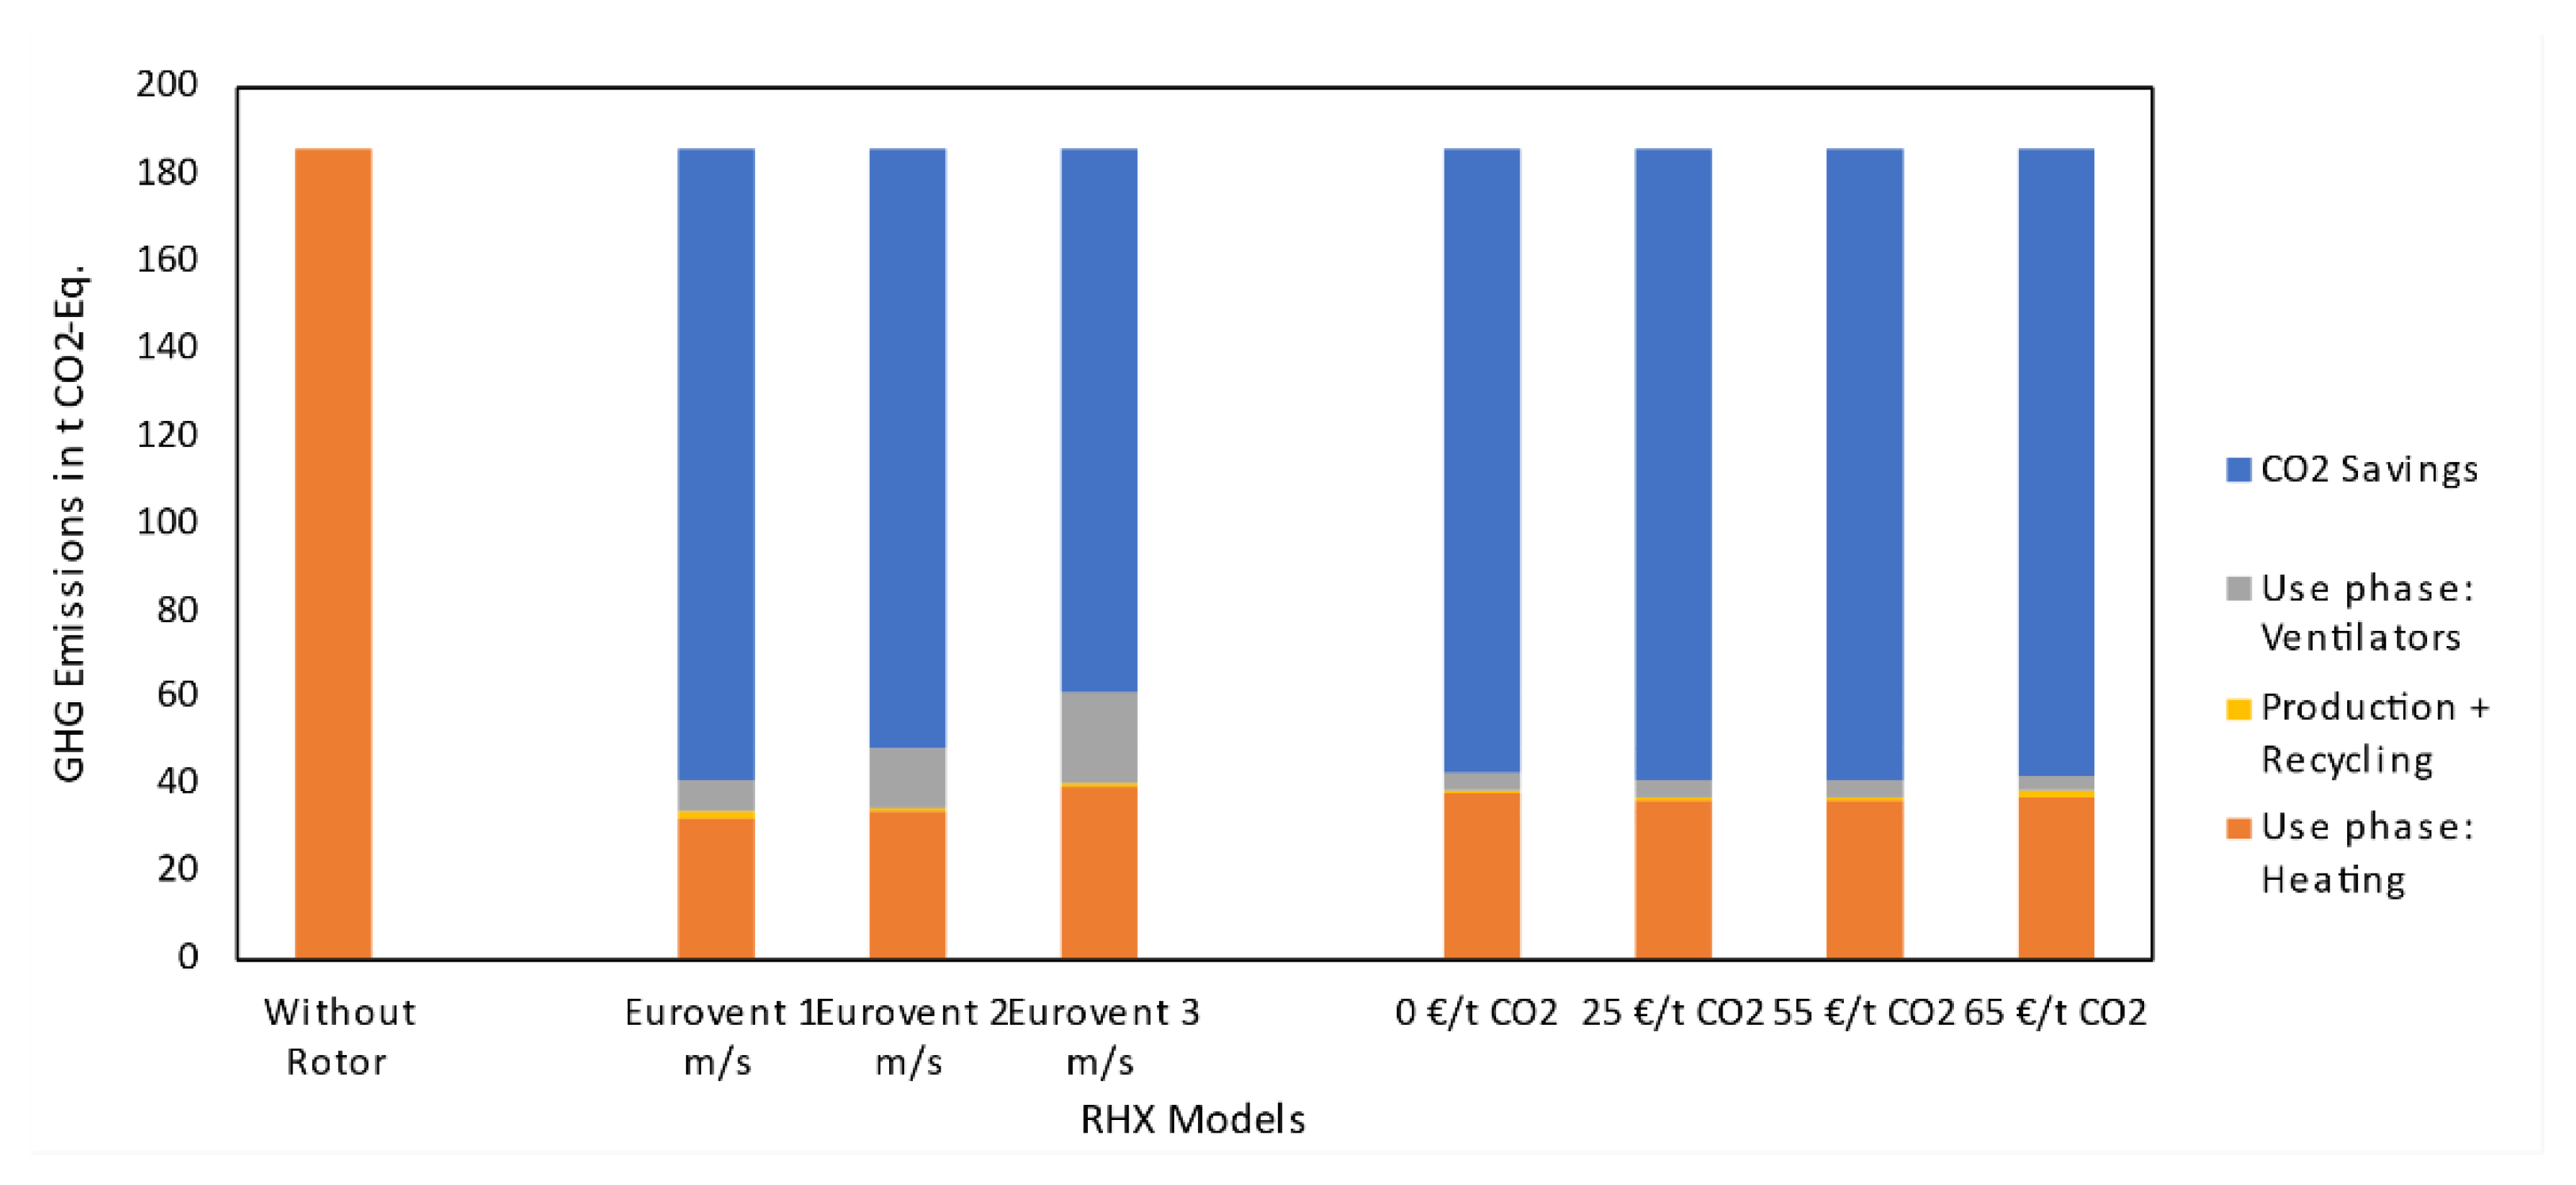
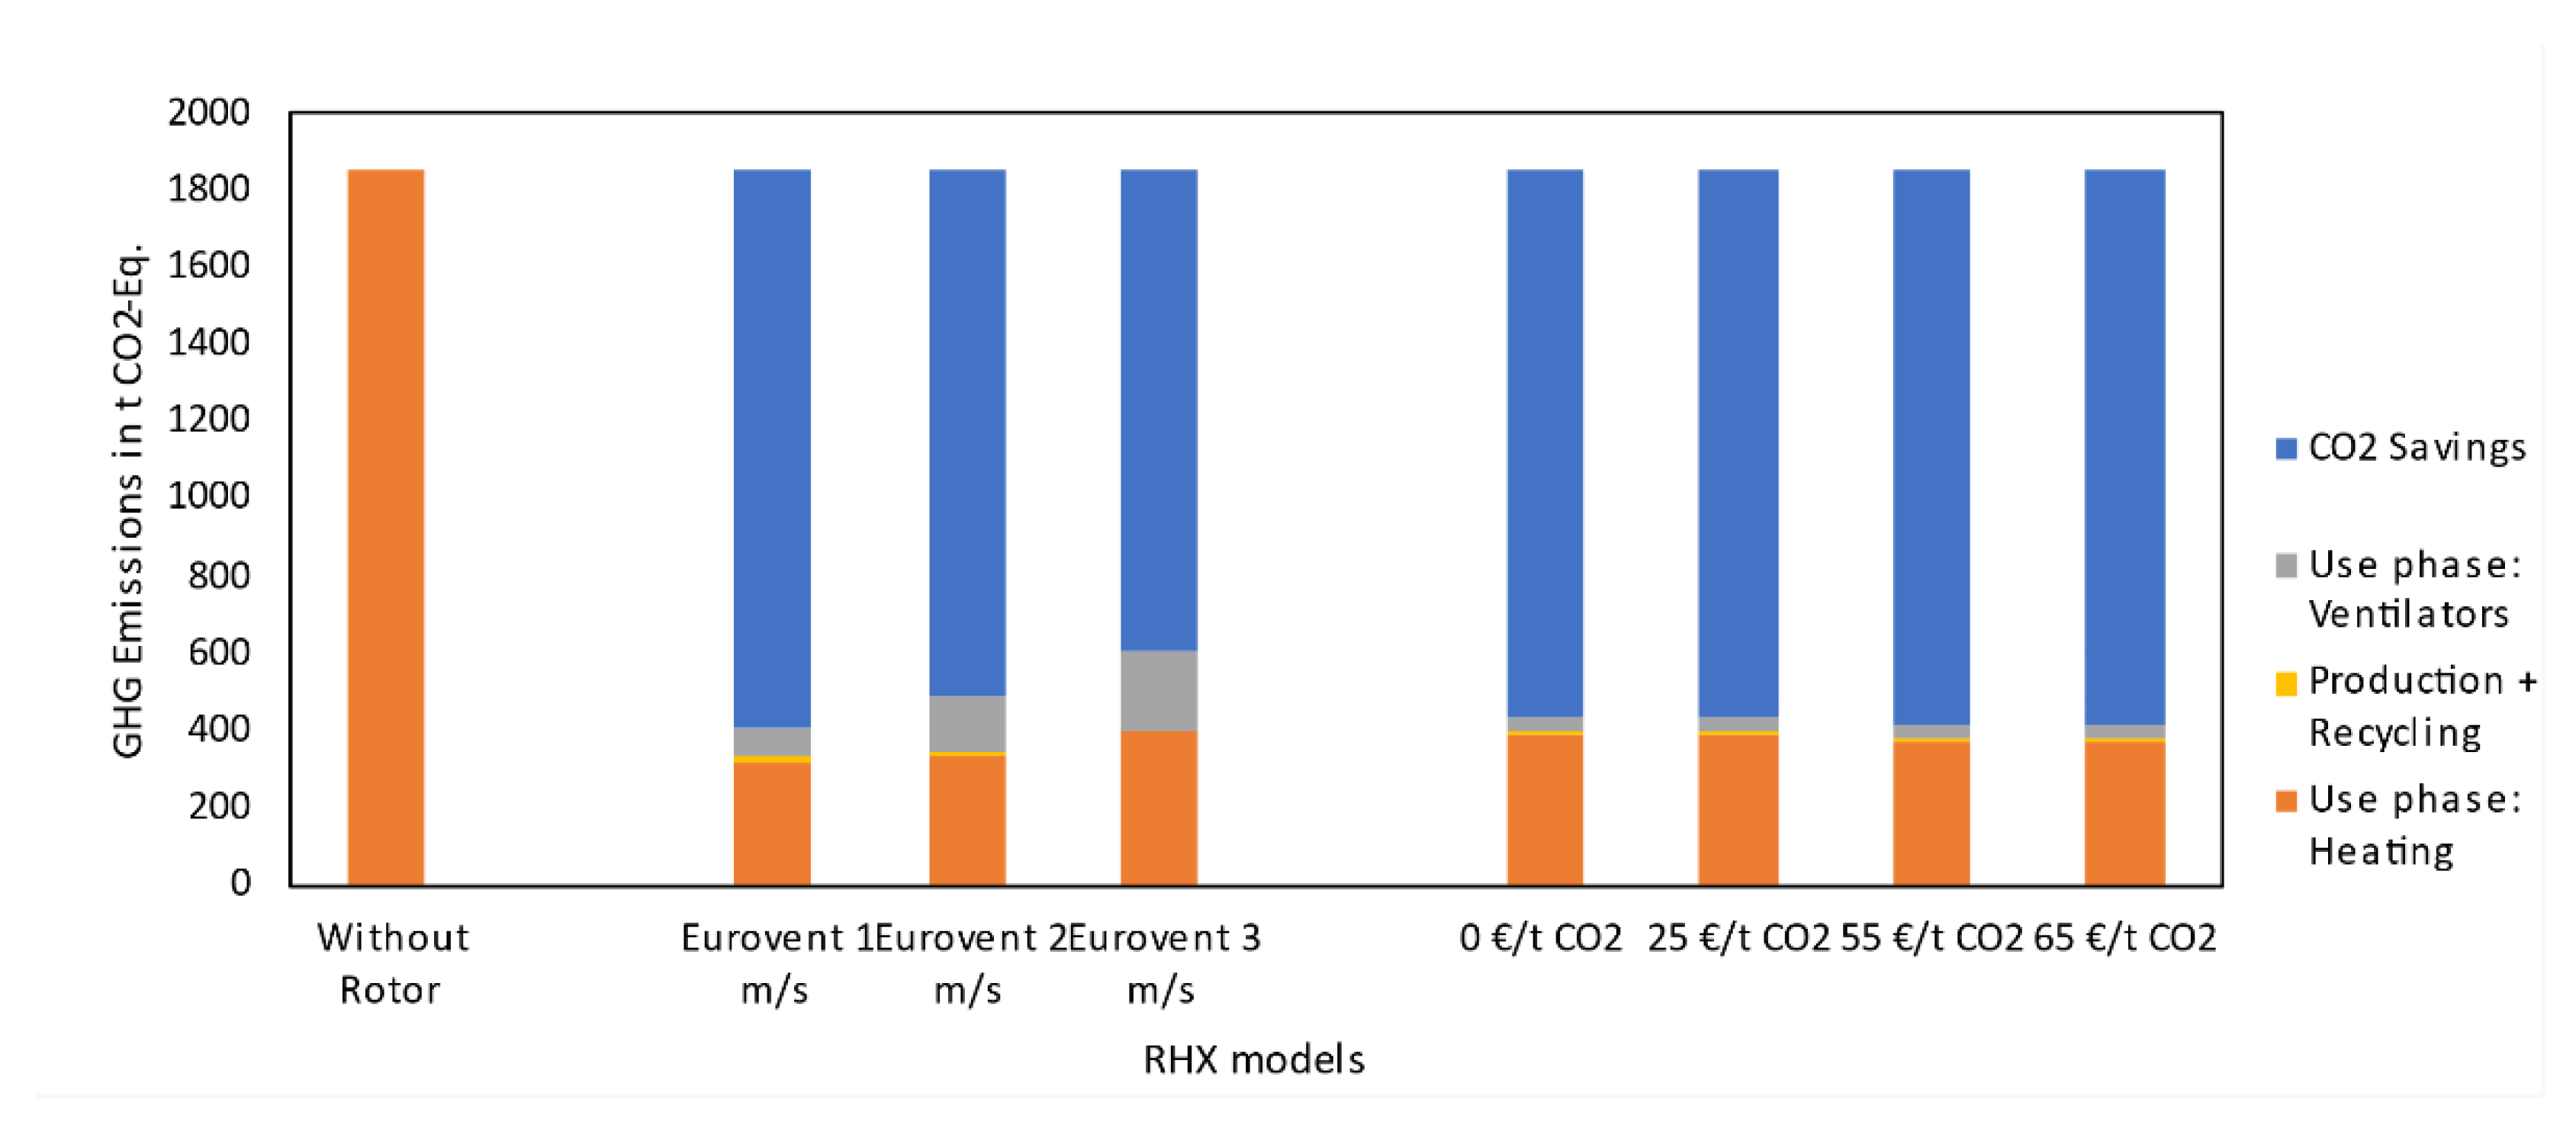
The ecological evaluation is carried out using an LCA by implementing a cradle-to-grave approach. This means that the RHX life cycle is analyzed based on the raw material extraction through its end of life. Therefore, the LCA is divided into the following phases: Manufacturing (production), the use phase, and end of life (recycling). Previous work has already been done on this and the most important indicator is the GHG emissions (in CO
2 Eq.) when assessing the life cycle of an RHX [
24]. The functional units (FU) chosen are 10,000 m
3/h and 100,000 m
3/h of ambient air (2.1 in
Figure 1) that flows into the system at 10° C. Since temperature and volume flow act as the FU, these are the equivalent in mass flow
to 12,460 kg/h and 124,600 kg/h correspondingly. The reason for the FUs is due to transportation aspects: RHXs with diameters greater than 2900 mm are segmented into smaller pieces after being manufactured and rebuilt at their final location. Therefore, the smaller FUs focuses on the optimization of single-unit RHX and the larger FU focuses on the segmented ones. Since their pricing is calculated using different equations [
24], these different equations would have to be used in these two scenarios.
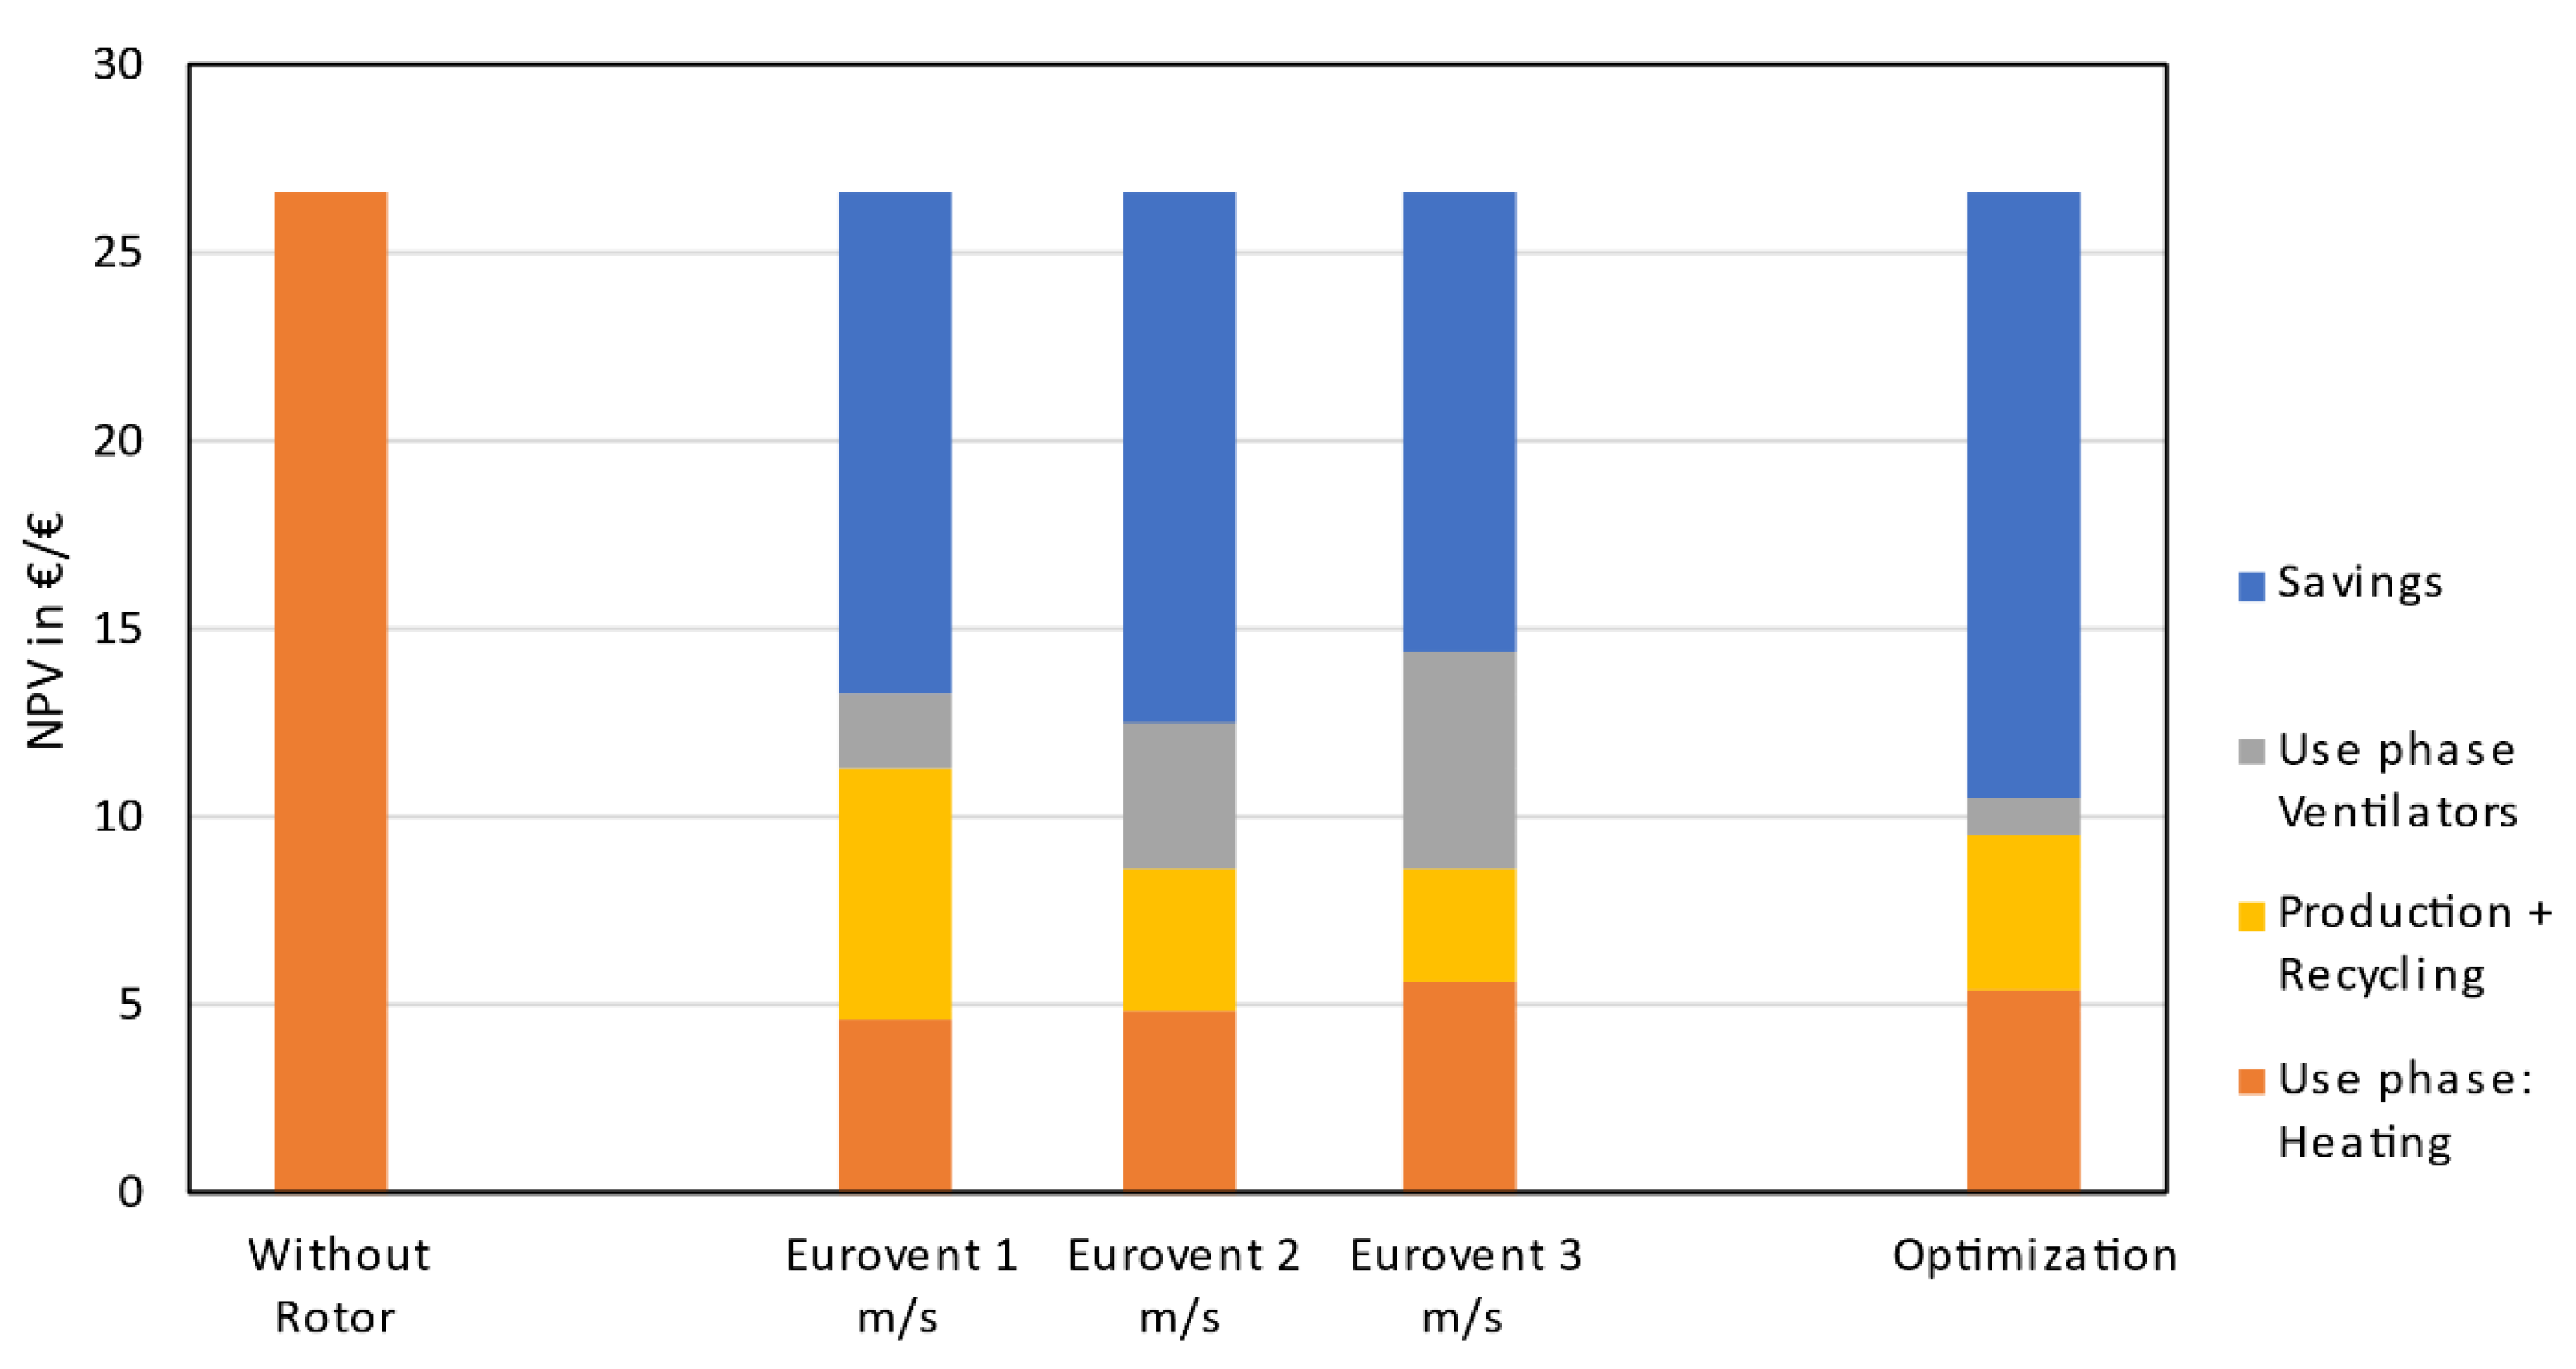
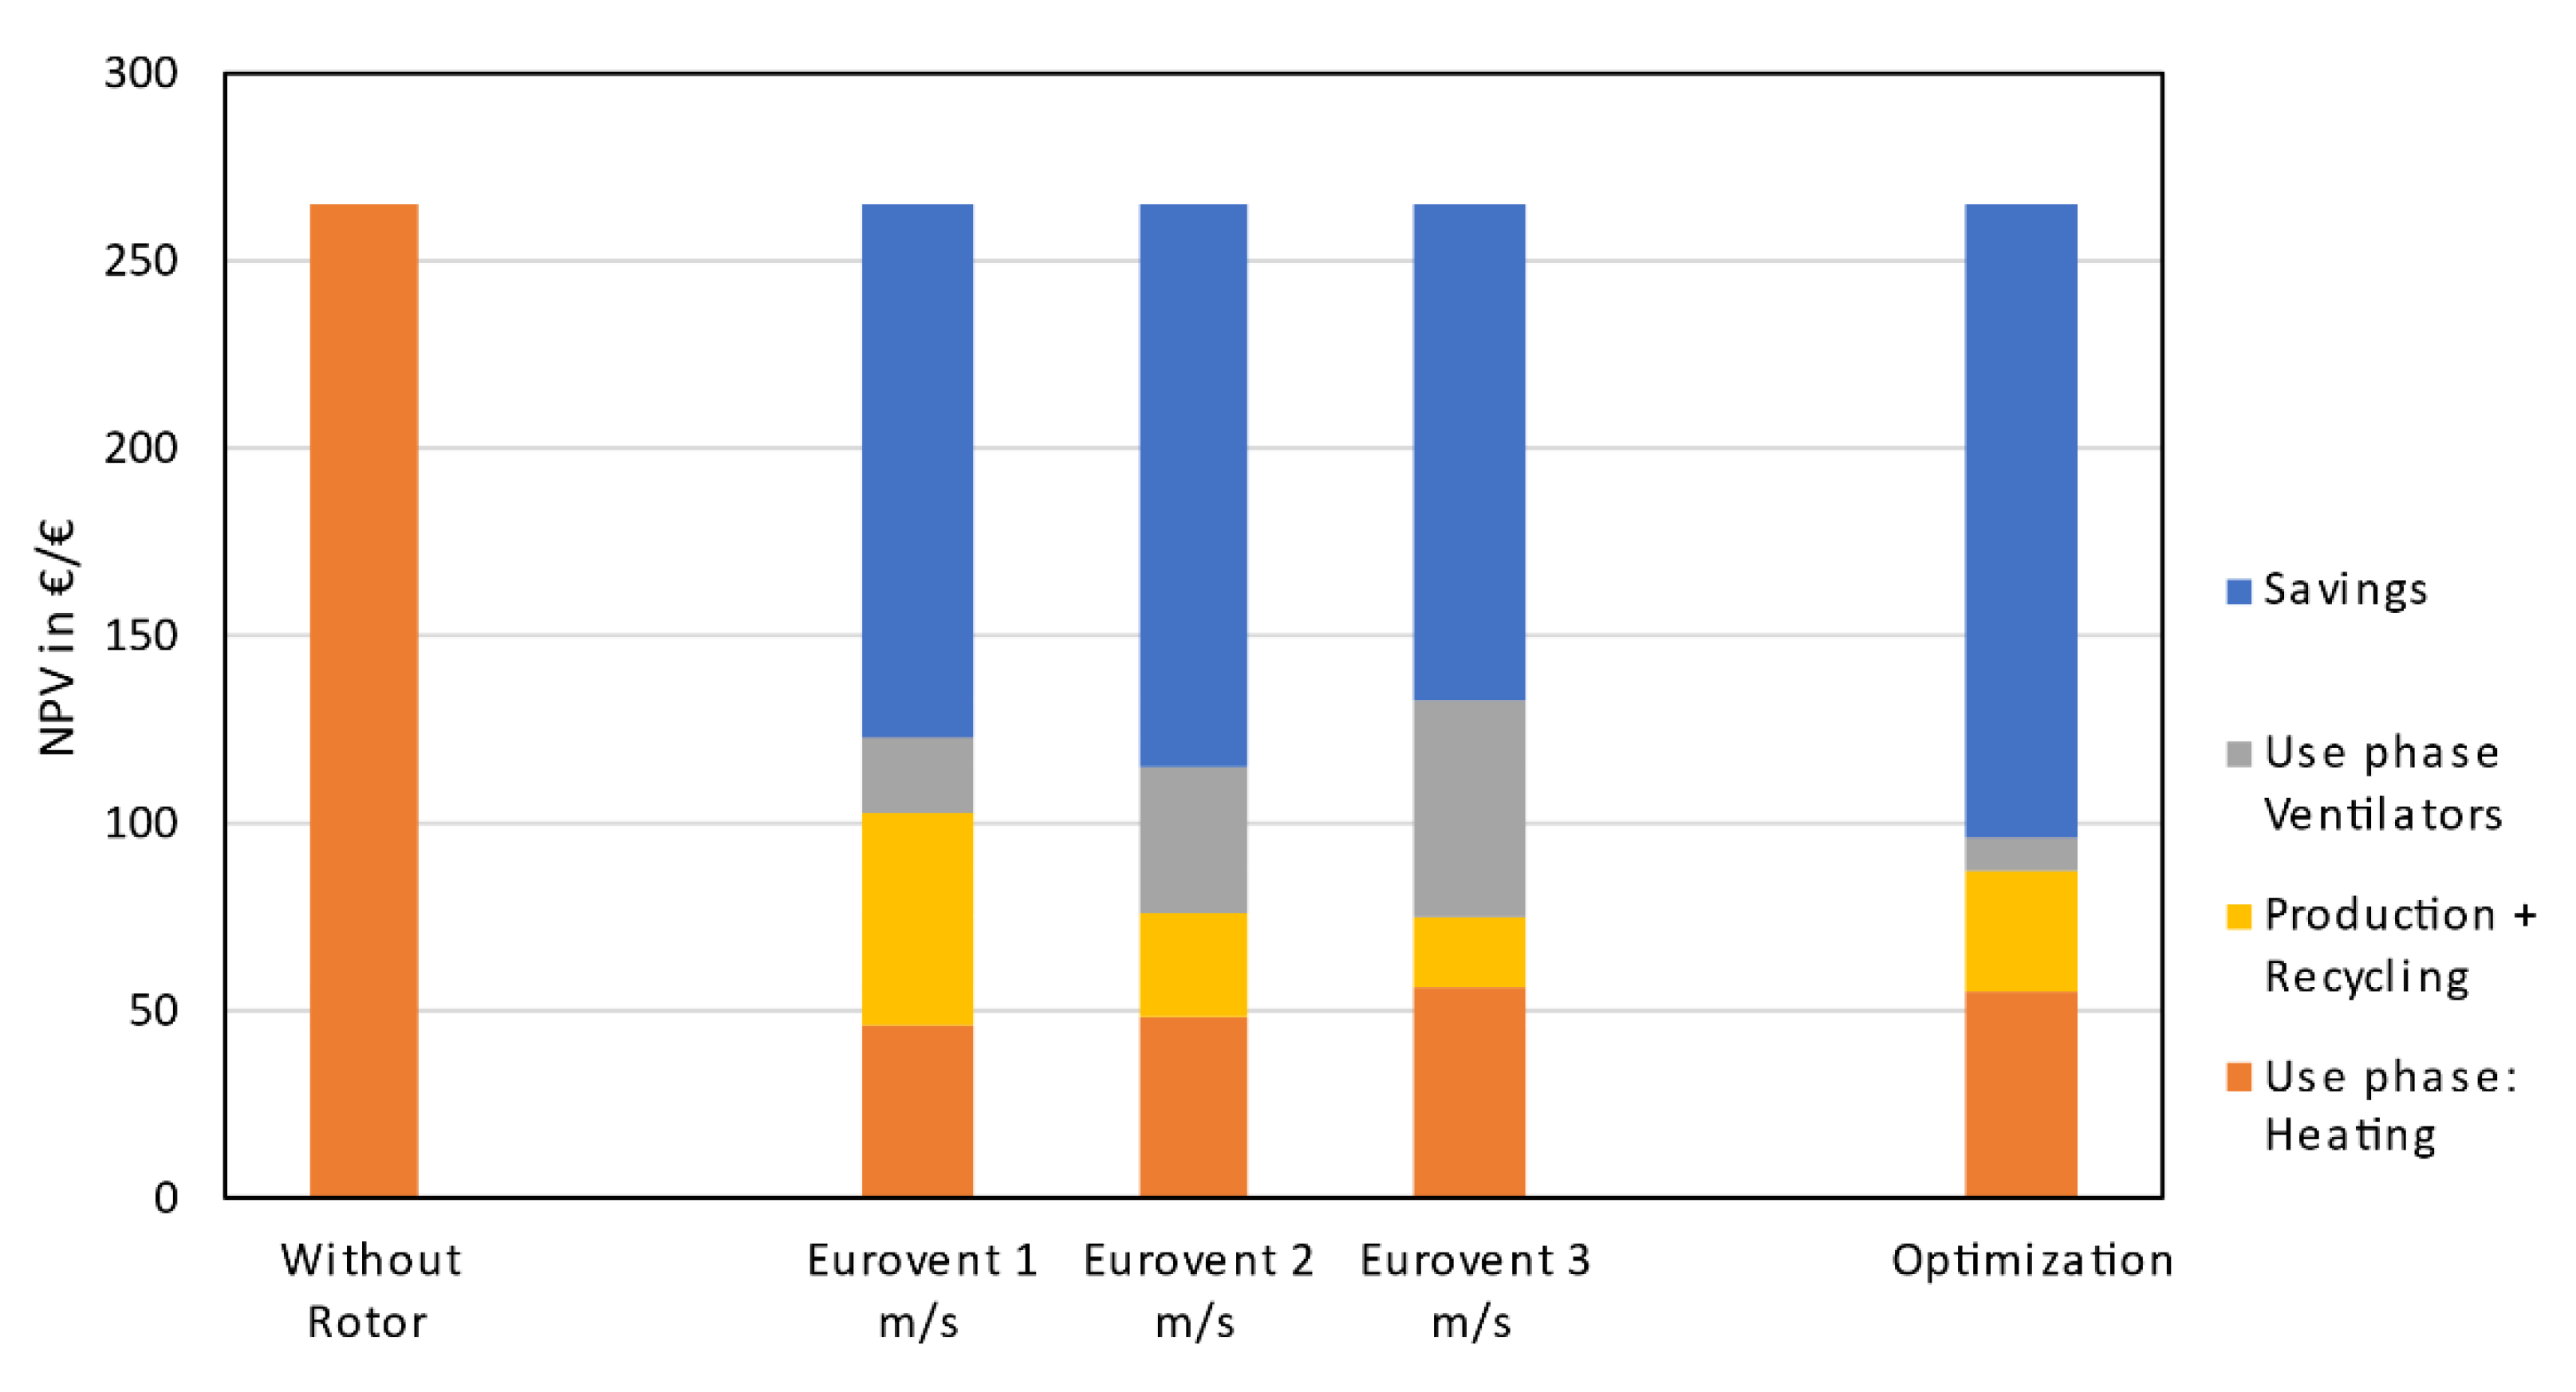
The economic assessment is based on the same cash flow analysis as a previous work [
17]. This previous research has shown that an optimization with IRR as an objective function results in an RHX that does not comply with the minimum requirements of EU law. Furthermore, RHXs with higher IRR have lower GHG emissions savings and RHXs with higher GHG emissions savings have lower IRR. In addition, because of the IRR definition, lower investments are preferred. Therefore, in this work, the economic aspect is evaluated using the NPV and not the IRR. Regarding investment costs, the GHG emissions costs had been added with help of the CO
2 pricing. In the use phase, the electricity and gas the costs increase according to the GHG emissions and corresponding pricing. Additionally, regarding the end-of-life step, revenue is added that takes the GHG emissions savings from the recycling process into account.
RHXs typically have a 10- to 20-year service lifetime, depending on the application. Therefore, the more conservative value of 10 years is assumed. It is also assumed that the prices and emissions for gas and electricity are the ones currently charged on the German market, since it is very likely that the CO
2 pricing could be applied in Germany [
16]. The conditions for the economic and ecological assessment are presented in
Table 1 below.
2.3. Optimization Method
The C# simulation algorithm developed in previous work [
12] is combined with an optimization algorithm. Previous experience [
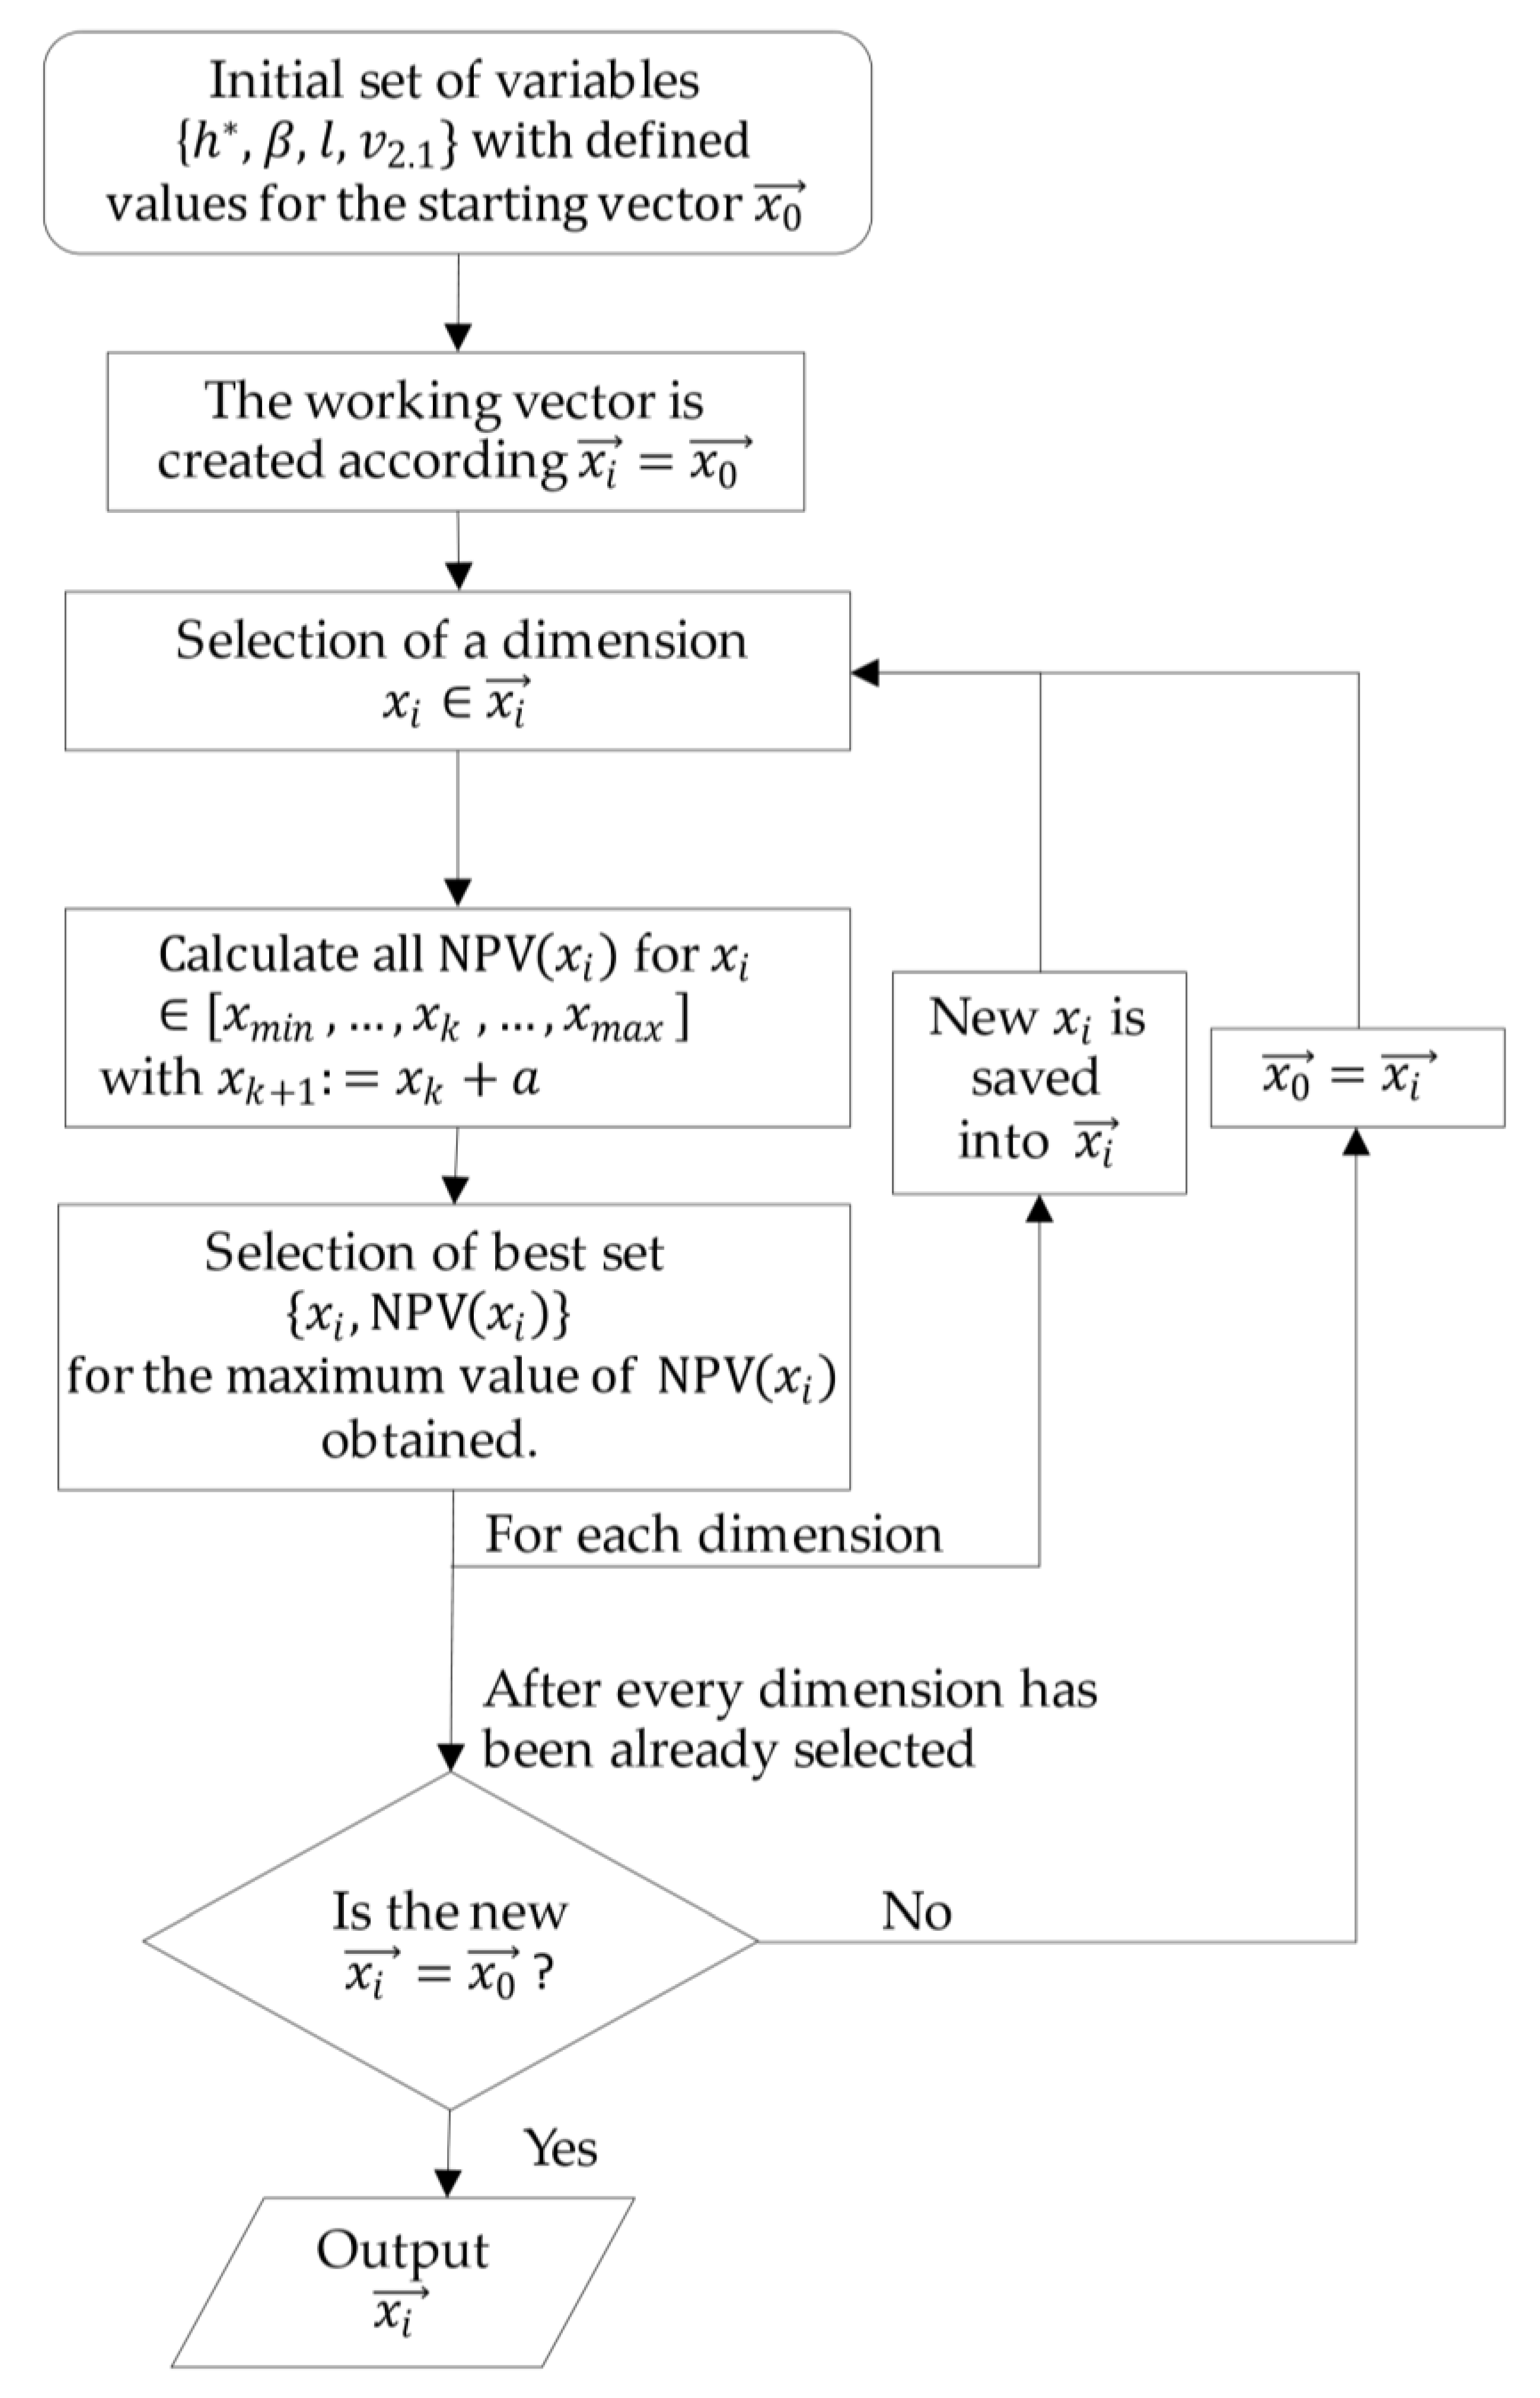
17] with commercial optimization software showed that the commercial algorithm presented difficulties in finding the best values in the vicinity of the optimum and required immense computation time to find many digits after the decimal point for the rotor length, for example. This accuracy is not required for practical purposes. Unfortunately, the commercial software did not allow limiting the accuracy of the optimization. Additionally, the commercial software is a “black box,” meaning that the documentation does not reveal the methods used. Therefore, in this work, an algorithm is used based on multi-dimensional, unconstrained optimization with a univariate direct search method. The way this method works is depicted in
Figure 4 and described as follows: An initial set of values for each dimension (wave height
, wave angle
, RHX length
, and ambient air empty tube gas velocity
) is selected by taking the mean value of the minimum and maximum values given (the start vector
is then created). Initially, the working vector
is created and equal to the starting vector
Then a specific dimension is selected (e.g., wave height
). For each value between the minimum and maximum values and with a step size equal to the accuracy
, the simulation is carried out and the NPV
is calculated. According to the maximum value of
obtained, the corresponding
is selected for replacing the original value from the working vector
and this process is repeated for the following three dimensions. After every dimension has been evaluated, the working vector
is checked to determine whether it equals starting vector
. If they are equal, the optimization is terminated. If they differ from each other, the process starts over from the point where the dimensions are selected and now starting vector
equals working vector
.
It is documented in the literature [
27] that the multi-dimensional unconstrained optimization with a univariate direct search method loses efficiency but not efficacy in finding the maximum in the vicinity of the optimum. To avoid this unnecessary and considerable computation time, the accuracy for each variable of the optimization was kept constant at a reasonable and practical value, depending on the variable itself. The accuracy used and the ranges are summarized in
Table 2.
These ranges are roughly based on the ranges for which the nearly 1300 Eurovent aluminum RHXs have been certified [
13]. These Eurovent ranges are presented in
Table 3.
It should be noted that RHXs with an RHX length smaller than the commonly built 200 mm length provide lower thermal efficiency. Previous work [
17] has shown that longer RHXs save more on GHG emissions, although they require more material. Therefore, when a price is set for CO
2 Eq. emissions, it is expected that the optimum RHX is longer than the usual 200 mm. Additionally, these RHXs that are smaller than 200 mm rarely reach the 73% thermal efficiency [
13] required by law [
14]. Still, for giving a possible range for improvement, RHX lengths
greater than or equal to 150 mm were considered.
Regarding the wave angle range, not only is the Eurovent database limited but so is the simulation model [
12] because the models for the Nusselt number, which is used to calculate the heat transfer coefficient, is limited to maximum 60° for sine ducts [
28].
The goal of this optimization process is to determine how the CO
2 pricing influences the optimal design and operational parameters of RHXs, while the NPV is objective function to be maximized. For reasons of simplification, the inflation rate is considered to be 0%. Based on political reasons [
16], the CO
2 pricing defines the following scenarios:
Scenario with 0 €/t CO2 Eq.
Scenario with 25 €/t CO2 Eq.
Scenario with 55 €/t CO2 Eq.
Scenario with 65 €/t CO2 Eq.
Additionally, two optimization scenarios from previous work [
17] have been updated under these conditions from
Table 1 and presented for comparison reasons:
Scenario of GHG emissions savings, where the objective function is to maximize CO2 Eq. savings. In this case, a CO2 pricing or inflation do not play a role.
Scenario IRR, where the objective function is the maximization of IRR where CO2 pricing is set to 0 €/t CO2 Eq. and inflation is considered 0% annually. Please note that in the previous work, the IRR was used as an objective function instead of the NPV.
2.4. Comparing the Optimization Results to Eurovent Model
Finally, the results of the optimization step are compared in terms of GHG emissions and NPV to a Eurovent-certified RHX, model P_17-1100-WZV, whose thermal efficiency information is available online [
13]. This RHX has been simulated successfully by the authors in the past [
12]. This is an RHX with a high thermal efficiency (78–83%), so it is considered state of the art. The simulated RHX has the characteristics listed in
Table 4.
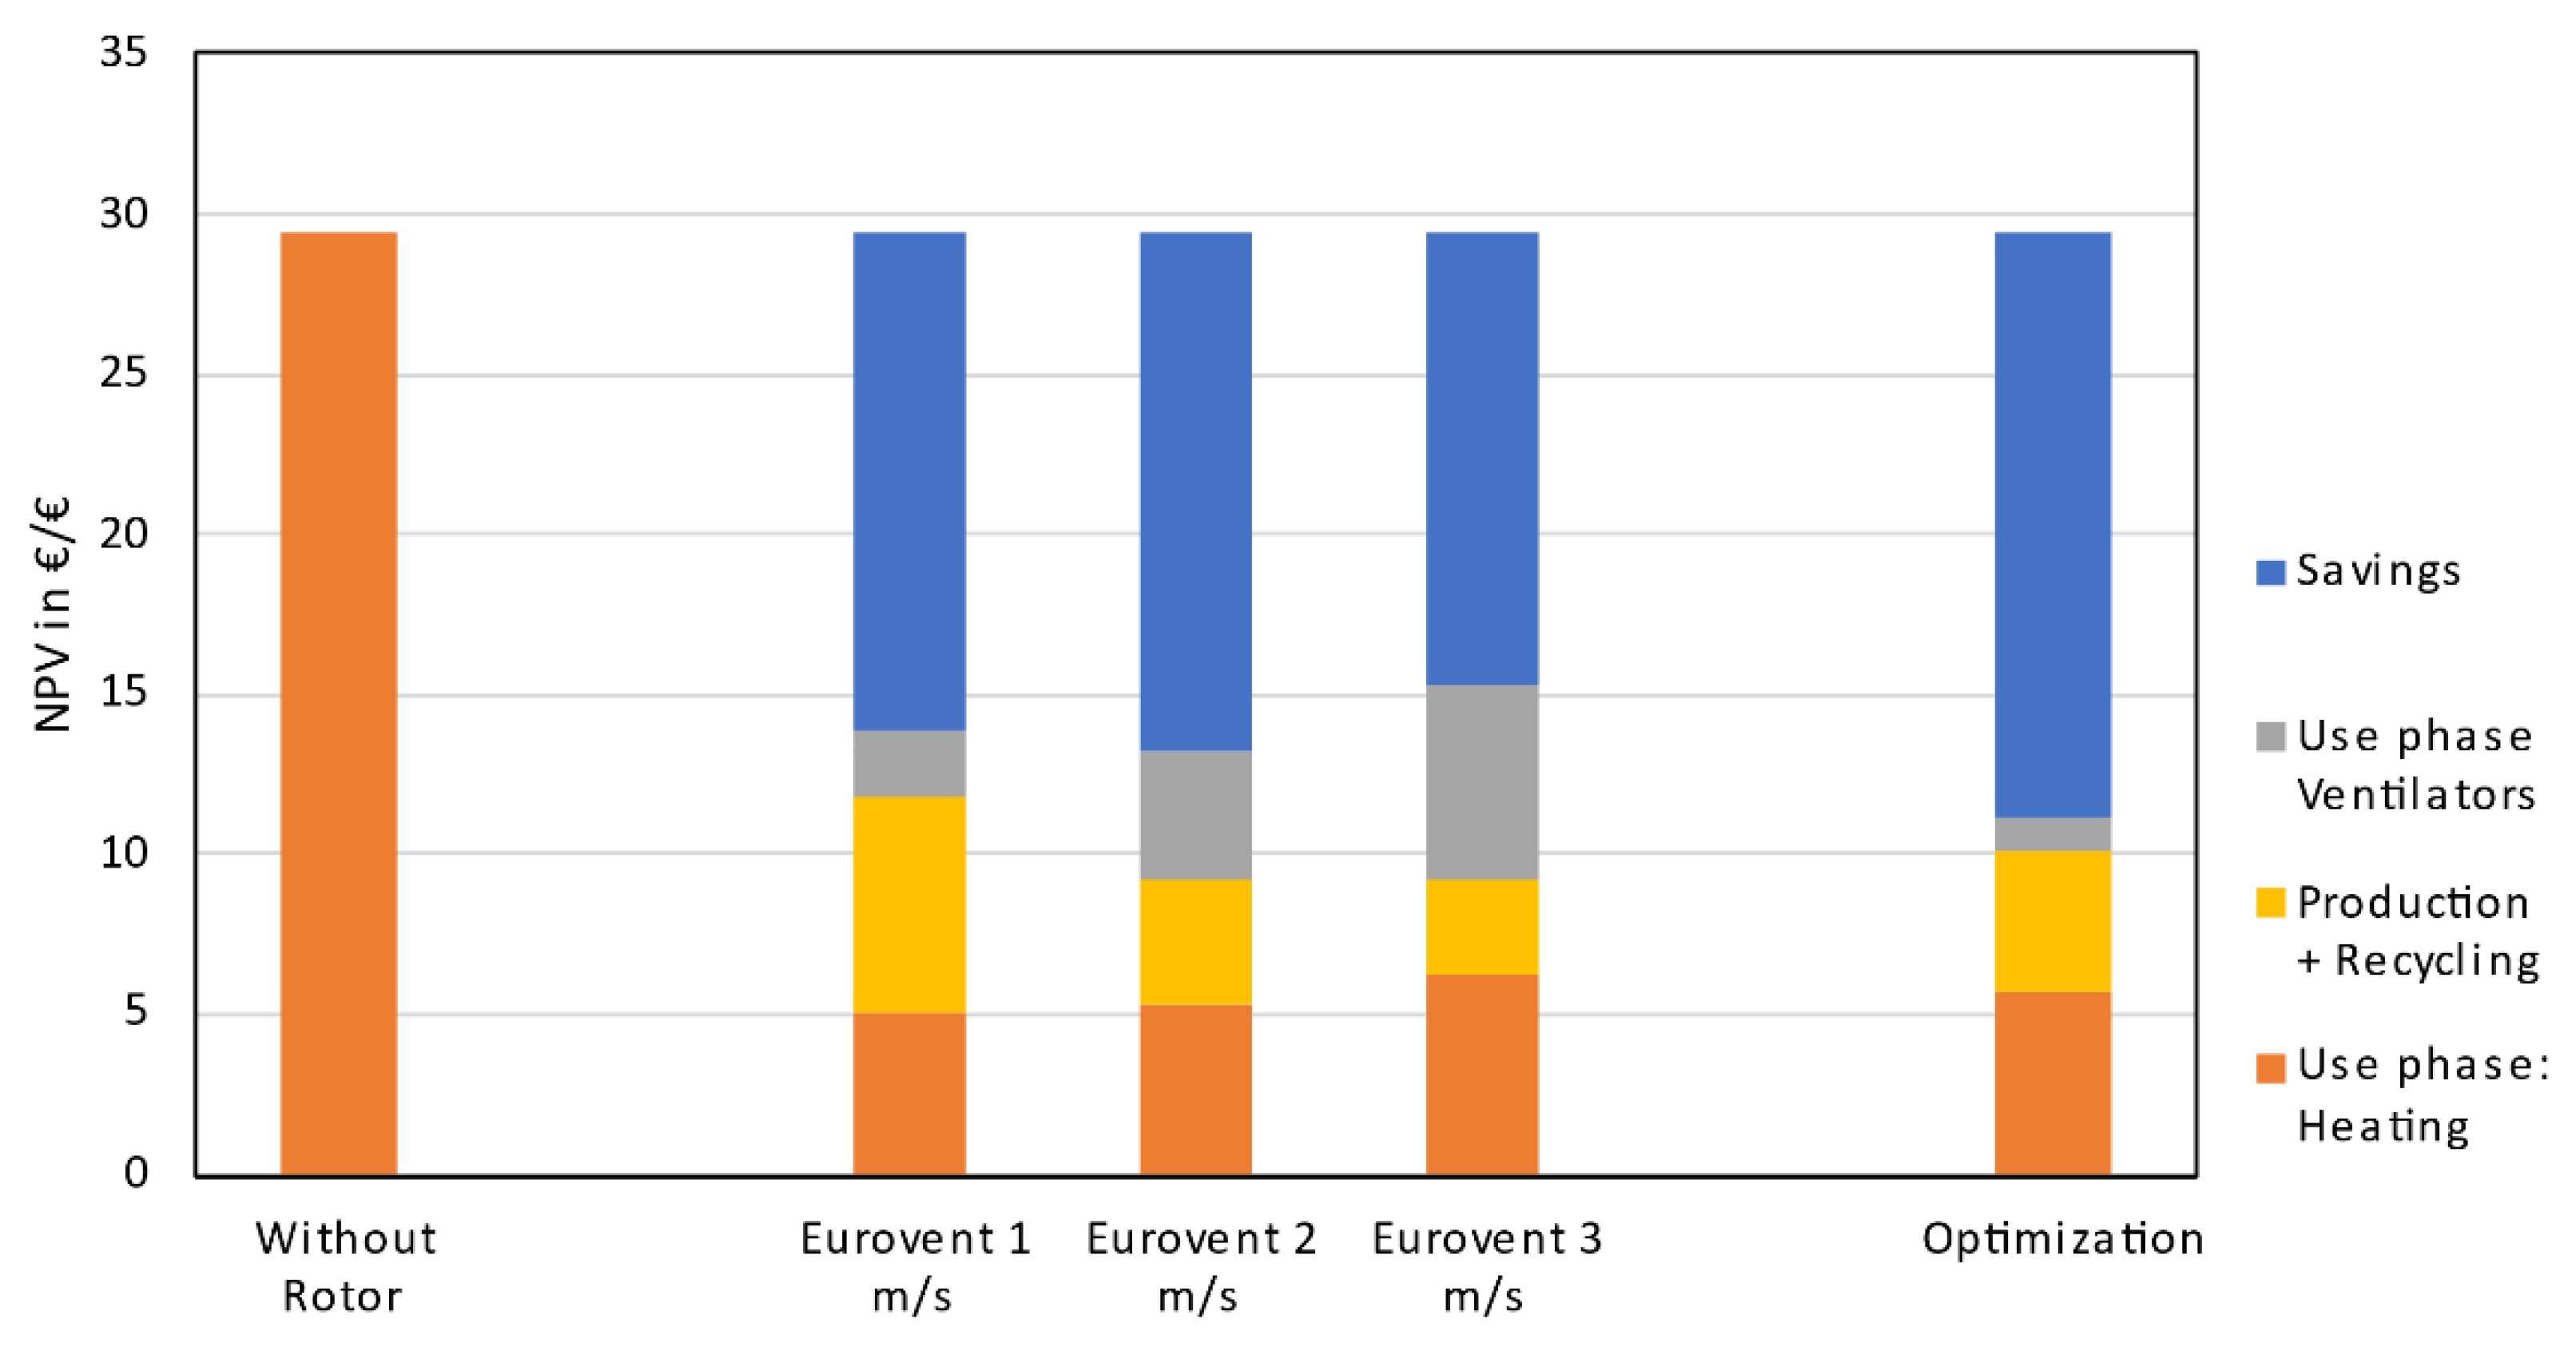
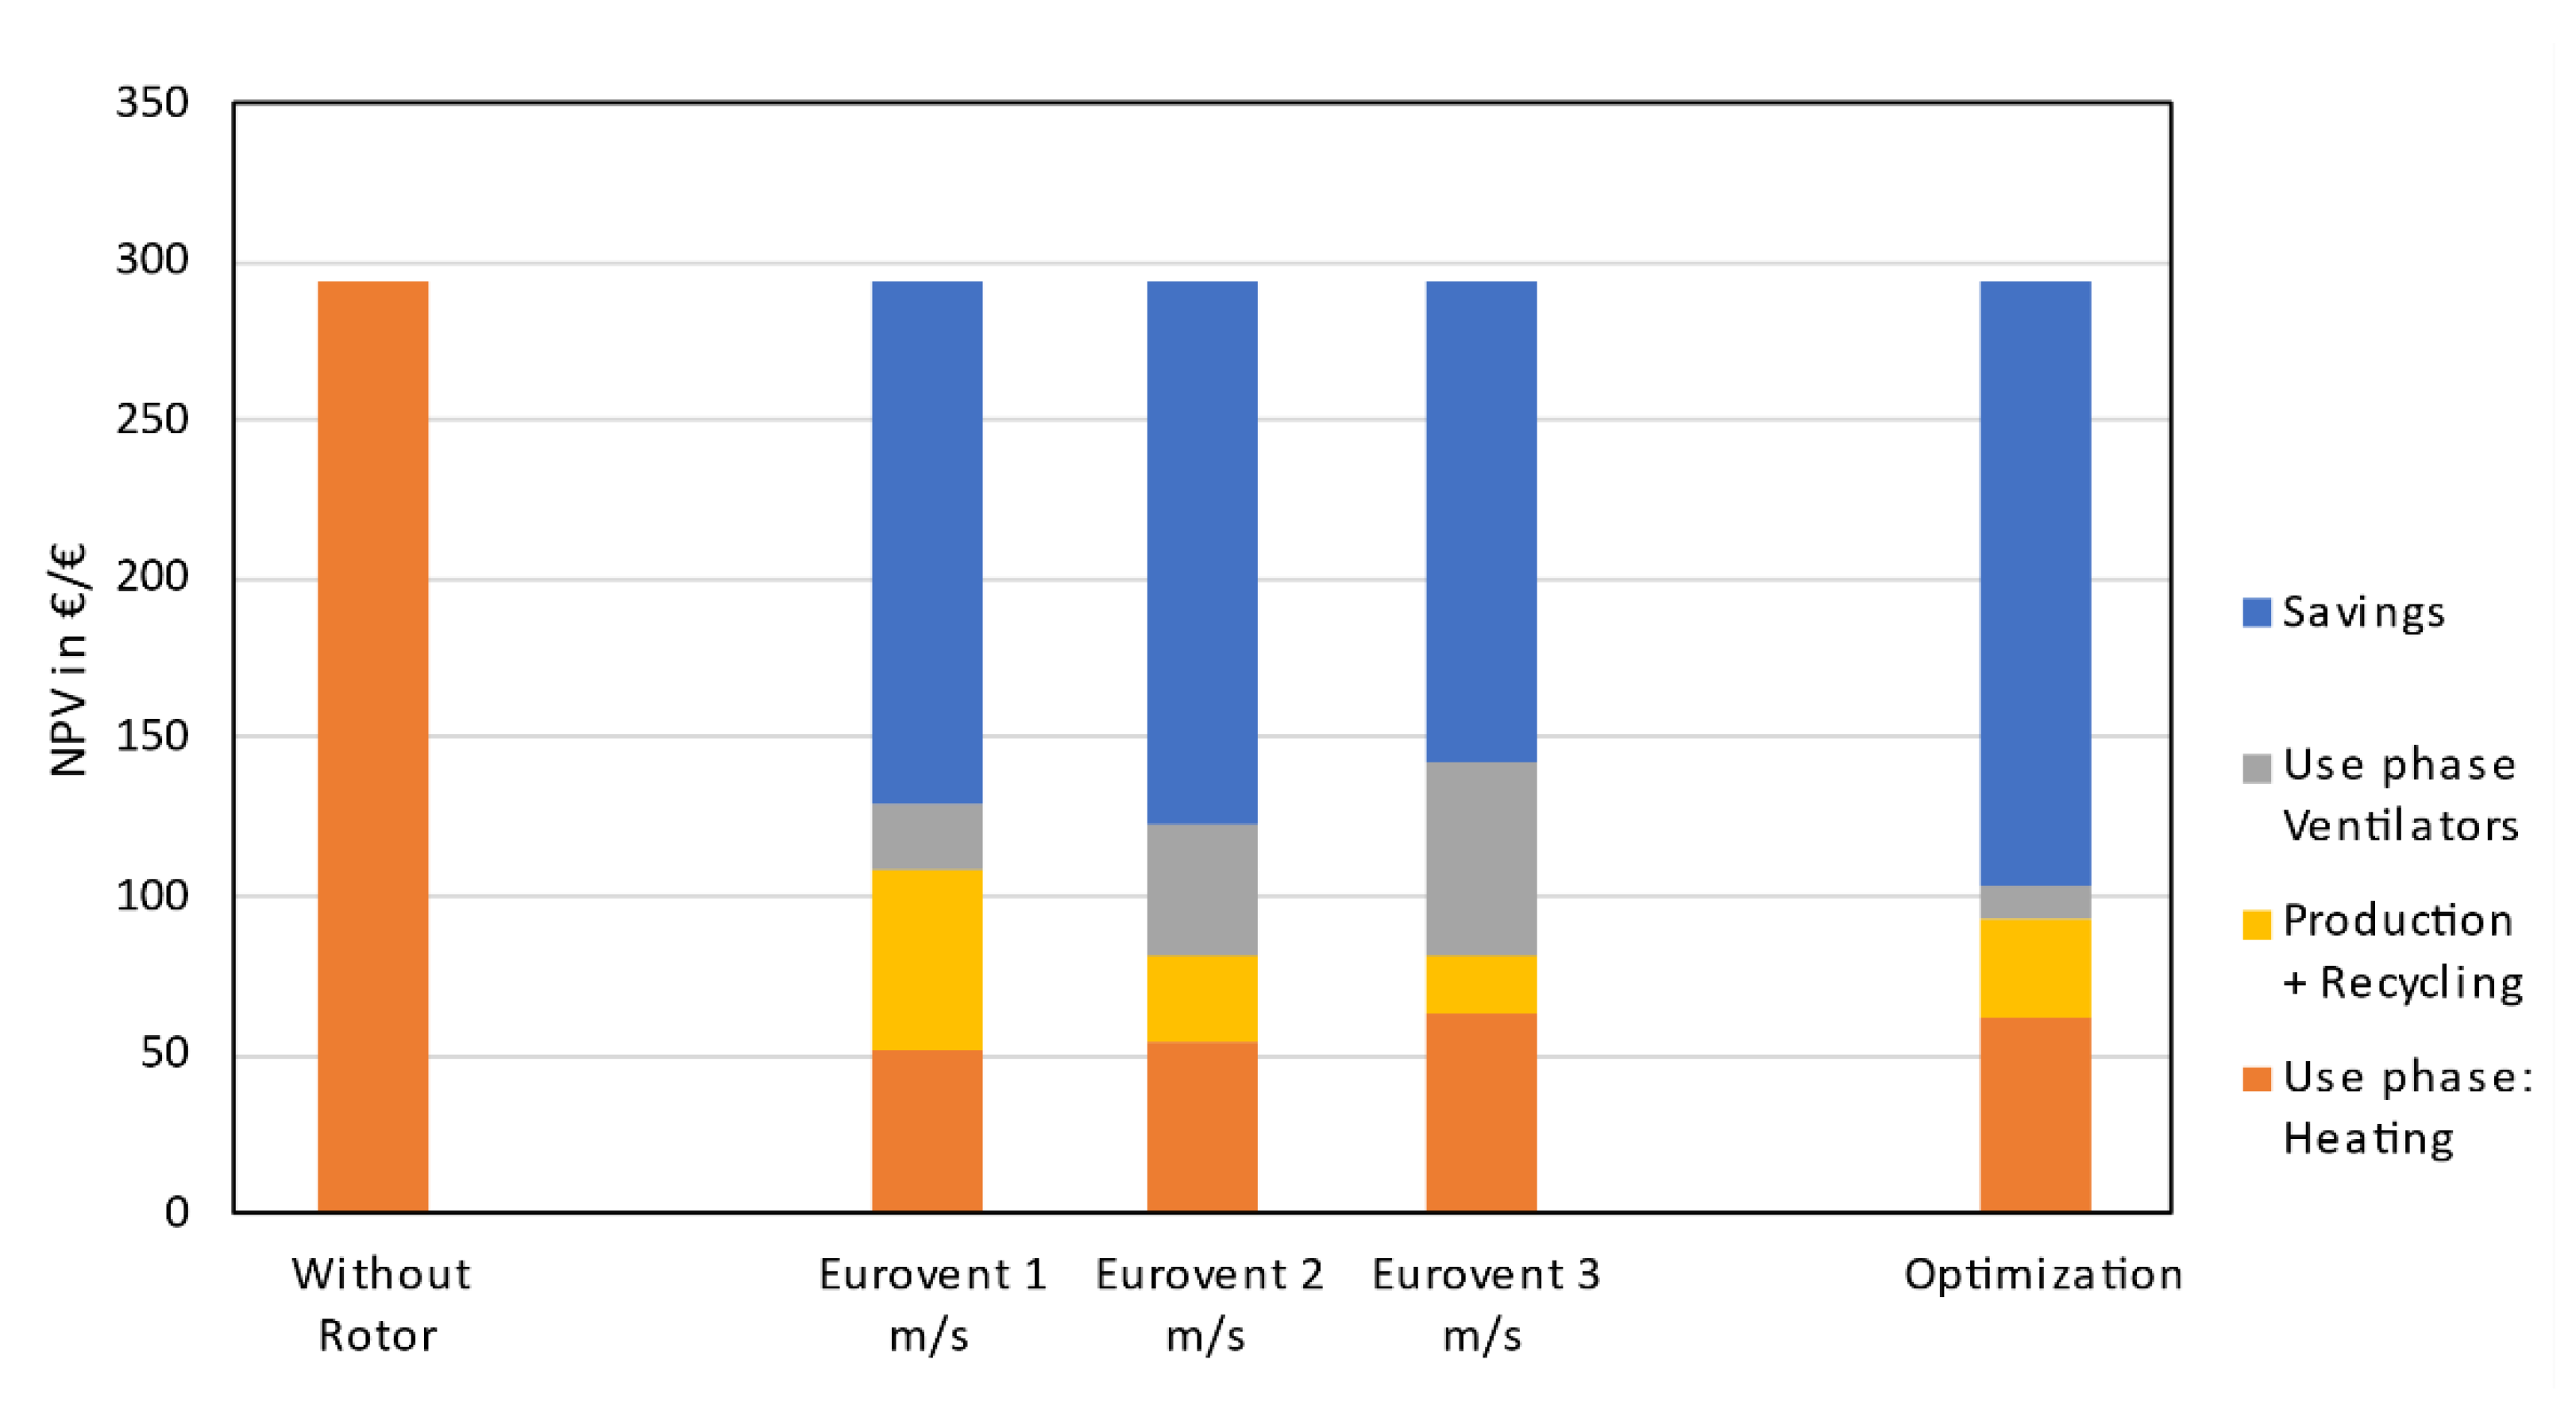
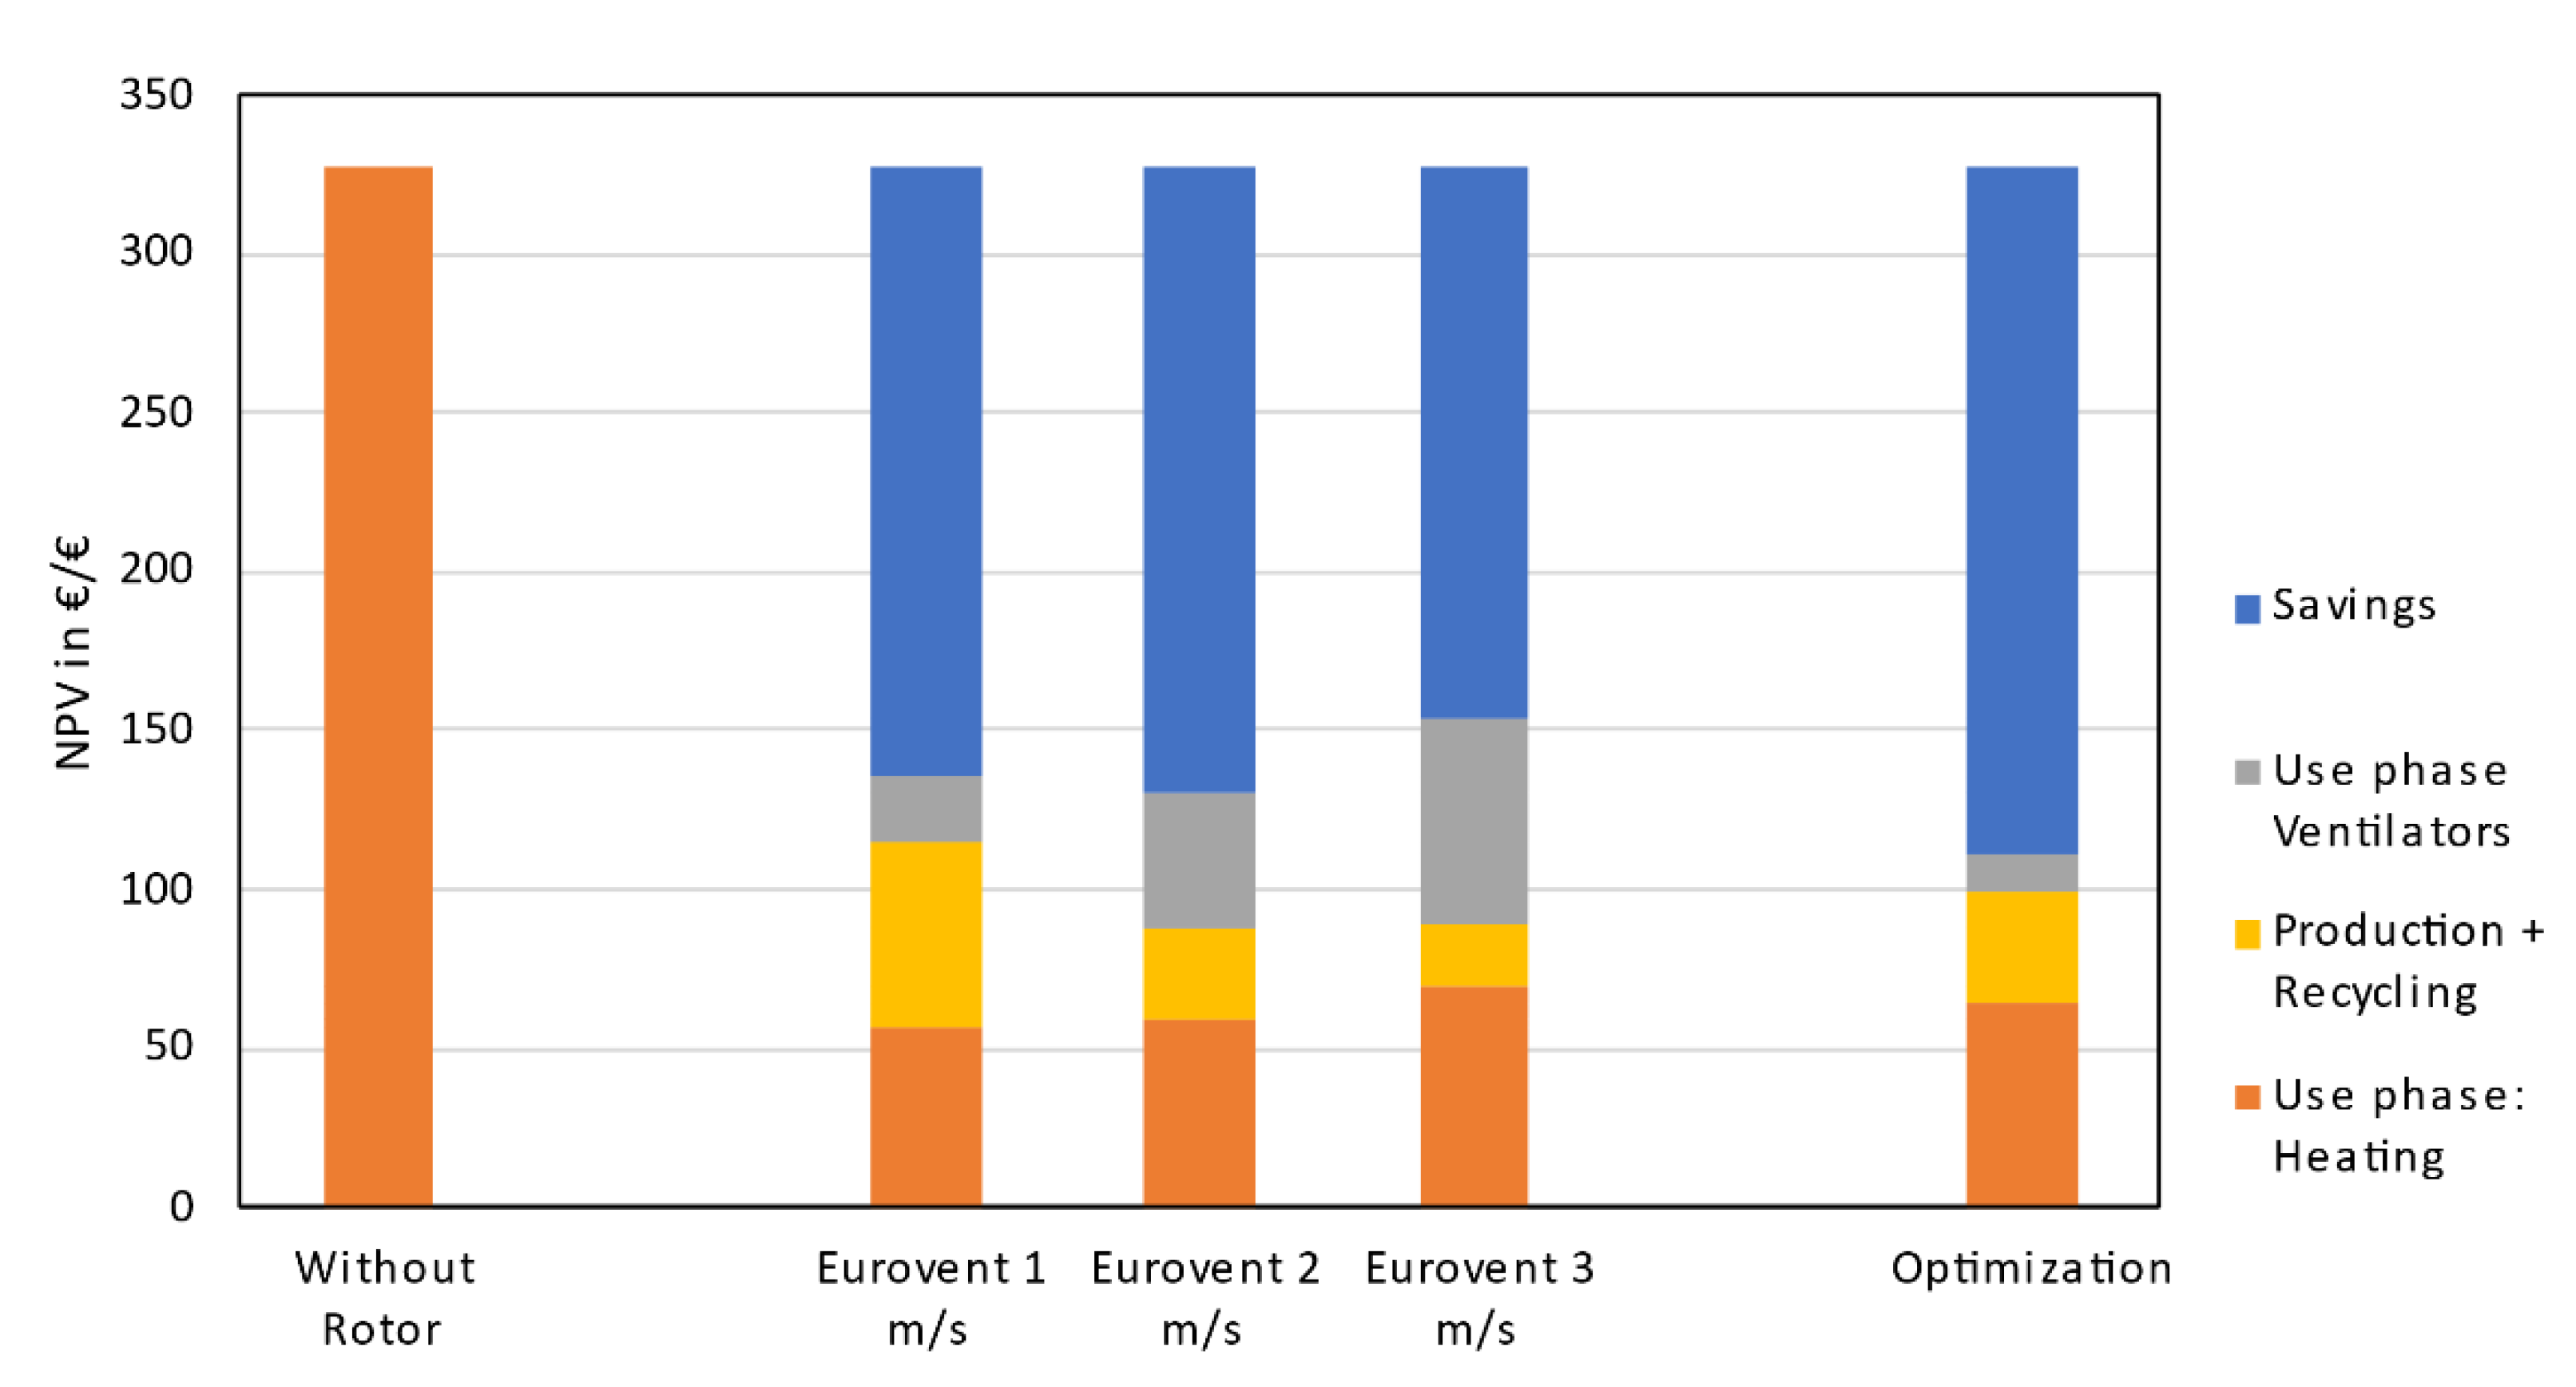
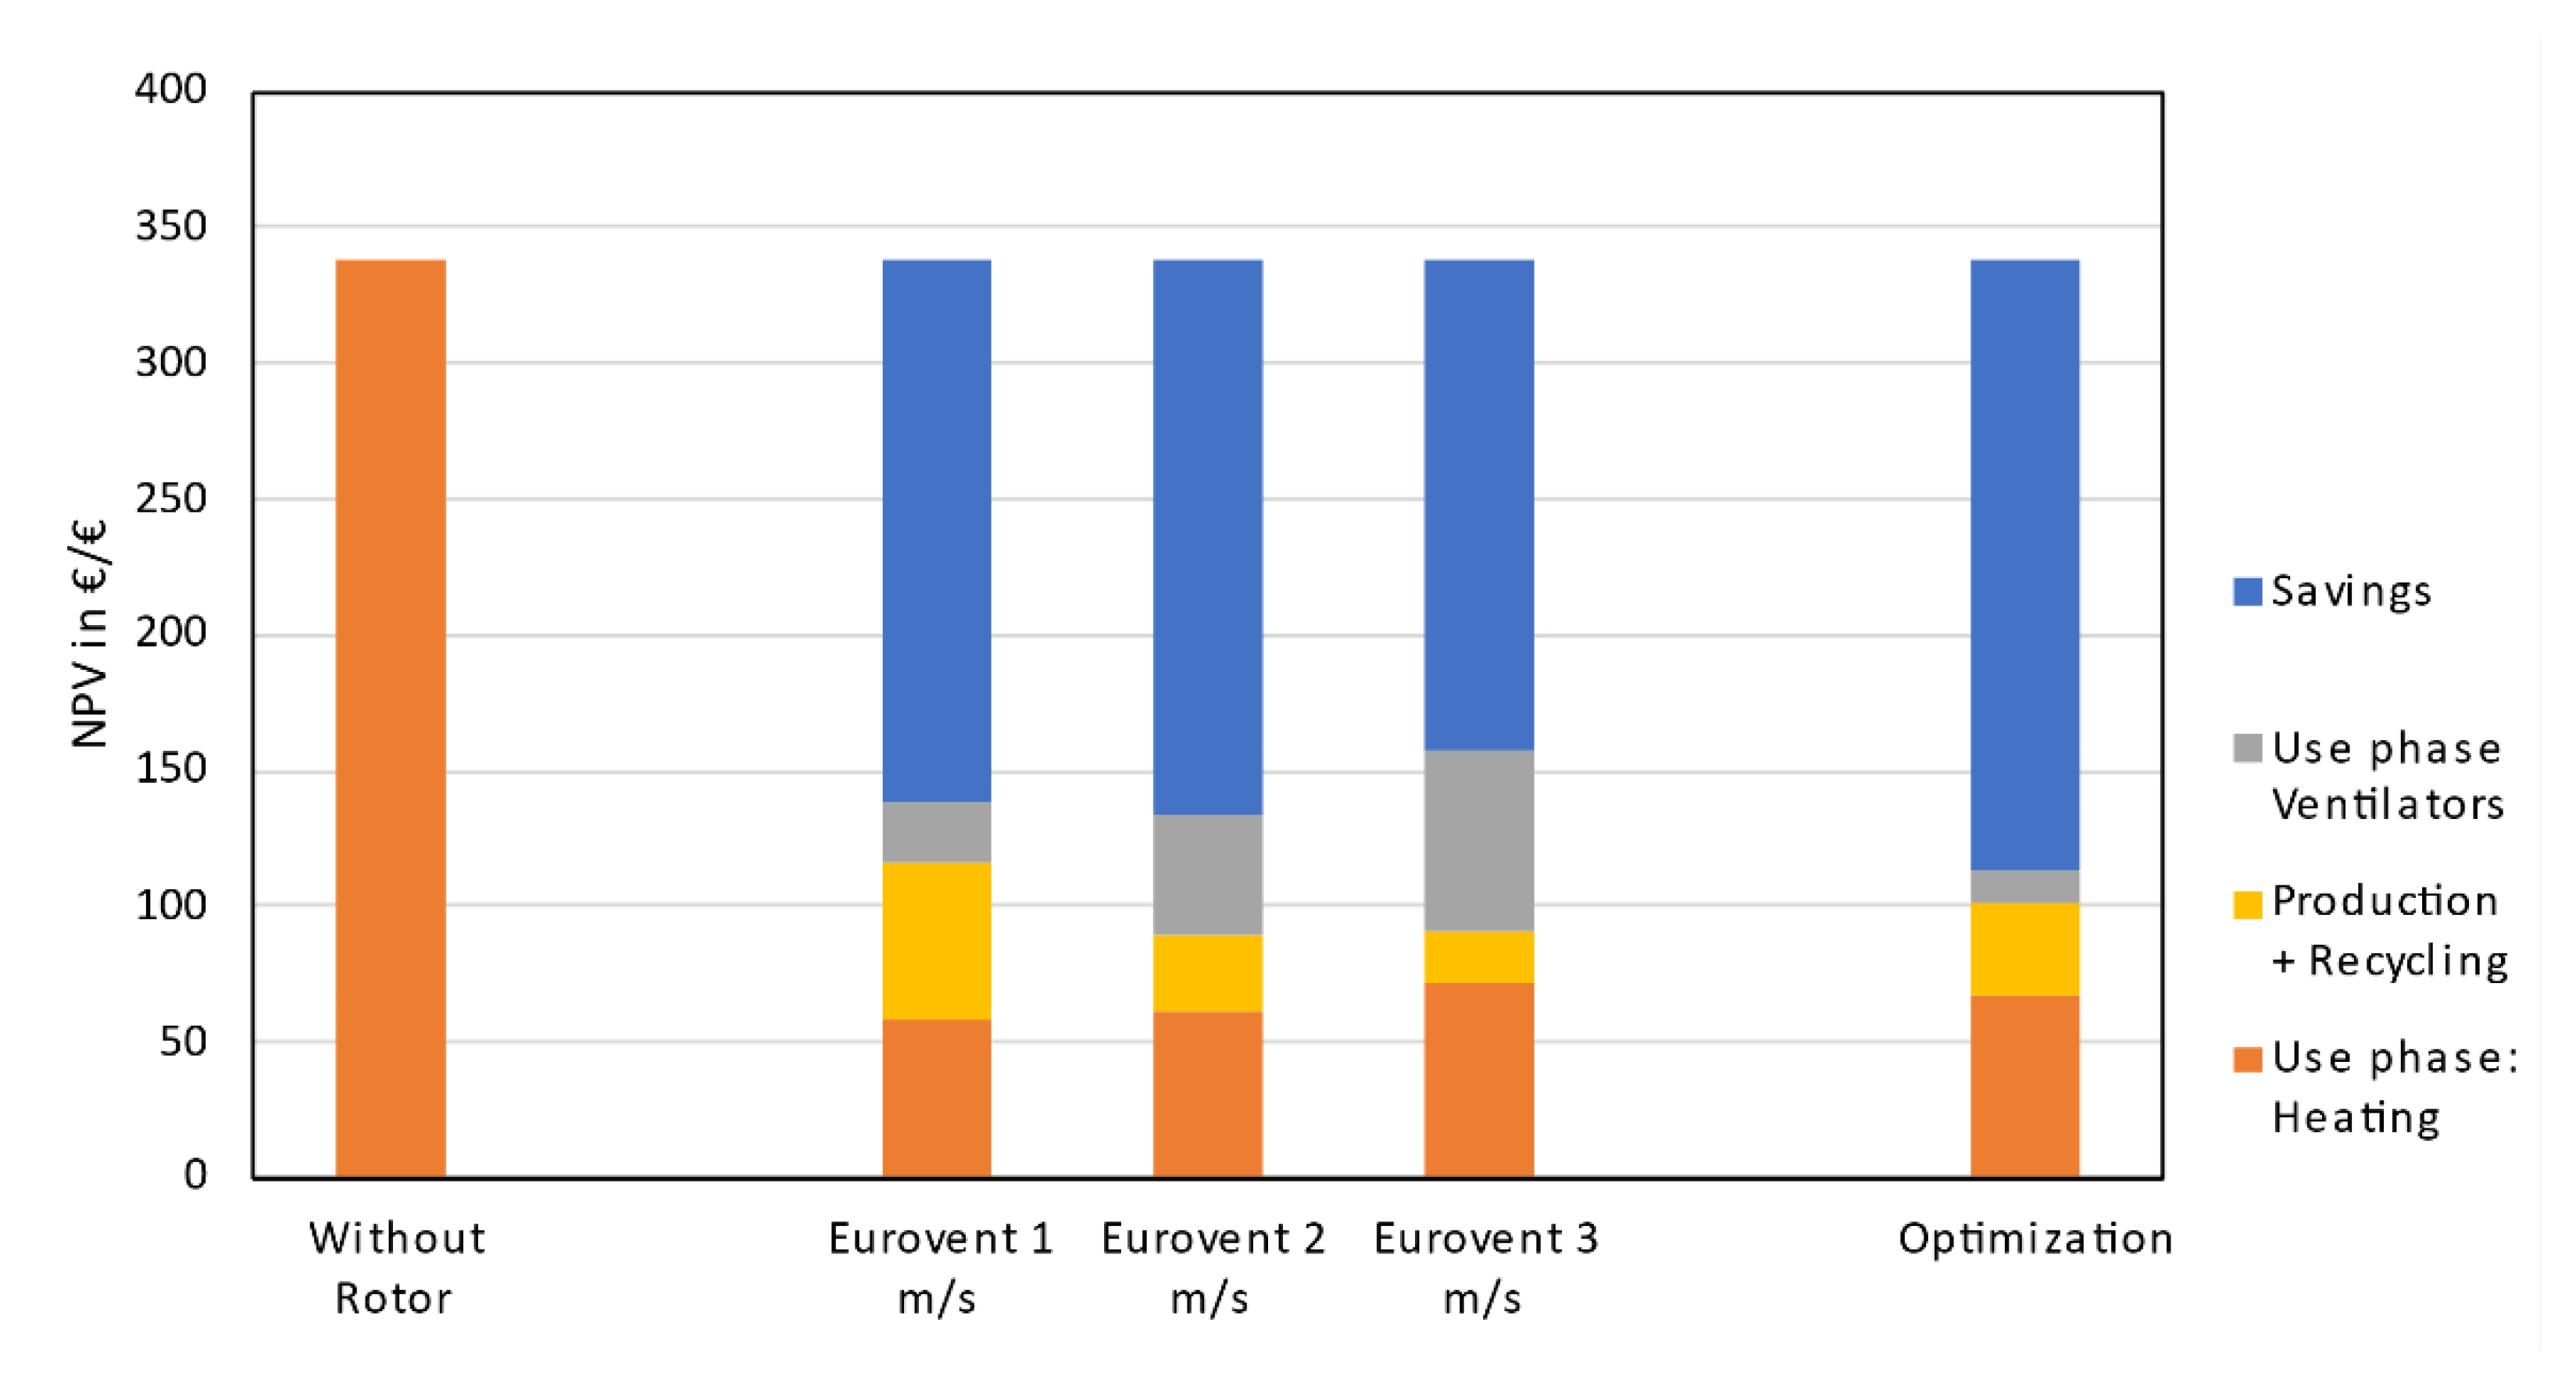
Since this Eurovent RHX is operated at three different ambient air empty tube velocities , each of these operating conditions will be included in the comparison with the optimization results. For attaining the same FU, the RHX diameter is adjusted so the product of the cross-sectional area and the velocity is constant. Therefore, lower speeds require larger diameters and likewise larger velocity requires a RHX with a smaller diameter. The decisive question here is how much better the optimized RHXs are compared to the Eurovent RHX (for the different operating conditions) in terms of NPV and GHG emissions savings in the previous optimization scenarios.
4. Discussion
This work presents optimized RHXs in
Table 5, which for customers, imply a better compromise between the investment and operation costs. However, this trade-off requires transparency on the plant manufacturer’s part because he needs to communicate the overall economic and ecologic benefits to the end customer, which is how RHX manufacturers can produce more “expensive” RHXs during the investment phase. The short-term investment cost still gets amortized with the long-term heating and electricity savings. The NPV is higher in the new optimized RHXs compared to the RHX optimized in previous works. Looking at the IRR, the value of the optimized rotors is still close to 50% for the smaller FU and above 60% for the larger FU, which represents an increase in the amortization time as compared to the 77% for the IRR optimized rotor in our previous work. However, in any case, the period of amortization is within two years. Therefore, it is important when selecting an RHX to conduct an overall assessment of operating and investment costs. This could be a communication and business challenge for the plant manufacturer. The plant manufacturer should consider all of the costs involved, i.e., the investment as well as the operation costs for their customers. In addition, based on their experience, the industrial partner suggests that the ambient air empty tube velocity
is often 3 m/s. This operating condition is economically detrimental for the end customer and has increased negative ecological impact.
This paper provides some transparency regarding the economic and environmental impact of currently used RHXs in comparison to the economically optimized RHXs. Interestingly, although many RHX configuration exist and have been certified by Eurovent, this work proves that RHXs can still be optimized under economic and environmental considerations.
One limitation of this work was to consider the GHG emissions exclusively in terms of the electricity grid mix and prices of services in Germany. Depending on the location and sources of electricity, this would result in a different optimum. For example, if electricity came from renewable sources, then it would make more sense to recover more heat and use more electricity. Then the optimum would get closer to the GHG optimum (
Table 5). These are further circumstances that could be researched. Another limitation of this work is the angle range for wave angle
. Further studies could investigate whether steeper wave angles would further increase the heat transfer and would be economically and environmentally beneficial.
By comparing the energy efficiencies of the NPV-optimized RHXs to the state-of-the-art Eurovent RHX, one can observe that the thermal efficiency is approximately 80% in both cases. In the optimization cases, thermal efficiency improved slightly. The main bottleneck in bringing better technology to this market lies not in the technical challenges, but rather in the communication and decision-making process. As long as the decision-making process is short-sighted economically, i.e., focusing merely on the investment costs, the technical improvements cannot be brought to market.
5. Conclusions
The literature of LCA-based and NPV-based optimization for RHX is nonexistent. This is an area to develop in the future that would allow a better benchmarking with other types of heat exchangers. With this research work, a part of this gap was filled within the German context and within the limitations of the simulation models. This study could be repeated for different locations, with different electricity and heat sources, and the results would be different. A further research topic would be the inclusion of a simulation model with the same accuracy but over a wider range for the inclination angle (above 60°). For this study, they were out of the scope, but definitely interesting points for further research.
The NPV optimization results provides a compromise in terms of GHG emissions savings and IRR maximization between the other two optima from previous works, (where objective functions were GHG and IRR). In terms of NPV, the optimization of this work presents greater savings than the previous works from this research group. For each scenario (depending on CO2 pricing or FU), there is an optimum presented. In terms of design and operating parameters: The ambient air empty tube velocity is not significantly sensitive to CO2 pricing or FU, the optimum was found at 1.2 m/s, which corresponds to a specific mass flow of 5.4 kg/(m2·h). Wave angle is not significantly sensitive to CO2 pricing or FU, but because the available models are limited to 60°, further research could concentrate efforts on developing Nusselt number models for sine ducts in the range between 60° and 90° to overcome this limitation. In this study, the best values were found between 58° and 60°. Wave height and RHX length are dependent on CO2 pricing and FU, but on a relatively narrow range compared to the Eurovent database. The optimal values are between 2.64 mm and 2.77 mm for wave height and between 220 mm and 236 mm for RHX length . Independently of the CO2 pricing and FU, in the complete lifetime of the product, the heating and electricity costs are greater than the investment. A lower investment on a RHX could be a more expensive system on overall for the complete lifecycle. The same applies to the GHG emissions. The main result of the optimization based on NPV is that the optimized RHX causes lower pressure drop, which significantly reduces electricity needs of the system while maintaining the thermal efficiency compared to the state-of-the-art RHX of the Eurovent database.


