Article

Research on the Optimized Operation of Hybrid Wind and Battery Energy Storage System Based on Peak-Valley Electricity Price

1
State Key Laboratory of Advanced Electromagnetic Engineering and Technology, Huazhong University of Science and Technology, Wuhan 430074, China
2
China-EU Institute for Clean and Renewable Energy, Huazhong University of Science and Technology, Wuhan 430074, China
*
Author to whom correspondence should be addressed.
Energies 2021, 14(12), 3707; https://doi.org/10.3390/en14123707
Submission received: 11 April 2021 / Revised: 5 June 2021 / Accepted: 17 June 2021 / Published: 21 June 2021

Abstract

:
The combined operation of hybrid wind power and a battery energy storage system can be used to convert cheap valley energy to expensive peak energy, thus improving the economic benefits of wind farms. Considering the peak–valley electricity price, an optimization model of the economic benefits of a combined wind–storage system was developed. A charging/discharging strategy of the battery storage system was proposed to maximize the economic benefits of the combined wind–storage system based on the forecast wind power. The maximal economic benefits were obtained based on scenario analysis, taking into account the wind-power forecast error, and costs associated with the loss of battery life, battery operation, and maintenance. Case simulation results highlight the effectiveness of the proposed model. The results show that the hybrid wind–storage system is not only able to convert cheap electricity in the valley period into expensive electricity in the peak period, thus resulting in higher economic benefits, but can also balance the deviation between actual output and plans for the wind power generator to decrease the loss penalty. The analyzed examples show that, following an increase in the deviation of the forecast wind power, the profit of the combined wind–storage system can increase by up to 45% using the charging/discharging strategy, compared with a wind farm that does not utilize energy storage. In addition, the profit of the combined wind–storage system can increase by up to 16% compared with separate systems, following an increase in the deviation penalty deviation coefficient.

1. Introduction

Due to the shortage of traditional fossil energies, and increasing concerns regarding protection of the environment and the safe use of nuclear power sources, renewable energy is receiving increased attention from all aspects of society. Wind energy, which is a form of renewable energy that is the focus of numerous countries, has significant development potential. However, the random nature and “anti-peak-adjustment” feature of wind power have negative effects on the safety and economy of power grids. These negative effects be exacerbated as the penetration rate of wind power increases.
Based on the load variation of power grid networks, electricity use within a single day can be divided into periods, such as “peak”, “flat”, and “valley”, with specific prices set for each period. This methodology is an effective means to enhance electricity resource efficiency and increase the profit of electricity companies [1].
However, due to its random nature and “reverse-peak-adjustment”, the trend of wind power is the “reverse” of that of the electricity price. Hence, it is difficult for wind farms to be profitable. Storage systems have the abilities of high speed “input/output” and flexible adjustment, and can therefore realize the temporal shift in wind power, thereby increasing the economic profit of wind farms. Research has been conducted on the combined use of wind power and storage systems. Ref. [2] describes an optimal multi-use operation strategy for a wind farm with a battery energy storage system (BESS). Considering intraday energy market prices and imbalances, mixed integer linear programming was used to identify the technically and economically optimal operation of a wind farm storage system. Ref. [3] analyzed the fluctuation of real-time wind power output to obtain the economic maximum charging/discharging power of a BESS in every scheduling period, based on quantization index (QI) clustering, aiming to minimize the deviation between the generation scheduling plan and the actual integrated power of a combined generation system. Ref. [4] presented a multi-stage stochastic programming model to identify the optimal operation of a wind power plant with a BESS in the day-ahead, intraday, and secondary reserve markets while taking into account uncertainty in wind power generation and clearing prices. Ref. [5] presented a multi-use application of a BESS in a wind farm to increase profit by shifting energy over time and tracking the time-of-use electricity price. The self-consumption of the BESS is not addressed.
An optimal control strategy is necessary to implement the developed operation strategies so that the BESS charge/discharge responds to wind output to obtain the desired operation of the co-work system, while considering the operational constraints of the BESS. The authors of [6] presented different control strategies for the use of a BESS in wind farms. In [7], a variable-interval reference signal optimal approach and a fuzzy control-based charging/discharging scheme were presented to smooth wind power. In [8], the dual control of two-stage BESS charging/discharging was presented that ensures constant power flow to the grid within the allowable upper and lower bands. The influence on the lifespan or economics of the system was not addressed. The authors of [9] presented a control strategy for battery switching in the operation of two BESS modules that interchange between charging and discharging modes.
In the optimization of the operation of wind farm storage systems, the above citations do not take into account the incentive effect of the peak–valley price on wind power producers. Under the guidance of the price signal, wind power producers can make full use of the advantages of battery technology to transfer their energy. Furthermore, the studies noted above do not present specific battery energy storage operation strategies according to the electricity prices of different periods.
Due to the low accuracy of current wind power forecasting methods, the deviation in forecasts cannot be reduced to within a negligible range. Therefore, it is not practical to use the wind power forecast value as the actual value to optimize the operation of the electricity market. A significant deviation in the actual wind farm output from the day-ahead plan will have negative consequences for the market. The BESS has flexible charge/discharge capacity, which can be used to coordinate the wind power output, thereby reducing the loss caused by any deviation from the wind power plan, and increasing the economic benefits of the combined generation system. Therefore, studying the problem of wind farm storage system optimization, while considering the prediction deviation of wind power output, has research significance.
This study developed a systematic optimized model of a wind–storage co-work system and, using a simulation experiment, verified the increase in wind farm profit via the use of storage batteries. The current research was based on the predicted value of wind power, and the deviation in this prediction, for the calculation of the next-day valley electricity price and the working curve of the storage batteries, considering the costs of BESS consumption. The aim was to increase the wind farm profit and lower the deviation between the actual and planned wind power.

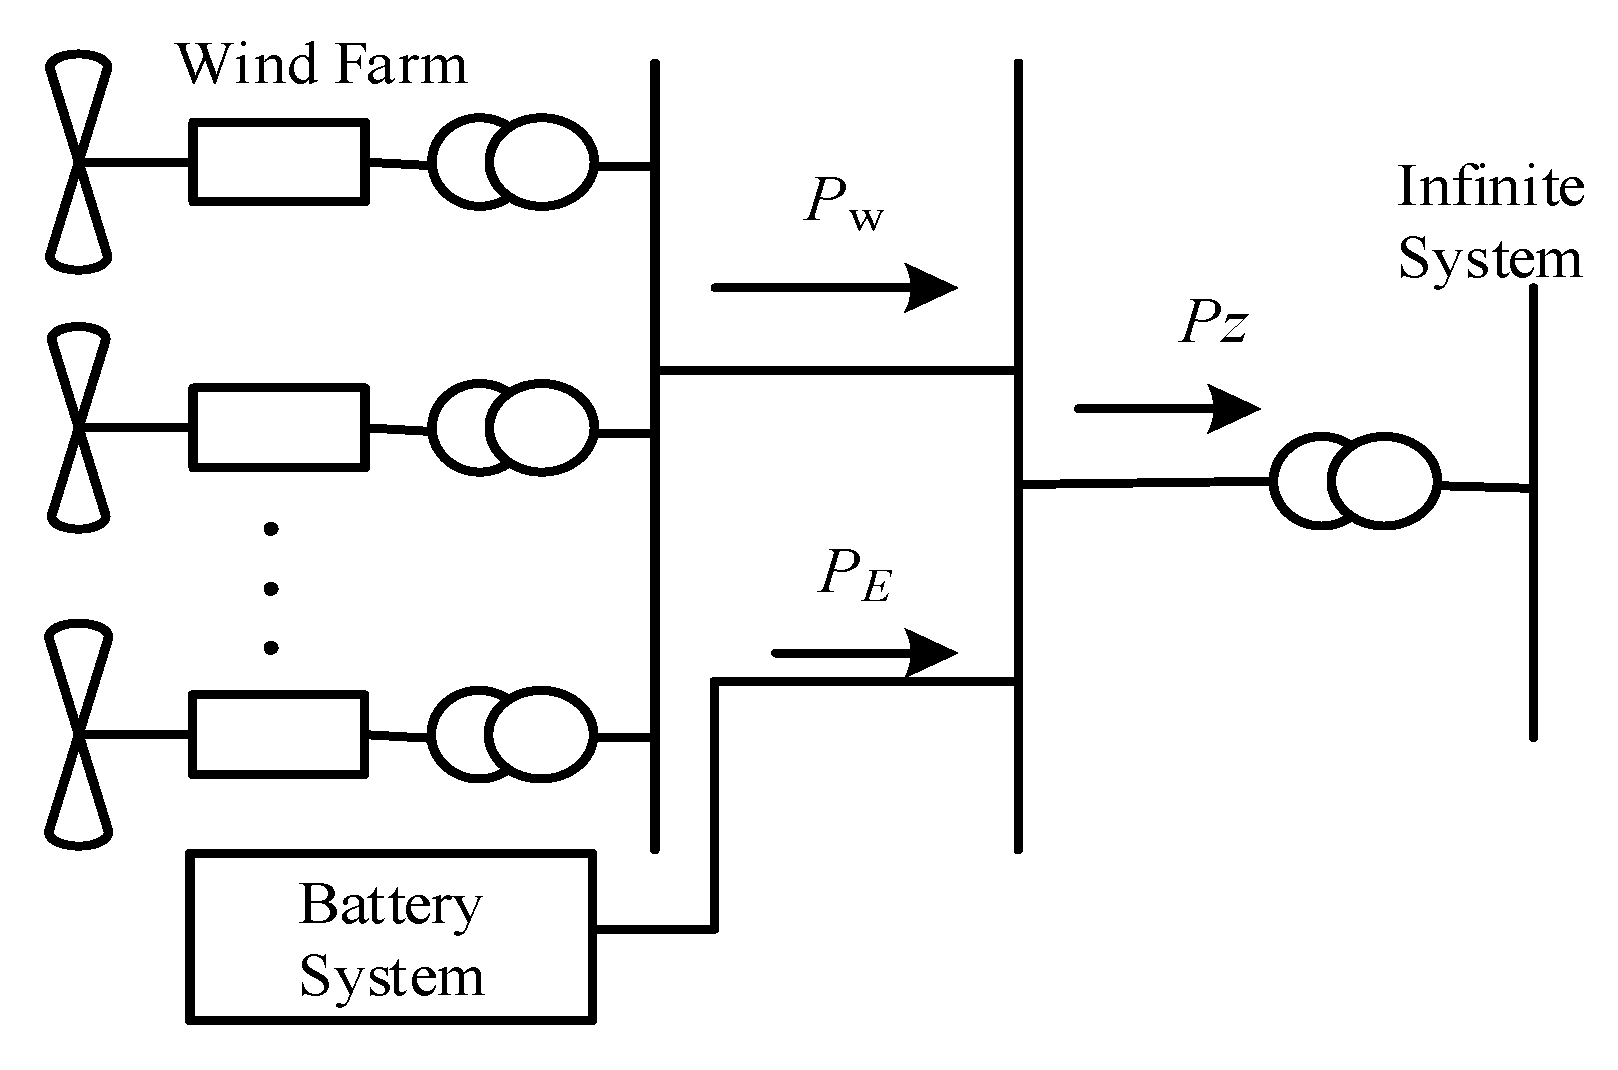
2. The Structure of Wind-Storage Co-Work System

The battery storage system is located at the position of the exit grid-connection mother cable of the wind farm. The wind–batteries co-work system is operated via a battery charge/discharge strategy that is consistent with the working operation of the wind farm. This structure is shown in Figure 1.
The current work plan of the wind farm is an optimized plan that considers the next-day electricity price curve and the battery self-constraint condition. To maximize economic profit, based on the concept of energy transport, the main working modes of the wind farm and battery storage system are described as follows:
(a)
Wind farm power output mode: At the peak of the electricity price, the wind farm derives profit by outputting electricity to the macro-power grid; at the valley of the electricity price, the wind farm outputs electricity to the storage batteries, with the aim of selling the stored electricity when the price returns to its peak value.
(b)
Storage battery system work mode: At the valley of the electricity price, electricity is received from the wind farm, which is charging the storage system; at the peak of the electricity price, the batteries are discharged, resulting in a profit.
The mathematic description of the wind–storage system is:
{ P Z = P W + P E P e a k   P e r i o d P Z = P W V a l l e y   P e r i o d

2.1. Wind Power Output Model Based on Probability Theory

Due to the large number of wind turbines in the wind farm, and their distribution within a large area, based on the central limitation theory, it can be assumed that the prediction error of the wind farm’s output obeys the standard normal distribution, with an average of zero and SD of σ W [10,11].
Research on the prediction of wind power output shows that there is a linear relationship between the standard deviation of the wind power output prediction and the output prediction data [12,13], for which the mathematical description is:
σ w ( t ) = k w p ˜ w ( t ) + k 0
where σ w ( t ) is the standard deviation of the wind power prediction deviation in time slot t; p ˜ w ( t ) is the prediction value of wind power output in time slot t; k w , k 0 are the coefficients of wind power output prediction.
Wind power has a strong random deviation, and its prediction error may be large. In the optimization of a large-scale power grid, the classic technology scenario is usually adopted to describe this random procedure [14,15].
According to the theory of probability and mathematical statistics, the probability of a prediction deviating within a range of ±3σ is 99.75%. Figure 2 shows the wind power output prediction deviation and the discretization curve in this range. The x-axis is divided into seven equivalent intervals with zero as the center, and the width of each interval is σ (standard deviation). Each interval represents a discretized random variable σw(t), w = −3, −2, …, 3, after dividing the probability distribution into the related intervals. For each interval w, the corresponding probability of the wind power output is Pj. Figure 2 shows the prediction deviation and discretization curve of the wind power output within this range. The output of the wind farm in period t is:
p w ( t ) = p ˜ w ( t ) + σ w ( t )
where σ w ( t ) is the wind power output prediction deviation.
Derivation of the scenario probability for the wind power output model can accurately reflect the wind power output in each time slot.

2.2. Storage Battery System Model

The storage battery system has the characteristics of charge status, charge/discharge power, and efficiency. The charge/discharge power and charge status of the storage battery system must remain within in a certain range while the system is operating. Over-charging or over-discharging will result in damage to the battery system. The battery system is a status-memory system, in which the status at time t has a close relationship with the status at time t − 1. The output model of the battery system is shown as [16,17]:
p E ( t ) = { η d Δ S O C ( t ) Δ t Δ S O C ( t ) < 0 Δ S O C ( t ) η c Δ t Δ S O C ( t ) > 0
S O C ( t ) = S O C ( t 1 ) + Δ S O C ( t )
S O C min S O C ( t ) S O C max
Δ S O C min Δ S O C ( t ) Δ S O C max
where S O C ( t ) is the charge status in time slot t; Δ S O C ( t ) is the deviation of charge status in time slot t; Δ S O C ( t ) < 0 means it is discharging in time slot t; Δ S O C ( t ) > 0 means it is charging in time slot t; S O C min is the minimum charge status; S O C max is the maximum charge status; p E is the battery system charge/discharge power; Δ t is the time interval; η c and η d are the efficiency of charging/discharging of the battery system, respectively, where the efficiency of one cycle is η s = η c η d .
Equation (4) shows the relationship between the battery system’s charge/discharge power and the battery charge status. Equation (5) shows the relationship between the charge status at time t and that at t − 1. Equations (6) and (7) show the boundary limitation of the battery charge status and the charge status deviation at any time.
Because the charge status S O C ( t ) of the battery system in time slot t is equal to the accumulation of all previous charges and discharges, and the charge/discharge power of the battery system at time t is not only affected by the deviation in charge status, but also the charge status at the previous time, S O C ( t 1 ) , the charge status at each time will affect the working strategy of the battery system at the following time [18,19,20].
In conclusion, the working strategy of the battery system at each time is not only dependent on the on-grid electricity price, but also the current charge status. Consequently, the charge/discharge power, charge status, and efficiency of the battery system will have a large effect on the working statue of the wind farm, and on the wind farm’s profit.

3. Wind–Storage Battery Co-Work Optimized Model

3.1. Objective Function

Given the valley electricity price, the aim is to optimize the wind–battery system by temporally shifting the wind power output using the battery system, and thus maximize economic profit. In addition, the battery system is able to quickly respond to deviations in the wind power output, and thus reduce the cost associated with this deviation. This can be expressed mathematically as:
max F = t [ F p l a n ( t ) F p u n i s h ( t ) ] c c s c o m
where F is the total economic profit of the co-work system; F p l a n is the planned output profit of the co-work system; F p u n i s h is the punishment resulting from the deviation of the co-work system output; c c s is the daily battery life loss cost; and c o m is the daily battery operation and maintenance cost.
The wind farm predicts the output of the following day and, in conjunction with the battery system, implements the output plan for the following day, to maximize economic profit. The battery system balances the real and planned electricity output to avoid the risk arising from an error in output prediction.

3.2. The Output Profit of Co-Work

Based on the output prediction, the electricity price at all times, and the battery system capacity, the wind farm owner provides the output plan for the following day to the power grid center. The economic profit of the wind–battery co-work system is:
F p l a n ( t ) = π ( t ) ( p ˜ w ( t ) + p E ( t ) ) Δ t
where F p l a n ( t ) is the planned economic profit of the whole system at time t; π ( t ) is the electricity price at time t; p ˜ w ( t ) is the wind power output prediction value at time t; p E ( t ) is the battery system power at time t.

3.3. Punishment for Output Plan Deviation

Due to the limitations of wind power prediction, in some cases the actual output power is not consistent with the predicted power. In this case, the battery system has to respond quickly to “input/digest” this unbalanced capacity:
p d e v ( t ) = | p w ( t ) + p E b e l ( t ) p ˜ w ( t ) |
where p d e v ( t ) is the deviation of the wind–battery system output from the wind prediction output at time t; L R p E b e l ( t ) is the charge/discharge power of the battery system to balance the deviation of the wind power prediction at time t.
However, due to the limitations of the battery system, it is a challenge to balance all of the deviation, and this unbalanced part increases the difficulty of central control of the market. Thus, it is necessary to punish the wind farm owner, which is expressed as follows:
F p u n i s h ( t ) = ω π ( t ) p d e v ( t ) Δ t
where F p u n i s h ( t ) is the punishment for deviation; ω is the coefficient of output deviation; π ( t ) is the on-grid price at time t.

3.4. The Cost of Battery Life Loss and O&M

Because the operating environment of the battery is complex, the battery often works under non-rated conditions, and undergoes a series of irregular charging and discharging processes.
Experimental results show that the lifetime of the battery is closely related to the depth of discharge (DOD), the rate of charge and discharge, the number of cycles, etc. The National Renewable Energy Laboratory of the United States proposed a battery cumulative damage life model based on the analysis of experimental data. This model indicates that each discharge process of the battery will cause an irreversible reduction of the battery life until the end of the battery life [21,22,23]. Under rated conditions, the total discharge electricity of a battery during the whole life cycle, called the total effective discharge electricity ( Γ R ), is expressed as:
Γ R = L R D R C R
where L R is the rated cycle life of the battery; D R is the rated discharge depth (DOD); C R is the rated capacity of the battery.
The relationship between the actual battery cycle life and the DOD can be obtained by fitting data from many experiments. Figure 3 shows the cycle life curve of a lithium-ion battery; the function used to describe this relationship is:
L A = a × D b × e c D
where L A is the actual battery cycle life; D is the actual discharge depth; a , b , c are the fitting coefficients.
The irregular discharge process of the battery under each non-rated condition can be equivalent to the consumption of the total effective discharge electricity of the battery ( Γ R ). Thus, considering the influence of DOD and the discharge rate, the cost of battery life loss, c i l o s s , in the discharge process i can be obtained as:
c i l o s s = L R P R d i L A P i d i s Γ R c c a p
where P R is the rated power; d i is the actual discharge electricity in the irregular discharge process i under the non-rated condition; P i d i s is the actual discharge power in the irregular discharge process i ; c c a p is the initial investment cost of the battery.
The cost of battery life loss is expressed as:
c c s = i c i l o s s
where i = 1 , 2 , 3 , , n  represents the discharge process  in a day.
The cost of battery operation and maintenance is expressed as:
c o m = t P t o u t ε o m Δ t
where P t o u t is the operating power of the battery in period t ; ε o m is the unit O&M cost (USD/Kw); Δ t is the unit scheduling time.

4. Battery System Working Strategy

4.1. Peak–Valley Electricity Price Division

The current division into peak–valley periods in an electrical system is based on a single day, and is dependent on the daily load curve. Electricity consumption in China shows that, during the peak period, electricity has a high price; conversely, during the valley period, electricity has a low price; finally, the electricity price is in a middle band during the normal load period. Taking a day in spring as an example, detailed price information is shown in Table 1.

4.2. Battery Storage System Working Strategy

Generally, to maximize profit, the battery should be charged during the valley period, and discharged during the peak period. However, the charge status and power constraint condition limit the shift function of the working period. Based on a single day, the schematic of the wind–battery co-work system is as follows:
(1)
The predicted daily wind power output p ˜ w(t);
(2)
Ensure the peak periods in a day 1, 2, …m, …, M, and reverse mark the valley periods based on peak period nodes n1j1, n1j2, …; nmj1, nmj2 …; nMj1, nMj2 …;
(3)
For node m, if there is a valley period nmj1 (m = 1, 2, … M), during this period, the battery system will only be charged, unless it is fully charged SOCnj1′ = SOCmax;
(4)
If there is no valley period nmj1, in the middle price period, the wind power output will charge the battery system;
(5)
If in periods nmjq (q = 1, 2, …) the battery system is fully charged, but in period m it is not fully discharged SOCm’ > SOCmin, the residue energy SOCm’ will be accumulated into the m + 1 period;
(6)
In the peak period, the battery system will only discharge, unless it is fully discharged, SOCm’ = SOCmin;
(7)
In the remaining non-peak periods, the battery system can be charged in valley periods, and discharged in middle periods;
(8)
Calculate the planned output from the co-work wind-battery system in all time periods pl(t) = pw(t) + pE(t);
(9)
Calculate the wind power prediction standard error σw(t) and the probability that a different prediction error occurs, αk;
(10)
According to different scenarios, calculate the difference pdev(t) between the output of the wind–battery co-work system pz(t) and the planned output pl(t);
(11)
Based on Equations (7)–(9), calculate the planned profit Fplan and unbalanced punishment Fpunish;
(12)
Obtain the daily optimal economic profit of the wind–battery co-work system.

5. Example Analysis

This paper uses a 10 MW wind farm as an example to illustrate the optimization calculation. The cycle life coefficients of the lithium-ion battery are a = 694, b = 1.98, c = 0.016. The parameters of the wind–battery co-work system are listed as Table 2.
As shown in Table 2, the maximum charging/discharging power of the battery system is 6 MW, the capacity constraint is 0~36 MWh, the charge status is 0~1, the initial charge status is 0.5, and the one-time charging/discharging cycle efficiency is 0.859.
Figure 4 shows the predicted value of the wind power output for a day in spring. The figure shows a strong and irregular variation in output power. This indicates that the wind power output is not consistent with the on-grid electricity price.
Because the fluctuation of the peak–valley electricity price and wind power output are affected by the season, we used one day from each of the four seasons of the year as an example; these four days represent four different scenarios according to the corresponding season. By combining the prediction and on-grid price, a wind–battery co-work system output curve can be drawn, as shown in Figure 5a–d. Figure 5 shows that, during the valley period, the output of the co-work system in all four scenarios decreases compared with the pure wind farm output; during the peak period, the co-work system output increases compared with the pure wind farm output; during the middle period, the output of the two systems is mostly consistent— the output of the co-work system only decreases compared with that of the pure wind farm in the spring and winter scenarios. The economic benefits of each scenario are shown in Table 3. Table 3 shows that, in all scenarios, the benefits of the co-work system increase by about 10%~11% compared with the pure wind farm. The highest profit occurs in the spring scenario and, due to the small output of wind power, the profit in the winter scenario is the lowest. The battery system converts the low-price valley electricity to high-price peak electricity to obtain greater economic benefits.
The punishment coefficient is applied to reduce the deviation between the real output and the planned output. To obtain the output deviation, the system should provide a back-up capacity; the greater the output deviation, the greater the back-up capacity that is needed. Hence, the punishment coefficient is always a number bigger than 1. In this paper, it is set to 1.25.
Table 4 shows the predicted economic profit for the wind farm without the BESS working mode and the wind–battery co-work mode. The table shows that, as the forecast error increases, the profits of the wind power producer continue to decline. When the prediction error coefficients k w and k 0 are 0.1 and 0.01, respectively, the profit of the co-work system is 10% greater than that of the wind farm running alone. When the wind prediction coefficients k w and k 0 are 0.2 and 0.02, respectively, a profit increase of 14% is achieved. Next, when the wind prediction coefficients k w and k 0 are 0.5 and 0.05, respectively, a profit increase of 45% is achieved; this indicates that the percentage improvement increases with the increase in prediction error. The profit is clearly enhanced via the use of the battery system, and the greater the prediction deviation, the greater the increase in profit that can be obtained using the co-work system. This indicates the battery system plays an important role in decreasing the output deviation.
Table 5 shows the economic profit arising from different values of the coefficient of deviation for the wind farm without the BESS working mode and the wind–battery co-work mode, when k w = 0.1 and k 0 = 0.01. The table shows that, when the coefficient of deviation ω is 0.5, although profits continue to decline, the profit of the co-work system is 5% greater than that of the wind farm alone. When the ω is 0.75, a profit increase of 7% is achieved, which is a greater increment than that of the previous scenario. When ω is 1.00, a profit increase of 9% is achieved. Finally, when ω is 2.00, the increase in profit is 16%. Although the benefits continue to decline, the improvements due to the co-work system are greater than those of the pure wind system. When the penalty coefficient increases, the battery system can also clearly increase the profit by reducing the output deviation. Overall, it is necessary for the operator to set a reasonable penalty coefficient of deviation because it will have an impact on the profits of the power generator. To prevent wind power producers from being too cautious or optimistic when reporting their output plans, the penalty coefficient should not be set too high or too low. The ideal deviation penalty coefficient selected in this paper is 1.25.

6. Conclusions

By locating the battery system at the wind farm’s output node, thereby ensuring that its operation is consistent with that of the wind farm, it can have a significant influence on the wind farm’s economic profit. In this paper, by considering the peak–valley electricity price, and adopting the power and energy temporal transfer of a battery system, we constructed a wind–battery co-work charge/discharge strategy model. Based on the prediction error of wind power output, and the flexible ability of the battery system to adjust the deviation of the wind power prediction, an analysis of the economic profit due to the wind–battery co-work system was undertaken. The simulation results show:
  • A lower prediction deviation of wind power output decreases the economic profit of the wind farm. The economic benefits of the co-work system decrease from $ 13,079 to USD 7134 with an increase in prediction deviation.
  • The battery system can convert the low-price valley electricity to high-price peak electricity, thus reducing the negative effect of prediction deviation and enhancing the economic profit of the wind farm. As the deviation in the wind power forecast increases, the benefits of the combined wind–storage system increase by up to 45%, compared with 10% for the wind farm without energy storage.

Author Contributions

Conceptualization, M.M.; Data curation, S.L.; Writing—original draft, M.M.; Writing—review & editing, S.L., Y.Z. and X.C. All authors have read and agreed to the published version of the manuscript.of the manuscript.

Funding

This work is supported by State Grid Corporation of China (No.521532190003).

Conflicts of Interest

The authors declare no conflict of interest.

References

  1. Castronuovo, E.D.; Lopes, J.A.P. Optimal operation and hydro storage sizing of a wind-hydro power plant. Int. J. Electr. Power Energy Syst. 2004, 26, 771–778. [Google Scholar] [CrossRef]
  2. Hauer, I.; Balischewski, S.; Ziegler, C. Design and operation strategy for multi-use application of battery energy storage in wind farms. J. Energy Storage 2020, 31, 101572. [Google Scholar] [CrossRef]
  3. Shi, J.; Zhang, G.; Liu, X. Generation Scheduling Optimization of Wind-Energy Storage Generation System Based on Feature Extraction and MPC. Energy Procedia 2019, 158, 6672–6678. [Google Scholar] [CrossRef]
  4. Heredia, F.-J.; Cuadrado, M.D.; Corchero, C. On optimal participation in the electricity markets of wind power plants with battery energy storage systems. Comput. Oper. Res. 2018, 96, 316–329. [Google Scholar] [CrossRef] [Green Version]
  5. Zhang, X.; Gu, J.; Yuan, Y.; Hua, L.; Shen, Y. Scheduling wind-battery energy storage hybrid systems in time-of-use pricing schemes. IET Gener. Transm. Distrib. 2018, 12, 4435–4442. [Google Scholar] [CrossRef]
  6. Zhang, F.; Meng, K.; Dong, Z.; Zhang, L.; Liang, J. Battery ESS Planning for Wind Smoothing via Variable-Interval Reference Modulation and Self-Adaptive SOC Control. Strategy. IEEE Trans. Sustain. Energy 2017, 8, 695–707. [Google Scholar] [CrossRef]
  7. Khalid, M.; Aguilera, R.P.; Savkin, A.V.; Agelidis, V.G. On maximizing profit of windbattery supported power station based on wind power and energy price forecasting. Appl. Energy 2018, 211, 764–773. [Google Scholar] [CrossRef]
  8. Datta, U.; Kalam, A.; Shi, J.A. approach in dual-control of battery energy storage systems in windfarm output power smoothing. In Proceedings of the Australasian Universities Power Engineering Conference (AUPEC), Melbourne, Australia, 19–22 November 2017; pp. 1–5. [Google Scholar]
  9. Yao, D.L.; Choi, S.S.; Tseng, K.J.; Lie, T.T. Dynamic study of a battery change-over scheme of a windfarm containing dual BESS. In Proceedings of the 10th International Power & Energy Conference (IPEC), Ho Chi Minh City, Vietnam, 12–14 December 2012; pp. 224–229. [Google Scholar]
  10. Loukatou, A.; Johnson, P.; Howell, S.; Duck, P. Optimal valuation of wind energy projects co-located with battery storage. Appl. Energy 2021, 283, 116247. [Google Scholar] [CrossRef]
  11. Bouffard, F.; Galiana, F.D. Stochastic security for operations planning with significant wind power generation. In Proceedings of the 2008 IEEE Power and Energy Society General Meeting—Conversion and Delivery of Electrical Energy in the 21st Century, Pittsburgh, PA, USA, 20–24 July 2008; pp. 1–11. [Google Scholar]
  12. Focken, U.; Lange, M.; Mönnich, K.; Waldl, H.-P.; Beyer, H.G.; Luig, A. Short-term prediction of the aggregated power output of wind farms—A statistical analysis of the reduction of the prediction error by spatial smoothing effects. J. Wind Eng. Ind. Aerodyn. 2002, 90, 231–246. [Google Scholar] [CrossRef]
  13. Fabbri, A.; Roman, T.G.; Abbad, J.R.; Quezada, V.M. Assessment of the Cost Associated With Wind Generation Prediction Errors in a Liberalized Electricity Market. IEEE Trans. Power Syst. 2005, 20, 1440–1446. [Google Scholar] [CrossRef]
  14. Aaslid, P.; Korpås, M.; Belsnes, M.M.; Fosso, O.B. Pricing electricity in constrained networks dominated by stochastic renewable generation and electric energy storage. Electr. Power Syst. Res. 2021, 197, 107169. [Google Scholar] [CrossRef]
  15. Razali, N.; Hashim, A.H. Backward reduction application for minimizing wind power scenarios in stochastic programming. In Proceedings of the Power Engineering & Optimization Conference, Shah Alam, Malaysia, 23–24 June 2010; pp. 430–434. [Google Scholar]
  16. Tong, F.; Yuan, M.; Lewis, N.S.; Davis, S.J.; Caldeira, K. Effects of Deep Reductions in Energy Storage Costs on Highly Reliable Wind and Solar Electricity Systems. iScience 2020, 23, 101484. [Google Scholar] [CrossRef] [PubMed]
  17. Symeonidou, M.M.; Zioga, C.; Papadopoulos, A.M. Life cycle cost optimization analysis of battery storage system for residential photovoltaic panels. J. Clean. Prod. 2021, 309, 127234. [Google Scholar] [CrossRef]
  18. Zhang, C.; Qiu, J.; Yang, Y.; Zhao, J. Trading-oriented battery energy storage planning for distribution market. Int. J. Electr. Power Energy Syst. 2021, 129, 106848. [Google Scholar] [CrossRef]
  19. Ademulegun, O.O.; Keatley, P.; Agbonaye, O.; Jaramillo, A.F.M.; Hewitt, N.J. Towards a sustainable electricity grid: Market. and policy for demand-side storage and wind resources. Util. Policy 2020, 67, 101116. [Google Scholar] [CrossRef]
  20. Duan, J.; Kooten, G.C.V.; Liu, X. Renewable electricity grids, battery storage and missing money. Resour. Conserv. Recycl. 2020, 161, 105001. [Google Scholar] [CrossRef]
  21. Faraji, J.; Ketabi, A.; Hashemi-Dezaki, H. Optimization of the scheduling and operation of prosumers considering the loss of life costs of battery storage systems. J. Energy Storage 2020, 31, 101655. [Google Scholar] [CrossRef]
  22. Li, J.; Gee, A.M.; Zhang, M.; Yuan, W. Analysis of battery lifetime extension in a SMES-battery hybrid energy storage system using a novel battery lifetime model. Energy 2015, 86, 175–185. [Google Scholar] [CrossRef] [Green Version]
  23. Li, S.; Fang, H.; Shi, B. Remaining useful life estimation of Lithium-ion battery based on interacting multiple model particle filter and support vector regression. Reliab. Eng. Syst. Saf. 2021, 210, 107542. [Google Scholar] [CrossRef]
Figure 1. Schematic configuration of wind-battery energy storage, where PW is the output power of the wind farm; P E is the charge/discharge power of the battery storage system; PZ is the output power of the whole system.
Energies 14 03707 g001
Figure 2. Typical discretized graph of the probability distribution of the wind forecast error.
Energies 14 03707 g002
Figure 3. Cycle life curve of a Li-ion Battery.
Energies 14 03707 g003
Figure 4. Forecast wind power of a day in spring.
Energies 14 03707 g004
Figure 5. Power of a hybrid wind power and battery energy storage system considering the electricity prices during a day in each of the four seasons.
Energies 14 03707 g005
Table 1. Prices of wind power.
Load PeriodTimePrice on Grid ($/kWh)
Peak[7,11] ∪ [17,21]0.15
Middle[11,17] ∪ [21,23]0.10
Valley[0,7] ∪ [23,24]0.06
Table 2. System parameters of wind-storage.
ParameterValueMeaning
Pw,rated/MW10Wind farm rated power
PE,min/MW−6Battery maximum charging power
PE,max/MW6Battery maximum discharging power
SOCmax1Battery maximum charge status
SOCmin0Battery minimum charge status
SOCt00Battery initial charge status
E/MWh36Battery maximum capacity
ηc0.927Battery charging efficiency
ηd0.927Battery discharging efficiency
LR/Cycle1300Rated battery cycle life
DR0.8Rated depth of discharge
Ccap/USD/kWh224.9Battery investment cost
εom/USD/kW0.004O&M cost
ηs0.859Battery total efficiency
Table 3. Economic benefits of the wind farm in different scenarios.
ScenarioWind Farm Economic Profit/USDCo-Work System Economic Profit/USD
Spring11,84913,079
Summer10,80612,076
Autumn934510,407
Winter89639853
Table 4. Economic benefits of the wind farm with different levels of forecast.
kwk0Wind Farm Economic Profit/$Co-Work System Economic Profit/USD
0.10.0111,84913,079
0.20.0210,12011,574
0.30.03839110,123
0.40.0466618620
0.50.0549327134
Table 5. Economic benefits of the wind farm with different values of coefficient of deviation.
ωWind Farm Economic Profit/$Co-Work System Economic Profit/ USD
0.5012,88713,604
0.7512,54113,422
1.0012,19513,247
1.2511,84913,079
1.5011,50312,914
1.7511,15812,749
2.0010,81212,583
Publisher’s Note: MDPI stays neutral with regard to jurisdictional claims in published maps and institutional affiliations.

