Article

Impacts of Electricity Outages in Urban Households in Developing Countries: A Case of Accra, Ghana

by
Paul Nduhuura
1,2,3,*,
Matthias Garschagen
4 and
Abdellatif Zerga
3
1
Department of Mechanical Engineering, Faculty of Technology, University of Tlemcen, B.P. 119|Pôle Chetouane, Tlemcen 13000, Algeria
2
UN Campus, United Nations University Institute for Environment and Human Security (UNU-EHS), Platz der Vereinten Nationen 1, D-53113 Bonn, Germany
3
Pan African University Institute of Water and Energy Sciences—PAUWES, c/o University of Tlemcen, B.P. 119|Pôle Chetouane, Tlemcen 13000, Algeria
4
Department of Geography, Ludwig-Maximilians-Universität München (LMU), Luisenstrasse 37, 80333 München, Germany
*
Author to whom correspondence should be addressed.
Energies 2021, 14(12), 3676; https://doi.org/10.3390/en14123676
Submission received: 26 April 2021 / Revised: 25 May 2021 / Accepted: 26 May 2021 / Published: 20 June 2021
(This article belongs to the Special Issue Sustainable Energy & Society)

Abstract

:
Many developing countries in Africa face a “double tragedy” when it comes to electrification. Electricity access rates are low, while those who have access to electricity face frequent outages. There are ongoing efforts aimed at increasing access to electricity on the continent. However, the need to improve the reliability of electricity supply receives limited attention. Unreliable electricity impacts users by limiting electricity utilization and the benefits that should accrue from having an electricity connection. Using data from 496 household survey questionnaires, this study examines the impacts of electricity outages in urban households in Accra, Ghana. The study applies correlation and regression analyses to identify which household characteristics are associated with or predict households reporting outage impacts. Outages were found to impact household safety/security, access to food, and access to social services and were found to cause appliance damage as well. Factors that are significantly correlated with reporting certain outage impacts include respondent’s annual income and employment status, frequency of electricity outages, and household size. Significant predictors of reporting outage impacts are socioeconomic disadvantage, high exposure to outages, and living in a large family setting. The study’s findings underscore the need for interventions to eliminate, or at least minimize, electricity supply interruptions in developing countries if sustainable social and economic development is to be achieved.

1. Introduction

There are ongoing concerted efforts to expand access to electricity, especially in developing countries. In Africa, electricity is touted as an important enabler for social and economic transformation [1,2], and as such, many electrification programs were implemented on the continent, being geared towards increasing the number of communities or households having an electricity connection. Still, more than 50% of the population have no access to electricity in many sub-Sahara African countries [3]. Moreover, many developing countries in Africa face a “double tragedy” when it comes to electrification. Not only are electricity access rates low, those who have access to electricity—that is, are connected to the electric grid—also face frequent power outages [1,2,4]. Due to recurrent failures in the electricity system, often no electricity flows through the wires for several hours in a day. The outages impact electricity users (industries, businesses, households) by limiting electricity utilization and the benefits that should accrue from having an electricity connection [1,5]. In the future, the impact of loss of electricity service could even be greater as people become more dependent on an unreliable service.
An analysis of 2010–2017 data from the World Bank enterprise surveys shows that, on average, power outages affect over 75% of business firms in sub-Saharan Africa and negatively impact firm sales [4]. Because of this, many firms choose to rely on expensive backup generators, while those which cannot afford to use generators are often forced to operate for fewer hours, change production time, or change production processes/products [1]. Moreover, it is not just firms which report frequent power outages. A 2016 Afrobarometer report shows that 31% of grid-connected households in Africa experience unreliable power supply—one that does not work most or all of the time. Unreliability of power supply in households varies across countries, with most countries in North Africa, which traditionally have high electricity access rates, also having high electricity reliability (fewer electricity outages) (see Table 1). Countries in West Africa, particularly Guinea and Nigeria, have some of the lowest electricity reliability rates (experience most electricity outages) on the continent. In Ghana, despite a relatively high electricity access rate, only 42% of grid-connected households reported having a reliable power supply, and electricity supply was identified among the top five problems affecting the country [6].
Despite the prevalent state of electricity unreliability in many African countries, recent efforts (research and other interventions) about electrification in Africa largely focus on increasing electricity connections. The subject of electricity supply (un)reliability receives limited attention [5]. Additionally, the few studies about electricity unreliability/outages in Africa addressed the impacts on business firms and the economy [7,8,9,10], while electricity outages in households were rarely investigated. The research presented here aims to fill this knowledge gap by assessing the impacts of electricity outages in urban households in developing countries using a case study of Accra, Ghana. A household survey was conducted to identify and better understand the impacts of electricity outages in urban households and to examine which household demographic and socioeconomic characteristics are linked to reporting electricity outage impacts and how. The study also sheds light on some of the societal drivers of electricity outage impacts. It is hoped that the results of the study will ultimately inform measures towards building household resilience to frequent power outages.

1.1. Outage Impacts in Households

Electricity is mainly used in households to power appliances including refrigerators and cooling systems, lighting systems, heating and cooking appliances, and television and ICT devices [11,12,13]. These offer important services to support food preparation and preservation, home-based production and academic activities, safety and security, communication and access to information, as well as air conditioning, comfort, and leisure [11]. In some cases, especially in developed countries, electricity is also used to support home-based medical care and operate lifts to ease movement. When power outages occur, all these services can be disrupted. Therefore, the impacts that result from loss of electricity supply can differ for individual households depending on their electricity needs (uses), capacities, and preferences [14]. Higher electricity-consuming households are most likely to suffer greater impacts and costs from power outages than lower electricity-consuming households [15]. Households that use electricity for critical and specialized purposes, such as powering medical devices used for providing home-based healthcare services, may suffer an even greater outage impact.

1.1.1. Economic Impacts

Similar to business firms, electricity outages have negative economic effects on households. Several studies, particularly in developed countries, examined the economic (monetary) value of outage impacts within households. By quantifying measures such as value of lost load (VoLL) [14,16,17], willingness to pay (WTP), and willingness to accept (WTA) [18,19,20,21,22,23], these studies showed that the economic impact of outages in households is substantial and, in some instances, may exceed that of business enterprises [24]. However, quantifying the economic value of home-based, non-material benefits of electricity such as welfare, leisure, comfort, and general social wellbeing is a difficult and subjective task since the real economic value of such intangible benefits is not well known. On the other hand, power outages also have a more direct economic impact on households, including on household earnings [1,25]. In a study carried out in India, access to electricity (having an electricity connection) was found to confer a 9.6% increase in household income, while access to reliable electricity (with fewer outages) was associated with a higher increase in income of 17% [26]. This may be attributed to the fact that the benefits which accrue from access to electricity, such as increased opportunities for home production, and electricity-induced job creation may be eroded if the electricity supply is unreliable. Additionally, household expenditure on outage coping/adaptation measures (e.g., purchasing and operating backup electricity supply system) may be high and exceed a household’s regular expenditure on electricity [27]. This can also negatively impact the overall economic situation of the household.

1.1.2. Impact on Access to Social Services

Disrupted electricity supply also has a negative effect on the delivery of critical social services to households and communities. Vital infrastructures such as water supply systems, hospitals, education institutions, and telecommunication systems all require a reliable electricity supply to operate optimally and deliver vital services to people. Power outages were shown to hinder provision and access to quality health services in several countries, including India and Ghana [28,29]. Power outages may render medical devices unusable and compromise the quality of life-saving medicines such as vaccines. Electricity access is also positively associated with education attainment including reduction in illiteracy levels and increasing years of schooling [30]. With household access to electricity, more school-going children participate in academic activities including school enrolment and attendance, use of enhanced learning gadgets, and personal study at home [31]. However, if the electricity supply is unreliable, it may lead to the deterioration of the learning environment by limiting opportunities for learning. For example, because of power outages, electrically-powered learning aids may not be used in class, and personal or night-study time may be reduced considerably. This has a consequence of compromising the delivery of quality education and affects morale and academic performance of students [32]. Extended power interruptions can also disrupt the supply of water to households since all the aspects of a modern water supply system (extraction, treatment, transmission, and distribution) require electricity. In highly populated areas, including many cities in developing countries, loss of water supply may have attendant negative consequences for public health, including high risk for disease outbreaks such as cholera. Communication/leisure activities (for example, watching television) are also disrupted by outages, complicating access to information and home-based leisure [5].

1.1.3. Impact on Safety and Security

Power outages are also associated with increased crime/security concerns [5,33]. In 1977, a blackout in the city of New York, which lasted for 25 h, set off a “crime rampage” with shops being looted, properties vandalized, and stores set on fire. The resulting havoc also left two people dead and many law enforcement personnel injured [34]. While this may be considered one example of extreme cases, power outages in both developed and developing countries are still associated with increased criminal activity, including physical assault, robbery/looting, and burglary (house break-in). During the recent emergency power outages in the state of California, USA, there were reports of burglary in some areas, even after local police imposed a night-time curfew [35]. Incidences of burglary, theft, and exploitation during power outages were also reported in Brazil, Chile, and South Africa [36]. In Ghana, there was heightened public concern about the increased threat of physical assault, house break-in, and theft during the recent electricity supply crisis [32,37]. The sustained power outages prompted Ghana National Police to announce measures to curtail a potential rise in crime [38]. Furthermore, safety concerns associated with power outages are not limited to criminal activity. Erratic power supply is also reported to be among the leading causes of fire outbreaks in Ghana [33,39]. These fires which mostly occur within households are attributed to the use of unsafe alternative energy sources (e.g., open fires) during outages as well as high voltage surges when power supply is reconnected.

1.1.4. Other Impacts of Outages in Households

Frequent power outages are also said to be responsible for direct damage to household electrical appliances including refrigerators, television sets, and other appliances [5,22]. Moreover, the lack of reliable electricity also renders electrical appliances redundant and unable to fulfill their intended purpose. For example, due to outages, refrigerators cannot consistently offer cold storage for food stuffs, which accelerates food spoilage/losses in homes [5,40].

1.2. Predictors of Outage Impacts in Households

As already mentioned, WTP (or WTA) were used to estimate the potential impacts and costs of power outages in households. WTP/WTA show the value that is placed on electricity in households and, therefore, indirectly indicate impacts and losses that households suffer whenever electricity supply is disrupted. For example, households with a high willingness to pay for improved electricity reliability attach more value to electricity and are likely more impacted by power outages and vice versa. Additionally, in several studies, the level of WTP/WTA was shown to be associated with several household-level characteristics, including age, gender, marital status, education, employment, income, home ownership, family size, and outage duration, among others.
A study by Abdullah and Mariel [41] applied a mixed logit estimation approach on responses from 202 electrified rural households in Kenya and found that older persons and the unemployed were less willing to pay for improved electricity reliability, while larger households were more willing to pay for improved electricity reliability. A study of Italian households by Abrate et al. [42] also used logit estimation on 367 survey questionnaires and identified education as a significant determinant of willingness to accept an outage, whereby more educated people—who have a high school diploma or more—are less willing to accept an outage than less educated ones. Osiolo [43] used a Heckman two step estimation model (a probit model) to assess the WTP for energy among households and enterprises in Kenya. The results showed that the gender of the household head is significantly related with WTP for improved electricity reliability, with female-headed households having lower stated WTP values than male-headed households. In South Korea, Kim et al. [44] developed a logistic model to estimate the inconvenience cost caused by a rolling blackout in households. In one of the models, it was found that the level of income significantly predicted WTP, whereby high-income households were more likely to be willing to pay to avoid the “inconvenience cost” of outages when compared to low-income households. A study by Ozbafli and Jenkins [20] also showed that the respondent’s age is significantly associated with loss (impact) arising from very frequent outages, whereby older people are less likely to suffer loss of utility (possibly because they are more experienced at coping) as compared to younger people.
Similarly, studies carried out in Ghana identified significant relationships between WTP for improved electricity services and several household-level factors. A study conducted in Greater Accra Region, which employed a probit model, found that gender (being male), marital status (being married), a large household size, and having a high income are positively and significantly associated with WTP for more reliable electricity supply [45]. These findings are supported by another study conducted by Amoah et al. [40] in the same region. A similar study on the WTP for improved electricity was conducted by Taale and Kyeremeh [22] in Cape Coast Metropolitan Area. Their study applied Tobit regression modeling on survey data from 950 households. It was found that monthly income, level of education, marital status, and household size significantly influence willingness to pay for improved electricity services. Specifically, income and level of education were found to be positively associated with WTP. Households/household heads with a high income and at least high school education were more willing to pay for improved electricity reliability than those with low income or lower education level. Being married also returned a positive relationship with willingness to pay for better electricity services. Household size was found to be negatively associated with WTP. However, the same study found that age, house ownership, and monthly electricity expenditure do not have a significant relationship with WTP to avoid power disruptions [22].

1.3. Status of Energy (Electricity) Supply and Demand in Ghana

Ghana is one of the leaders in energy sector growth and transformation in Africa. Significant efforts towards expanding electricity access in Ghana began in 1989 with the launch of the National Electrification Scheme (NES) [46]. This, together with other initiatives, facilitated tremendous growth in Ghana’s electricity access rates from an estimated 15% in 1990 to 84% in 2018 [3,46]. Expanding access to electricity in Ghana facilitated a shift from using traditional forms of energy towards modern and sustainable energy. Over a period of 10 years, the share of electricity in final energy consumption increased from 10.8% in 2009 to 15.2% in 2018. The share of biomass reduced from 43.7% to 37.4% over the same time period. Despite the significant progress, energy poverty in Ghana is still widespread, being especially manifested by overreliance on traditional cooking fuels (firewood and charcoal), especially in households. This type of energy poverty is twice as high in rural areas than in urban areas [47,48].

1.3.1. Electricity Supply

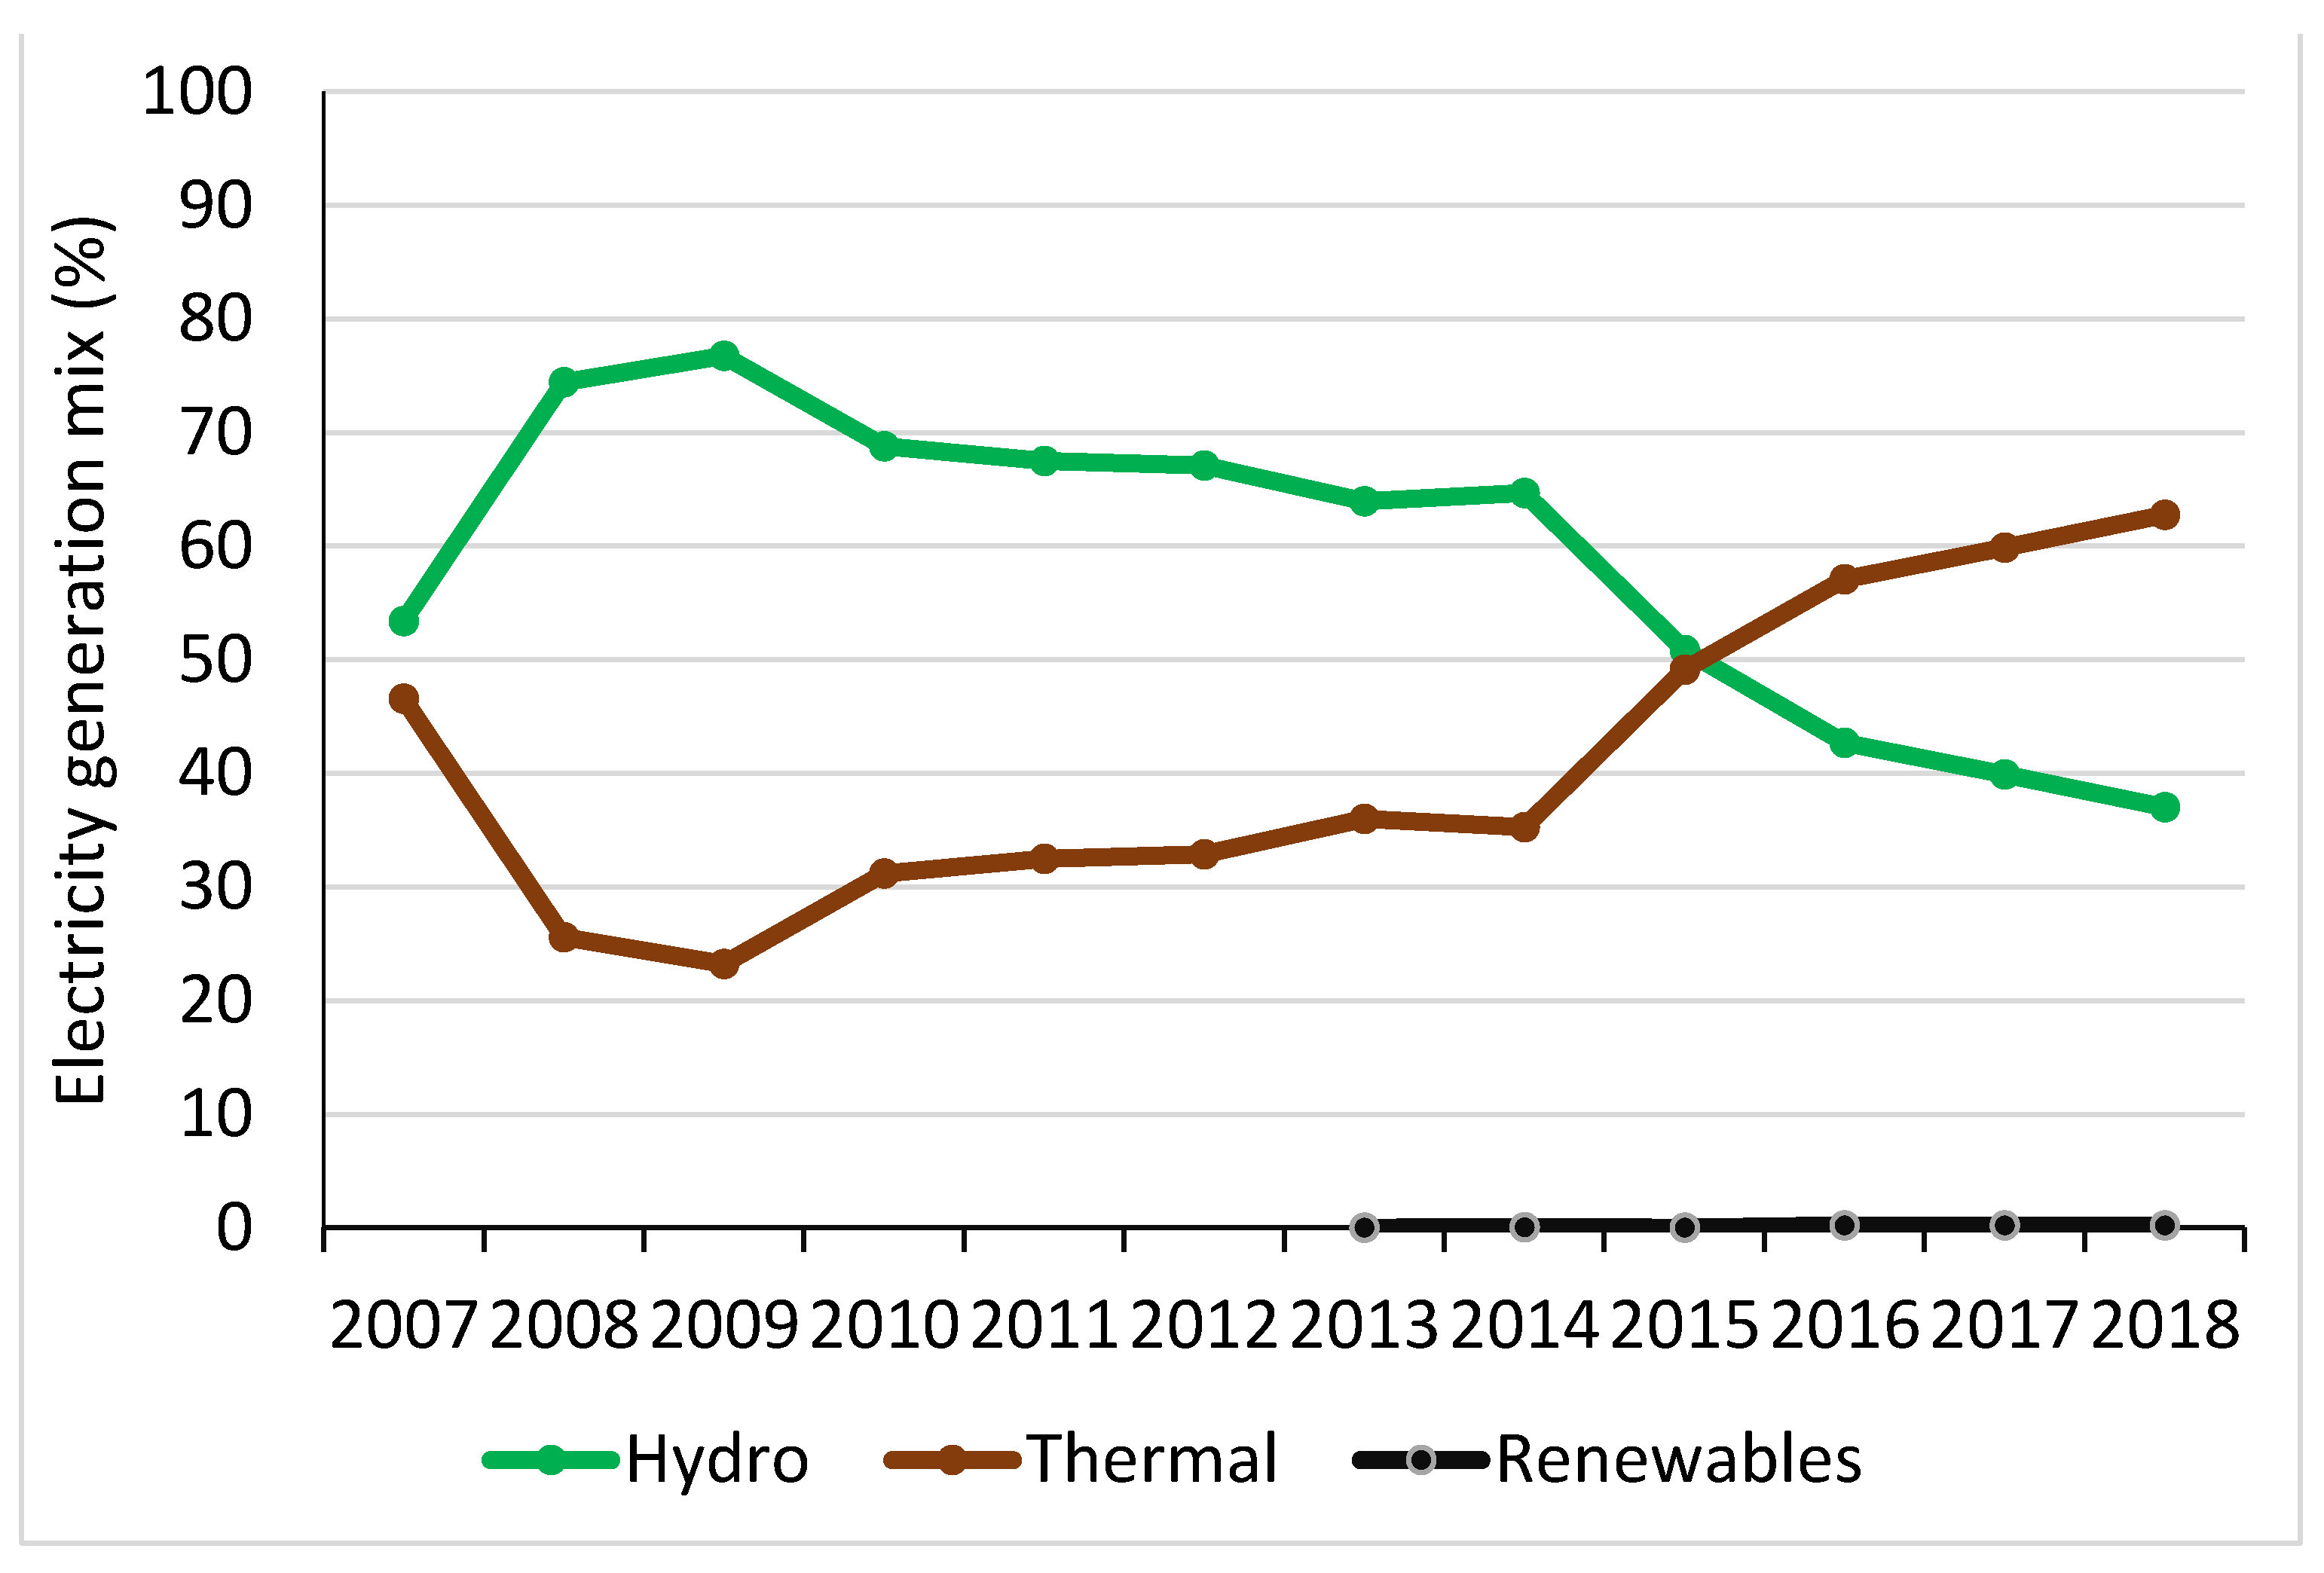
Most of the electricity supply in Ghana comes from centralized power plants and is delivered through an extensive electric power grid. In 2018, Ghana had at least 20 functional grid-connected electricity generation plants with a total installed capacity of 4888.6 MW (4472.1 MW dependable capacity) generating an estimated 16,246.12 GWh [47]. For many years (until 2015), Ghana depended heavily on hydropower plants for its electricity generation, especially the Akosombo hydropower plant [49]. However, recent electricity supply diversification efforts in the country saw electricity generation from thermal power plants, particularly those which use natural gas and light crude oil (LCO), exceed that from hydropower plants, while other renewable energy sources (mostly solar photovoltaics) made a small contribution to the generation mix (see Figure 1). For example, in 2018, electricity generation from hydropower plants (total installed capacity = 1580 MW) was 6018 GWh, that from thermal power plants (total installed capacity = 3266 MW) was 10,195 GWh, while that from other renewable sources (total installed capacity = 42.6 MW) was only 33.12 GWh [47].
Despite the fact that Ghana is endowed with several renewable energy resources, including solar PV, wind, mini hydro and modern bioenergy, the contribution of renewable energy sources is small. The average solar irradiation in Ghana was estimated at 5 kWh/m2/day, while monthly wind measurements along the coast of Ghana showed that wind speeds average at 5 m/s. The potential for small and medium hydropower plants was also estimated to be 800 MW, and the potential for bioenergy production from agricultural residues and municipal solid waste is also immense [50]. Therefore, harnessing the largely untapped renewable energy resources has the potential to improve the electricity supply situation in Ghana [50]. However, large scale deployment of renewable energy in Ghana is still constrained by several factors, which include financial challenges such as high cost of financing, insufficient incentives for developers, inadequate access to long-term financing, and unstable currency, challenges related to interconnectivity with the existing grid infrastructure, and lack of sufficient human resource capacity to develop and operate renewable energy installations [51].

1.3.2. Electricity Demand and Consumption

Expanding access to electricity in Ghana inevitably led to increased electricity demand and consumption. Between 2009 and 2018, overall peak demand grew by 77% from 1423 MW to 2525 MW [47], which is comparatively higher than the 49.8% growth previously reported for the period 2006–2016 [46]. Similarly, grid electricity consumption in Ghana more than doubled over a 12-year period since 2007 (see Figure 2). On average, electricity consumption increased in all four main electricity consumer categories, that is, residential, non-residential, industrial, and street lighting. At 43.3%, special load tariff consumers (mostly large industrial establishments) accounted for the biggest share of the total electricity consumption in 2018, followed by residential consumers at 41.4%. Among the leading electricity consumer categories, residential electricity consumption posted the highest growth rate of 142% over a 12-year period (2007–2018) [47]. Rapid growth in Ghana’s residential electricity consumption is attributed not only to increased grid connections (the number of grid-connected households in Ghana increased from 1.86 million in 2009 to 3.75 million customers in 2018 [30]) but also to growth in per capita income with its associated lifestyle changes, such as increased ownership of electrical appliances [52].

1.3.3. Persistent Electricity Sector Challenges

Despite the impressive progress made in the electricity sector growth in Ghana, the electricity supply sub-sector faces several challenges. Firstly, the electric grid is characterized by high levels of electricity losses. Between 2009 and 2018, transmission losses accounted for 4.1% of the total electricity transmitted annually in Ghana [47]. Electricity losses at the distribution level were much higher. Between 2011 to 2018, the distribution losses for ECG and NEDCo—Ghana’s largest electricity distribution companies—averaged about 25% of the total electricity distributed [47]. The high electricity losses are driven by both technical and non-technical factors, including inherent inefficiencies in the distribution system apparatus, non-payment of electricity bills by customers, and power theft/illegal connections [53] These losses affect the economic performance of the electricity distribution companies, which in turn compromises effective/reliable service delivery to the customers.
Apart from high electricity losses, Ghana, over the past decades, also experienced recurrent shortages in electricity supply. The first major electricity supply crisis in Ghana was recorded in the early 1980s. Between 1981 and 1984, about 67% of Ghana’s electricity supply capacity (mainly from the Akosombo hydropower dam) was lost [54]. Subsequent electricity supply shortages in 1997/98, 2002, 2006/07, and 2012–2016 also involved major shortfalls in electricity generation, which necessitated the implementation of nationwide electricity rationing (rolling blackouts or load shedding) in Ghana [37]. Several factors are believed to be responsible for the recurrent electricity supply shortages in Ghana. These include rapid growth in electricity demand, limited investment in generation facilities, shortfalls in electricity imports, and institutional challenges. Most commonly, however, shortages of water available for electricity generation are blamed for the power supply shortfalls [37,50,52,55,56]. For many years, Ghana depended heavily on hydropower plants for its electricity generation. This exposed it to fluctuations in electricity supply due to variations in the amount of water available for electricity generation. Indeed, receding water levels at Akosombo dam during droughts often coincided with shortfalls in electricity generation and the subsequent power shortages that affected Ghana over the years. This susceptibility of hydropower plants to severe weather and climatic changes, especially droughts, largely influenced Ghana’s recent shift from hydro to thermal power generation [52].
With the shift to thermal power generation, it is expected that electricity supply reliability in Ghana will be greatly improved. However, Ghana’s thermal power plants—which mostly operate on natural gas—are also faced with several challenges. Even though Ghana is a natural gas producer, it also relies on natural gas imported from Nigeria through the West African Gas Pipeline (WAGP). Challenges including insufficient supply, planned and unplanned supply interruptions, as well as non-payment of bills to natural gas suppliers sometimes hinder continuous and reliable access to natural gas from the WAGP and local suppliers [50,57]. This affects the operations of thermal power plants, leaving some of them redundant, operating below capacity, or having to rely on more expensive liquid fuels [54,57], further complicating the electricity supply situation and contributing to electricity supply shortfalls.

1.4. Urbanization and Electrification in Ghana

Urbanization is one of the main demographic shifts that is currently taking place, especially in the developing regions of Africa and Asia [58]. Although Africa is still the least urbanized world region, an estimated 58.9% of Africa’s population will reside in urban areas by 2050, rising from 31.5% in 1990. In 2050, Africa’s urban population will represent 22% of the projected global urban population [59]. Ghana is one of the most urbanized countries in Africa. Even when most people on the continent still reside in rural areas, Ghana’s urban population already exceeds its rural population. Ghana’s urban population increased from 32.1% in 1984 to 50.9% in 2010 [60] and is projected to reach 63% by 2025 [33]. In Ghana, greater Accra region is the most urbanized region with over 90% of the region’s population residing in urban centers.
Similar to other countries in sub-Saharan Africa, most of the electrification and the electricity consumption in Ghana take place in urban areas. In 2018, 93% of Ghana’s urban population had access to electricity as compared to 73% of the rural population [3]. Additionally, the need to establish electricity supply infrastructure in Ghana is driven by, among other factors, urbanization [33]. Historically, urbanization was identified as one of the main drivers of energy consumption [61]. Cities account for between 67% and 76% of the global energy use [62]. In Ghana, it was observed in some studies that urbanization contributed to growing residential electricity demand possibly related to lifestyle changes and increased use of electrical appliances such as air conditioners, televisions, and refrigerators [13,54]. Indeed, urban households account for 70% of the total electricity consumed in Ghana’s residential sector [13]. Other factors such as growth of business enterprises and the manufacturing sector as well as increasing urban population also stimulated growth in electricity demand in Ghana’s urban areas [33]. Such growing electricity demand, if not matched by increased electricity generation, can result in electricity supply shortfalls. Indeed, rapid urbanization in Ghana’s major cities, especially Accra, was linked with the perennial electric power crises that affected the country in the past and the attendant socioeconomic implications [33]. Additionally, whenever power outages occur, it can be expected that the impacts of outages will be more pronounced in large cities due to high reliance on electricity in these areas.

2. Data and Methods

2.1. Study Area Overview

Ghana is a country in West Africa and covers a land area of 238,533 sq km. In 2018, Ghana’s population was estimated at 29.6 million people. Ghana’s population growth rate since 1970 has been above the world average, with this trend expected to continue into the foreseeable future. Over 60% of Ghana’s population is below 30 years of age. Ghana’s economy is made up of both private and public enterprises. About three-fifths of the country’s gross domestic product (GDP) is derived from the services sector, while agriculture contributes almost one-fifth, and industry about one-fourth. Cocoa, gold, and oil are some of the most important resources that are driving Ghana’s economic boom. Most of the Ghanaians are employed in the sectors of agriculture, forestry, and fishing.
This study was carried out in Accra city. Accra is one of the districts in the Greater Accra Region and is located in southern Ghana along the Atlantic coastline. Accra is the capital city of Ghana, covering an estimated land area of over 200 km2, and is home to over 2 million people. The city is a center of socioeconomic and political life. Accra has the highest level of access to social services in Ghana. In total, 82.2% of all households in greater Accra have access to piped water for domestic use, while 96.5% of households are connected to the national electric power grid. In terms of income, households in Accra have an estimated mean annual income of 63,027 Ghana Cedis (GH¢) (approximately equivalent to 10,885 USD) which is much higher than the national average. However, about 24.2% of the people who are unemployed in Ghana live in Accra [63]. Of those who are employed in Accra, 90.3% work in the private sector and 23.8% are involved in the informal sector.

2.2. Data Collection: Survey

A survey was carried out across 47 neighborhoods (communities) in Accra Metropolis, with a household chosen as a unit of analysis. The surveyed communities are those which suffered very frequent power outages during the most recent electricity supply shortages in Ghana. Moreover, many of the selected communities are largely residential areas, making them suitable for a household-level analysis. The communities cover 31% of the total area of Accra but are home to an estimated 56% of the city’s total population [64]. To select households for the survey, the study employed a systematic random sampling approach similar to what was used by Arku et al. [65]. Survey questionnaires were administered to household respondents from September to November 2018. The questionnaire included questions necessary to identify household socioeconomic, demographic, and electricity usage/outage characteristics including but not limited to age and marital status of the respondent, occupancy status, number of rooms and number of household occupants, household income, employment status and level of education of the respondent, uses of electricity within the household, household expenditure on electricity, and experiences with electricity outages (frequency and duration). In addition, questions that required respondents to identify household-level outage impacts were included. Specifically, respondents were asked to indicate whether or not they had suffered a particular outage-related impact from a list of twenty-one possible outage impacts identified through literature review.
The questionnaires were administered with the help of research assistants from CSIR-STEPRI (Council for Scientific and Industrial Research, Science and Technology Policy Research Institute) under the supervision of the first author of this paper. The research assistants were first trained on the questionnaire for two days, and one community trial run of the questionnaire was also conducted with them. The survey questions were administered through face-to-face interviews with the household respondents. The questionnaire was paper-based and written in the English language. In some cases, the research assistants would orally translate the questions to one of the local languages (especially Ga and Twi) for respondents who did not understand the English language. The survey interviews were mostly administered in the evening hours after most people in Accra have returned to their homes. The questionnaires were administered to household heads or any other adult persons who could answer on behalf of the household heads. The survey targeted at least twelve households in each neighborhood, bringing the total number of surveyed households to 564.

2.3. Data Analysis

To analyze the data, this study employed standard statistical methods as explained below.

2.3.1. Correlation Analysis: Pearson Chi-Square Test

Correlation analysis is oftentimes the first approach used to examine the relationship between a pair of variables. Common correlation analysis methods such as Pearson correlation, Kendall rank correlation, and Spearman correlation require that the data under analysis be numerical in nature. For categorical, non-numerical data, such as respondents’ gender or marital status, crosstabulation of different variable response groups is done first before correlation analysis. Crosstabulation of variables helps to determine the frequency (and the proportion) of responses for intersecting variable subcategories. From the crosstabs, a Chi-Square test is then carried out to determine whether or not there is a statistically significant association between any two categorical variables under analysis.
The Pearson Chi-Square test was used in this study, first to examine the relationships between reporting outage impacts and different household characteristics. In addition, the Chi-Square test was used to test for existing associations between pairs of household characteristics. As potential explanatory variables in a subsequent regression model, household characteristics should not exhibit significant association (not be multicollinear). Multicollinearity is an undesirable characteristic in statistical modeling because strongly correlated (multicollinear) explanatory variables potentially explain the same variance if used in the same model. Using collinear explanatory variables in modeling returns an improperly specified and an unstable model equation.

2.3.2. Dimension Reduction: Categorical Principal Component Analysis (CATPCA)

Principal component analysis (PCA) is one of the most common approaches used for dealing with multicollinearity among explanatory variables. The purpose of principal component analysis is to reduce the number of correlated variables into a few uncorrelated principal components that account for most of the variance in the correlated variables. Ordinary PCA is suitable for continuous/numerical variables which have a linear relationship. On the other hand, categorical principal component analysis (CATPCA), which is a type of PCA, is particularly useful for countering multicollinearity issues in categorical (nominal and ordinal) variables which may not have a linear relationship. CATPCA uses optimal scaling to transform the categorical values into numerical data. CATPCA was used in this study to deal with multicollinearity issues since the explanatory variables are categorical in nature.

2.3.3. Regression Analysis: Binary Logistic Regression

Regression analysis is a statistical modeling approach used to evaluate causal relationships between dependent and independent variables. Regression analyses are different from correlation analyses in that they show the extent to which changes in some variable(s) can cause variation in another (dependent) variable. In a regression equation, the dependent variable is a function of independent variable(s). In the present study, a binary logistic regression approach was used.
Binary logistic regression (BLR) is a type of generalized linear model used when the binary response variable and the independent variables are categorical in nature. Here, the odds of the response variable returning a particular value are modeled as a linear combination of the values of the explanatory variables. A multivariate binary logistic regression model, as used in this study, can be represented by Equation (1) below:
P ( Y ) = e b 0 + b 1 x 1 + b 2 x 2 + + b n x n 1 + e b 0 + b 1 x i + b 2 x 2 + + b n x n
where P ( Y ) is the probability of Y occurring; e is the natural logarithm base; b 0 is the intercept on the y-axis; x n is the predictor variable; and b n is the regression coefficient of x n .
In this study, binary logistic regression analysis was carried out using IBM SPSS software version 25 (IBM, Armonk, New York, NY, USA). Outage impacts are the dependent variables while household/respondent characteristics are the independent variables. Household outage impact responses are binary in nature (yes or no responses). Select outage impacts are coded as shown in Table 2. Explanatory variables considered for modeling drivers of outage impacts in Accra households were categorized into demographic factors, housing characteristics, socioeconomic characteristics, and electricity outage characteristics. These were also transformed into binary categorical variables and coded as shown in Table 3.
Regarding the BLR model fit and diagnostics, several diagnostic/model fit measures were also used to validate the results from binary logistic regression. One of the commonly used measures is −2 log likelihood, which represents how much of the variation in the dependent variable is not accounted for by the model and whether or not the model is missing other important explanatory variables. The −2 log likelihood is mostly used for comparing two models of the same dependent variable but varying explanatory variables. Other BLR measures used in this study included Nagelkerke R-Square, Hosmer and Lemeshow test, and the overall predictive capacity. Nagelkerke R-Square is a pseudo R-square measure similar to the R-square used in ordinary linear regression. It shows the strength of association between the components and the dependent variable. However, pseudo R-square does not represent the proportion of variance accounted.

3. Results

3.1. Respondents Descriptive Statistics

As already mentioned, the survey captured responses from 564 households. However, not all questionnaires were fully completed, as some had elements of missing data, where respondents were unwilling or unable to respond to certain questions. Ultimately, only the fully completed questionnaires (from 496 households) were used for data analysis. This represents an 88% survey completion rate. The descriptive statistics of select household/respondent characteristics are given in Table 3.
From Table 3, slightly more than half of the respondents were female (50.5%) and less than 35 years of age (51.5%). With regard to marital status, 43.8% of respondents were single (never married), while 56.2% were officially married, cohabiting, divorced, or widowed. A total of 29.8% of the respondents lived in their own houses, 65.9% were living as a family (with family members), while 62.1% of the households had fewer than 5 occupants/members. In total, 60.1% of the respondents had an education below tertiary level, 42.2% were formally employed, while 50.1% had an annual income greater than 6000 GH¢ (approximately equivalent to 1036 USD). With regard to electricity outage experiences, 66% of respondents indicated experiencing, at most, thirteen outages per month, while 75.5% of the respondents indicated that, on average, electricity outages lasted for fewer than 9 h. With regard to electricity usage in homes, 99.6% of respondents used electricity for lighting, 91.5% for information, communication, and leisure (watching television, phone and computer charging, and playing video games), 85.2% for air conditioning (including ceiling fan), 82.4% for refrigeration, 75.6% for heating (including water heating and ironing), and only 9.7% used electricity for cooking.

3.2. Reported Impacts of Outages in Accra Households

The survey responses for common outage impacts in Accra households are reported in this section. The identified outage impacts are categorized into five main groups namely: impact on household safety and security; damage to household appliances; disruption to critical infrastructure services; impact on household income or expenditure; and impact on household access to food. Figure 3 shows the percentages of the respondents identifying a particular outage impact as happening in their households.
Across all the five outage impact groups shown in Figure 3, food spoilage (under impact on household access to food) emerged as the leading outage impact reported by 58.9% of the respondents, followed by burglary (under impact on household safety and security) and damage to refrigerators/freezers (under damage to household appliances), reported by 49.4% and 41.1% of the respondents, respectively. The popularity of food spoilage as an outage impact indicates that electricity plays an important role of supporting food preservation in homes and thereby simplifies access to food. This was emphasized by one respondent in Korle Bu community: “We usually buy raw food stuffs in bulk to avoid frequent trips to the market. We cook some and keep some (of the raw food) in the refrigerator. Even cooked food that is left-over, we don’t throw it away. We preserve it in the refrigerator for several days without it going bad”. Aside from supporting access to food, electricity also appears to be a vital aspect for ensuring security against burglary in Accra households. Indeed, as observed by the author, electricity is commonly used in Accra to power electric fences around homes, operate anti-burglar alarms, and provide outdoor lighting at night to deter would-be intruders. A high number of respondents indicating damage to refrigerators/freezers as an outage impact also suggests that power surge protection devices that shield electrical appliances from high voltage surges may not yet be widely used in Accra households.
Other commonly reported outage impacts in Accra households include disruption to communication services (37.9%) and disruption of academic activities (35.8%), which are the top two impacts identified under disruption of critical services. Additionally, damage to lighting appliances (34.9%) was a common impact under damage to household electrical appliances, while reduced household earnings (29.3%) was reported as the leading outage impact under the category of impact on household income/expenditure. Other outage impacts including physical assault (24.6%), damage to ICT devices (especially TVs) (22.5%), disruption to water supply (17.6%), longer time for preparing food (15.7%), increased unit cost of electricity during outages (13.9%), high expenditure of alternative energy sources (12.7%), fire outbreak (11.9%), and increased food prices of the market (10.3%) were identified by more than 10% of the respondents. Less common impacts—reported by less than 10% of the households—included electric shock (8.9%), reduced quality of food on the market (6%), damage to air conditioners/fans (2.1%), disruption to transportation (1.6%) and medical (1.4%) services, and absence of preferred food on the market (0.6%).

3.3. Correlation Analysis Results

3.3.1. Bivariate Correlation Results: Dependent vs. Explanatory Variables

In Table 4, bivariate correlation analysis results indicating the relationships between dependent variables (outage impacts) and several potential explanatory variables (respondent/household characteristics) are presented. Only seven select outage impacts, which were identified by at least ten percent of the respondents and returned significant correlation with at least three potential explanatory variables, are presented in the table and considered for further analysis. The relationships are based on the Pearson Chi-Square test, which returns a Pearson correlation coefficient, X 2 . Statistically significant relationships are highlighted in bold in the table.
From the analysis, physical assault (Y1) is significantly correlated with respondent’s age ( X 2 = 4.006, p < 0.05), annual income ( X 2 = 6.046, p < 0.05), employment status ( X 2 = 43.540, p < 0.01), and number of outages per month ( X 2 = 4.146; p < 0.05). Burglary/house break-in (Y2) was found to be significantly correlated with the sex of the respondent ( X 2 = 8.04, p < 0.01), building ownership ( X 2 = 5.74, p < 0.01), number of people in the household ( X 2 = 4.82, p < 0.05), respondent’s level of education ( X 2 = 4.19, p < 0.05) and employment status ( X 2 = 7.18, p < 0.01), number of outages in a month ( X 2 = 21.53, p < 0.01), and average duration of each outage ( X 2 = 19.79, p < 0.01). Disruption in water supply (Y3) was significantly associated with the occupying house as a family ( X 2 = 4.70, p < 0.05), the respondent’s annual income ( X 2 = 20.82, p < 0.01) and employment status ( X 2 = 3.88, p < 0.05), and the number of outages in a month ( X 2 = 5.44, p < 0.05). Disruption of communication services (Y4) was found to be significantly correlated with only three explanatory variables, that is, number of people in the household ( X 2 = 4.08, p < 0.05), respondent’s annual income ( X 2 = 14.32, p < 0.01), and number of outages in a month ( X 2 = 7.56, p < 0.01). Disruption of academic activities (Y5) was significantly correlated with number of people in the household ( X 2 = 6.69, p < 0.01), respondent’s annual income ( X 2 = 6.78, p < 0.01), level of education completed ( X 2 = 4.60, p < 0.05), and number of outages in a month ( X 2 = 16.59, p < 0.01). Reduction in household earnings (Y6) was found to be significantly correlated with the respondent’s age ( X 2 = 9.34, p < 0.01), sex ( X 2 = 3.97, p < 0.05), annual income ( X 2 = 24.79, p < 0.01) and employment status ( X 2 = 10.50, p < 0.01), as well as with building ownership ( X 2 = 7.51, p < 0.01), number of outages in a month ( X 2 = 4.07, p < 0.05), and average duration of each outage ( X 2 = 8.89, p < 0.01). High expenditure on alternative energy sources (Y7) was significantly associated with the age ( X 2 = 13.59, p < 0.01), level of education ( X 2 = 10.27, p < 0.01) and employment status ( X 2 = 11.50, p < 0.01) of the respondent, and the average duration of each outage ( X 2 = 7.58, p < 0.01).
The number of outages in a month was correlated with all but one outage impact, that is, high expenditure on alternative energy sources (Y7), while outage duration was correlated with only three outage impacts. Among the socioeconomic variables, both the respondent’s annual income (X7) and employment status (X9) were significantly associated with five of the seven outage impacts, while level of education completed (X8) was associated with four outage impacts. Housing characteristics including occupying house as a family, home ownership, and household size were significantly correlated with one, two, and three outage impacts, respectively. With regard to demographic characteristics, age and gender were significantly associated with three and two outage impacts, respectively, while marital status was not significantly associated with any outage impact.

3.3.2. Bivariate Correlation Results: Multicollinearity Test for Household/Respondent Characteristics

Pearson correlation coefficients between variables under household socioeconomic, demographic, housing, and outage characteristics were calculated to test for multicollinearity. As shown in Table 5, some pairs of variables exhibited strong and statistically significant associations and were therefore multicollinear. These included age and marital status ( X 2 = 155.178, p < 0.01), marital status and occupying house as a family ( X 2 = 60.106, p < 0.01), home ownership and outage duration ( X 2 = 7.448, p < 0.01), family occupancy and household size ( X 2 = 46.864, p < 0.01), household size and outage frequency ( X 2 = 11.067, p < 0.01), annual income and level of education completed ( X 2 = 44.600, p < 0.01), annual income and employment status ( X 2  = 21.294, p < 0.01), and outage frequency and outage duration ( X 2 = 91.478, p < 0.01), among others. In regression analysis, using explanatory variables that are multicollinear compromises the accuracy of the model equation since one of the correlated predictor variables will be redundant.

3.4. Categorical Principal Component Analysis (CATPCA) Results

Categorical principal component analysis (CATPCA), a dimension reduction approach, was used to transform the correlated household characteristics (explanatory variables) into a smaller number of uncorrelated principal components which accounted for most of the variance in the data. The summary of the CATPCA model results obtained in this study are presented in Table 6 below.
As shown in Table 6, five dimensions/components were obtained. The components were identified basing on the Kaiser criterion (with varimax rotation), where components with eigenvalues greater than one (1) were deemed to have a significant contribution to the total variance of the transformed variables. The first component had an eigenvalue of 1.708 and contributed 15.527% to the total variance in the transformed variables. The second component (eigenvalue = 1.625) and the third component (eigenvalue = 1.564) explained 14.773% and 14.218% of the total variance, respectively. The fourth and the fifth components contributed 13.036% and 10.091% to the total variance accounted for, respectively. The selected components cumulatively accounted for a total variance of 67.645% in the original variables.
The loadings (correlation coefficients) between variables and components/dimensions are given in Table 7.
For each principal component, variables with correlation coefficient greater than 0.5 were deemed to have significant loading on the principal component. The variables that effectively loaded on each of the five components are highlighted in bold in Table 7. Component 1 (COMP 1) had positive loadings on respondents above 35 years of age (0.901) and those who are married or were married before (0.825). These variables mostly represented respondents who reached the adult stage of human growth. This component was, therefore, classified as adult respondents. Component 2 (COMP 2) had positive loadings on monthly outage frequency exceeding thirteen times (0.816) and average outage duration exceeding nine hours (0.833). This component depicted respondents who experience more power outages than others. Component 2 was, therefore, classified as high outage exposure respondents. The third component (COMP 3) had positive loadings on education attainment below tertiary level (0.760) and on employment status other than formal employment (0.760). This component also had a negative loading on annual income level exceeding 6000 Cedis (−0.603). The component represented those respondents who have a “low standing” in society as regards education, employment, and income. Component 3 was, therefore, classified as socio-economically disadvantaged respondents. Component 4 (COMP 4) loaded positively on respondents who are living with family members (0.737) and those living with five or more members in the household (0.775). This component, therefore, characterized respondents living in a large family setting, and it was classified as such. The fifth and final component (COMP 5) loaded positively on male respondents (0.818) as well as on respondents who own their homes (0.552). This component was categorized here as male homeowners.

3.5. Regression Modeling Results

In this section, model equations showing the relationships between reporting outage impacts and various respondent/household characteristics are presented. Specifically, principal components were used as the predictor variables in the place of individual respondent characteristics. Binary logistic regression was used since both the dependent and the independent variables had binary responses. Variables that were significantly associated with outage impacts were modeled according to the results presented in the corresponding tables below. Only the final model results, showing components that were significantly associated with the dependent variable, are presented. Several goodness of fit statistics including Hosmer and Lemeshow test, −2 log likelihood, Nagelkerke R Square, and overall predictive accuracy are also given.

3.5.1. Physical Assault, Y1

From the modeling results shown in Table 8, only two components, that is, high outage exposure and socio-economic disadvantage, were identified to be significantly associated with reporting physical assault as an outage impact in households. High outage exposure was found to be positively associated with reporting physical assault. Households that are exposed to more power outages were one and a half times more likely to report physical assault as an outage impact than those with less exposure to outages (odds ratio = 1.591; p < 0.05). On the other hand, socio-economic disadvantage exhibited a negative association with reporting of physical assault. The odds of reporting physical assault as an outage impact were more than four times lower for the socio-economically disadvantaged than for others (odds ratio = 0.246; p < 0.001). The model returned a Nagelkerke pseudo R2 statistic of 13.4%, and it accurately predicted 75.3% of the respondents’ answers.

3.5.2. Burglary (house break-in), Y2

The model results presented in Table 9 show that four components, that is, high outage exposure, socio-economic disadvantage, male homeowners, and living in a large family setting, were significantly associated with reporting burglary as a household outage impact. High outage exposure was positively associated while socio-economic disadvantage, male homeowners, and living in a large family setting were negatively associated. Households with high exposure to power outages were about three times more likely to report burglary as an outage impact than those with low outage exposure (odds ratio = 2.941; p = 0.000). Respondents who are male homeowners and those living in large family settings were 44.1% (odds ratio = 0.559; p = 0.004) and 41.6% (odds ratio = 0.584; p = 0.009), respectively, less likely to report burglary as an outage impact than others. The odds of the socio-economically disadvantaged reporting burglary as an impact of power outages were about two times lower (odds ratio = 0.507; p = 0.001) than for others. The model returned a Nagelkerke pseudo R2 statistic of 12.7%, and it accurately predicted 60.6% of the respondents’ answers.

3.5.3. Disruption of Water Supply, (Y3)

In Table 10, only two components are identified to be significantly associated with reporting disruption of water supply as an outage impact. Living in a large family setting was positively associated, while socio-economic disadvantage was negatively associated. Respondents who live in a large family setting were about two times more likely (odds ratio = 1.965; p = 0.018) to report outage-related disruption of water supply than those not living in a large family setting. Respondents categorized as being socio-economically disadvantaged were about 70% less likely (odds ratio = 0.304; p = 0.000) to report disruption of water supply due to power outages as compared to others. The model returned a Nagelkerke pseudo R2 statistic of 10.0%, and it accurately predicted 81.2% of the respondents’ answers.

3.5.4. Disruption of Academic Activities, (Y5)

The model results presented in Table 11 also show that two components were significantly associated with reporting disruption of academic/education activities as an outage impact. Both socio-economic disadvantage and high outage exposure were negatively associated with disruption of academic/education activities. Households categorized as being socio-economically disadvantaged were 32.5% less likely to report disruption of academic activities due to power outages than others (odds ratio = 0.675; p = 0.048). Respondents with high exposure to power outages were 57% less likely to report disruption of academic activities as an outage impact in their households (odds ratio = 0.428; p = 0.000) as compared to those with low outage exposure. The model returned a Nagelkerke pseudo R2 statistic of 6% and it accurately predicted 64.3% of the respondents’ answers.

3.5.5. Reduction of Household Earnings/Income, (Y6)

Variables that significantly predicted reporting of reduction of household income as an outage impact were modeled according to the results in Table 12. In the table, four components are shown to be significantly associated with reporting reduction of household income. Male homeowners and high exposure to outages were both positively associated with reporting reduction of household income because of outages, while adult respondents and socio-economic disadvantage were negatively associated. Adult respondents were more than two times less likely to report reduction of household income due to outages than others (odds ratio = 0.465; p = 0.004), while male homeowners were two times more likely to report outage-induced reduction of household income than others (odds ratio = 2.055; p = 0.006). Socio-economically disadvantaged households were over two and a half times less likely to report reduction of household income due to power outages than others (odds ratio = 0.374; p = 0.000), while those facing high exposure to power outages were about two and a half times more likely to report reduced household income as an outage impact than others (odds ratio = 2.517; p = 0.000). The model returned a Nagelkerke pseudo R2 statistic of 17.1%, and it accurately predicted 76.5% of the respondents’ answers.

3.5.6. High Expenditure on Alternative Energy Sources, (Y7)

From the model results presented in Table 13, three components—high outage exposure, adult respondents, and socio-economic disadvantage—were significantly associated with reporting high expenditure on alternative energy sources as an outage impact in Accra households. High outage exposure was positively associated, while both adult respondents and socio-economically disadvantaged households were negatively associated. Adult respondents were found to be about 65% less likely to report outage-induced high expenditure on alternative energy sources than others (odds ratio = 0.348; p = 0.002). Similarly, socio-economically disadvantaged households were 55% less likely to report high expenditure on alternative energy sources because of outages than others (odds ratio = 0.451; p = 0.009). Households that have high exposure to power outages were over two and a half times more likely to report high expenditure on alternative energy sources than those with lower exposure to outages (odds ratio = 2.700; p = 0.002). The model returned a Nagelkerke pseudo R2 statistic of 11.8%, and it accurately predicted 86.9% of the respondents’ answers.

4. Discussion

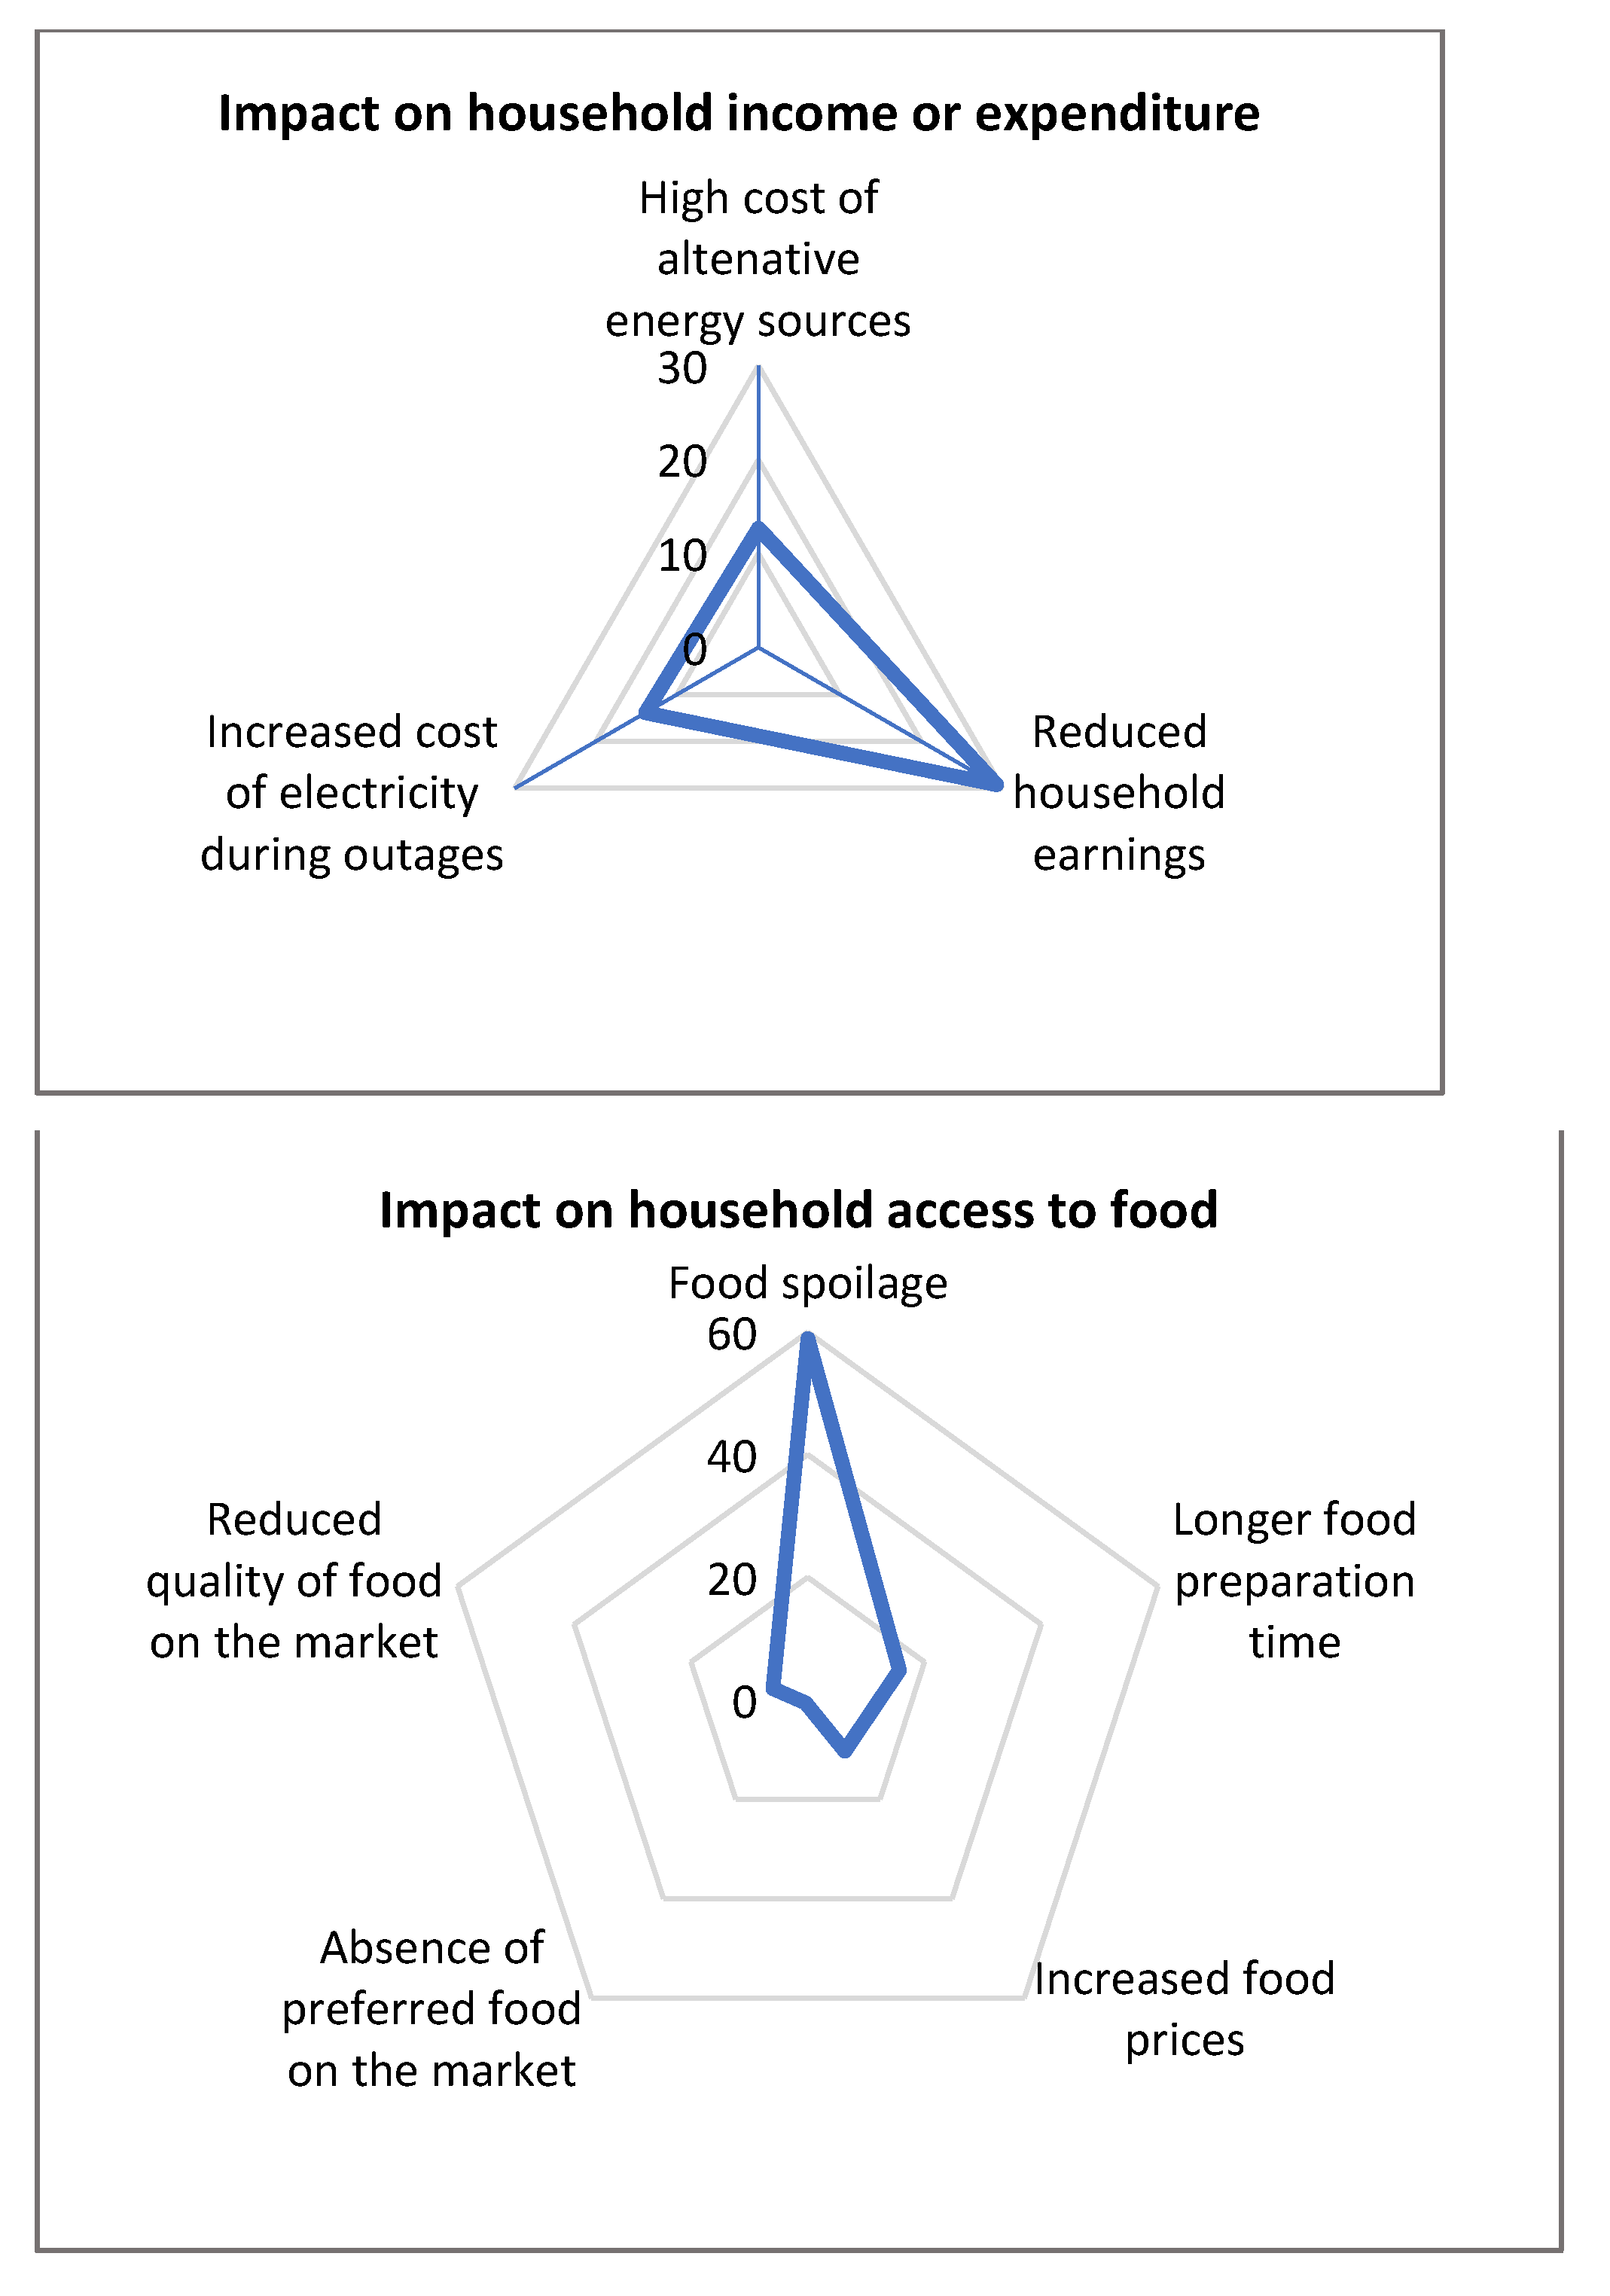
The analysis of responses from close to 500 household survey questionnaires administered in Accra, Ghana identified various impacts of power outages on households. Power outages were found to affect safety and security of households, damage household appliances, disrupt access to social services, affect food access/security, and diminish household income, among others. The most common impacts of outages identified in this study were food spoilage, burglary (house break-in), damage to refrigerators/freezers, disruption of communication services, disruption of academic activities, and damage to lighting appliances, all of which were reported by over thirty percent of the household respondents. Similar impacts/concerns related to power supply interruptions in homes were identified in other countries, including Ethiopia [5]. Furthermore, several social, economic, demographic, and outage characteristics, including respondent’s age and gender, income and employment status, household size and building ownership, as well as outage frequency and duration, were found to be significantly associated with reporting certain outage impacts. The authors did not find any study in the literature which directly linked reporting of specific power outage impacts with household characteristics. However, related studies in Ghana and elsewhere, which use WTP/WTA as an indicator of the value placed on reliable electricity (and consequently the impact of unreliable electricity), indirectly associated power outage impacts with several household factors including income, age, household size, education level, marital status, and gender of household head [22,40,42,43].
Beyond significant association, factors including socioeconomic disadvantage, high-outage exposure, and living in a large family setting, among others, were found to predict reporting of outage impacts. Being socioeconomically disadvantaged was found to predict (with a negative association) the reporting of outage impacts in all the regression models developed. This is likely because socioeconomically disadvantaged respondents are often less dependent on electricity for their wellbeing or day-to-day activities as compared to those of a higher socioeconomic standing. For example, socioeconomically disadvantaged people may not own electrical appliances such as televisions, air conditioners, and refrigerators and, therefore, possibly derive less direct value from having access to uninterrupted electricity. Because of this, they can be more insulated from impacts of power outages as compared to those of a higher socioeconomic status. The finding that socioeconomically disadvantaged respondents are less likely to report safety concerns (assault or burglary) as outage impacts may also be attributed to two reasons. First of all, socioeconomically disadvantaged people potentially live in “socioeconomically disadvantaged neighborhoods”, which—according to the social disorganization theory—usually have high concentration of crime [66,67]. Because of this, they may not associate having uninterrupted electricity with improved personal or household safety. Secondly, because they live in areas where they are exposed to a high risk of crime, socio-economically disadvantaged people may have already developed mechanisms to overcome existential threats to their safety. As noted by Silver [68], socioeconomically disadvantaged people living in “poor urban neighborhoods” may rely on community social networks to protect their property during electricity outages. Furthermore, the finding that the socioeconomically disadvantaged are less likely to report high expenditure on alternative energy sources during outages is in agreement with results from other studies. Silver [68] observed that, due to their precarious socioeconomic condition, the urban poor in Ghana are often not able to afford better outage coping options/technologies (e.g., solar photovoltaics, diesel generator) and mostly utilize low-cost options (candles and kerosene lamps) to cope with power supply interruptions in their households and communities.
The negative relations between socioeconomic disadvantage and disruption in water supply and disruption of academic activities also indicate that access to water and engagement in academic activities in socially and economically marginalized households are weakly (or not at all) linked to electricity supply. With regard to water supply, some studies in Ghana and elsewhere showed that the rich often have higher access to portable piped water (distributed by the water utility company) than the poor [69,70,71]. Water supply systems operated by utility companies utilize electricity to treat, pump, and distribute water over a wide geographic area. This makes water supply through these systems susceptible to disruptions during extended outages. Since socioeconomically disadvantaged people have limited access to piped water, they may be relatively insulated from the water supply disruptions that may be triggered by power outages. Additionally, the theory that associates access to electricity with increased participation in education activities is based on the assumption that access to electricity in households frees up children from undertaking some household chores (or need to participate in employment activities), and also allows them to participate in home-based academic activities [31,72]. However, considering that child employment in Ghana is linked to poverty, this assumption may not be relevant in households at the lowest levels of the socioeconomic ladder, where the economic contribution of every member of the household (including children) is considered vital for the survival of the family [73]. Therefore, children from such households are less likely to be aided by access to reliable electricity to attend school or undertake home-based academic activities and, as a result, are less likely to experience outage-related disruption to their academic activities.
High outage exposure, a combination of high outage frequency and duration, was found to predict (mostly with a positive relationship) the reporting a number of outage-impacts in households. This is generally in agreement with prior expectations and agrees with most existing outage research that associates increased outage frequency and/or duration to high outage-related losses [14]. A study of power outage costs in Cyprus found that the residential sector, which experienced most outages in summer 2011, also suffered the highest impact (economic losses) [24]. In this study, however, high outage exposure was also found to predict (with a negatively relationship) the likelihood to report disruption of academic activities due to outages. This is likely because households which are exposed to more outages are also more likely to have a higher level of preparedness for outages, for example, by adopting/utilizing outage coping options, such as backup diesel generation and candles. These can still support academic activities during outages, especially by providing light for studying during the night. However, some of these coping measures such as using candles, kerosene lamps, or rechargeable lamps may not effectively support academic activities especially for household members who use electronic gadgets (computers, tablets) for learning.
Living in a large family setting and being a male homeowner were other factors that predicted (with a negative relationship) the reporting of safety issues, particularly burglary, as an outage impact in households. There is a wide body of research that links family size to other socioeconomic factors. Large family size was shown to have a negative effect on schooling, food security, and mental health [74,75,76,77]. However, large family living can also confer some benefits, including social skills gained from interacting with siblings [78] and reduced likelihood of divorce or married couples who had more siblings in their childhood [79]. This study identified safety as an additional benefit of living in a large family, implying that households may derive safety from numbers. The contribution of male homeowners to improved household safety is potentially explained by two factors. Owning a home gives the owner leeway to make structural modifications necessary for improving the safety of the household [80]. Additionally, in many traditional African contexts, it is assumed that men are primarily responsible for providing security not just to their households but to the entire community [81]. Therefore, this finding brings to light the traditionally gendered roles still existing in some African societies. Large family living was also shown to predict a higher likelihood to report disruption in water supply due to outages. Large families are, indeed, expected to use more water than smaller households simply because of the many household members. However, when water supply in a given area is disrupted by outages, it is expected that every household connected to the water supply system is equally affected. In Accra, many households utilize water storage systems as a stopgap measure against any short-term shortfalls in piped water supply [69,82]. When a household size is big, water draw down from the water storage system is faster, and the potential for experiencing a water shortage is higher than for a smaller household.

5. Conclusions

Similar to many developing countries in Africa and other regions, the electricity supply system in Ghana experiences frequent disruptions that lead to electricity outages. The electricity outages affect not only business firms but also households, especially in urban areas where electricity access and consumption rates are high. This study examined the impacts that power outages have on households using a case study of Accra, Ghana and found these to be diverse. Household safety/security as well as access to food were found to be most affected by power outages. High exposure to outages and socioeconomic disadvantage were found to be determinants of reporting (or not reporting) several outage impacts. These findings imply, first of all, that improving electricity reliability can go a long way in improving safety and security in households/communities and minimizing food wastage towards achieving food security in developing countries. The findings also underscore the need to focus on eliminating, or at least reducing, frequent electricity disruptions/outages in all developing countries (not just Ghana) if sustainable social and economic development is to be achieved.
It is worth noting that modeling of some common outage impacts in households, for example, food spoilage and disruption of communication services, with household characteristics did not yield statistically significant results. Additionally, the predictive capacity of the identified predictor variables on reporting outage impacts is small. One possible reason for this is because, for the regression analyses, all predictor variables were coded as binary variables. Another reason is that other important predictor variables are potentially missing in the model equations. Therefore, adding all relevant predictor variables and using a different and broader variable coding approach would potentially improve the modeling results. Another limitation of this study is that it was carried out only across communities in the western part of the Accra metropolis, which were the case study communities for a larger research study by the researchers. Therefore, not all communities in Accra were included in this study. The above-mentioned limitations notwithstanding, the study reveals important insights into some of the factors associated with reporting of certain outage impacts in households. For example, the benefits of binary regression modeling go beyond having all significant predictor variables in the model equation. Through binary regression, relative odds of reporting (or not reporting) a particular outage impact across different socioeconomic categories of people were identified. This provides vital information on who is more (or less) likely impacted by outages and can guide implementation of targeted interventional measures to support coping with frequent power outages among the highly affected groups. Finally, building on the findings on this study, future research should look to broaden the study area and more systematically represent the outage experiences in all households across all the communities of Accra. Moreover, future studies may also consider examining the similarities and/or the differences in electricity outage impacts across large and small cities (potentially including rural areas) and whether similar factors drive reporting outage impacts across different urban scales.

Author Contributions

Conceptualization, P.N. and M.G.; methodology, P.N.; software, P.N.; validation, P.N.; formal analysis, P.N.; investigation, P.N.; data curation, P.N.; writing—original draft preparation, P.N.; writing—review and editing, A.Z. and M.G.; visualization, P.N.; supervision, A.Z. and M.G. All authors have read and agreed to the published version of the manuscript.

Funding

This research was carried out under the Water and Energy Security for Africa (WESA) project funded by the Germany Federal Ministry of Education and Research (BMBF) through its project management agency (DLR).

Data Availability Statement

The data presented in this study are available on request from the corresponding author. The data are not publicly available due to privacy.

Acknowledgments

The authors highly appreciate the support received from personnel of CSIR-Science and Technology Policy Research Institute (CSIR-STEPRI) in Accra, Ghana, especially Richard Ampadu-Ameyaw, Asafu-Adjaye Nana Yamoah, Karbo Ransford Teng-viel, and others who provided valuable support during the fieldwork, including providing working space and supporting the data collection exercise.

Conflicts of Interest

The authors declare no conflict of interest. The funders had no role in the design of the study; in the collection, analyses, or interpretation of data; in writing of the manuscript, or in the decision to publish the results.

References

  1. Blimpo, M.P.; Cosgrove-Davies, M. Electricity Access in Sub-Saharan Africa: Uptake, Reliability, and Complementary Factors for Economic Impact; The World Bank: Washington, DC, USA, 2019. [Google Scholar]
  2. Africa Progress Panel. Lights, Power, Action: Electrifying Africa; Africa Progress Panel: Geneva, Switzerland, 2017. [Google Scholar]
  3. IEA. World Energy Outlook 2019; International Energy Agency (IEA): Paris, France, 2019. [Google Scholar]
  4. Nduhuura, P.; Zerga, A.; Garschagen, M. Power Outages in Africa—An Assessment Based on Regional Power Pools. In Proceedings of the PAUWES Research-2-Practice Forum 2018, Tlemcen, Algeria, 16–18 April 2018. [Google Scholar]
  5. Meles, T.H. Impact of power outages on households in developing countries: Evidence from Ethiopia. Energy Econ. 2020, 91, 104882. [Google Scholar] [CrossRef]
  6. Oyuke, A.; Penar, P.H.; Howard, B. Off-Grid or ‘Off-on’: Lack of Access, Unreliable Electricity Supply Still Plague Majority of Africans; Afrobarometer: Accra, Ghana, 2016. [Google Scholar]
  7. Andersen, T.B.; Dalgaard, C.-J.L. Power outages and economic growth in Africa. Energy Econ. 2013, 38, 19–23. [Google Scholar] [CrossRef] [Green Version]
  8. Cole, M.A.; Elliott, R.J.; Occhiali, G.; Strobl, E. Power outages and firm performance in Sub-Saharan Africa. J. Dev. Econ. 2018, 134, 150–159. [Google Scholar] [CrossRef]
  9. Moyo, B. Power infrastructure quality and manufacturing productivity in Africa: A firm level analysis. Energy Policy 2013, 61, 1063–1070. [Google Scholar] [CrossRef]
  10. Diboma, B.; Tatietse, T.T. Power interruption costs to industries in Cameroon. Energy Policy 2013, 62, 582–592. [Google Scholar] [CrossRef]
  11. Ali, A. The Impact of Electricity Outages on Households; University of Toronto: Toronto, ON, Canada, 2016. [Google Scholar]
  12. ISSER. Guide to Electric Power in Ghana; Resource Center for Energy Economics and Regulation, Institute of Statistical, Social and Economic Research, University of Ghana: Accra, Ghana, 2005. [Google Scholar]
  13. Sakah, M.; Can, S.D.L.R.D.; Diawuo, F.A.; Sedzro, M.D.; Kuhn, C. A study of appliance ownership and electricity consumption determinants in urban Ghanaian households. Sustain. Cities Soc. 2019, 44, 559–581. [Google Scholar] [CrossRef]
  14. Praktiknjo, A.J.; Hähnel, A.; Erdmann, G. Assessing energy supply security: Outage costs in private households. Energy Policy 2011, 39, 7825–7833. [Google Scholar] [CrossRef] [Green Version]
  15. Sullivan, M.J.; Mercurio, M.; Schellenberg, J. Estimated Value of Service Reliability for Electric Utility Customers in the United States; Lawrence Berkeley National Lab. (LBNL): Berkeley, CA, USA, 2009. [Google Scholar]
  16. Wolf, A.; Wenzel, L. Regional diversity in the costs of electricity outages: Results for German counties. Util. Policy 2016, 43, 195–205. [Google Scholar] [CrossRef] [Green Version]
  17. Shivakumar, A.; Welsch, M.; Taliotis, C.; Jakšić, D.; Baričević, T.; Howells, M.; Gupta, S.; Rogner, H. Valuing blackouts and lost leisure: Estimating electricity interruption costs for households across the European Union. Energy Res. Soc. Sci. 2017, 34, 39–48. [Google Scholar] [CrossRef]
  18. Pepermans, G. The value of continuous power supply for Flemish households. Energy Policy 2011, 39, 7853–7864. [Google Scholar] [CrossRef]
  19. Morrissey, K.; Plater, A.; Dean, M. The cost of electric power outages in the residential sector: A willingness to pay approach. Appl. Energy 2018, 212, 141–150. [Google Scholar] [CrossRef]
  20. Ozbafli, A.; Jenkins, G.P. The willingness to pay by households for improved reliability of electricity service in North Cyprus. Energy Policy 2015, 87, 359–369. [Google Scholar] [CrossRef]
  21. Hensher, D.A.; Shore, N.; Train, K. Willingness to pay for residential electricity supply quality and reliability. Appl. Energy 2014, 115, 280–292. [Google Scholar] [CrossRef]
  22. Taale, F.; Kyeremeh, C. Households׳ willingness to pay for reliable electricity services in Ghana. Renew. Sustain. Energy Rev. 2016, 62, 280–288. [Google Scholar] [CrossRef] [Green Version]
  23. Woo, C.; Ho, T.; Shiu, A.; Cheng, Y.; Horowitz, I.; Wang, J. Residential outage cost estimation: Hong Kong. Energy Policy 2014, 72, 204–210. [Google Scholar] [CrossRef]
  24. Zachariadis, T.; Poullikkas, A. The costs of power outages: A case study from Cyprus. Energy Policy 2012, 51, 630–641. [Google Scholar] [CrossRef]
  25. Dang, D.A.; La, H.A. Does electricity reliability matter? Evidence from rural Viet Nam. Energy Policy 2019, 131, 399–409. [Google Scholar] [CrossRef]
  26. Samad, H.; Zhang, F. Benefits of Electrification and the Role of Reliability: Evidence from India; World Bank: Washington, DC, USA, 2016. [Google Scholar]
  27. Farquharson, D.; Jaramillo, P.; Samaras, C. Sustainability implications of electricity outages in sub-Saharan Africa. Nat. Sustain. 2018, 1, 589–597. [Google Scholar] [CrossRef]
  28. Koroglu, M.; Irwin, B.R.; Grépin, K.A. Effect of power outages on the use of maternal health services: Evidence from Maharashtra, India. BMJ Glob. Health 2019, 4, e001372. [Google Scholar] [CrossRef] [PubMed] [Green Version]
  29. Apenteng, B.A.; Opoku, S.T.; Ansong, D.; Akowuah, E.A.; Afriyie-Gyawu, E. The effect of power outages on in-facility mortality in healthcare facilities: Evidence from Ghana. Glob. Public Health 2016, 13, 545–555. [Google Scholar] [CrossRef] [PubMed]
  30. Lipscomb, M.; Mobarak, A.M.; Barham, T. Development Effects of Electrification: Evidence from the Topographic Placement of Hydropower Plants in Brazil. Am. Econ. J. Appl. Econ. 2013, 5, 200–231. [Google Scholar] [CrossRef] [Green Version]
  31. Manuel, B.; Maximo, T. Electrification and Time Allocation: Experimental Evidence from Northern El Salvador. Available online: https://mpra.ub.uni-muenchen.de/63782/ (accessed on 5 October 2019).
  32. Bombande, G.; Abdulai, J. Burning the Midnight Candle: Power Outages (Dumsor) on a University Campus. Available online: https://circumspecte.com/2016/02/burning-the-midnight-candle-power-outages-dumsor-on-a-university-campus/ (accessed on 20 January 2020).
  33. Cobbinah, P.B.; Adams, E.A. Urbanization and Electric Power Crisis in Ghana: Trends, Policies, and SocioEconomic Implications. In Urbanization and Its Impact on Socio-Economic Growth in Developing Regions; IGI Global: Hershey, PA, USA, 2018; pp. 262–284. [Google Scholar]
  34. Maxouris, C. On the Exact Same Day 42 Years Ago, A New York Power Outage Turned into A Crime Rampage. Available online: https://edition.cnn.com/2019/07/14/us/new-york-city-power-outage-42-years-trnd/index.html (accessed on 27 September 2019).
  35. Carter, T.J. Men Take Advantage of Power Outage Curfew to stEal from Cars, California Cops Say. Available online: https://www.sacbee.com/news/california/article235999878.html (accessed on 8 January 2020).
  36. McGreal, C. Power Cuts a Good Sign, Sceptical South Africans Told. Available online: https://www.theguardian.com/world/2008/jan/21/southafrica.chrismcgreal (accessed on 15 January 2020).
  37. Danso-Wiredu, E.Y.; Dadson, Y.I.; Amoako-Andoh, F.O. Social, Economic and Environmental Impacts of the Recent Electricity Crisis in Ghana: A Study of Winneba. J. Soc. Sci. 2016, 49, 277–288. [Google Scholar] [CrossRef]
  38. Aklorbortu, M.D. Security Alert: Police Intensify Patrols during ‘Dumsor Dumsor’. Available online: https://www.graphic.com.gh/news/general-news/security-alert-police-intensify-patrols-during-dumsor-dumsor.html (accessed on 14 April 2020).
  39. Addai, E.K.; Tulashie, S.K.; Annan, J.-S.; Yeboah, I. Trend of Fire Outbreaks in Ghana and Ways to Prevent These Incidents. Saf. Health Work. 2016, 7, 284–292. [Google Scholar] [CrossRef] [Green Version]
  40. Amoah, A.; Ferrini, S.; Schaafsma, M. Electricity outages in Ghana: Are contingent valuation estimates valid? Energy Policy 2019, 135, 110996. [Google Scholar] [CrossRef]
  41. Abdullah, S.; Mariel, P. Choice experiment study on the willingness to pay to improve electricity services. Energy Policy 2010, 38, 4570–4581. [Google Scholar] [CrossRef]
  42. Abrate, G.; Bruno, C.; Erbetta, F.; Fraquelli, G.; Lorite-Espejo, A. A choice experiment on the willingness of households to accept power outages. Util. Policy 2016, 43, 151–164. [Google Scholar] [CrossRef]
  43. Osiolo, H.H. Willingness to pay for improved energy: Evidence from Kenya. Renew. Energy 2017, 112, 104–112. [Google Scholar] [CrossRef]
  44. Kim, K.; Nam, H.; Cho, Y. Estimation of the inconvenience cost of a rolling blackout in the residential sector: The case of South Korea. Energy Policy 2015, 76, 76–86. [Google Scholar] [CrossRef]
  45. Amoah, A.; Larbi, D.A.; Offei, D.; Panin, A. In gov we trust: The less we pay for improved electricity supply in Ghana. Energy Sustain. Soc. 2017, 7, 29. [Google Scholar] [CrossRef] [Green Version]
  46. Kumi, E.N. The Electricity Situation in Ghana: Challenges and Opportunities; Center for Global Development: Washington, DC, USA, 2017. [Google Scholar]
  47. Energy Commission of Ghana. National Energy Statistics, 2009–2018; Energy Commission of Ghana: Accra, Ghana, 2019.
  48. Adusah-Poku, F.; Takeuchi, K. Energy poverty in Ghana: Any progress so far? Renew. Sustain. Energy Rev. 2019, 112, 853–864. [Google Scholar] [CrossRef]
  49. Energy Commission of Ghana. National Energy Statistics, 2006–2015; Energy Commission of Ghana: Accra, Ghana, 2016.
  50. Gyamfi, S.; Modjinou, M.; Djordjevic, S. Improving electricity supply security in Ghana—The potential of renewable energy. Renew. Sustain. Energy Rev. 2015, 43, 1035–1045. [Google Scholar] [CrossRef] [Green Version]
  51. Mahama, M.; Derkyi, N.S.A.; Nwabue, C.M. Challenges of renewable energy development and deployment in Ghana: Perspectives from developers. Geojournal 2021, 86, 1425–1439. [Google Scholar] [CrossRef]
  52. USAID. An Energy Roadmap for Ghana: From Crisis to the Fuel for ‘Economic Freedom’; USAID: Accra, Ghana, 1999. [Google Scholar]
  53. Abrokwa, K.K.; Dramani, J.B.; Bhattarai, K. The effect of electricity technical losses on Ghana’s economy: A simulation evaluation. OPEC Energy Rev. 2017, 41, 286–317. [Google Scholar] [CrossRef]
  54. Eshun, M.E.; Amoako-Tuffour, J. A review of the trends in Ghana’s power sector. Energy, Sustain. Soc. 2016, 6, 9. [Google Scholar] [CrossRef] [Green Version]
  55. CEPA. The Energy Crisis and Growth Performance of the Economy; Centre for Policy Analysis: Accra, Ghana, 2007. [Google Scholar]
  56. Sakah, M.; Diawuo, F.A.; Katzenbach, R.; Gyamfi, S. Towards a sustainable electrification in Ghana: A review of renewable energy deployment policies. Renew. Sustain. Energy Rev. 2017, 79, 544–557. [Google Scholar] [CrossRef]
  57. Energy Commission of Ghana. 2017 Energy (Supply and Demand) Outlook for Ghana; Energy Commission of Ghana: Accra, Ghana, 2017.
  58. Montgomery, M.R. The Urban Transformation of the Developing World. Science 2008, 319, 761–764. [Google Scholar] [CrossRef] [Green Version]
  59. UNDESA. World Urbanization Prospects: The 2018 Revision; United Nations: New York, NY, USA, 2019. [Google Scholar]
  60. GSS. 2010 Population and Housing Census Report: Urbanization; Ghana Statistical Service (GSS): Accra, Ghana, 2014. [Google Scholar]
  61. Jones, D.W. How urbanization affects energy-use in developing countries. Energy Policy 1991, 19, 621–630. [Google Scholar] [CrossRef]
  62. IPCC. Summary for Policymakers. In Climate Change 2014: Mitigation of Climate Change. Contribution of Working Group III to the Fifth Assessment Report of the Intergovernmental Panel on Climate Change; Cambridge University Press: Cambridge, UK; New York, NY, USA, 2014. [Google Scholar]
  63. GSS. Ghana Living Standards Survey (GLSS) 7: Main Report; Ghana Statistical Service (GSS): Accra, Ghana, 2019. [Google Scholar]
  64. Nduhuura, P.; Garschagen, M.; Zerga, A. Mapping and Spatial Analysis of Electricity Load Shedding Experiences: A Case Study of Communities in Accra, Ghana. Energies 2020, 13, 4280. [Google Scholar] [CrossRef]
  65. Arku, G.; Luginaah, I.; Mkandawire, P.; Baiden, P.; Asiedu, A.B. Housing and health in three contrasting neighbourhoods in Accra, Ghana. Soc. Sci. Med. 2011, 72, 1864–1872. [Google Scholar] [CrossRef]
  66. Sampson, R.J.; Groves, W.B. Community Structure and Crime: Testing Social-Disorganization Theory. Am. J. Sociol. 1989, 94, 774–802. [Google Scholar] [CrossRef] [Green Version]
  67. Sampson, R.J.; Raudenbush, S.W.; Earls, F. Neighborhoods and Violent Crime: A Multilevel Study of Collective Efficacy. Science 1997, 277, 918–924. [Google Scholar] [CrossRef] [PubMed]
  68. Silver, J. Disrupted Infrastructures: An Urban Political Ecology of Interrupted Electricity in Accra. Int. J. Urban Reg. Res. 2015, 39, 984–1003. [Google Scholar] [CrossRef]
  69. Songsore, J. Environmental and Structural Inequalities in Greater Accra. J. Int. Inst. 2008, 16, 8–9. [Google Scholar]
  70. Adams, E.A.; Boateng, G.O.; Amoyaw, J.A. Socioeconomic and Demographic Predictors of Potable Water and Sanitation Access in Ghana. Soc. Indic. Res. 2016, 126, 673–687. [Google Scholar] [CrossRef]
  71. Smith, L.; Hanson, S. Access to Water for the Urban Poor in Cape Town: Where Equity Meets Cost Recovery. Urban Stud. 2003, 40, 1517–1548. [Google Scholar] [CrossRef]
  72. FEEM. Access to Energy and Economic Development in Ghana; Fondazione Eni Enrico Mattei (FEEM): Milano, Italia, 2017. [Google Scholar]
  73. Adonteng-Kissi, O. Causes of child labour: Perceptions of rural and urban parents in Ghana. Child. Youth Serv. Rev. 2018, 91, 55–65. [Google Scholar] [CrossRef]
  74. Maralani, V. The changing relationship between family size and educational attainment over the course of socioeconomic development: Evidence from Indonesia. Demography 2008, 45, 693–717. [Google Scholar] [CrossRef] [PubMed]
  75. Obayelu, A.E. Households’ food security status and its determinants in the North-Central Nigeria. Food Econ. 2012, 9, 241–256. [Google Scholar] [CrossRef]
  76. Sani, S.; Kemaw, B. Analysis of households food insecurity and its coping mechanisms in Western Ethiopia. Agric. Food Econ. 2019, 7, 5. [Google Scholar] [CrossRef] [Green Version]
  77. Grinde, B.; Tambs, K. Effect of household size on mental problems in children: Results from the Norwegian Mother and Child Cohort study. BMC Psychol. 2016, 4, 31. [Google Scholar] [CrossRef] [Green Version]
  78. Dunn, J. Sibling Influences on Childhood Development. J. Child Psychol. Psychiatry 1988, 29, 119–127. [Google Scholar] [CrossRef] [PubMed]
  79. Bobbitt-Zeher, D.; Downey, D.B.; Merry, J. Number of Siblings During Childhood and the Likelihood of Divorce in Adulthood. J. Fam. Issues 2016, 37, 2075–2094. [Google Scholar] [CrossRef] [PubMed] [Green Version]
  80. Keall, E.C.M.; Bennett, J.; Marshall, A.; Telfar-Barnard, L.; Thornley, L.; Howden-Chapman, P. Why don’t owners improve their homes? Results from a survey following a housing warrant-of-fitness assessment for health and safety. Aust. N. Z. J. Public Health 2019, 43, 221–227. [Google Scholar]
  81. Saferworld. Masculinities, Conflict and Peacebuilding: Perspectives on Men through a Gender Lens; Saferworld: London, UK, 2014. [Google Scholar]
  82. Peloso, M.; Morinville, C. ‘Chasing for Water’: Everyday Practices of Water Access in PeriUrban Ashaiman, Ghana. Water Altern. 2014, 7, 121–139. [Google Scholar]
Figure 1. Trends in Ghana’s electricity generation mix, 2007–2018 [47,49].
Energies 14 03676 g001
Figure 2. Trends in Ghana’s annual electricity consumption by sector, 2007–2018 [47,49].
Energies 14 03676 g002
Figure 3. Reported impacts of electricity outages in percent of households.
Energies 14 03676 g003aEnergies 14 03676 g003b
Table 1. Electricity access and reliability rates in select African countries.
CountryElectricity Access Rate (%)Level of Electricity Supply Reliability in Households (%)
Algeria>9989
Egypt>9989
South Africa9581
Senegal6980
Kenya7577
Mozambique2961
Zambia3758
Tanzania3754
Ghana8442
Uganda2336
Nigeria6018
Guinea2712
Source: [3,6].
Table 2. Select impacts of outages in Accra households.
Dependent VariableDescription of Dependent VariableResponse (Code)
Y1Increased instances of or concern about physical assault/injuryYes (1), No (0)
Y2Increased instances of or concern about burglary or house break-inYes (1), No (0)
Y3Increased instances of or concern about disruption of water supplyYes (1), No (0)
Y4Increased instances of or concern about disruption of communication servicesYes (1), No (0)
Y5Increased instances of or concern about disruption of academic activitiesYes (1), No (0)
Y6Increased instances of or concern about reduction of household earningsYes (1), No (0)
Y7Increased instances of or concern about high expenditure on alternative energy sourcesYes (1), No (0)
Table 3. Descriptive statistics of select household/respondent characteristics (coded as binary responses).
Variable CategoriesCodeVariableMeasurementMeanStandard Deviation
Demographic characteristicsX1AgeLess than 35 years = 0, 35 years or more = 10.480.50
X2SexFemale = 0, Male = 10.490.50
X3Marital statusSingle–Never married = 0, Married/cohabiting/divorced/widowed = 10.560.497
Housing characteristicsX4Occupying house as a familyNo = 0, Yes =10.660.474
X5Home ownershipNot self-owned = 0, Self-owned = 10.300.458
X6Household sizeLess than 5 occupants = 0, 5 or more occupants = 10.380.486
Socioeconomic characteristicsX7Annual income<6000 Ghana Cedis = 0, >=6000 Ghana Cedis = 10.500.501
X8Level of education completedTertiary level = 0, Below tertiary level = 10.610.489
X9Employment statusFormal employment = 0, Informal employment/unemployed = 10.580.494
Outage characteristicsX10Outage frequency per month<=13 times = 0, >13 times = 10.340.474
X11Average duration per outage<=9 h = 0, >9 h = 10.250.431
Tertiary level is defined here to include university level education or any other post-secondary school training such as vocational and technical training.
Table 4. Bivariate correlation results between reported outage impacts and select household characteristics.
X1X2X3X4X5X6X7X8X9X10X11
Y14.006 **1.3730.1750.0160.9451.7996.046 **0.00243.540 ***4.146 **2.628
Y21.5738.039 ***0.3840.0085.742 **4.823 **0.1144.187 **7.177 ***21.525 ***19.788 ***
Y30.1902.7131.8834.698 **0.0280.00120.824 ***1.3243.877 **5.437 **2.255
Y40.4980.0000.0031.7040.3574.083 **14.321 ***1.3890.1807.556 ***0.496
Y50.0010.9741.7560.2550.0836.690 ***6.778 ***4.598 **1.21616.548 ***3.297
Y69.335 ***3.973 **3.4980.7727.508 ***0.35524.786 ***3.65510.500 ***4.071 **8.891 ***
Y713.593 ***3.3210.8340.0311.2770.6620.52110.266 ***11.503 ***1.6637.578 ***
X1 = age, X2 = sex, X3 = marital status, X4 = occupying house as a family, X5 = home ownership, X6 = household size, X7 = annual income, X8 = level of education completed, X9 = employment status, X10 = outage frequency per month, X11 = average duration per outage, Y1 = physical assault/injury, Y2 = burglary/housebreak in, Y3 = disruption of water supply, Y4 = disruption of communication services, Y5 = disruption of academic activities, Y6 = reduction of household income, Y7 = high expenditure on alternative energy sources. ** and *** indicate statistical significance level of p < 0.05 and p < 0.01, respectively.
Table 5. Bivariate correlation results between household characteristics.
X1X2X3X4X5X6X7X8X9X10X11
X1 9.386 ***155.178 ***27.426 ***0.17111.020 ***13.185 ***1.2590.2580.6941.674
X2 17.260 **8.473 ***1.0770.4082.84010.997 ***2.1375.354 **0.953
X3 60.106 ***0.0063.4281.2520.7586.720 **0.9240.101
X4 6.079 **46.864 ***05820.2010.6580.9324.680 **
X5 3.937 **1.4460.1890.0770.7237.448 ***
X6 0.1140.3791.83011.067 ***0.754
X7 44.600 ***21.294 ***2.8217.062 ***
X8 32.339 ***3.0051.442
X9 0.2965.148 **
X10 91.478 ***
X11
X1 = age, X2 = sex, X3 = marital status, X4 = occupying house as a family, X5 = home ownership, X6 = household size, X7 = annual income, X8 = level of education completed, X9 = employment status, X10 = outage frequency per month, X11 = average duration per outage. ** and *** indicate statistical significance level of p < 0.05 and p < 0.01, respectively.
Table 6. Model summary for CATPCA.
DimensionCronbach’s AlphaVariance Accounted for
Total (Eigenvalue)Percentage of Variance
10.4811.70815.527
20.4031.62514.773
30.3881.56414.218
40.3641.43413.036
50.1401.11010.091
Total0.952 a7.44167.645
Rotation Method: Varimax with Kaiser normalization. a. Total Cronbach’s alpha is based on the total Eigenvalue.
Table 7. Matrix of rotated component loadings.
VariablesDimension
12345
Age0.901−0.0820.0420.0790.005
Sex−0.119−0.125−0.149−0.1350.818
Marital status0.8270.096−0.0550.188−0.166
Occupying house as a family0.2920.140−0.0550.737−0.163
Home ownership−0.0260.2760.0990.3830.552
Household size0.037−0.2400.0570.7750.126
Annual income0.305−0.185−0.603−0.2030.174
Level of education completed0.0920.1020.760−0.005−0.115
Employment status0.030−0.1900.760−0.0800.135
Outage frequency per month0.0670.8160.050−0.165−0.051
Average duration per outage−0.0600.833−.0170.0880.045
Variable principal normalization. Rotation method: Varimax with Kaiser normalization.
Table 8. Multivariate regression results between physical assault and explanatory variables.
BS.E.WaldDfSig.Exp(B)95% C.I. for EXP(B)
LowerUpper
Model (Y1)COMP 2 (1)0.4640.2314.03410.0451.5911.0112.503
COMP 3 (1)−1.4020.22837.79410.0000.2460.1570.385
Constant−0.5910.16812.37210.0000.554
Goodness of fit statistics−2 log likelihood 484.988
Nagelkerke R square 0.134
Hosmer and Lemeshow test 2.987 0.225
Overall predictive accuracy 75.3%
Y1 = physical assault, COMP 2 = high outage exposure, COMP 3 = socio-economic disadvantage.
Table 9. Multivariate regression results between burglary and explanatory variables.
BS.E.WaldDfSig.Exp(B)95% C.I. for EXP(B)
LowerUpper
Model (Y2)COMP 5 (1)−0.5810.2028.24010.0040.5590.3760.832
COMP 4 (1)−0.5380.2056.86810.0090.5840.3900.873
COMP 3 (1)−0.6790.20810.63110.0010.5070.3370.763
COMP 2 (1)1.0790.23820.47210.0002.9411.8434.692
Constant0.6540.2188.97610.0031.923
Goodness of fit statistics−2 log likelihood 581.372
Nagelkerke R square 0.127
Hosmer and Lemeshow test 10.775 0.149
Overall predictive accuracy 60.6%
Y2 = burglary, COMP 2 = high outage exposure, COMP 3 = socio-economic disadvantage, COMP 4 = living in a large family setting, COMP 5 = male homeowners.
Table 10. Multivariate regression results between disruption in water supply and predictor variables.
BS.E.WaldDfSig.Exp(B)95% C.I. for EXP(B)
LowerUpper
Model (Y3)COMP 4 (1)0.6760.2865.58910.0181.9651.1223.441
COMP 3 (1)−1.1920.27418.96610.0000.3040.1780.519
Constant−1.4360.25831.02510.0000.238
Goodness of fit statistics−2 log likelihood 388.674
Nagelkerke R square 0.100
Hosmer and Lemeshow test 4.418 0.110
Overall predictive accuracy 81.2%
Y3 = disruption of water supply, COMP 3 = socio-economic disadvantage, COMP 4 = living in a large family setting.
Table 11. Multivariate regression results between disruption of academic activities and predictor variables.
BS.E.WaldDfSig.Exp(B)95% C.I. for EXP(B)
LowerUpper
Model (Y5)COMP 3 (1)−0.3930.1983.91510.0480.6750.4580.996
COMP 2 (1)−0.8500.21915.08310.0000.4280.2790.657
Constant−0.0900.1610.31410.5750.914
Goodness of fit statistics−2 log likelihood 599.328
Nagelkerke R square 0.060
Hosmer and Lemeshow test 0.060 0.970
Overall predictive accuracy 64.3%
Y5 = disruption of academic activities, COMP 2 = high outage exposure, COMP 3 = socio-economic disadvantage.
Table 12. Multivariate regression results between reduction of household income and predictor variables.
BS.E.WaldDfSig.Exp(B)95% C.I. for EXP(B)
LowerUpper
Model estimates (Y6)COMP 1 (1)−0.7660.2688.19310.0040.4650.2750.785
COMP 5 (1)0.7200.2657.40810.0062.0551.2233.453
COMP 3 (1)−0.9830.26613.63210.0000.3740.2220.630
COMP 2 (1)0.9230.25912.72310.0002.5171.5164.179
Constant−1.1660.26918.73110.0000.312
Goodness of fit statistics−2 log likelihood 384.699
Nagelkerke R square 0.171
Hosmer and Lemeshow test 3.722 0.881
Overall predictive accuracy 76.5%
Y6 = reduction of household income, COMP 1 = adult respondents, COMP 2 = high outage exposure, COMP 3 = socio-economic disadvantage, COMP 5 = male homeowners.
Table 13. Multivariate regression results between high expenditure on alternative energy sources and predictor variables.
BS.E.WaldDfSig.Exp(B)95% C.I. for EXP(B)
LowerUpper
Model estimates (Y7)COMP 1 (1)−1.0560.33410.01310.0020.3480.1810.669
COMP 2 (1)0.9930.3179.80210.0022.7001.4505.027
COMP 3 (1)−0.7960.3066.78410.0090.4510.2480.821
Constant−1.3580.25328.85810.0000.257
Goodness of fit statistics−2 log likelihood 293.089
Nagelkerke R square 0.118
Hosmer and Lemeshow test 0.335 0.997
Overall predictive accuracy 86.9%
Y7 = high expenditure on alternative energy sources, COMP 1 = adult respondents, COMP 2 = high outage exposure, COMP 3 = socio-economic disadvantage.
Publisher’s Note: MDPI stays neutral with regard to jurisdictional claims in published maps and institutional affiliations.

