Article

A Comprehensive Risk Assessment Framework for Synchrophasor Communication Networks in a Smart Grid Cyber Physical System with a Case Study

1
School of Electronics Engineering, Kalinga Institute of Industrial Technology, Bhubaneswar 751024, India
2
Faculty of Electronics, Communication and Computers, University of Pitesti, 110040 Pitesti, Romania
3
ICSI Energy, National Research and Development Institute for Cryogenic and Isotopic Technologies, 240050 Ramnicu Valcea, Romania
4
Development Institute for Cryogenic and Isotopic Technologies, 240050 Ramnicu Valcea, Romania
5
Doctoral School, Polytechnic University of Bucharest, 313 Splaiul Independentei, 060042 Bucharest, Romania
*
Author to whom correspondence should be addressed.
Energies 2021, 14(12), 3428; https://doi.org/10.3390/en14123428
Submission received: 17 May 2021 / Revised: 3 June 2021 / Accepted: 6 June 2021 / Published: 10 June 2021
(This article belongs to the Special Issue Fuel Cell Renewable Hybrid Power Systems 2021)

Abstract

:
The smart grid (SG), which has revolutionized the power grid, is being further improved by using the burgeoning cyber physical system (CPS) technology. The conceptualization of SG using CPS, which is referred to as the smart grid cyber physical system (SGCPS), has gained a momentum with the synchrophasor measurements. The edifice of the synchrophasor system is its communication network referred to as a synchrophasor communication network (SCN), which is used to communicate the synchrophasor data from the sensors known as phasor measurement units (PMUs) to the control center known as the phasor data concentrator (PDC). However, the SCN is vulnerable to hardware and software failures that introduce risk. Thus, an appropriate risk assessment framework for the SCN is needed to alleviate the risk in the protection and control of the SGCPS. In this direction, a comprehensive risk assessment framework has been proposed in this article for three types of SCNs, namely: dedicated SCN, shared SCN and hybrid SCN in an SGCPS. The proposed framework uses hardware reliability as well as data reliability to evaluate the associated risk. A simplified hardware reliability model has been proposed for each of these networks, based on failure probability to assess risk associated with hardware failures. Furthermore, the packet delivery ratio (PDR) metric is considered for measuring risk associated with data reliability. To mimic practical shared and hybrid SCNs, the risk associated with data reliability is evaluated for different background traffics of 70%, 80% and 95% using 64 Kbps and 300 Kbps PMU data rates. The analytical results are meticulously validated by considering a case study of West Bengal’s (a state in India) power grid. With respect to the case study, different SCNs are designed and simulated using the QualNet network simulator. The simulations are performed for dedicated SCN, shared SCN and hybrid SCN with 64 Kbps and 300 Kbps PMU data rates. The simulation results are comprehensively analyzed for risk hedging of the proposed SCNs with data reliability and hardware reliability. To summarize, the mean risk with data reliability (RwDR) as compared to the mean risk with hardware reliability (RwHR) increases in shared SCN and hybrid SCN by a factor of 17.108 and 23.278, respectively. However, minimum RwDR increases in shared and hybrid SCN by a factor of 16.005 and 17.717, respectively, as compared to the corresponding minimum RwHR. The overall analysis reveals that the RwDR is minimum for dedicated SCN, moderate for shared SCN, and highest for hybrid SCN.

1. Introduction

The existing power grid infrastructure is considered as an engineering marvel [1]. However, these traditional power grids cannot cope with the increasing demand for reliable power and are susceptible to formidable challenges due to enormous vulnerabilities [2,3]. Moreover, the streamlining of renewable energy sources, incorporation of advanced metering, dynamic pricing, etc., are some of the other problems that plague the traditional power grids. These versatile challenges have necessitated the upgradation of the traditional power grid into the smart grid (SG) [4]. The SG is further revolutionized by incorporating the burgeoning cyber physical system (CPS) technology [5]. The smart grid from the cyber physical system perspective is referred to as a smart grid cyber physical system (SGCPS) [6].
In the paradigm of CPS, the physical system of an SGCPS is the power grid electrical infrastructure, whereas the networking infrastructure to support data exchange and data interpretation is the cyber system of the SGCPS [7]. Of the several applications of the SGCPS such as the advanced metering, dynamic pricing, demand–load balancing, grid optimization, smart management, etc. [8,9], the synchrophasor measurement system is an important application that provides real-time monitoring and control capabilities to the SGCPS [10]. In the synchrophasor measurement system, several sensors known as phasor measurement units (PMUs) are installed on different electrical buses, which monitor the health of the grid. The data pertaining to the health of the grid measured by the PMU are known as synchrophasor data, which are primarily a time-synchronized measurement of voltage and current phasors [11]. The synchrophasor data are communicated to the control center known as the phasor data concentrator (PDC) for providing monitoring and controlling capabilities to the SGCPS [12]. The edifice of the synchrophasor applications is the communication network, which is used to for communication of data between the PMUs and the PDC. Such a communication network is referred to as a synchrophasor communication network (SCN) [13]. Synchrophasor measurements have a wide range of applications such as grid monitoring, power quality monitoring, stability maintenance of the smart grid, control of the smart grid, load balancing, protection of the smart grid, minimizing grid outage probability for the distributed grid, etc., [14]. These applications can be achieved using the SCNs by the reliable exchange of synchrophasor data.
The SCN is a complex interconnected network, which is susceptible to many challenges which hinder the effective monitoring and control operations of the SGCPS [15]. Many testbeds have been proposed in the literature to evaluate the SG’s performance from various aspects. From the architectural perspective, a contemporary survey related to the challenges and their solutions in the SGCPS paradigm was presented by Smadi et al. [16]. Further, Cintuglu et al. in [17], presented an elaborative survey on the SGCPS testbeds. Moreover, some of the other key simulation-oriented software across various domains of the SGCPS are Sandia Lab [18] for wide area situational awareness and cyber security; Virtual Power System testbed [19] for cyber security; Queensland University’s test bed [20] for network communication Kanas State University’s testbed [21] for wide area situational awareness and network communication; PowerCyber Testbed [22] for wide area situational awareness and cyber security; Cybersecurity Testbed for IEC61850 [23], etc. However, a testbed or an assessment framework is needed to evaluate the risk associated with the SCNs in an SGCPS.
In [24], authors reported a risk assessment framework from a security perspective for smart metering applications of the SG. Clements et al. investigated the plausibility of threats due to mass load fluctuations in an SG, using a risk-based approach [25]. A unified risk assessment methodology using vulnerabilities and threats was proposed by Datta R. P. et al. in [26] for the SG. An exemplary attempt to provide a risk assessment framework for the SCN in an SGCPS has been reported in [27], where authors have also considered some other applications such as advanced metering, vehicular network, etc. In [28], Smith et al. considered the cyber aspects of the smart grid for evaluating the risk. In particular, authors proposed a multimode bandit approach formulated using the multi-armed bandit problem. Appasani et al. in [29], proposed a pragmatic framework for improving situational awareness in SCNs with the objective of enhancing the observability of the SG. In spite of a plethora of research work sprawled across various domains of the SG in the risk management paradigm, the risk assessment of an SCN in an SGCPS is very scarce to the best of authors knowledge, based on an extensive literature survey. This paper envisages providing a direction for evaluating the risk associated with the SCN in an SGCPS.
To summarize the work carried out in this article, the major contributions of the paper are outlined as follows:
  • An overview of the different topologies for synchrophasor communication, such as dedicated SCN, shared SCN and hybrid SCN, is provided.
  • A simplified state-of-art methodology has been proposed to evaluate hardware reliability and data reliability of these three topologies.
  • A comprehensive risk assessment framework for these topologies has been proposed. The risk assessment framework is based on both hardware reliability as well as data reliability.
  • Specifically, risk with data reliability is evaluated by simulating these networks for a practical power grid of India using the QualNet simulator, which are further analyzed with respect to the risk associated with the hardware reliability.
The reminder of the paper is organized in different sections. After a brief introduction presented in Section 1, an overview of different topologies of the SCNs such as dedicated SCN, shared SCN, and hybrid SCN is presented in Section 2. A comprehensive risk assessment framework of SCN in an SGCPS is proposed, including contemporary reliability assessment methodology in Section 3. Using the proposed framework, the risk associated with different SCN topologies (namely: dedicated SCN, shared SCN and hybrid SCN) is evaluated in Section 4. The proposed comprehensive risk assessment framework is obtained using the QualNet-based simulation in Section 5. Lastly, the conclusion of the paper is presented in Section 6.

2. Synchrophasor Communication Network

For synchrophasor applications, the SCN is the edifice of the SGCPS. We now present an overview of the SCN in this section for which a comprehensive risk assessment framework is proposed in the next section. Further, it is worth noting that many architectures of SCNs are proposed in the literature. Some of these are reported in [30,31,32,33,34]. Zaballos et al. in [30], proposed a heterogenous infrastructure as a communication network for the smart grid. In [31], the issues pertaining to transmission line monitoring have been considered for improving monitoring aspects of smart grid. Meng et al. in [32], presented the most comprehensive survey on networking of smart grid with a focus on the neighborhood area network. A state-of-art review on smart grid networks are reported by Goel et al. in [33]. Jha et al. in [34], considered different topologies for SCNs and reported a methodology for reliability assessment in terms failure probability. Of many topologies available in the literature, the topologies reported by Jha et al. [34] have been considered.

2.1. Dedicated Synchrophasor Communication Network

The edifice of the dedicated synchrophasor communication network is the optical communication network (OCN) which acts as a backbone of the system. Through these networks, several PMUs and PDCs communicate with each other. With respect to each of the PMU–PDC pairs, there exists an optical transreceiver (OTR) at the PMU side and at the PDC side. The optical transreceiver at the PMU side is used to connect PMU to the OCN. Similarly, the OTR at the PDC side is used to connect PDC to the backbone optical communication network. To avoid degradation in signal quality, many repeaters are used in between a PMU–PDC pair. In general, a dedicated SCN has several such PMU–PDC pairs. A simplified diagram to illustrate the dedicated synchrophasor communication network with PMU stations and PDC stations comprising of N number of PMUs and a PDC, respectively, is as shown in Figure 1.

2.2. Shared Synchrophasor Communication Network

Unlike the dedicated SCN, the shared SCN effectively utilizes the resources through shared medium. The communication link between a PMU–PDC pair also carries data from other end devices (EDs) in addition to the data from the corresponding PMU and PDC. Since the data from PMUs are points-of-interest, data generated from other end devices are regarded as the background traffic (BT). Further, a wired local area network (LAN) is considered to comprise a PMU, several end devices, routers, switches, etc. Such a LAN is known as a PMU-LAN. Similarly, corresponding to a PDC, a wired LAN is considered, which comprises a PDC, several EDs, routers, switches, etc. Such a LAN is known as a PDC-LAN. As the PMUs are geographically separated, these cannot be connected by a single wired LAN. Thus, each PMU is considered to be on a separate LAN. The edifice of the shared SCN is the internet protocol (IP) network, which interconnects different PMUs and PDCs of the SCN. Such a typical shared synchrophasor communication network comprising of multiple PMU-LANs and a PDC-LAN is illustrated in Figure 2.

2.3. Hybrid Synchrophasor Communication Network

The hybrid synchrophasor communication network follows similar topology to that of the shared SCN in all aspects except the LANs corresponding to PMUs. The main distinction between shared and hybrid SCNs is that the LAN in hybrid architecture follows wireless topology whereas in the former, it follows a wired topology. Thus, the LAN corresponding to each PMU is referred to as a wireless LAN (WLAN). To ensure maximum reliability, the backbone network and LAN corresponding to PDC follows wired topology similar to the shared SCN. Such a simplified hybrid SCN comprising of several PMU-WLANs and a PDC-WLAN is as depicted in Figure 3.

3. Risk Assessment Framework

Now, a novel and comprehensive risk assessment framework for the SCN in an SGCPS is proposed. To help understand the study, the preliminaries are discussed.

3.1. Preliminaries

We consider an SCN that connects η number of PMUs and ϑ number of PDCs. These are installed on κ electrical buses. Since the optimally installed PMUs are able to monitor more than one electrical bus simultaneously [35], the number of PMUs will be less than the number of electrical buses.
Let us consider the PMUs and PDCs are represented by the sets denoted as A and X, respectively, so that A = { P M U 1 , P M U 2 , , P M U η } and Χ = { P D C 1 , P D C 2 , , P D C ϑ } . Further, a set representing the electrical buses in an SGCPS is denoted as Β = { B u s 1 , B u s 2 , , B u s κ } . Clearly, the cardinality of sets are | A | = η , | Χ | = ϑ , and   | Β | = κ . Furthermore, we denote i t h PMU in terms of its location corresponding to k t h electrical bus as P M U i k : i { 1 , 2 , 3 , , η } , k { 1 , 2 , 3 , , κ } .   For, e.g., if a PMU numbered as third PMU is designated as   P M U 3 A | 3 η is installed on bus number 2, i.e., B u s 2 Β | 2 κ , then such PMU will be represented as P M U 3 2 . Likewise, P D C 1 2 represents the P D C 1 Χ | 1 ϑ which is installed on bus number 2, i.e., B u s 2 Β | 2 κ .
It is worth recalling that a PMU can monitor the status of more than one electrical bus under optimally placed conditions since η < κ . Thus, we define a PMU observable set as S i : i A , where the element of set S i is defined using (1). Clearly, the set S i defines the electrical buses B u s k Β ,   k { 1 , 2 , 3 , , κ } , which are monitored by a P M U i A ,   i { 1 , 2 , 3 , , η } .
B u s k S i k { 1 , 2 , 3 , , κ }   and   S i Β
Hence, if P M U 3 A | 3 η is capable of monitoring B u s 1 Β | 1 κ , B u s 2 Β | 2 κ , B u s 3 Β | 3 κ , then the PMU observable set is defined as S P M U 3 = { B u s 1 , B u s 2 , B u s 3 } . Further, more than one PMU can communicate their synchrophasor data to a single PDC. Thus, the collection of such PMUs corresponding to each PDC is referred to as a PDC observable set which is defined as Z j : j Χ . Nevertheless, the elements of set Z j are P M U i A ,   i { 1 , 2 , 3 , , η } . Hence, if P M U 1 A | 1 η , P M U 3 A | 3 η , and P M U 5 A | 5 η communicate their synchrophasor data to P D C 1 Χ | 1 ϑ , then the PDC observable set is defined as Z P D C 1 = { P M U 1 , P M U 3 , P M U 5 } . Moreover, the following inequality holds true:
S i B   but   S i Β Z j Χ   but   Z j Χ }

3.2. Hardware Reliability Assessment Model

Let us represent the failure probability of a component x as px; its hardware reliability can be defined using (3).
x = 1 p x
Moreover, for a system comprising a number Z of components in series and in parallel configuration, as shown in Figure 4a,b, respectively, the overall reliability of such a system can be given using (4) and (5), respectively.
= x = 1 Z x
= 1 ( x = 1 Z p x )

3.2.1. Hardware Reliability Assessment of Dedicated SCN

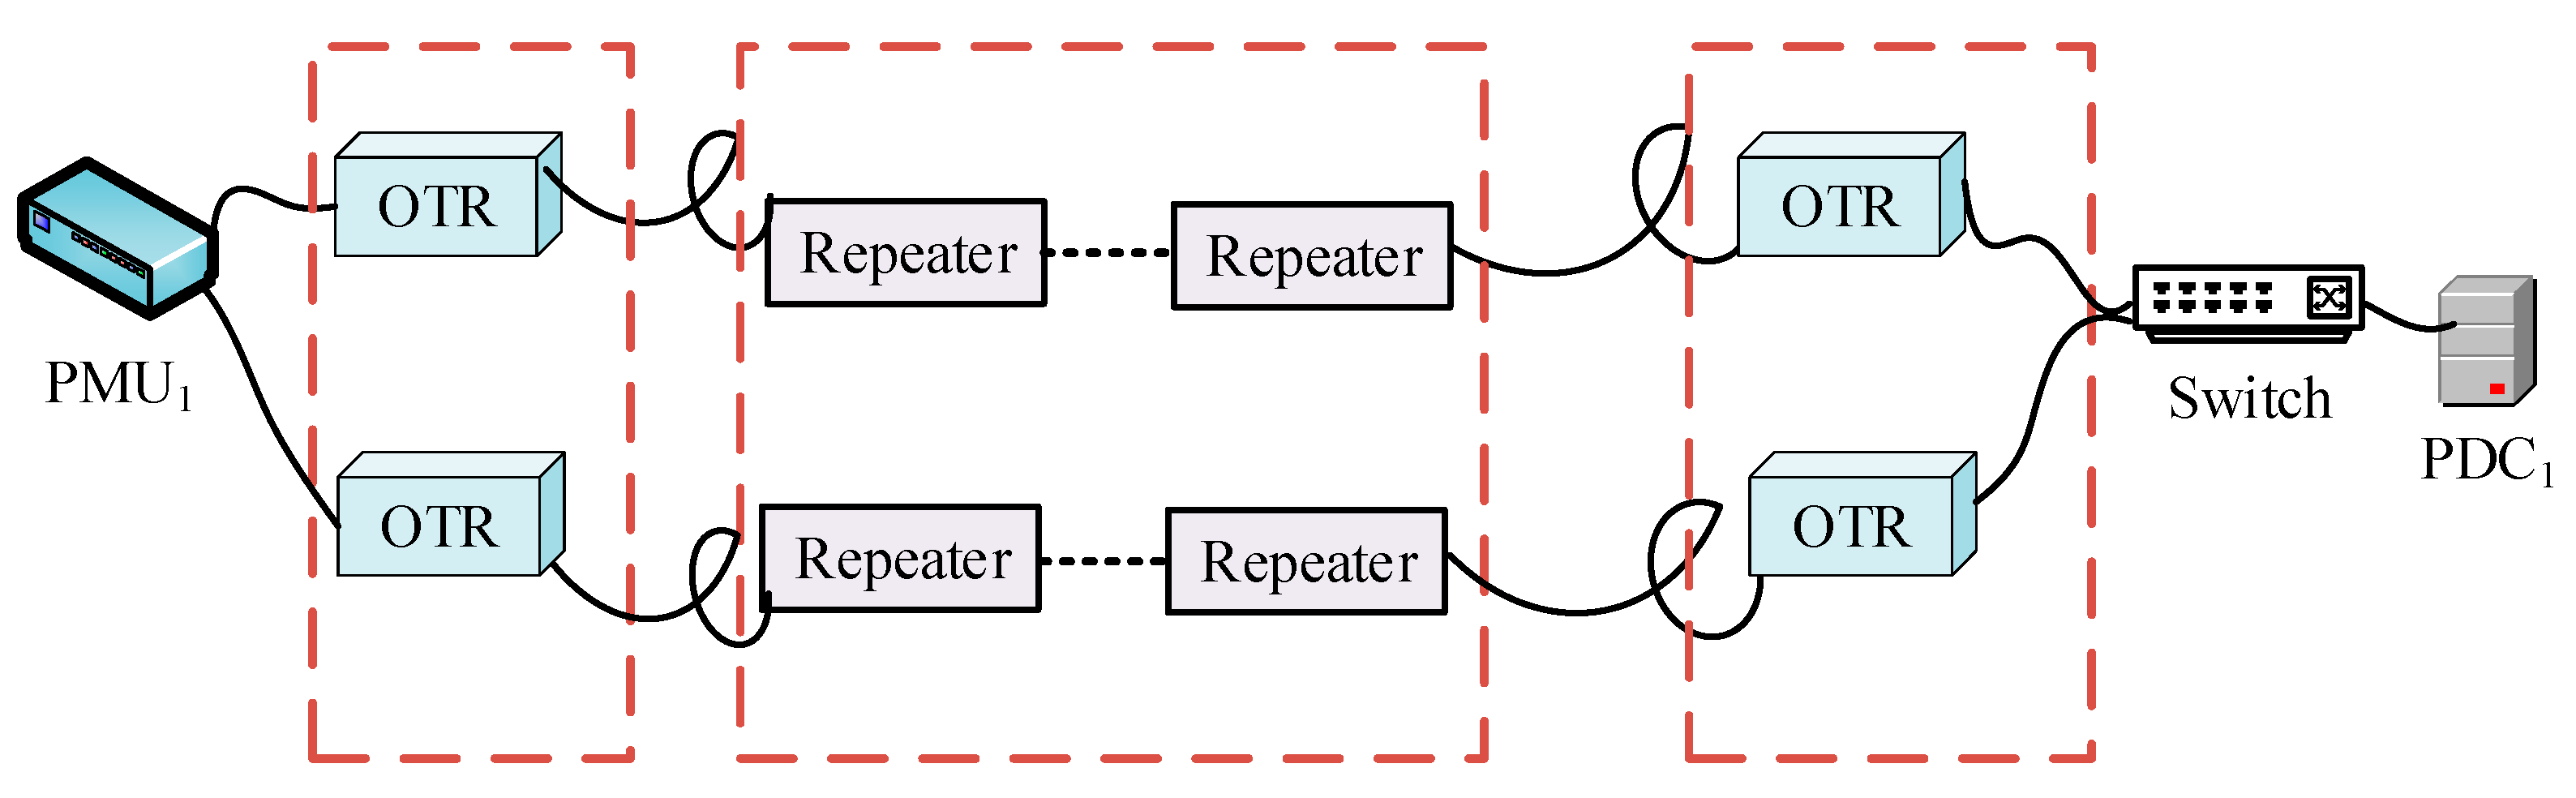
A dedicated SCN to evaluate reliability is as shown in Figure 5. The dedicated SCN consists of several PMUs, PDCs, OTRs, repeaters, optical cable and an optical communication network (OCN), etc. Of this complex SCN, a pair of PMU and PDC is shown to evaluate its hardware reliability. W.L.O.G, a PMU–PDC pair consists of P M U 1 A | 1 η , a P D C 1 Χ | 1 ϑ , an OTR at the PMU side, OTR at the PDC side, and several repeaters, which are interconnected using optical cable over the OCN. From Equations (4) and (5), an OTR at PMU, an OTR at PDC, and repeaters are used in parallel configuration which act as redundant components to enhance the reliability of the dedicated SCN.
In general, let p P M U , p P D C , p s w i t c h , p O T R , p o f and p r e p denote the failure probability of PMU, PDC, switch, OTR, optical fiber, and repeater, respectively, in the corresponding PMU–PDC pair. Thus, the hardware reliability of a PMU1PDC1 pair with n repeaters shown in Figure 5 can be given by (6), which is evaluated using (4) and (5).
P M U 1 P D C 1 = ( 1 p P M U 1 ) · ( 1 ( p O T R ) 2 ) 2 · n ( 1 ( p r e p ) 2 ) · ( 1 p s w i t c h ) · ( 1 p P D C 1 ) · ( 1 p o f )

3.2.2. Hardware Reliability Assessment of Shared SCN

With respect to the shared SCN depicted in Figure 2, the shared SCN consists of several PMUs, PDCs, routers, end devices, etc., as key components which are interconnected over the IP network which acts as a backbone. Of these complex SCN, a pair of PMU and PDC is shown in Figure 6 to evaluate its hardware reliability. W.L.O.G, a PMU–PDC pair consists of P M U 1 A | 1 η , a P D C 1 Χ | 1 ϑ , a router at the PMU side, a router at the PDC side, which are interconnected using the IP network. From Equations (4) and (5), a router at PMU (PMU routers), and a router at PDC (PDC routers) are used in parallel configuration, which act as redundant components to enhance reliability of the shared SCN.
The hardware reliability of a PMU1PDC1 pair in a shared SCN comprising of a PMU and a PDC which is shown in Figure 6 can be given by (7), which is evaluated using (4) and (5). Where, p r and p I P denotes failure probabilities of the router and IP network, respectively.
P M U 1 P D C 1 = ( 1 p P M U 1 ) · ( 1 ( p r ) 2 ) 2 · ( 1 p I P ) · ( 1 p P D C 1 )

3.2.3. Hardware Reliability Assessment of Hybrid SCN

With respect to the hybrid SCN depicted in Figure 3, it consists of several PMUs, PDCs, access points (APs) routers, end devices, etc., as key components which are interconnected over the IP network which acts as a backbone. Of these complex SCN, a pair of PMU and PDC is shown in Figure 7 to evaluate its hardware reliability. W.L.O.G, a PMU–PDC pair consists of P M U 1 A | 1 η , a P D C 1 Χ | 1 ϑ , APs, routers at the PMU side, the routers at PDC side, which are interconnected using the IP network. From Equations (4) and (5), an access point and a router at PMU, and a router at PDC are used in parallel configuration which act as redundant components to enhance the reliability of the hybrid SCN.
The hardware reliability of a PMU1PDC1 pair in a hybrid SCN, which is shown in Figure 7, can be given by (8), which is evaluated using (4) and (5). Here,   p A P denotes the failure probability of an access point.
P M U 1 P D C 1 = ( 1 p P M U 1 ) · ( 1 ( p A P ) 2 ) · ( 1 ( p r ) 2 ) 2 · ( 1 p I P ) · ( 1 p P D C 1 )
The failure probabilities of different key components of considered dedicated, shared and hybrid SCN is summarized in Table 1.

3.3. Data Reliability Assessment Model

The synchrophasor communication network primarily carries synchrophasor data which correspond to the health of the electrical buses which are communicated by PMU to PDC for monitoring the SGCPS. The synchrophasor data are communicated among PMUs and PDCs in the form of packets. Based on SCN topologies, these data are prone to losses which is undesirable from the point of reliability. Thus, we can define the data reliability of an SCN in terms of packet delivery ratio (PDR).
Let ψ P M U i ( t ) and φ P D C j ( t ) represent the number of packets sent by P M U i A ,   i { 1 , 2 , 3 , , η } and corresponding number of packets received by P D C j Χ ,   j { 1 , 2 , 3 , , ϑ } up to time t . Then, the packet delivery ratio corresponding to P M U i P D C j pair is given by (9), where t 0 and T are the start and stop time during which packets are exchanged. Interestingly, simulations are preferred to record the PDR for different SCNs.
P D R P M U i P D C j = t = t o T ( φ P D C j ( t ) ψ P M U i ( t ) )

3.4. Risk Assessment Metric

In optimally placed conditions, a PMU installed on a particular bus is able to monitor the status of some additional other electrical buses. Thus, a failure of this particular PMU makes associated buses unobservable, which leads to un-observability of the SGCPS. This characteristic in a synchrophasor communication network can be opined in terms of severity index (S.I) which is defined in (10).
S . I = total   number   of   dependent   buses total   buses   in   the   synchrophasor   communication   network
Let us consider a   P M U i k A ,   i { 1 , 2 , 3 , , η } , which is installed on   B u s k Β ,   k { 1 , 2 , 3 , , κ } and capable of monitoring γ i j buses. The PMU observable set (POS) is defined as | S P M U i | = γ i j . Thus, the severity index of P M U i A ,   i { 1 , 2 , 3 , , η }   can be defined using (11):
S . I P M U i = γ i j κ
Consequently, if a P M U i P D C j pair for any i { 1 , 2 , 3 , , η } and j { 1 , 2 , 3 , , ϑ } does not exist, then | S P M U i | = 0 , and also S . I P M U i = 0 . Further, the risk metric qualitatively analyzes the impact of severity associated with particular components on the SGCPS. In an SCN, if S . I P M U i = γ i j κ denotes the severity index of P M U i A ,   i { 1 , 2 , 3 , , η } , and p P M U i denotes its failure probability, then the pragmatic expression for risk (R) associated with P M U i A ,   i { 1 ,   2 ,   3 , , η } , in an SGCPS can be given using (12):
R P M U i = p P M U i ( γ i j κ )
However, the risk associated with a P M U i P D C j pair can be given using another pragmatic equation, as described in (13):
R P M U i P M U j = ( 1 P M U i P M U j ) ( γ i j κ )
Moreover, (13) is a more generalized expression of risk assessment which can be used to evaluate the risk in terms of data reliability. Particularly, (13) can be restructured as given in (14) to evaluate risk of a P M U i P D C j in terms of data reliability (i.e., PDR):
R P M U i P M U j = ( 1 P D R P M U i P M U j ) ( γ i j κ )

4. Risk Assessment of Different SCNs

Now, based on the proposed risk assessment framework, we evaluate the risk of different synchrophasor communication networks in an SGCPS.

4.1. Risk Assessment of Dedicated SCN

From the perspective of reliability analysis, a dedicated SCN corresponding to a PMU and a PDC is shown in Figure 5. The hardware reliability (HR) of a such P M U i P D C j pair can be evaluated using (6). Considering the corresponding values in Table 1, in Equation (6), P M U i P M U j = 0.9959 .
Thus, using Equation (13), the risk with hardware reliability (RwHR) associated with a P M U i P D C j pair in a dedicated SCN can be given as:
R P M U i P M U j = 0.0041 ( γ i j κ )
Nevertheless, for the dedicated SCN with η number of PMUs corresponding to ϑ number of PDCs, the mean value of RwHR associated with the dedicated SCN can be given as:
R D e d m e a n = 1 ϑ j = 1 ϑ ( i = 1 η ( 1 P M U i P M U j ) ( γ i j κ ) / η )
Moreover, the minimum RwHR associated with the dedicated SCN with η number of PMUs corresponding to ϑ number of PDCs can be obtained using (17).
R D e d m i n = min { ( 1 P M U i P M U j ) ( γ i j κ ) } i { 1 , 2 , 3 , , η } , j { 1 , 2 , 3 , , ϑ }
Similarly, if data reliability (DR) is considered, then the risk with data reliability (RwDR) associated with a P M U i P D C j pair in a dedicated SCN can be obtained using (14).
Nevertheless, for the dedicated SCN with η number of PMUs corresponding to ϑ number of PDCs, the mean value of RwDR associated with the dedicated SCN can be given as:
R D e d m e a n = 1 ϑ j = 1 ϑ ( i = 1 η ( 1 P D R P M U i P M U j ) ( γ i j κ ) / η )
Moreover, the minimum RwDR associated with the dedicated SCN with η number of PMUs corresponding to ϑ number of PDCs can be obtained using (19):
R D e d m i n = m i n { ( 1 P D R P M U i P M U j ) ( γ i j κ ) } ,   i { 1 , 2 , 3 , , η } , j { 1 , 2 , 3 , , ϑ }

4.2. Risk Assessment of Shared SCN

From the perspective of reliability analysis, a shared SCN corresponding to a PMU and a PDC pair is shown in Figure 6. The hardware reliability of a P M U i P D C j pair can be evaluated using (7). Considering the corresponding values in Table 1, in Equation (7), P M U i P M U j = 0.98831 .
Thus, using Equation (13), the RwHR associated with a P M U i P D C j pair in a shared SCN can be given as:
R P M U i P M U j = 0.98831 ( γ i j κ )
Nevertheless, for the shared SCN with η number of PMUs corresponding to ϑ number of PDCs, the mean value of RwHR associated with shared SCN can be given as:
R S h a m e a n = 1 ϑ j = 1 ϑ ( i = 1 η ( 1 P M U i P M U j ) ( γ i j κ ) / η )
Moreover, the minimum RwHR associated with shared SCN with η number of PMUs corresponding to ϑ number of PDCs can be obtained using (22).
R S h a m i n = m i n { ( 1 P M U i P M U j ) ( γ i j κ ) } ,   i { 1 , 2 , 3 , , η } , j { 1 , 2 , 3 , , ϑ }
Similarly, risk with data reliability associated with a P M U i P D C j pair in a shared SCN can be given using (14). Nevertheless, for the shared SCN with η number of PMUs corresponding to ϑ number of PDCs, the mean value of RwDR associated with shared SCN can be given as:
R S h a m e a n = 1 ϑ j = 1 ϑ ( i = 1 η ( 1 P D R P M U i P M U j ) ( γ i j κ ) / η )
Moreover, the minimum RwDR associated with shared SCN with η PMUs corresponding to ϑ number of PDCs can be obtained using (24).
R S h a m i n = m i n { ( 1 P D R P M U i P M U j ) ( γ i j κ ) } ,   i { 1 , 2 , 3 , , η } , j { 1 , 2 , 3 , , ϑ }

4.3. Risk Assessment of Hybrid SCN

From the perspective of reliability analysis, a hybrid SCN corresponding to a PMU and a PDC pair is shown in Figure 7. The hardware reliability of a P M U i P D C j pair can be evaluated using (8). Using the corresponding values reported in Table 1, in Equation (8), P M U i P M U j = 0.98831 .
Thus, using Equation (13), the risk with hardware reliability associated with a P M U i P D C j pair in a hybrid SCN can be given as:
R P M U i P M U j = 0.98831 ( γ i j κ )
Nevertheless, for the hybrid SCN with η number of PMUs corresponding to ϑ number of PDCs, the mean value of RwHR associated with a hybrid SCN can be given as:
R H y b m e a n = 1 ϑ j = 1 ϑ ( i = 1 η ( 1 P M U i P M U j ) ( γ i j κ ) / η )
Moreover, the minimum RwHR associated with hybrid SCN with η number of PMUs corresponding to ϑ number of PDCs can be obtained using (27).
R H y b m i n = m i n { ( 1 P M U i P M U j ) ( γ i j κ ) } ,   i { 1 , 2 , 3 , , η } , j { 1 , 2 , 3 , , ϑ }
Similarly, risk with data reliability associated with a P M U i P D C j pair in a hybrid SCN can be given as:
R P M U i P M U j = ( 1 P D R P M U i P M U j ) ( γ i j κ )
Nevertheless, for the shared SCN with η number of PMUs corresponding to ϑ number of PDCs, the mean value of RwDR associated with the hybrid SCN can be given as:
R H y b m e a n = 1 ϑ j = 1 ϑ ( i = 1 η ( 1 P D R P M U i P M U j ) ( γ i j κ ) / η )
Moreover, the minimum RwDR associated with the hybrid SCN with η number of PMUs corresponding to ϑ number of PDCs can be obtained using (30).
R H y b m i n = m i n { ( 1 P D R P M U i P M U j ) ( γ i j κ ) } i { 1 , 2 , 3 , , η } , j { 1 , 2 , 3 , , ϑ }

5. Simulation Results and Discussion

As a precursor to the simulations, we consider a case study for validating the proposed comprehensive framework for risk assessment with hardware and data reliability of the SCN in an SGCPS. The key architecture of the case study is briefly described as follows.
A practical power grid of West Bengal, an Indian state, is considered as a case study for validating the proposed framework for risk assessment. The power grid comprises 24 buses, 7 optimally placed PMUs and 1 PDC, as shown in Figure 8. The geographical locations of PMUs and the PDC under this case study is reported from [34] in Table 2.
The location of these buses in the Indian state of West Bengal are mentioned in Appendix A.

5.1. Risk Assessment of Dedicated SCN

From the case study, it has seven PMUs and one PDC which are optimally distributed over 24 electrical buses. Thus, the corresponding SCN parameters are η = 7 , ϑ = 1 and κ = 24 . Thus, the mean risk with hardware reliability associated with the dedicated SCN can be given using (16) as:
R D e d m e a n = i = 1 i = 7 ( 1 P M U i P M U 1 ) ( γ i 1 24 ) 7
In dedicated SCN with P M U i P M U j = 0.9959 , i { 1 , 2 , 3 , , 7 } , j = 1 , (31) gives
R D e d m e a n = 1.7083 × 10 4 i = 1 i = 7 γ i 1 7 = 0.05857 %
Now, the minimum RwHR can be similarly evaluated using (17), which yields R D e d m i n .
To obtain the risk associated with data reliability, the dedicated SCN shown in Figure 1 is designed in QualNet, where locations of the PMUs and the PDC are in accordance with Table 2 as per the case study. To recap, QualNet is a discrete event-based network simulator. From simulation, the number of packets communicated and received by each PMUs and PDC are recorded. Based on packets exchanged statistics, the PDR can be calculated for each of the PMUs using Equation (9). Further, the risk with data reliability can be assessed for the dedicated SCN using (18) and (19). In order to understand the impact of data rate on RwDR, the network is simulated under two conditions: low data rate where PMU data rate is taken as 64 Kbps, and high data rate where PMU data rate is taken as 300 Kbps. The simulation results of the dedicated SCN with low and high data rate is reported in Table 3.

5.2. Risk Assessment of Shared SCN

Similar to the dedicated SCN, the mean risk with hardware reliability associated with the shared SCN for the case study can be given using (21) as:
R S h a m e a n = i = 1 i = 7 ( 1 P M U i P M U 1 ) ( γ i 1 24 ) 7
In the shared SCN with P M U i P M U j = 0.98831 , i { 1 , 2 , 3 , , 7 } , j = 1 , (33) gives R S h a m e a n = 0.1669 % . Now, the minimum RwHR can be similarly evaluated using (22) which yields R S h a m i n .
The shared SCN shown in Figure 2 is simulated using QualNet. Similar to the dedicated SCN, the PDR corresponding to each PMU can be obtained using (9) and associated RwDR can be calculated using (23) and (24).
Nevertheless, the communication resources are shared in the shared SCN, which necessitates the consideration of the background traffic (BT) in addition to the PMU data rate. Moreover, the significance of background traffic is appreciable on the performance of RwDR in the shared SCN, which mimics the characteristics of the practical shared communication network. Thus, the shared SCN is simulated with different background traffic of 70%, 80% and 95% under low and high data rate of PMU.
The simulation results are reported for low and high data rates in Table 4 and Table 5, respectively.
The background traffic on an SCN has significant impact on its performance. In order to have a comparative analysis on the performance of the shared SCN under varying background traffic conditions, a graph for RwDR under 70% BT, 80% BT and 95% BT is plotted, which is shown in Figure 9. From the comparative results, it can be inferred that the risk associated with the shared SCN with a low data rate is very low under 70% BT since % risk is less than 1% with R S h a m e a n = 0.124405 and R S h a m i n 125 . However, the risk is moderate under 80% background since 1 ≤ % risk ≤ 2 with R S h a m e a n = 1.29524 and R S h a m i n . Furthermore, the risk associated with the shared SCN is highest under 95% background traffic since 3 ≤ % Risk ≤ 5 with R S h a m e a n = 4.07934 and R S h a m i n 35398 . Nevertheless, if the data rate is increased from 64 Kbps to 300 Kbps, then the significant increment in the risk associated with the shared SCN under different BT conditions are observed. Specifically, the mean RwDR in the shared SCN with 300 Kbps increases by a factor of 5.22, 2.2045, and 1.95 under 70%, 80% and 95% BTs, respectively, as compared to that with a 64 Kbps data rate. The comparative analysis instigates the operation of the shared SCN below 95% BT to alleviate the associated risk.

5.3. Risk Assessment of Hybrid SCN

Similar to the shared SCN, mean risk with hardware reliability associated with the hybrid SCN for the case study can be given using (26) as R H y b m e a n = 0.1669 % , where P M U i P M U j = 0.98831 , i { 1 , 2 , 3 , , 7 } ; j = 1 . Further, the minimum RwHR can be similarly evaluated using (27) which yields R H y b m i n .
From the perspective of validating risk with data reliability, the hybrid SCN shown in Figure 3 is implemented in the QualNet network simulator for simulation. The distribution of the PMUs and PDCs are in accordance with Table 2 of the case study. Similar to the shared SCN, the hybrid SCN is simulated with varying background traffic of 70%, 80% and 95% to mimic the characteristics of the practical communication network. The simulations are performed with low and high data rates under this background traffic. The simulation results are reported for low and high data rates in Table 6 and Table 7, respectively, including associated RwDR, which is evaluated using Equations (29) and (30).
Similar to shared SCN, a comparative study to analyze the performance of the hybrid SCN is presented in Figure 10, where RwDR is analyzed for 70%, 80% and 95% BTs. Comparative analysis reveals that the risk associated with the hybrid SCN with low data rate is very low under 70% BT since % risk is less than 1% with R H y b m e a n = 0.194940 and R H y b m i n 2125 . However, the risk is moderate under 80% background since 1 ≤ % risk ≤ 4 with R H y b m e a n = 3.212500 and R H y b m i n 185 . Furthermore, the risk associated with the hybrid SCN is highest under 95% background traffic since 4 ≤ % risk ≤ 9 with R H y b m e a n = 8.372823 and R H y b m i n 612435 . Nevertheless, if the data rate is increased from 64 Kbps to 300 Kbps, then the significant increment in the risk associated with the hybrid SCN under different BT conditions are observed. Specifically, the mean RwDR in the hybrid SCN with 300 Kbps increases by a factor of 1.8058, 1.2094, and 1.0172 under 70%, 80% and 95% BTs, respectively, as compared to that with a 64 Kbps data rate. The comparative analysis instigates the operation of the hybrid SCN below 95% BT to alleviate associated risk.

5.4. Comparative Performance Analysis

The three different topologies of SCNs (dedicated SCN, shared SCN and hybrid SCN) have been so far analyzed for risk hedging in SGCPS. However, it becomes pertinent to comprehensively compare their performance with respect to risk hedging. A comparative analysis of these three topologies is presented in Figure 11.
The performance of each of these SCNs is compared in terms of mean RwHR, minimum RwHR, mean RwDR and minimum RwDR.
In the dedicated SCN, RwHR is found to be R D e d m e a n = 0.05857 % and R D e d m i n , whereas RwDR is obtained as R D e d m e a n = 0.088690% and R D e d m i n 125 with a 300 Kbps PMU data rate. However, RwHR obtained in the shared SCN is R S h a m e a n = 0.1669 % and   R S h a m i n , whereas RwDR is obtained as R S h a m e a n = 2.855357% and R S h a m i n 23375 with a 300 Kbps PMU data rate at 80% background traffic. Moreover, for the hybrid SCN, RwHR is obtained as R H y b m e a n = 0.1669 % and R H y b m i n , whereas RwDR is obtained as R H y b m e a n = 3.885238% and R H y b m i n 25875 with a 300 Kbps PMU data rate, supporting 80% background traffic. Based on analysis, it can be inferred that the dedicated SCN has minimum risk, whereas the risk associated with hybrid SCN is maximum. Moreover, RwHR is almost same as that of RwDR in dedicated SCN. However, the mean RwDR increases in the shared SCN and hybrid SCN by a factor of 17.108 and 23.278, respectively, as compared to the corresponding mean RwHR, whereas minimum RwDR increases in shared and hybrid SCN by a factor of 16.005 and 17.717, respectively. To clearly visualize the mean and minimum RwHR in all three SCNs, the corresponding portion from Figure 11a is magnified, which is shown in Figure 11b.
Furthermore, the RwHR is high in the case of the shared SCN and hybrid SCN as compared to that of the dedicated SCN. However, the shared SCN and hybrid SCN are associated with same RwHR. Conclusively, the shared SCN has lower risk compared to the hybrid SCN; however, at the cost of flexibility and scalability. Moreover, the dedicated SCN provides better risk hedging comparative to its counterparts, i.e., the shared SCN and hybrid SCN. However, this is achieved at high implementation cost, inefficient resource utilization, less flexibility and less scalability.

6. Conclusions

A comprehensive risk assessment framework for SCNs in an SGCPS is proposed based on two vital availability metrics, namely, hardware reliability and data reliability. The simplified hardware reliability models for three different SCN topologies, namely, dedicated SCN, shared SCN and hybrid SCN are proposed. Further, a pragmatic metric known as PDR is used for data reliability in SCNs. The proposed comprehensive framework is meticulously validated using a case study in QualNet network simulator. To validate the proposed framework, different SCNs are implemented and simulated using QualNet corresponding to a case study. Specifically, a practical power grid of India (West Bengal State) has been considered as a case study. The simulation results reveal that RwDR is minimum for the dedicated SCN, moderate for the shared SCN, and highest for the hybrid SCN. In particular, %RwDR values, i.e., R D e d m e a n = 0.088690 , R S h a m e a n = 2.855360 and R H y b m e a n = 3.88524 , are obtained, respectively for the dedicated SCN, shared SCN at 80% BT, and hybrid SCN at 80% BT at a 300 Kbps data rate. Further, RwHR is least in the dedicated SCN with R D e d m e a n = 0.05851 , whereas the shared and hybrid SCN have the same RwHR with R S h a m e a n = R H y b m e a n = 0.1669 .
Moreover, the mean RwDR is comparatively more in all SCN topologies in comparison to the mean RwHR. In fact, the mean RwDR as compared to the mean RwHR increases in the shared SCN and hybrid SCN by a factor of 17.108 and 23.278, respectively. However, the minimum RwDR increases in the shared and hybrid SCN by a factor of 16.005 and 17.717, respectively, as compared to the corresponding minimum RwHR. These increments are a result of the architecture employed in the shared and hybrid SCN which are more prone to packet losses. Nevertheless, being cost-effective as compared to the dedicated SCN, the shared and hybrid SCNs are viable in SGCPS. Further, the total risk with data reliability less than 4% for up to 80% BT makes the shared SCN and hybrid SCN feasible for the SGCPS. Lastly, if the seamless integration of SGCPS components is of equal priority, then the hybrid SCN is a more preferable alternative to the dedicated and shared SCNs. Nevertheless, the shared SCN and hybrid SCN outperform the dedicated SCN in terms of scalability and flexibility. The risk hedging analysis of communication networks for some other applications of an SGCPS such as advanced metering, wide area measurements, situational awareness, is the future work which authors wish to carry out.

Author Contributions

Conceptualization, A.V.J. and B.A.; methodology, B.A. and A.V.J.; software, A.N.G. and A.V.J., validation, B.A. and A.V.J.; investigation, A.N.G.; resources, A.V.J.; data curation, A.V.J.; writing—original draft preparation, A.V.J. and B.A.; supervision, N.B.; project administration, B.A.; formal analysis: N.B.; funding acquisition: N.B.; visualization: N.B.; writing—review and editing: N.B.; figures and tables: A.V.J. All authors have read and agreed to the published version of the manuscript.

Funding

There is no funding available for this.

Institutional Review Board Statement

Not applicable.

Informed Consent Statement

Not applicable.

Conflicts of Interest

The authors declare no conflict of interest.

Appendix A

Bus 1: Farakka; Bus 2: Jeerat-I, Bus 3: Durgapur, Bus 4: Arambagh; Bus 5: Mejia; Bus 6: Howrah; Bus 7: Jeerat-II; Bus 8: Bidhanagar; Bus 9: Kasba; Bus 10: Kolaghat-I; Bus 11 Arambagh; Bus 12: Malda-I; Bus 13: Siliguri; Bus 14: Waria; Bus 15: Kolaghat-II; Bus 16: Malda-II; Bus 17: DPL; Bus 18: Santaldih; Bus 19: Laksmikantpur-I; Bus 20: Laksmikantpur-II; Bus 21: Rishra; Bus 22: Dalkhola; Bus 23: Birpara; Bus 24: Durgapur.

References

  1. Smartgrid.gov. Smart Grid: The Smart Grid|SmartGrid.gov. 2021. Available online: https://www.smartgrid.gov/the_smart_grid/smart_grid.html (accessed on 17 April 2021).
  2. Llaria, A.; Dos Santos, J.; Terrasson, G.; Boussaada, Z.; Merlo, C.; Curea, O. Intelligent Buildings in Smart Grids: A Survey on Security and Privacy Issues Related to Energy Management. Energies 2021, 14, 2733. [Google Scholar] [CrossRef]
  3. Fan, Z.; Kulkarni, P.; Gormus, S.; Efthymiou, C.; Kalogridis, G.; Sooriyabandara, M.; Zhu, Z.; Lambotharan, S.; Chin, W.H. Smart Grid Communications: Overview of Research Challenges, Solutions, and Standardization Activities. IEEE Commun. Surv. Tutor. 2013, 15, 21–38. [Google Scholar] [CrossRef] [Green Version]
  4. Ghosal, A.; Conti, M. Key Management Systems for Smart Grid Advanced Metering Infrastructure: A Survey. IEEE Commun. Surv. Tutor. 2019, 21, 2831–2848. [Google Scholar] [CrossRef] [Green Version]
  5. Canizo, M.; Conde, A.; Charramendieta, S.; Minon, R.; Cid-Fuentes, R.G.; Onieva, E. Implementation of a Large-Scale Platform for Cyber-Physical System Real-Time Monitoring. IEEE Access 2019, 7, 52455–52466. [Google Scholar] [CrossRef]
  6. Yu, X.; Xue, Y. Smart Grids: A Cyber–Physical Systems Perspective. Proc. IEEE 2016, 104, 1058–1070. [Google Scholar] [CrossRef]
  7. Jha, A.V.; Appasani, B.; Ghazali, A.N.; Pattanayak, P.; Gurjar, D.S.; Kabalci, E.; Mohanta, D.K. Smart grid cyber-physical systems: Communication technologies, standards and challenges. Wirel. Netw. 2021, 27, 2595–2613. [Google Scholar] [CrossRef]
  8. Elsisi, M.; Tran, M.-Q.; Mahmoud, K.; Lehtonen, M.; Darwish, M. Deep Learning-Based Industry 4.0 and Internet of Things Towards Effective Energy Management for Smart Buildings. Sensors 2021, 21, 1038. [Google Scholar] [CrossRef]
  9. Elsisi, M.; Mahmoud, K.; Lehtonen, M.; Darwish, M.M.F. Reliable Industry 4.0 Based on Machine Learning and IoT for Analyzing, Monitoring, and Securing Smart Meters. Sensors 2021, 21, 487. [Google Scholar] [CrossRef]
  10. Jha, A.V.; Appasani, B.; Ghazali, A.N. Performance Evaluation of Routing Protocols in Synchrophasor Communication Networks. In Proceedings of the 2019 International Conference on Information Technology (ICIT), Bhubaneswar, India, 19–21 December 2019; pp. 132–136. [Google Scholar]
  11. Kezunovic, M.; Sprintson, A.; Ren, J.; Guan, Y. Signal processing, communication, and networking requirements for synchrophasor systems. In Proceedings of the 2012 IEEE 13th International Workshop on Signal Processing Advances in Wireless Communications (SPAWC), Cesme, Turkey, 17–20 June 2012; pp. 464–468. [Google Scholar] [CrossRef]
  12. Yu, W.; Yao, W.; Deng, X.; Zhao, Y.; Liu, Y. Timestamp Shift Detection for Synchrophasor Data Based on Similarity Analysis Between Relative Phase Angle and Frequency. IEEE Trans. Power Deliv. 2020, 35, 1588–1591. [Google Scholar] [CrossRef]
  13. Appasani, B.; Mohanta, D.K. A review on synchrophasor communication system: Communication technologies, standards and applications. Prot. Control. Mod. Power Syst. 2018, 3, 37. [Google Scholar] [CrossRef] [Green Version]
  14. Das, S.; Sidhu, T.S. Application of Compressive Sampling in Synchrophasor Data Communication in WAMS. IEEE Trans. Ind. Inform. 2013, 10, 450–460. [Google Scholar] [CrossRef]
  15. Liberati, F.; Garone, E.; Di Giorgio, A. Review of Cyber-Physical Attacks in Smart Grids: A System-Theoretic Perspective. Electronics 2021, 10, 1153. [Google Scholar] [CrossRef]
  16. Smadi, A.; Ajao, B.; Johnson, B.; Lei, H.; Chakhchoukh, Y.; Abu Al-Haija, Q. A Comprehensive Survey on Cyber-Physical Smart Grid Testbed Architectures: Requirements and Challenges. Electronics 2021, 10, 1043. [Google Scholar] [CrossRef]
  17. Cintuglu, M.H.; Mohammed, O.A.; Akkaya, K.; Uluagac, A.S. A Survey on Smart Grid Cyber-Physical System Testbeds. IEEE Commun. Surv. Tutor. 2017, 19, 446–464. [Google Scholar] [CrossRef]
  18. McDonald, M.J.; Conrad, G.N.; Service, T.C.; Cassidy, R.H. Cyber effects analysis using VCSE, September 2008. Available online: https://www.energy.gov/sites/prod/files/oeprod/DocumentsandMedia/30-Cyber_Effects_Analysis_Using_VCSE.pdf (accessed on 17 April 2021).
  19. Bergman, D.C.; Jin, D.; Nicol, D.M.; Yardley, T. The virtual power system testbed and inter-testbed integration. In Proceedings of the 2nd Workshop on Cyber Security Experimentation and Test (CSET’09), Montreal, QC, Canada, 10 August 2009. [Google Scholar]
  20. Ingram, D.M.E.; Campbell, D.A.; Schaub, P.; Ledwich, G. Test and evaluation system for multi-protocol sampled value protection schemes. In Proceedings of the IEEE Trondheim Power Tech, Trondheim, Norway, 19–23 June 2011. [Google Scholar]
  21. A Smart Laboratory, Manhattan, KS, USA. 2015. Available online: http://www.k-state.edu/perspectives/winter-2015/smartlab.html (accessed on 17 April 2021).
  22. Hahn, A.; Ashok, A.; Sridhar, S.; Govindarasu, M. Cyber-Physical Security Testbeds: Architecture, Application, and Evaluation for Smart Grid. IEEE Trans. Smart Grid 2013, 4, 847–855. [Google Scholar] [CrossRef]
  23. Yang, Y.; Jiang, H.T.; McLaughlin, K.; Gao, L.; Yuan, Y.B.; Huang, W.; Sezer, S. Cybersecurity test-bed for IEC 61850 based smart substations. In Proceedings of the 2015 IEEE Power & Energy Society General Meeting, Denver, Colorado, 26 July 2015; pp. 1–5. [Google Scholar]
  24. Habash, R.W.Y.; Groza, V.; Krewski, D.; Paoli, G.; Paoli, G. A risk assessment framework for the smart grid. In Proceedings of the 2013 IEEE Electrical Power & Energy Conference, Vancouver, BC, Canada, 21–25 July 2013; pp. 1–6. [Google Scholar]
  25. Clements, S.L.; Kirkham, H.; Elizondo, M.; Lu, S. Protecting the smart grid: A risk based approach. In Proceedings of the 2008 IEEE Power and Energy Society General Meeting—Conversion and Delivery of Electrical Energy in the 21st Century, Pittsburgh, PA, USA, 20–24 July 2008; pp. 1–7. [Google Scholar]
  26. Ray, P.D.; Harnoor, R.; Hentea, M. Smart power grid security: A unified risk management approach. In Proceedings of the 44th Annual 2010 IEEE International Carnahan Conference on Security Technology, San Jose, CA, USA, 5–8 October 2010; pp. 276–285. [Google Scholar]
  27. Jha, A.V.; Ghazali, A.N.; Appasani, B.; Mohanta, D.K. Risk Identification and Risk Assessment of Communication Net-works in Smart Grid Cyber-Physical Systems. In Security in Cyber-Physical Systems: Foundations and Applications; Awad, A.I., Furnell, S., Paprzycki, M., Sharma, S.K., Eds.; Springer: Cham, Switzerland, 2021; Volume 339, pp. 217–253. [Google Scholar]
  28. Smith, M.D.; Pate-Cornell, M.E. Cyber Risk Analysis for a Smart Grid: How Smart is Smart Enough? A Multiarmed Bandit Approach to Cyber Security Investment. IEEE Trans. Eng. Manag. 2018, 65, 434–447. [Google Scholar] [CrossRef]
  29. Appasani, B.; Jha, A.V.; Mishra, S.K.; Ghazali, A.N. Communication infrastructure for situational awareness enhancement in WAMS with optimal PMU placement. Prot. Control. Mod. Power Syst. 2021, 6, 1–12. [Google Scholar] [CrossRef]
  30. Zaballos, A.; Vallejo-Blanxart, A.; Selga, J. Heterogeneous communication architecture for the smart grid. IEEE Netw. 2011, 25, 30–37. [Google Scholar] [CrossRef]
  31. Fateh, B.; Govindarasu, M.; Ajjarapu, V. Wireless Network Design for Transmission Line Monitoring in Smart Grid. IEEE Trans. Smart Grid 2013, 4, 1076–1086. [Google Scholar] [CrossRef]
  32. Meng, W.; Ma, R.; Chen, H.-H. Smart grid neighborhood area networks: A survey. IEEE Netw. 2014, 28, 24–32. [Google Scholar] [CrossRef]
  33. Goel, N.; Agarwal, M. Smart grid networks: A state of the art review. In Proceedings of the 2015 International Conference on Signal Processing and Communication (ICSC), Noida, India, 16–18 March 2015; pp. 122–126. [Google Scholar]
  34. Jha, A.V.; Ghazali, A.N.; Appasani, B.; Ravariu, C.; Srinivasulu, A. Reliability Analysis of Smart Grid Networks Iincorporating Hardware Failures and Packet Loss. Rev. Roum. Sci. Tech. El 2021, 65, 245–252. [Google Scholar]
  35. Appasani, B.; Mohanta, D.K. Optimal Placement of Synchrophasor Sensors for Risk Hedging in a Smart Grid. IEEE Sensors J. 2017, 17, 7857–7865. [Google Scholar] [CrossRef]
  36. Wang, Y.; Li, W.; Zhang, P.; Wang, B.; Lu, J. Reliability Analysis of Phasor Measurement Unit Considering Data Uncertainty. IEEE Trans. Power Syst. 2012, 27, 1503–1510. [Google Scholar] [CrossRef]
  37. Wang, Y.; Li, W.; Lu, J. Reliability Analysis of Wide-Area Measurement System. IEEE Trans. Power Deliv. 2010, 25, 1483–1491. [Google Scholar] [CrossRef]
  38. Appasani, B.; Mohanta, D.K. Co-Optimal Placement of PMUs and Their Communication Infrastructure for Minimization of Propagation Delay in the WAMS. IEEE Trans. Ind. Inform. 2018, 14, 2120–2132. [Google Scholar] [CrossRef]
  39. Oggerino, C. High Availability Network Fundamentals, 1st ed.; Cisco Press: Hoboken, NJ, USA, 2001. [Google Scholar]
  40. Cisco System. Cisco Aironet 1300 Series Outdoor Access Point. 2021. Available online: https://cdn.barcodesinc.com/themes/barcodesinc/pdf/Cisco/1300ap.pdf (accessed on 17 April 2021).
Figure 1. Dedicated synchrophasor communication network.
Energies 14 03428 g001
Figure 2. Shared synchrophasor communication network.
Energies 14 03428 g002
Figure 3. Hybrid synchrophasor communication network.
Energies 14 03428 g003
Figure 4. Illustration of components in SCN: (a) series configuration, (b) parallel configuration.
Energies 14 03428 g004
Figure 5. Simplified reliable dedicated SCN.
Energies 14 03428 g005
Figure 6. Simplified reliable shared SCN.
Energies 14 03428 g006
Figure 7. Simplified reliable hybrid SCN.
Energies 14 03428 g007
Figure 8. The locations of PMUs and the PDC in the West Bengal’s power grid.
Energies 14 03428 g008
Figure 9. Effect of data rate on risk in shared SCN under varying BT.
Energies 14 03428 g009
Figure 10. Effect of data rate on risk in hybrid SCN under varying BT.
Energies 14 03428 g010
Figure 11. Comparison of risk with hardware and data reliability for different SCNs: (a) overall comparison, (b) magnified portion depicting risk with hardware reliability for different SCNs.
Energies 14 03428 g011
Table 1. Key components with failure probability.
Components Failure   Probability   ( p ) References
PMU 1.7 × 10 3 [36]
PDC1[37]
OTR 4 × 10 6 [38]
Repeater 8 × 10 6 [38]
Switch 2 × 10 4 [39]
Router 1.5 × 10 4 [39]
AP 3.03 × 10 5 [40]
OFC 2.2 × 10 3 [37]
IP network0.01[37]
Table 2. Key design parameters of SCN topologies under case study.
PMUsOptimally Installed onLatitudeLongitudeCardinality of PMU Observable Set ( γ )
PMU-IBus-I24.4032°87.5543°4
PMU-IIBus-VII22.4458°88.3231°3
PMU-IIIBus-X22.2639°87.5202°3
PMU-IVBus-XI22.501°87.5734°3
PMU-VBus-XIV22.2359°88.1304°3
PMU-VIBus-XIX22.1099°88.3209°4
PMU-VIIBus-XXII26.4327°87.510°4
Table 3. Simulation results for dedicated SCN with 64 Kbps and 300 Kbps data rate.
PMUs64 Kbps300 Kbps
PDRS.IRisk (%)PDRS.IRisk (%)
PMU-I0.9990.1666666670.0166670.9890.1666666670.183333
PMU-II0.9970.1250.0375000.9970.1250.037500
PMU-III0.9980.1250.0250000.9980.1250.025000
PMU-IV0.9870.1250.1625000.9870.1250.162500
PMU-V0.9990.1250.0125000.9990.1250.012500
PMU-VI0.9990.1666666670.0166670.9990.1666666670.016667
PMU-VII0.9890.1666666670.1833330.9890.1666666670.183333
R D e d m e a n 0.064881 R D e d m e a n 0.088690
R D e d m i n 0.012500 R D e d m i n 0.012500
Table 4. Simulation results of shared SCN with 64 Kbps data rate under varying BT.
PMUs70% BT80% BT95% BT
PDRS.IRisk (%)PDRS.IRisk (%)PDRS.IRisk (%)
PMU-I0.9890.1666666670.1833330.8910.1666666671.8166670.7170.1666666674.7187685
PMU-II0.9970.1250.0375000.9120.1251.4666670.7170.1253.53907637
PMU-III0.9780.1250.2750000.9430.1250.9500000.7100.1253.627886325
PMU-IV0.9870.1250.1625000.9320.1251.1333330.7170.1253.539076375
PMU-V0.9990.1250.0125000.9140.1251.4333330.7140.1253.57460035
PMU-VI0.9990.1666666670.0166670.9210.1666666671.3166670.7170.1666666674.7187685
PMU-VII0.9890.1666666670.1833330.9430.1666666670.9500000.7100.1666666674.837181767
R S h a m e a n 0.124405 R S h a m e a n 1.295238 R S h a m e a n 4.079336885
R S h a m i n 0.012500 R S h a m i n 0.950000 R S h a m i n 3.539076375
Table 5. Simulation results of shared SCN with 300 Kbps data rate under varying BT.
PMUs70% BT80% BT95% BT
PDRS.IRisk (%)PDRS.IRisk (%)PDRS.IRisk (%)
PMU-I0.9790.1666666670.3500000.7990.1666666673.3500000.4370.1666666679.382342
PMU-II0.9670.1250.4125000.8100.1252.3750000.5370.1255.786756
PMU-III0.9680.1250.4000000.8120.1252.3500000.3770.1257.787988
PMU-IV0.9730.1250.3375000.8130.1252.3375000.4370.1257.041493
PMU-V0.9590.1250.5125000.7980.1252.5250000.5260.1255.927435
PMU-VI0.9190.1666666671.3500000.7650.1666666673.9166670.4370.1666666679.381079
PMU-VII0.9290.1666666671.1833330.8120.1666666673.1333330.3770.16666666710.377668
R S h a m e a n 0.649405 R S h a m e a n 2.855357 R S h a m e a n 7.954966
R S h a m i n 0.337500 R S h a m i n 2.337500 R S h a m i n 5.786756
Table 6. Simulation results of hybrid SCN with 64 Kbps data rate under varying BT.
PMUs70% BT80% BT95% BT
PDRS.IRisk (%)PDRS.IRisk (%)PDRS.IRisk (%)
PMU-I0.9890.1666666670.1833330.7190.1666666674.6833330.4170.1666666679.715675
PMU-II0.9970.1250.0375000.8100.1252.3750000.5070.1256.161756
PMU-III0.9780.1250.2750000.8520.1251.8500000.2870.1258.912988
PMU-IV0.99830.1250.0212500.8130.1252.3375000.4170.1257.291493
PMU-V0.97820.1250.2725000.7980.1252.5250000.5120.1256.102435
PMU-VI0.97650.1666666670.3916670.6650.1666666675.5833330.3970.16666666710.047745
PMU-VII0.9890.1666666670.1833330.8120.1666666673.1333330.3770.16666666710.377668
R H y b m e a n 0.194940 R H y b m e a n 3.212500 R H y b m e a n 8.372823
R H y b m i n 0.021250 R H y b m i n 1.850000 R H y b m i n 6.102435
Table 7. Simulation results of hybrid SCN with 300 Kbps data rate under varying BT.
PMUs70% BT80% BT95% BT
PDRS.IRisk (%)PDRS.IRisk (%)PDRS.IRisk (%)
PMU-I0.9780.1666666670.3666670.6890.1666666675.1833330.4170.1666666679.715675
PMU-II0.9870.1250.1625000.7810.1252.7375000.5710.1255.366176
PMU-III0.9730.1250.3375000.7520.1253.1000000.2870.1258.912988
PMU-IV0.9880.1250.1500000.7930.1252.5875000.3970.1257.541493
PMU-V0.96820.1250.3975000.7180.1253.5250000.4120.1257.352435
PMU-VI0.9690.1666666670.5166670.6150.1666666676.4166670.3990.16666666710.021441
PMU-VII0.9680.1666666670.5333330.7810.1666666673.6466670.3570.16666666710.711002
R H y b m e a n 0.352024 R H y b m e a n 3.885238 R H y b m e a n 8.517316
R H y b m i n 0.150000 R H y b m i n 2.587500 R H y b m i n 5.366176
Publisher’s Note: MDPI stays neutral with regard to jurisdictional claims in published maps and institutional affiliations.

