1. Introduction
The appropriate relative humidity in buildings affects comfort conditions, prevents the growth of mold and may help to limit the survival of viruses, including SARS-CoV-2 [
1]. One of the processes to get proper humidity in the air is dehumidification. Due to significant electricity consumption in traditional air-conditioning systems, the need for novel solutions for maintaining thermal comfort in indoor environments is increasing [
2]. The use of liquid desiccants can be one of the alternative solutions for air dehumidification. Liquid desiccants are fluids characterized by their ability to absorb water vapor from moist air. The mass transfer rate of absorbed water vapor depends on the difference in its partial pressures in the boundary condition above the solution and moist air. The lower the vapor pressure, the better a desiccant performs. Inorganic aqueous salt solutions such as calcium chloride (CaCl
2), lithium chloride (LiCl), lithium bromide (LiBr) and magnesium chloride (MgCl
2) can be used as liquid desiccants [
3,
4,
5]. Among the listed sorbents, lithium chloride solution has the highest moisture absorption efficiency from the air. The solution LiCl at a given temperature and concentration has the lowest partial pressure value and thus the lowest equilibrium moisture content.
Chen et al. [
4] pointed out that a desiccant dehumidification system has the following advantages: technology and economy (the required energy for the dehumidification process is about 30% less compared with conventional vapor compression), environment (elimination of refrigerants lowers global warming potential) and social (remove indoor air pollutants and improve the air quality). The paper [
6] discusses in detail the positive effects of liquid desiccant systems on indoor air quality. The effect of the liquid desiccant solution was shown to remove: gaseous contaminants (such as volatile organic compounds), biological contaminants (such as bacteria and viruses) and particulate matter (such as dust and smoke).
Liquid desiccants and regenerators can be classified as follows: direct contact type (packed bed, spray towers, falling film), indirect contact type (membrane based: flat plate and hollow fiber) [
3,
7,
8]. According to the number of streams, dehumidifiers and regenerators can be classified into two streams (air and liquid desiccant) and three streams (air, liquid desiccant and cooling or heating stream) [
7,
8,
9,
10].
Air dehumidification can be a significant source of energy use in buildings, especially in hot and humid climates [
11]. Therefore, the heat pump and hollow-fiber membrane-based liquid desiccant hybrid air system can be an alternative solution for humidity control, mainly due to lower energy consumption [
12,
13,
14,
15,
16]. An additional advantage of using a hollow-fiber membrane contactor is to eliminate the problem of carryover of solution droplets, which can occur in traditional air dehumidification with liquid desiccant in direct contact [
8,
17].
Analysis of the heat and mass transfer process in a membrane liquid air dehumidification system is an important issue. Zhang et al. investigated heat and mass transfer in a counter flow arrangement [
18] and cross-flow [
19] a hollow-fiber membrane contactor. These works provide a theoretical basis for mathematical modeling of heat and mass transfer in a hollow-fiber membrane module used for liquid desiccant air dehumidification. For simplification, a free surface model approach was proposed due to the numerous hollow-fiber membranes in the module. Chen et al. [
20] and Zhang et al. [
21] studied a novel hollow-fiber integrated liquid desiccant dehumidification system. An aqueous potassium formate solution (KCOOH) was selected as a more environmental-friendly liquid desiccant. These works omitted investigations of solution regeneration. Zhang et al. [
22] carried out a theoretical investigation to evaluate the dynamic dehumidification process in the cross-flow hollow-fiber membrane module. LiCl solution was selected as the liquid desiccant. They omitted the problem of solution regeneration. Thus, a comprehensive analysis of both air dehumidification and liquid desiccant regeneration using the membrane module is needed.
In this article, a cross-flow hollow-fiber membrane module was proposed for air dehumidification and regeneration of liquid desiccant. The use of such a module allows for a compact design with a relatively large heat and mass transfer surface. A two-dimensional heat and mass transfer model for cross-flow in a membrane module used for air dehumidification and liquid desiccant regeneration was proposed. The model equations governing heat and mass transfer were used to perform a comprehensive analysis of the effects of multiple parameters on the air dehumidification effectiveness of lithium chloride in a hollow-fiber module. A numerical study of the effect of the following parameters was performed: air to solution mass flow ratio, inlet solution temperature, inlet air humidity ratio, packing fraction on the performance indices, and air and solution parameters at the outlet of the membrane module. The effectiveness of regeneration of lithium chloride solution with outdoor air was also analyzed. The novelty was to analyze the performance of the hollow-fiber membrane module as both a dehumidifier that absorbs moisture from the air and a regenerator that re-concentrates the liquid desiccant (LiCl). A further novelty was the determination of the most favorable ranges of operating conditions for both the dehumidifier and regenerator.
2. Materials and Methods
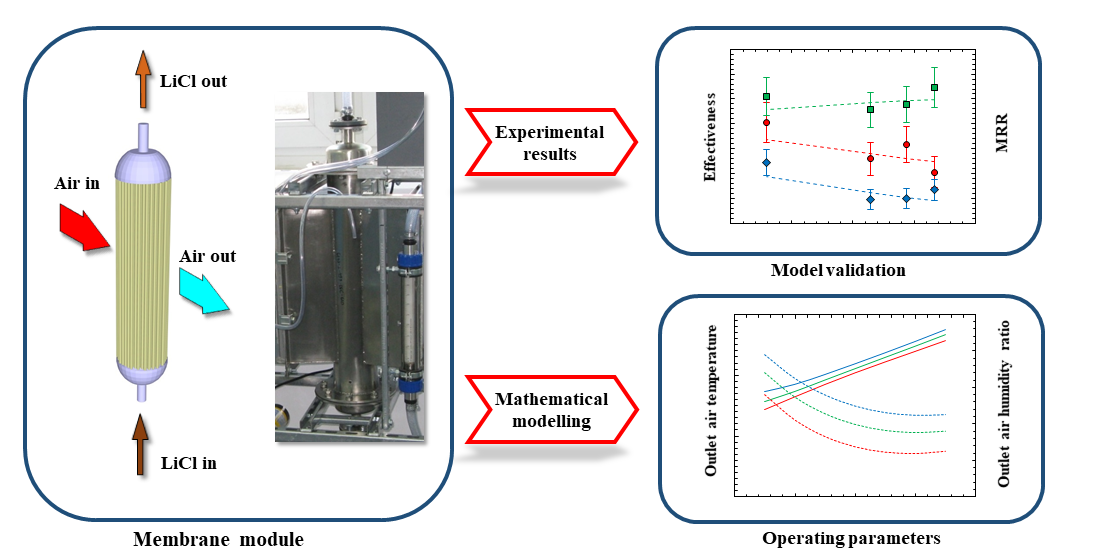
The membrane module can be used for air dehumidification process and liquid desiccant regeneration. In this paper, a module with polypropylene capillary membranes was proposed to conduct the dehumidification and regeneration process. The membranes were arranged perpendicular to the air-flow direction (
Figure 1). The geometrical characteristics of the module are summarized in
Table 1.
2.1. The Mathematical Model
The coordinate system of the membrane module for cross-flow is illustrated in
Figure 2. The air stream flows along the x-axis, while the liquid desiccant flows along the y-axis. Furthermore, the modeling will be considered in the midplane.
The following assumptions are made on the mathematical model:
The amount of heat exchanged between the system and the surroundings is negligible;
The model is based on a two-dimensional cross-flow;
The change in the air and liquid desiccant mass flow rates along the flow direction is negligible;
The air and liquid desiccant flows are steady; and
The gravity effect is negligible.
Taking into account these assumptions, the normalized governing equations for the air side and liquid desiccant side heat and mass transfer process in the membrane module was:
where:
The boundary conditions are as follows:
2.1.1. Overall Heat and Mass Transfer Coefficients
The overall heat and mass transfer coefficients in the membrane module can be determined as the sum of the individual resistances: solution side, membrane side and air side. Therefore, the overall heat and mass coefficients can be obtained by equations:
The coefficient of heat transfer at the solution side can be determined by the Hausen equation [
23]:
Hence, the coefficient of heat transfer can be calculated as:
The Sherwood number can be obtained by the Leveque equation [
23,
24]:
The coefficient of mass transfer can be calculated as:
The equivalent moisture transfer coefficient in the solution can be determined from the equation proposed by Zhang [
25]:
where K
p is the partition coefficient of a solution. It is the slope of the water uptake in solution to its equilibrium humidity [
25]. The physical properties of the solution were determined based on the paper [
26].
The detailed calculation equations for air side and membrane resistances were described by Englart [
27]. Equation (16) developed by Prasad and Sirkar [
28] was used to determine the convective mass transfer coefficient:
Nu number can be determined by means of the analogy to heat and mass transfer as:
The convective coefficients of heat and mass transfer on the shell side can be expressed respectively by Nusselt and Sherwood number:
Membrane thermal conductivity can be calculated from the thermal conductivity of moist air λ
a, and the solid material part λ
so:
Effective moisture diffusivity in the membrane can be determined as:
where diffusivity D is estimated as shown in following equations [
29]:
2.1.2. Performance Indices
The sensible effectiveness and latent effectiveness can be used to evaluate the performance indicator of the dehumidification and reaeration process.
The performance of the dehumidifier also can be evaluated based on the moisture removal rate (MRR):
On the other hand, the regenerator performance can be evaluated by the moisture addition rate (MAR):
2.2. Experimental Set–Up
For model validation, measurements were performed on a test set up, the schematic diagram of which is shown in
Figure 3. Measurements were performed for two operating modes: air dehumidification and solution regeneration. The same membrane module was used for dehumidification and regeneration (shown in
Figure 1). In dehumidification mode, the lithium chloride temperature was decreased on the cooler, while in regeneration mode the temperature was increased on the heater. A plate heat exchanger supplied by a temperature stabilizer B 2000 was used as a cooler and a heater.
The test bench was equipped with devices enabling measurement of the following parameters:
temperature and relative humidity of the air at the inlet and outlet of the membrane module;
liquid desiccant temperature before and after the module;
air flow rate in the duct;
liquid desiccant flow rate; and
liquid desiccant specific electrical conductivity.
The liquid desiccant temperatures before and after passing through the module were measured using the cable resistance thermometer TOPE410, the parameters of which are: accuracy ±(0.15 + 0.002|ts|) °C, sensing element Pt1000. The relative humidity and temperature of the air stream at the inlet and outlet of the membrane module were measured using the temperature and humidity duct probe T3113 (relative humidity accuracy ±2.5%, temperature accuracy ±0.4 °C). To measure the concertation of a liquid desiccant, a method based upon the measurement of the electrical conductivity of the solution was used. The cc-401 conductivity meter was used (accuracy ±0.25%).
The standard uncertainty of the measurement and the relative combined standard uncertainty were determined based on the guide [
30] as:
The combined standard uncertainty was determined by the law of propagation of uncertainty, as given by:
The standard uncertainties for measurement are: air temperature, ±0.2 °C; relative humidity, ±1.4%; solution temperature, ±0.1 °C; solution mass flow rate, ±2.9 kg/h; air mass flow rate, ±1.8%; and concentration of solution ±0.1%.
3. Model Validation
The experimental results were used to validate the model. Sample results of the experimental data obtained on the test set-up for different measurement conditions are presented in
Table 2.
The comparison between experimental data and results calculated from the mathematical model is presented in
Table 3. The differential Equations (1)–(4) were solved by means of the Runge–Kutta 4th order method.
The comparison shows that the results calculated from the model are in good agreement with the experimental data. The agreement was evaluated based on a relative error. The relative error between the true value x
T and the approximate value x
A was denoted by:
For the air temperature at the outlet from the module, the maximum relative error did not exceed 2%. For the air humidity content, the error did not exceed 3%. For the liquid desiccant temperature, the relative error did not exceed 5%.
Figure 4,
Figure 5 and
Figure 6 show the comparison of the performance indicators determined from the experimental results and the performance indicators calculated based on the data obtained from the mathematical model. In addition, in this case the comparison shows that the results calculated from the model are in good agreement with the experimental data. The values of the obtained performance indicators were satisfactory. Similar results for effectiveness were obtained by Zhang et al. [
21].
4. Numerical Results and Discussion
In the previous section, the mathematical model was satisfactorily verified with the empirical data from conducted measurements. Therefore, it was employed to predict the dehumidification performance of the hollow-fiber membrane module. In this section, a parametric study was carried out to investigate the effects of various operating conditions. It should be emphasized that the operating conditions significantly influence the dehumidification performance. Numerical simulations were performed based on the membrane-module specification listed in
Table 1, unless otherwise stated. Several performance indicators, including MRR, sensible effectiveness, latent effectiveness and MAR were investigated. Based on the performed simulations, the most favorable ranges of operating conditions could be given.
4.1. Inlet Air Humidity Ratio Effect
The objective of this section is to investigate the effect of the inlet air humidity ratio on module performance. This effect under various air to solution mass flow ratios in the range of 0.75–1.25 is presented in
Figure 7. The simulations were carried out under the assumption of a constant solution concentration of 35%. The inlet air temperature, the inlet solution temperature, and the solution mass flow rate were constant and equal 30 °C, 18 °C, 100 kg/h, respectively.
The effect of the inlet air-humidity ratio on the outlet air temperature is depicted in
Figure 7a. For instance, as the inlet air-humidity ratio increases from 10.0 g/kg to 22.0 g/kg, the achieved outlet air temperature rises from 24.0 °C to 25.1 °C at m* of 0.75, from 24.7 °C to 25.7 °C at m* of 1.00, and from 25.2 °C to 26.2 °C at m* of 1.25. It can be concluded that this increase remained about 4%. However, it corresponds with a decrease in the sensible effectiveness by 17.7%, 20.3% and 22.5%, respectively (
Figure 7c). In all cases, the peak of the sensible effectiveness was reached for the lowest inlet air-humidity ratio. It can be explained as follows: the solution absorbs more water vapor from the air as the inlet air-humidity ratio increases. As a result, the solution temperature increases with an increase in the inlet air-humidity ratio due to the release of absorption heat in the solution. Consequently, a decrease in sensible effectiveness can be observed.
As can be seen in
Figure 7b, the highest MAR of 0.173 g/s was obtained for the inlet air-humidity ratio of 22.0 g/kg and the highest m*. The maximum values of MAR for the m* of 0.75 and 1.00 were 0.143 g/s and 0.160 g/s, respectively. It should be noted that the MAR increases with an increase in the inlet air-humidity ratio. These trends are directly proportional to the calculated outlet air-humidity ratio (
Figure 7a). This can be explained by the direct correlation between the air-humidity ratio difference and the MAR coefficient. However, the peak value of MAR was indicated for the m* of 1.25 due to the highest air mass flow rate.
The conducted analysis provides a valuable observation related to the latent effectiveness as shown in
Figure 7d. It can be seen that the latent effectiveness results are slightly affected by the inlet air-humidity variation. However, the peak of the latent effectiveness was reached for the highest inlet air-humidity ratio. As the inlet air-humidity ratio increased from 10.0 g/kg to 22.0 g/kg, the achieved maximum latent effectiveness was 0.37 at m* of 0.75, 0.31 at m* of 1.00, and 0.27 at m* of 1.25. The reason is that the driving force of moisture transfer increases with an increase in the inlet air-humidity ratio due to the equilibrium moisture content in the solution. As a conclusion, it should be emphasized that the proposed dehumidifier maintains its performance in a wide range of inlet air-humidity ratios.
4.2. Inlet Solution Temperature Effect
In order to investigate the effect of the inlet solution temperature on the performance of the dehumidification module, an evaluation was conducted under various solution temperatures in the range of 14–26 °C. The simulations were carried out under various solution concentrations in the range of 25–35%. The inlet air temperature, the inlet air-humidity ratio, the air mass flow rate, and the solution mass flow rate were constant and equal to 30 °C, 18.0 g/kg, 50 kg/h, 50 kg/h, respectively. As shown in
Figure 8a, with the increase of solution temperature, the outlet air temperature also increases from 23.0 °C to 29.4 °C at X
1 of 35%, from 22.7 °C to 28.9 °C at X
1 of 30% and from 22.3 °C to 28.5 °C at X
1 of 25%. An increase in the inlet solution temperature leads to a lower heat transfer between air and solution. This was indicated by a significant drop in the sensible effectiveness, as presented in
Figure 8c. For instance, as the inlet solution temperature increases, the obtained sensible effectiveness drops from 0.44 to 0.16, taking into account the solution concentration of 35%. For the diluted desiccant solutions (25%, 30%), the effect of an increase in solution temperature was less significant. However, it corresponds to lower absorption of moisture by the solution.
Further, it can be observed in
Figure 8b that the MAR decreases by about 24% at X
1 of 35%, 36% at X
1 of 30% and 52% at X
1 of 25% as the inlet solution temperature increases. The latent effectiveness follows a similar trend, however; it appears to be less affected by the higher inlet solution temperature (
Figure 8d). These deteriorations of latent effectiveness were approximately 3%, 4% and 6%, respectively. It should be noted that the higher inlet solution temperature results in a higher equilibrium moisture content in the solution. For that reason, the outlet air-humidity ratio is significantly affected by an increase in solution temperature (
Figure 8a). Having in view the foregoing, the latent effectiveness should be carefully considered as the performance indicator in the present case.
In order to improve the dehumidification performance, the solution temperature should be maintained at low values. This contributes to a better mass transfer and moisture absorption in the module. In conclusion, the conducted analysis provides the recommended inlet solution temperature in the range of 14–18 °C in order to obtain the balanced ratio of sensible and latent effectiveness.
4.3. Air to Solution Mass Flow Ratio Effect
Figure 9 indicates the effect of various air to solution mass flow ratios on the dehumidification performance. In order to evaluate this effect, numerical simulations were conducted under the m* in the range of 0.5–4.5. The calculations were carried out under various solution concentrations in the range of 25–35%. The inlet air temperature, the inlet air-humidity ratio and the solution mass flow rate were constant and equal to 30 °C, 18.0 g/kg, 100 kg/h, respectively.
As depicted in
Figure 9a, with the increase of m*, the outlet air temperature also increases from 23.7 °C to 28.1 °C at X
1 of 35%, from 23.5 °C to 27.9 °C at X
1 of 30% and from 23.3 °C to 27.7 °C at X
1 of 25%. This significant increase in temperature could be explained by the increase in air mass flow rate under increasing m* while the solution mass flow rate remains constant. Hence, the solution temperature rises due to the heat flux from the incoming air. This continuously results in the reduction of the heat transfer rate in the module. As a result, the air mass flow rate will be less cooled, even for a relatively cold solution. This corresponds to a considerable decrease in the sensible effectiveness as indicated in
Figure 9c. These decreases of sensible effectiveness were approximately 70.0%, 67.7% and 65.7%, according to the solution concentrations of 35%, 30% and 25%, respectively.
As can be seen in
Figure 9b, the highest MAR of 0.181 g/s was obtained for the solution concentration of 35% and the m* of 4.5. In addition, the MAR peak values for the solution concentrations of 30% and 25% were 0.150 g/s and 0.119 g/s, respectively. However, an increase in the MAR is directly correlated with an increase in air mass flow rate for higher m* values. Hence, it cannot be considered as a reliable performance indicator in this case (see the outlet air-humidity ratios in
Figure 9a).
In
Figure 9d, the latent effectiveness follows a similar trend as the sensible effectiveness, and it decreases significantly with the increase of m*. The obtained latent effectiveness reaches its maximum value at the m* of 0.5. These values were 0.47, 0.46 and 0.45 according to the solution concentrations of 35%, 30% and 25%, respectively. Additionally, by increasing the m* to 4.5, the latent effectiveness decreases gradually to 0.10, 0.094 and 0.087. This decrease can be explained by the reduction in mass transfer rates through the hollow-fiber membrane under higher air velocities due to the increasing m*.
Considering the aforementioned results, it is suggested that the m* should be adopted in the range of 0.5–1.25 in order to obtain a noticeable decrease in the supply air-humidity ratio.
4.4. Module Packing Fraction Effect
The effect of the dehumidifier module packing fraction on the dehumidification performance was also evaluated. The packing fraction was defined as a ratio of the total fiber cross-section area to the cross-section of the module. The effect of the packing fraction under various hollow-fiber membrane outer diameters in the range of 2.0–3.0 mm is presented in
Figure 10. The calculations were conducted under the assumption of a constant solution concentration of 35%. The inlet air temperature, the inlet air-humidity ratio, the inlet solution temperature, the air mass flow rate, and the solution mass flow rate were constant and equal 30 °C, 18.0 g/kg, 18 °C, 100 kg/h and 100 kg/h, respectively.
The influence of the increasing module packing fraction on the outlet air temperature is illustrated in
Figure 10a. For example, as the packing fraction increases from 0.15 to 0.45, the obtained outlet air temperature rises from 24.4 °C to 25.6 °C taking into account the smallest membrane outer diameter. As a result, the sensible effectiveness drops from 0.46 to 0.37 (
Figure 10c). The same trends can be observed with an increase in the membrane outer diameter. Since the value of solution mass flow rate is constant, the solution mass flow rate for one membrane decreases with an increase in the packing fraction. As a result, the solution temperature at the outlet increases, which has a significant impact on the heat transfer. As a consequence, the accumulated heat within the solution will heat up the air mass flow rate.
On the other hand, there is a positive correlation between dehumidification performance and the increase in packing fraction, as shown by the outlet air-humidity ratios in
Figure 10a. The lowest outlet air humidity ratios were achieved at the packing fraction of 0.40. Regarding the increase in membrane diameter, these values were 11.18 g/kg, 11.75 g/kg and 12.23 g/kg, respectively.
As can be seen in
Figure 10b, the highest MAR of 0.189 g/s was obtained for the packing fraction of 0.40 and the smallest membrane diameter of 2.0 mm. The maximum points of MAR for the other diameters were 0.174 g/s and 0.160 g/s, respectively. Similar to the trend presented in
Figure 10b, the numerically obtained latent effectiveness reaches its maximum value at the packing fraction of 0.40 (
Figure 10d). These values were 0.47, 0.43 and 0.40, respectively. It is apparent that an increase in the packing fraction leads to an increase in the contact area between the air and the desiccant. However, there is a critical point associated with the packing fraction and it was 0.40 in this study. It should be emphasized that a further increase in the packing fraction deteriorates the dehumidification process. It is due to the fact that the Sherwood number decreases with an increase in packing fraction, according to Equation (16).
As a conclusion, the performed analysis gives the recommended packing fraction in the range of 0.30–0.40 in order to achieve the optimal dehumidification performance. Moreover, the results show that by reducing the membrane diameter, higher dehumidification effectiveness can be obtained.
4.5. Regeneration of the Diluted Solution
The effect of the solution temperature on the diluted solution regeneration process is presented in
Figure 11. The calculations were performed under the assumption of constant solution concentrations equal to 25% (
Figure 11a) and 35% (
Figure 11b). The inlet air temperature, the air mass flow rate, and the solution mass flow rate were constant and equal to 30 °C, 100 kg/h, 100 kg/h, respectively.
Moisture addition rate profiles were obtained for various inlet air-humidity ratios. As can be seen in
Figure 3b, the solution has to be heated to enable the regeneration process. The results clearly show that a higher inlet solution temperature has a positive impact on the regeneration process. By increasing the inlet solution temperature to the maximum value of 50 °C, the MAR rises progressively and reaches its maximum value of 0.209 g/s at ω
a1 of 10.0 g/kg and X
1 of 25% (
Figure 11a). However, the MAR decreases with increasing inlet air-humidity ratio and achieves the value of 0.165 g/s at ω
a1 of 16.0 g/kg and the same solution temperature and concentration. It should be noted that the solution concentration plays an important role and for its value of 35%, the MAR varies in the range of 0.045–0.091 g/s at the maximum solution temperature (
Figure 11b). As a result, the diluted solution has to be more intensely heated for effective regeneration when the solution concentration is higher. Moreover, the obtained results reveal that by reducing the inlet air-humidity ratio, higher regeneration effectiveness can be achieved. However, the obstacle of more humid air at the module inlet can be compensated with a higher solution temperature. It should be emphasized that the solution temperature should be kept within a reasonable range of 40–50 °C.
To assess the effect of air to solution mass flow ratio, a set of numerical simulations was carried out as shown in
Figure 12. Calculations were performed by varying the air to solution mass flow ratio, while the solution mass flow rate was kept as 100 kg/h. The inlet solution temperature, the inlet air-humidity ratio, and the solution concentration were set to 50 °C, 12.0 g/kg, 30%, respectively. As can be seen in
Figure 12a, the highest MAR of 0.167 g/s was obtained for the highest m* of 0.45 and the highest inlet air temperature of 35°C. At the inlet air temperature of 30 °C, the highest MAR of 0.153 g/s was reached at m* of 3.0. Taking into account the inlet air temperature of 25 °C, the maximum MAR of 0.142 g/s was achieved at m* of 2.5. Thereafter, the regeneration performance decreases with increasing m*. This is due to the fact, as m* increases, the air mass flow rate is much larger than the solution mass flow rate. This decrease may be explained by a reduction in heat and mass transfer effectiveness in the module under higher air velocities. It is recommended to set the m* during the regeneration process in the range 1.0–2.0 to avoid a higher pressure drop. As a consequence, the power consumption of the fans can be reduced.
It can be observed from
Figure 12b that the outlet solution temperature drops steadily with the increasing m*. The reason is that the increased regeneration air mass flow rate has a positive impact due to the increased heat capacity rate. In addition, the lower final solution temperature leads to a reduction in energy consumption for cooling the solution in the dehumidification cycle. However, the m* in the module should be considered based on a trade-off between the MAR and the outlet solution temperature.


