Article

Development of a High-Flux Solar Simulator for Experimental Testing of High-Temperature Applications

Department of Engineering for Innovation, University of Salento, 73100 Lecce, Italy
*
Author to whom correspondence should be addressed.
Energies 2021, 14(11), 3124; https://doi.org/10.3390/en14113124
Submission received: 26 April 2021 / Revised: 20 May 2021 / Accepted: 23 May 2021 / Published: 27 May 2021
(This article belongs to the Topic Interdisciplinary Studies for Sustainable Mining)

Abstract

:
In the last few years, several studies have been carried out on concentrating solar thermal and thermochemical applications. These studies can be further enhanced by means of high-flux solar simulators (HFSS), since they allow the development of experimental tests under controlled irradiance conditions, regardless of sunshine. In this work, a new high-flux solar simulator, capable of reaching levels of irradiance higher than 100 W/cm2 (1000 suns), has been designed, built and characterized. This simulator is composed of 8 ellipsoidal specular reflectors, arranged face-down on a horizontal plane, in order to irradiate from the upper side any system requiring the simulation of concentrated solar radiation; differently from the HFSSs described in the scientific literature, this configuration allows the avoidance of any distortion of fluid-dynamic or convective phenomena within the system under investigation. As a first step, a numerical analysis of the HFSS has been carried out, simulating each real light source (Xe-arc), having a length of 6.5 mm, as a line of 5 sub-sources. Therefore, the HFSS has been built and characterized, measuring a maximum irradiance of 120 W/cm2 and a maximum temperature of 1007 °C; these values will be enough to develop experimental tests on lab-scale thermal and thermochemical solar applications.

1. Introduction

In the last few years, several high-flux solar simulators (HFSS) have been developed for concentrated solar power (CSP) system testing and solar thermochemical analysis, such as testing of components and materials in high-temperature thermo-chemical applications, concentrating photovoltaic applications, etc. [1,2,3,4,5]. These systems are capable of producing a continuous high-power beam of radiation, similar in its characteristics to concentrated solar light. They normally use, as a radiation source, high-power xenon or argon arc lamps, having a spectrum similar to sunlight; appropriate optical reflectors allow to reach level of light concentration comparable to CSP systems [6].
The use of outdoor concentrated solar systems, such as heliostat fields, dish concentrators and solar furnaces for R&D activities is often difficult, due to solar intensity variability. On the other hand, indoor HFSSs have many advantages, such as stable, continuous and controllable irradiance, and not being affected by time, season or climate. For these reasons, the number of HFSSs employed for experimental tests has increased recently.
Petrasch et al. [7] described a HFSS, installed at the Paul Scherner Institute, capable of delivering over 50 kW of radiative power at peak fluxes. It reached an average flux of 6800 kW/m2 over a 60 mm diameter circular target, corresponding to a stagnation temperature above 3300 K.
Martines-Manuel et al. [8] designed and built a new HFSS for medium/high-temperature solar material testing and solar thermochemical process analysis in Mexico. This system used seven 2.5 kWel Xenon short arc lamps, each close-coupled to a 2 m focal length truncated ellipsoidal specular reflector made of polished aluminum. They estimated a numerical peak flux of 267 kW/m2 for a single lamp-reflector, obtaining an experimental peak flux of 194 kW/m2 and a flux spot diameter of 120 mm per lamp.
In a recent study, Zhu et al. [9], in order to reach a high light flux on a large area, developed a 130 kWe solar simulator with tunable ultra-high flux in a projection area of 200 mm diameter. They coupled 13 10 kWe xenon short-arc lamps and reflectors, mapping the light intensity distribution by means of a Gardon gauge and a 2-D moving unit.
To simulate, as closely as possible, the spectrum of the sun, Ekman et al. [10] created a 42 kWe HFSS, using 6 metal halide lamps, obtaining a peak thermal flux of about 1 MW/m2.
Li et al. [11] designed, built and optically characterized a 42 kWe high-flux solar simulator, consisting of seven reflector-lamp pairs, arranged in the center and vertices of a regular hexagon, at IMDEA Energy Institute, Spain.
A spectral characterization of a 50 kW Xenon arc lamp-based solar simulator (HFSS) has been carried out by Alxneit and Schmit [12]. They presented a spectral analysis in the range of 350–1600 nm, recorded at different radial distances from the position of maximum concentration, showing that the relative intensity of the short wavelength region decreases with increasing radial distance from the center of the spot.
The world’s largest research facility for the generation of artificial sunlight, named Synlight, has been built at the DLR Institute of Solar Research in Jülich. This HFSS is composed by 149 high-power radiators, arranged in an area measuring 14 by 16 m. It will be primarily used to develop solar fuels, reaching 10,000 suns and temperatures of up to 3000 °C [13].
Differently from the above-described systems, Song et al. [14] developed a flexible, high-flux solar simulator that consists of a Xenon lamp-truncated ellipsoidal mirror array, a multicomponent glass optical-fiber bundle and a secondary concentrator, reaching a maximum light density of 500 kW/m2.
Some works have been carried out on the characterization of HFSS. Dai et al. [15] developed data acquisition and control software for flux measurement in HFSS. Particularly, a flux measurement algorithm, based on image processing method, was produced and applied to an 84 kWe high flux solar simulator. Xiao et al. [16], in order to evaluate the performance of a multi-lamp high-flux solar simulator, proposed a novel flux-mapping method, based on two Lambertian targets: the first was a stationary water-cooled Lambertian target with a circular hole in the center, used to install a flux sensor; the second was a movable Lambertian target, used to cover the flux sensor when shooting the concentrated light beam image. The authors showed a total relative error of this flux mapping system equal to ±8.1%, with a repeatability of 1.1%.
Li et al. [17] used a solar simulator composed of 12 Xe-arc lamps to drive a solar Stirling engine for all-weather indoor tests. Ioannou et al. [18] studied the photocatalytic conversion of two β-blockers, namely atenolol and propranolol, in aqueous TiO2 suspensions using a solar simulator equipped with 1 kW Xe-OP lamp.
Codd et al. [19] developed a low-cost solar simulator for studying optical melting and light absorption of molten salts at high temperatures. They employed seven metal halide outdoor stadium lights of 1500 W to simulate concentrating solar power heliostat, as metal halide bulbs and ballasts are cheaper than xenon arc lamps. The match of this kind of lamp to sunlight is only sufficient, because metal halide lights have irradiance peaks between 800 and 1000 nm, with a 5% higher energy output than solar irradiance in the same wave-length range. The system was able to reach a peak of 60 suns and averaged a concentration of 45 suns over a 38-cm-diameter target.
Li et al. [20] studied and designed a new 3D compound parabolic concentrator for a multi-source high-flux solar simulator to be used in high-temperature solar thermochemical applications. Optical calculations and design were done by Monte Carlo ray-tracing simulations, in order to determine basic geometrical parameters of the CPC (acceptance angle, entry aperture radius etc.). The results of the optical simulations showed that the CPC increased the concentration ratio by a factor of 4.1 at an optical efficiency of 85.4%, and reduced spillage loss from 78.9% to 32.1% and the non-uniformity on the target.
The above-described systems have been primarily designed to simulate operating conditions (directional, spatial, and spectral distributions of concentrated radiation) of several solar plants, based on troughs [21,22,23,24], dishes [25,26] and towers [27,28,29], or solar furnaces [30,31], but recently they have gained new interest in direct light absorption, because several studies of solar plants based on nanofluids focused their attention on this topic. De Risi et al. [32] and Potenza et al. [33] studied solar-transparent parabolics through collectors working with gas-based nanofluid, able to directly adsorb solar radiation. They demonstrated how nanoparticles can compensate the relatively low heat transfer coefficient of gaseous fluids with an increase of heat transfer capabilities. Kasaeian et al. [34] investigated the effects of direct solar absorption in parabolic trough collectors with a glass-glass absorber tube, by using two different nanofluids. Finally, a recent review article of Farhana et al. [35] described the state of the art in solar collectors based on nanofluids.
Other areas in which HFSSs are finding widespread use are related to raw materials processing [36], ceramic material processing, calcination, etc. [37]. Furthermore, in the last years the production of solar fuels, including hydrogen, which is mainly based on H2O/CO2 splitting and decarbonization processes (cracking, reforming, and gasification of carbonaceous feed-stock) [38,39,40,41] and which can be widely studied by means of HFSS, is finding increasing interest from the scientific and industrial community. In two recent studies Milanese et al. [42,43] proposed a new model of a double-loop fluidized bed solar reactor, involving CeO2 nanoparticles and two gas streams (N2 and CO2) for efficient thermochemical fuel production, whose schematic is shown in Figure 1.
In this system, the overall reaction CO2→CO+1/2 O2 is achieved, by means of a thermochemical two-step cycle, based on CeO2 nanoparticles.
In order to experimentally develop solar thermal and thermochemical applications, in this study a new HFSS has been designed, built and characterized, according to a different geometry with respect to the above-described papers: indeed, the parabolic mirrors were arranged face-down on a horizontal plane to irradiate the system under investigation from the upper side. Furthermore, this configuration can be also be usefully employed in studies of low-concentration direct absorption, where convective phenomena within heat transfer fluids (e.g., nanofluids) can be accurately evaluated only by lighting the specimen from above, avoiding any alteration of the motions in the fluid, with respect to the real case.
The main objective of the present work was to build a HFSS capable of reaching a level of irradiance bigger than 100 W/cm2 (1000 suns), since this is enough to develop experimental tests on lab-scale high-temperature (>800 °C) solar applications (e.g., fluidized bed solar reactor). Therefore, this paper describes the optical design, fabrication and characterization of a high-flux solar simulator based on an array of Xe-arc lamps with ellipsoidal specular reflectors.

2. Design of Solar Simulator
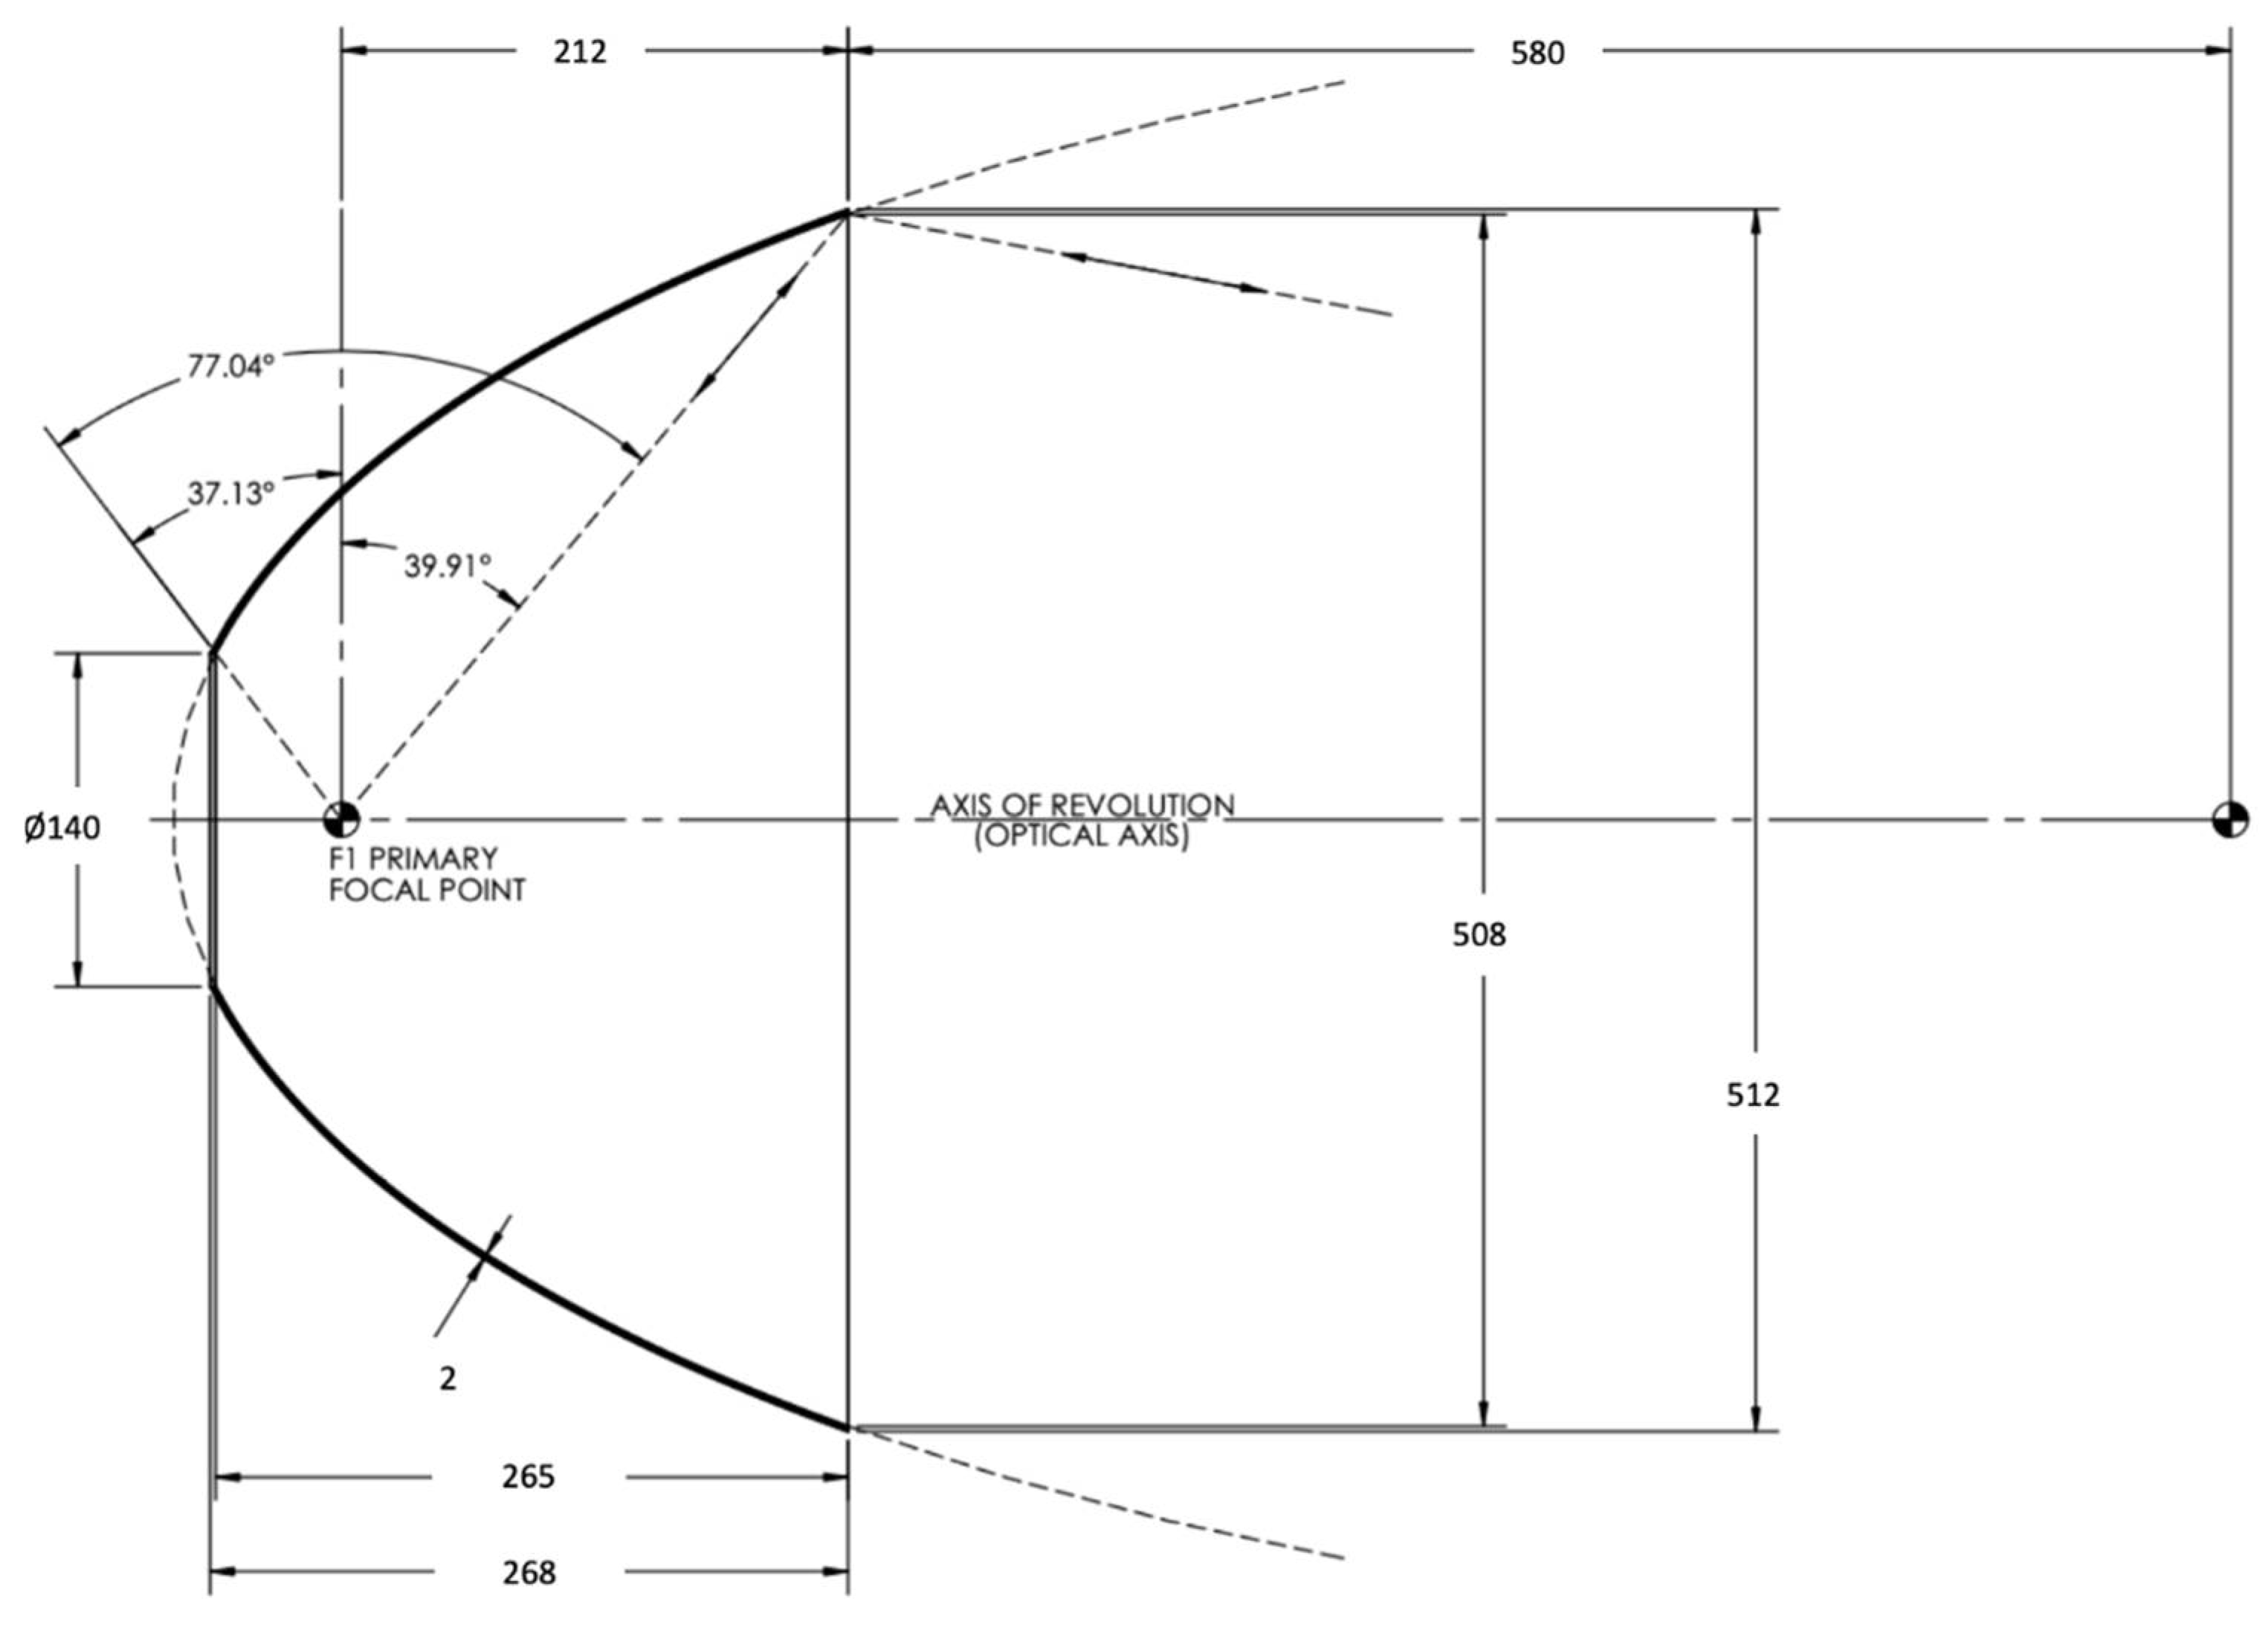
The HFSS system consists of eight elliptical reflectors arranged in such a way as to obtain the convergence of the light beams on a target, according to the geometric configuration shown in Figure 2.
Figure 3 reveals a CAD model of the HFSS: as can be seen the solar simulator has external dimensions equal to 2100 × 1700 × 3200 mm, while the internal view shows the reflectors placed above a height adjustable workbench, according to the required degree of light focusing.
The geometric characteristics of each reflector are shown in Figure 4, while Figure 5 shows the coating (rhodium) reflectivity as a function of incident light wavelength.
The rhodium coating has been chosen due to its very high hardness and high reflectivity, which guarantee the general durability of the system, coupled with good performance.
According to the design configuration, each reflector has been equipped with a short arc lamp mod. OSRAM XBO 4000 W/HSA OFRs are arranged along the axis of the ellipsoidal mirror, whose technical specifications and the photometric solid are shown in Table 1 and Figure 6 respectively.
As can be seen in Figure 6b, the Xe-arc spectrum approaches the solar one in the visible range, with the exception of a peak around 480 nm, but in the near-infrared, the discrepancies are more significant. However, it is important to clarify that the main purpose of this work is to realize a HFSS capable of reaching high radiations and high temperatures for thermal and thermochemical solar applications. Therefore, to achieve this, a concentration ratio between 1000 and 2500 suns is required [43] and the infrared radiation peaks between 800 and 1000 nm still remain useful.
For a lamp, the radiation power, P i r r , can be calculated as:
P i r r = λ 1 λ 1 Q ˙ λ d λ
For the wavelength range of 200–1200 nm and for a nominal electrical power input of 4 kW, P i r r reached 2180 W. It was assumed that this value did not vary significantly among the different lamps.

Optical Analysis

The optical analysis was carried out by means of Opticad software [44], taking into account that all light sources were composed of electric arcs of 6.5 mm length. Each lamp has been simulated by discretizing the light source into five sub-sources, arranged at a distance of 1.625 mm from each other in the focus of the mirror. From each source, 21,600 beams with opening angle and intensity compatible with the photometric solid (Figure 6a) were branched, for a total of 108,000 simulated beams. Table 2 resumes the main parameters of Opticad simulations, while Figure 7, Figure 8 and Figure 9 show an example of the Opticad simulation, the radiative flux map calculated at focal plane for the lamp n. 1 and the cumulative radiative flux map, calculated at focal plane with all lamps, respectively.
As it can be observed, a lamp showed a maximum calculated irradiance of about 25 W/cm2 (250 suns), allowing it to reach a theoretical maximum cumulative irradiance with 8 lamps of about 2000 suns. Finally, all radiation is concentrated on a circular surface with a diameter of about 13 cm.

3. Construction and Alignment of the Solar Simulator

The HFSS has been constructed according to the above-described optical design: Figure 10 shows some pictures of the system.
The solar simulator was equipped with a mobile workbench realized by means of a chilled optical bench (Figure 10d). This solution allowed:
  • focus/defocusing the light, by moving up and down the workbench, to reach the desired concentration value;
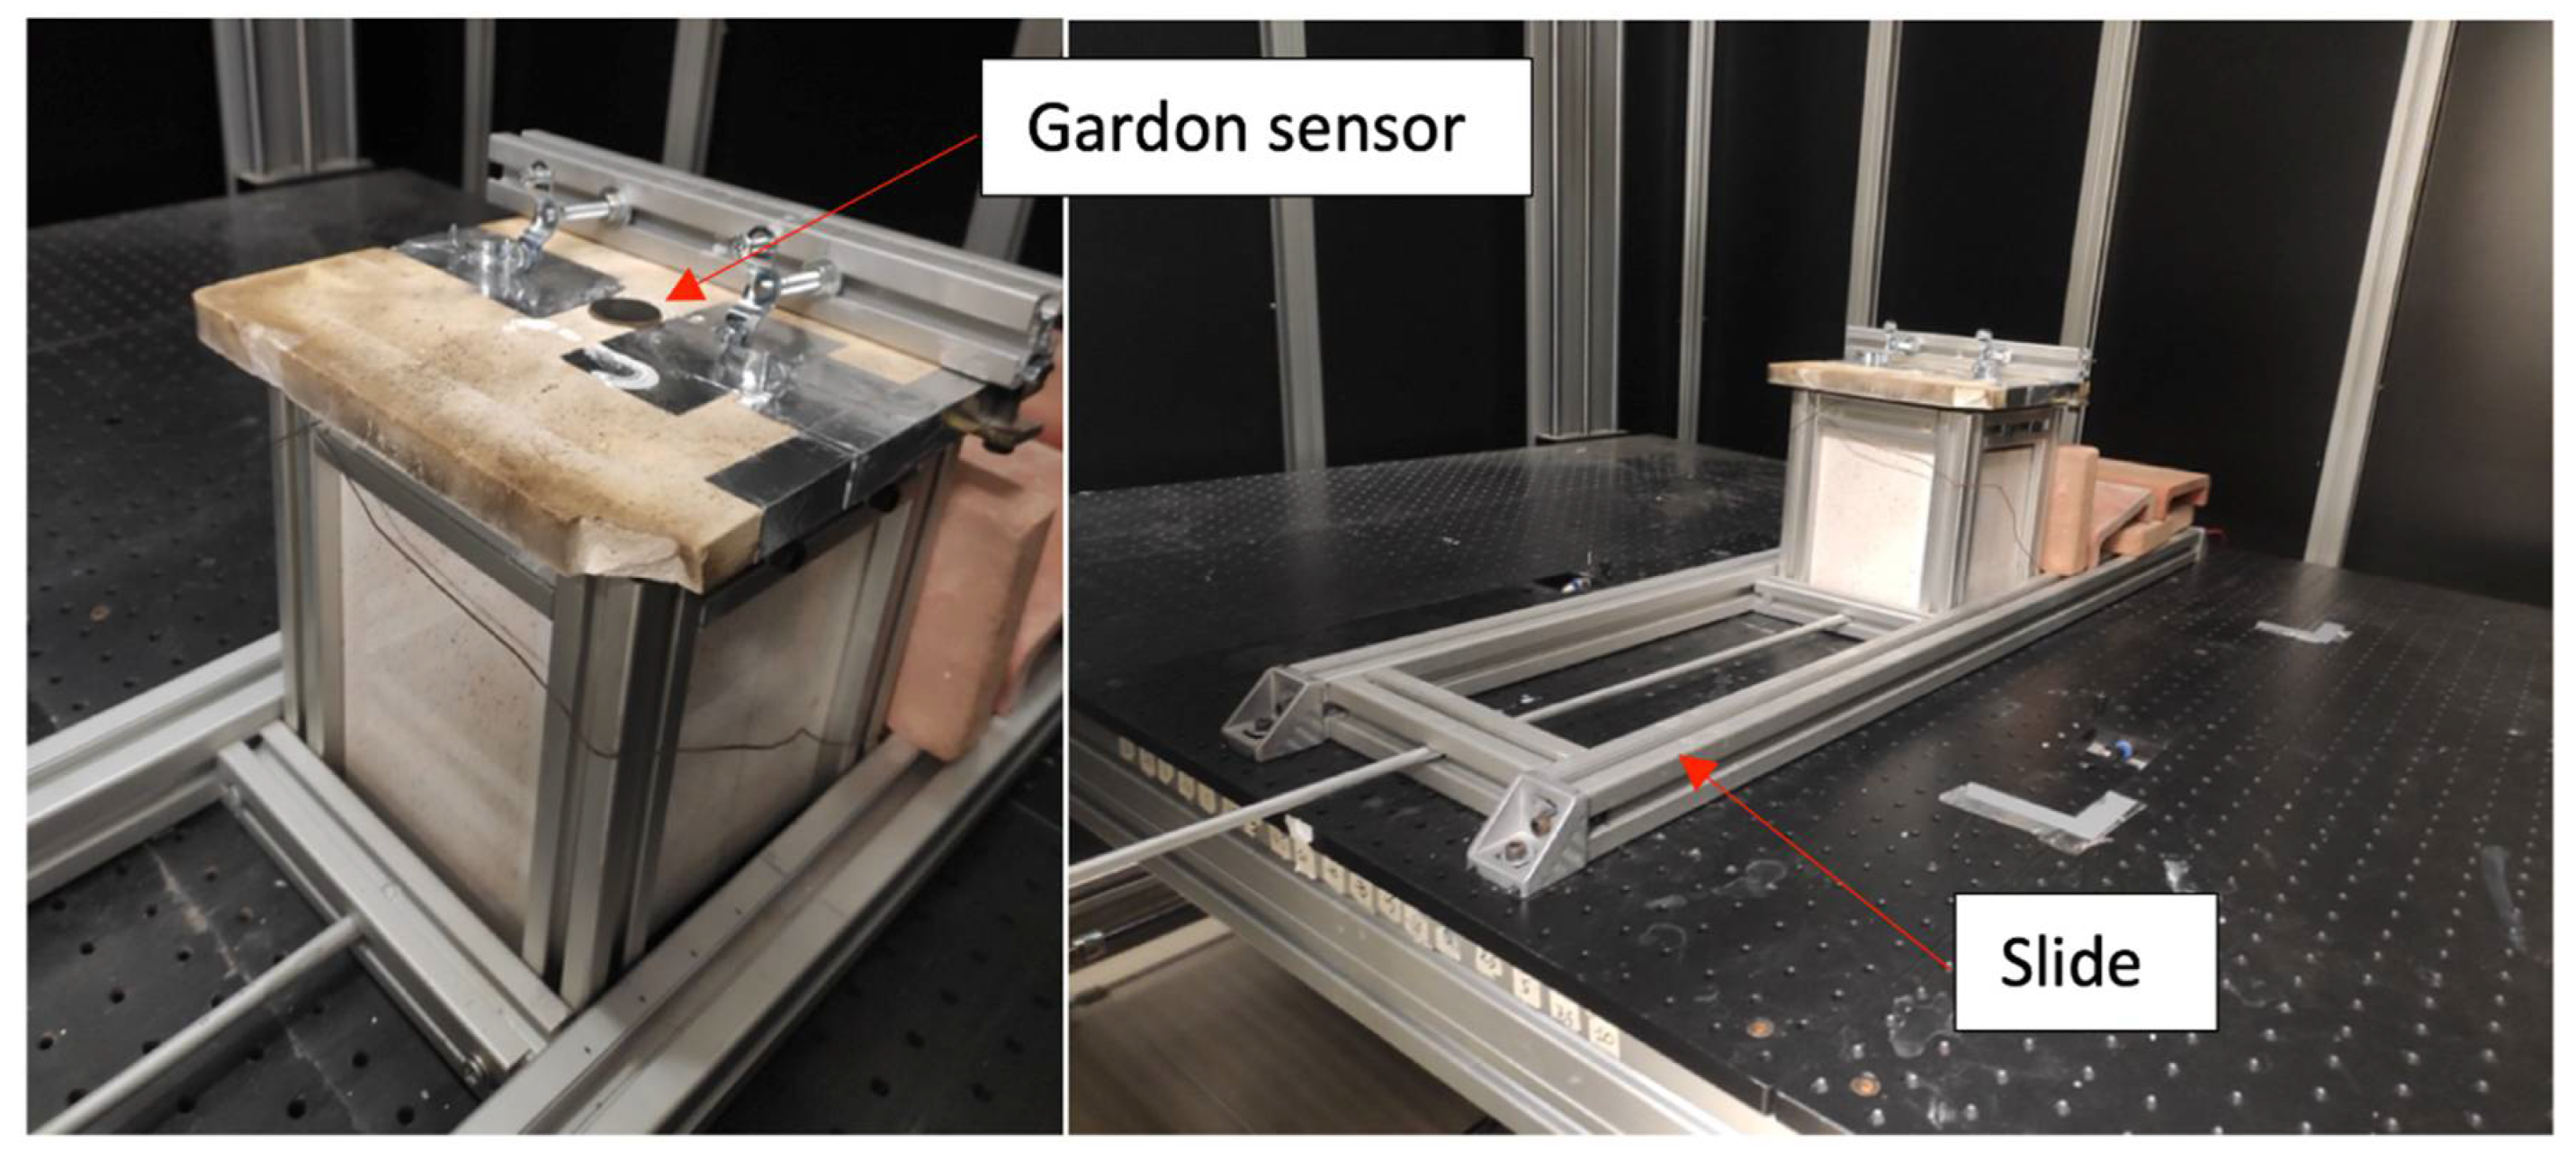
  • fixing a sample holder with extreme precision using the threaded holes of the optical bench.
In this phase a specific procedure was developed to align all lamps towards the same focal point:
  • all elliptical reflectors were equipped with a 2-axis rotating system;
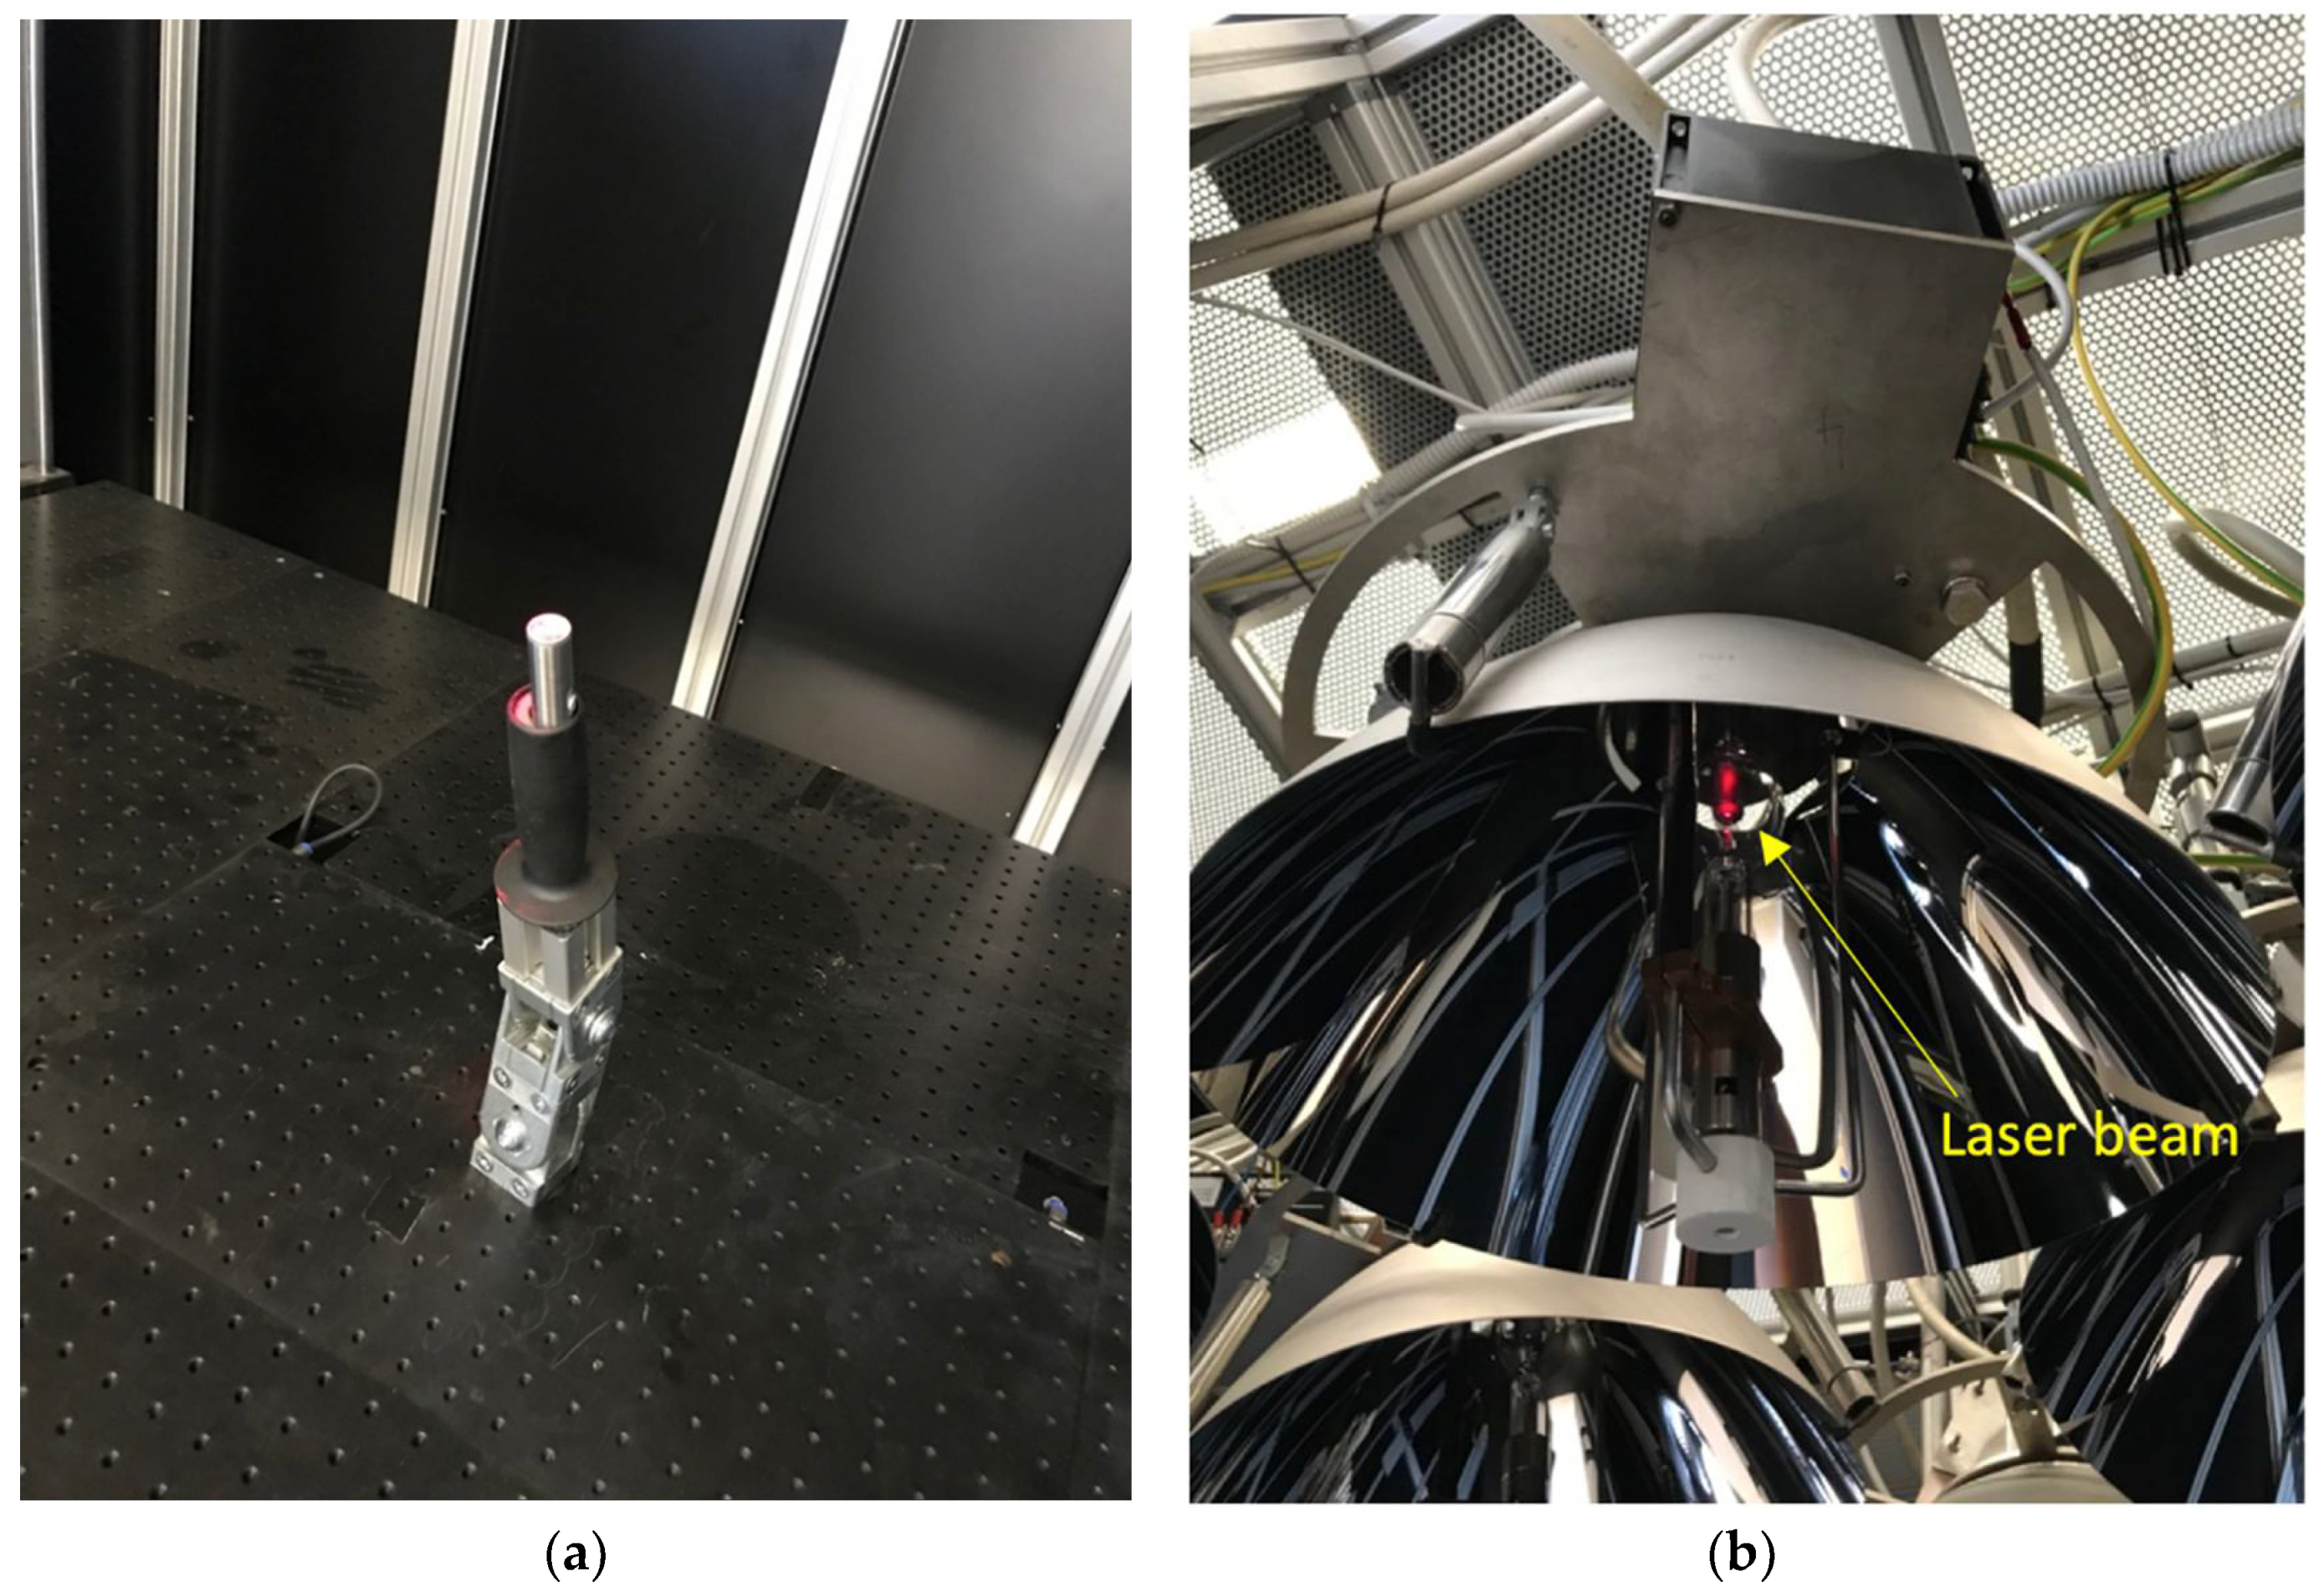
  • a laser was mounted in the center of the table (Figure 11a);
  • a laser beam was pointed towards an elliptical reflector;
  • the elliptical reflector was moved, up to hit the focus of the lamp with the help of the laser beam (Figure 11b);
  • points 3 and 4 have been repeated for all lamps.
At the end of the alignment phase, the laser was substituted with the Vatell TG1000 Gardon heat flux sensor, which produces a voltage output when exposed to heat flux. This is based on a differential thermocouple that measures the temperature difference between the center and the circumference of a thin constantan foil disk, mounted into the Oxygen Free High Conductivity copper (OFHC) body of the heat flux gage. When the sensing disk is exposed to a heat source, the center to edge temperature difference produces an output voltage directly proportional to the applied heat flux. The Gardon sensor is mounted on a slide so that it can be moved to the required position (Figure 12). Its main characteristics are summarized as:
  • Heat flux, 5 ÷ 5000 W/cm2;
  • Sensitivity, 2 mV/(W/cm2);
  • Accuracy, ±3%;
  • Repeatability, 1%.
The region of the optical table chosen to be characterized was a square of 20 cm × 20 cm dimensions, having its center coincident with that of the workbench. Within this area, the Gardon sensor was positioned in a grid of points 2.5 cm apart, according to the threaded holes of the optical bench.

4. Discussion of Results

In order to fully characterize the irradiance on the workbench, several measurements were carried out by varying the electrical power of each lamp between 400 W (10% of the maximum power) and 3600 W (80% of the maximum power), and the height of the workbench between −10 cm and +10 cm (step 5 cm), with respect to the focal plane (assumed to be 0).
Although the Xenon short-arc lamps used in this work were characterized by a maximum power of 4000 W; in order to avoid excessive thermal stress, all experiments were carried out at a power no greater than 3600 W. Table 3 presents the cases of the experimental characterization at which each lamp has been tested: a total of 25 characterizations have been carried out, permuting five values of electrical power with five different workbench heights.
Figure 13 shows an example of irradiance measurement, related to case 13 of Table 3.
As it can be seen, there are significant differences between the lamps, both in terms of position of the point of maximum irradiance and in terms of magnitude of irradiance. These differences are related to the imperfect focusing of each lamp; indeed, a few millimeters of shift between the lamp and elliptical mirror are enough to strongly modify the flux density on the workbench.
Figure 14, Figure 15 and Figure 16 compare the irradiance related to lamp #7 along three different horizontal lines (at 0 cm, + 5 cm and +10 cm) and for five heights (−10 cm, −5 cm, 0 cm, +5 cm and +10 cm) of the workbench.
From the graphs in Figure 14, it is possible to deduce various conclusions:
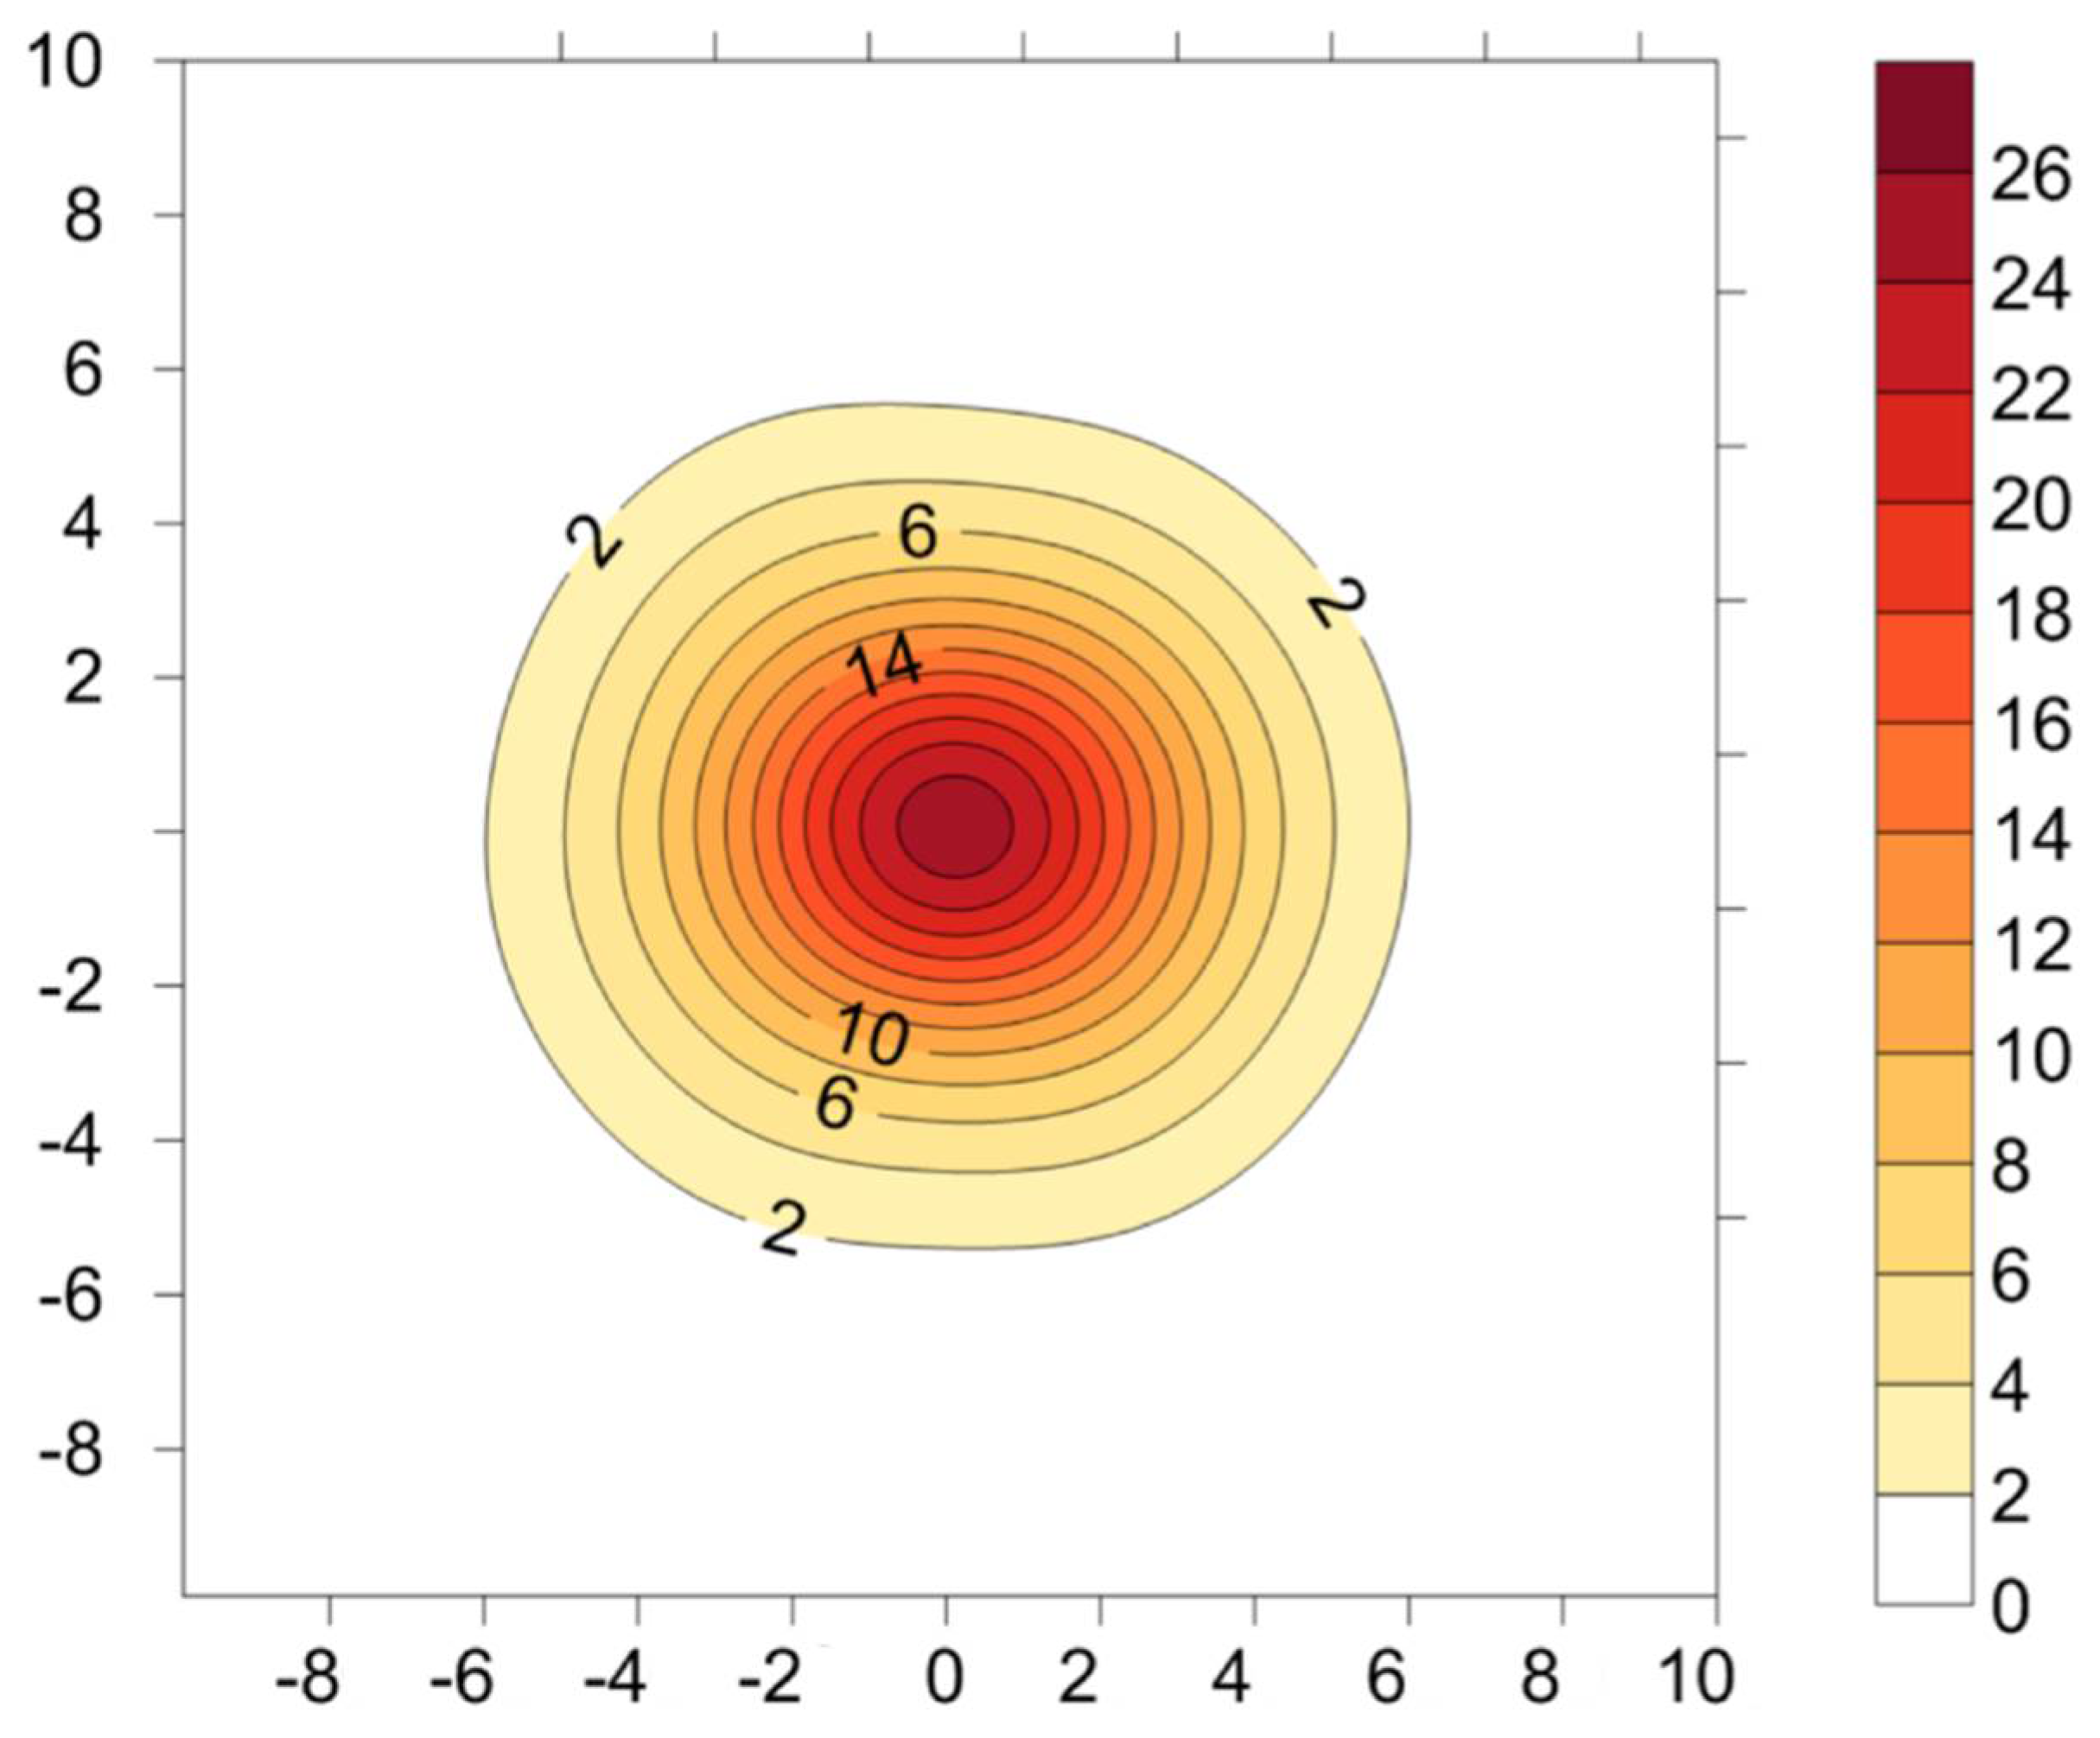
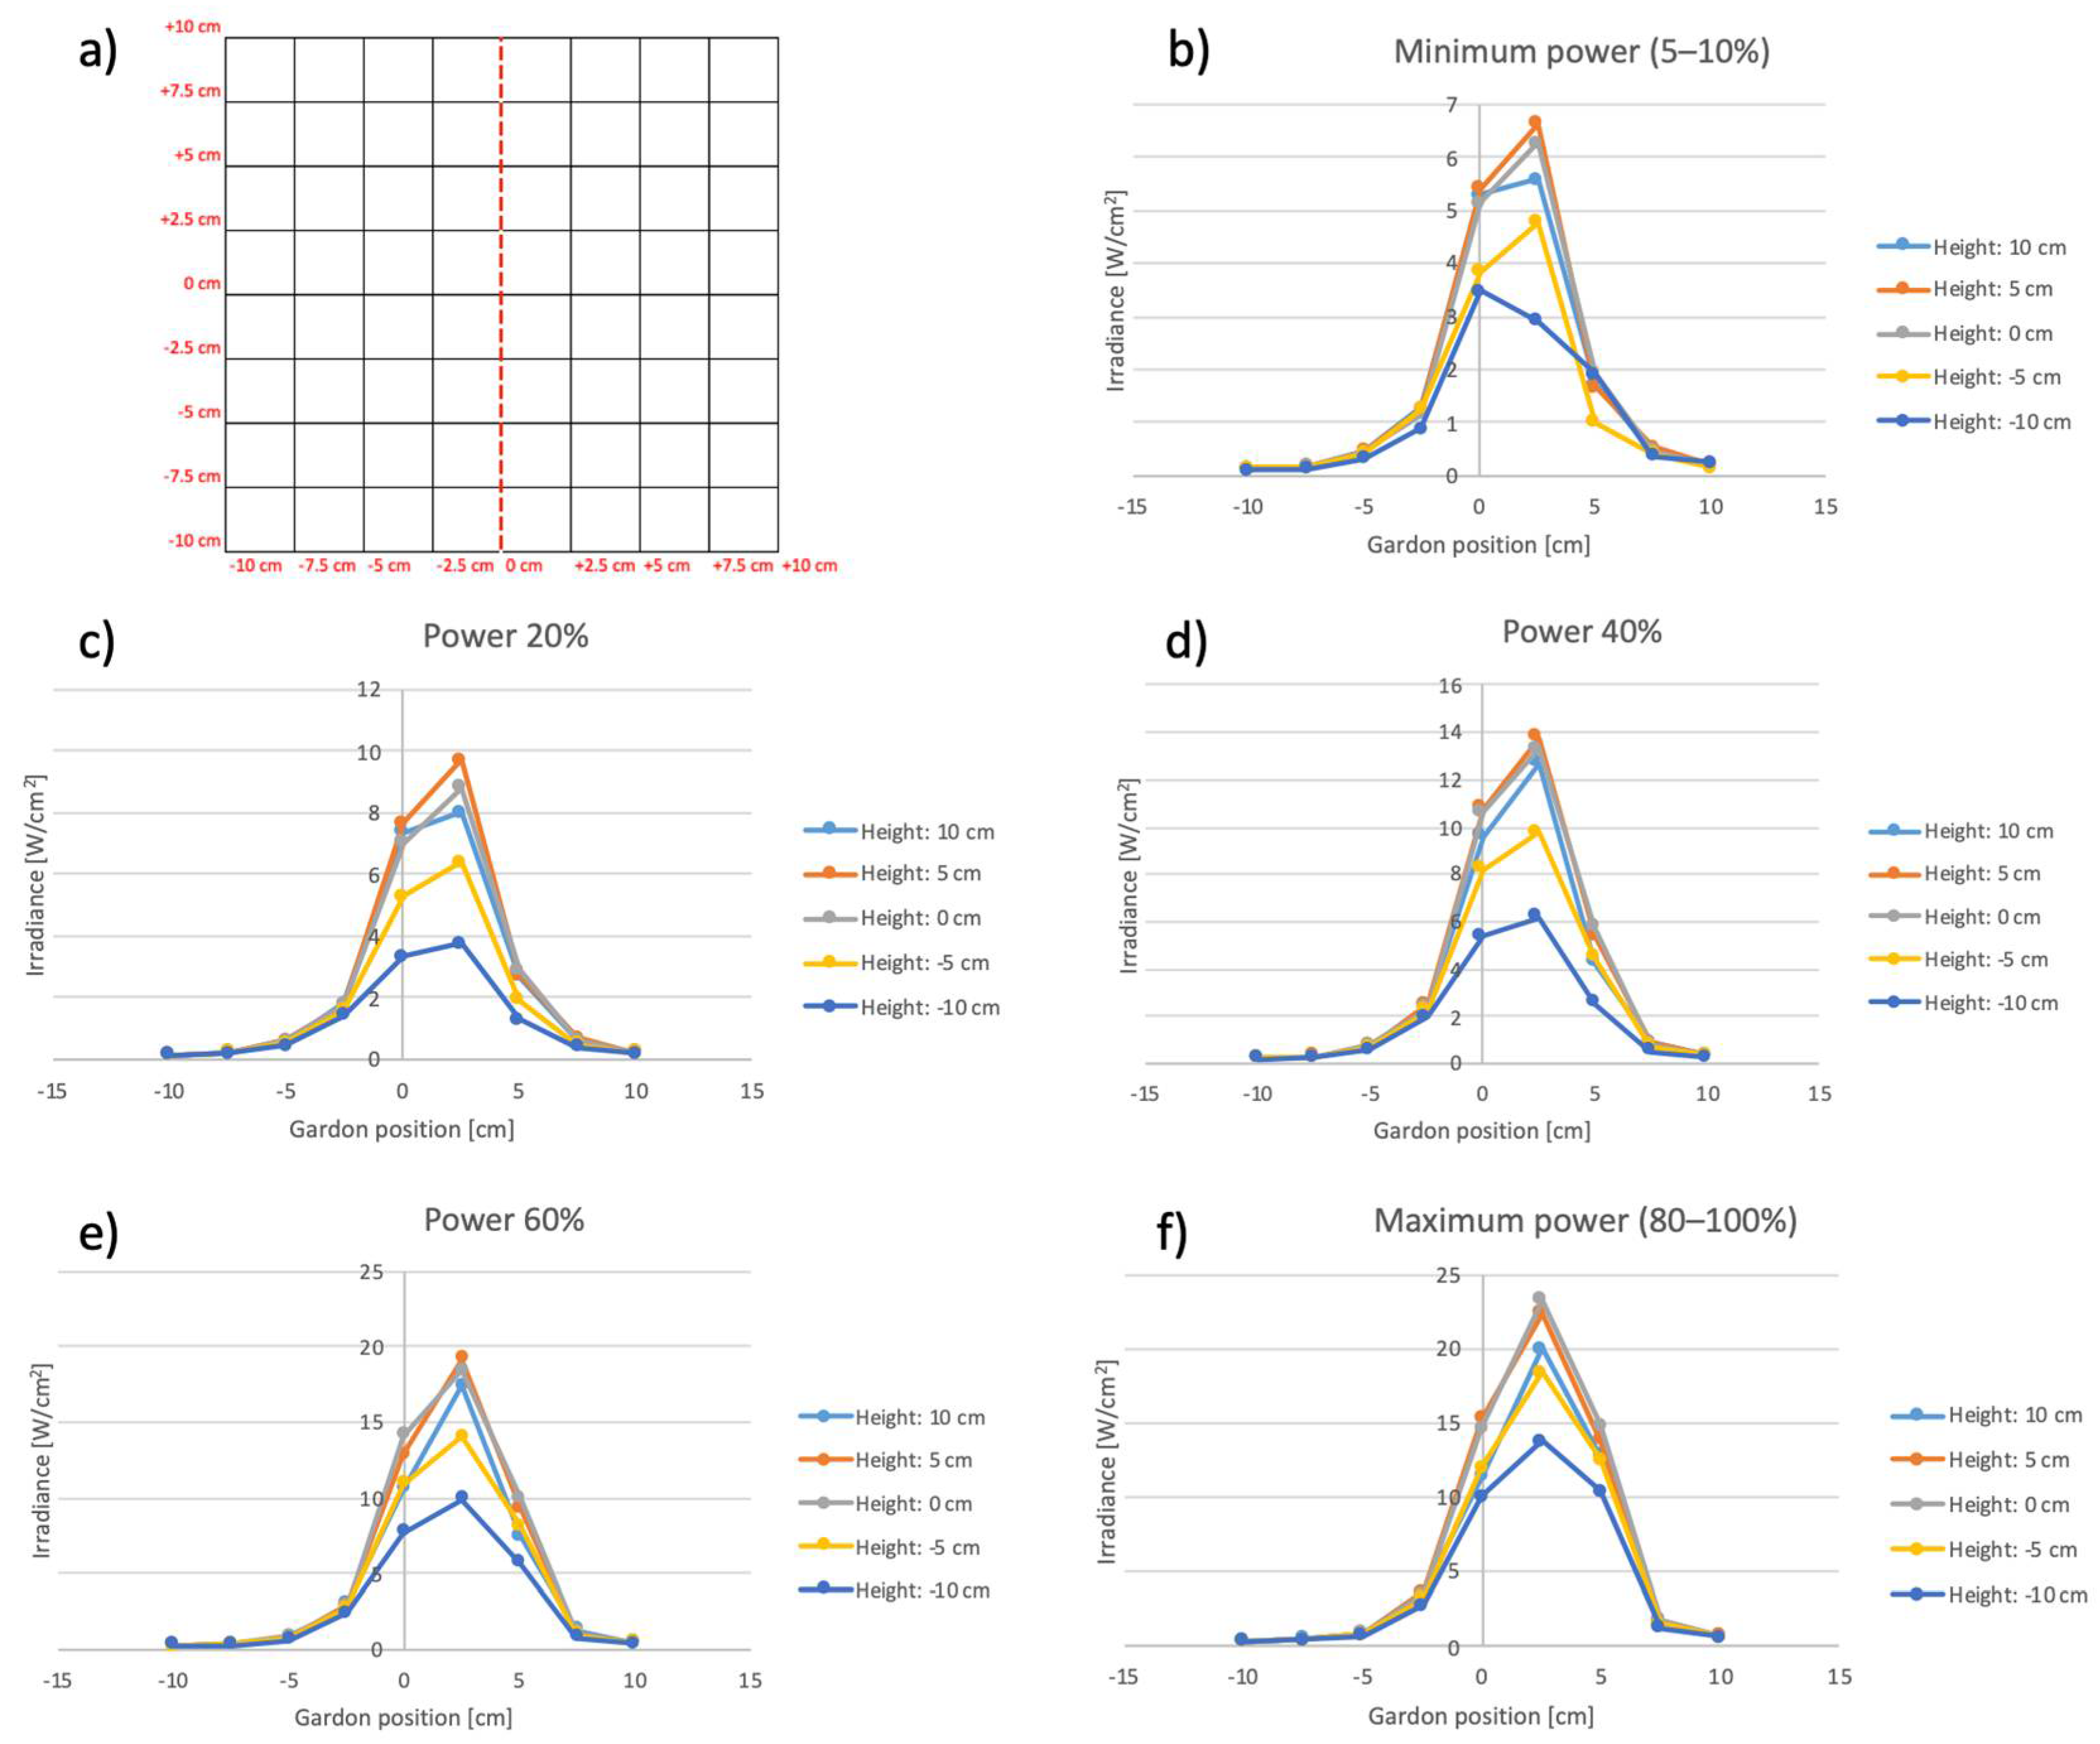
  • the maximum irradiance point along the central line of the workbench is shifted by 2.5 cm with respect to the zero position: this is due to the imperfect centering of lamp #7;
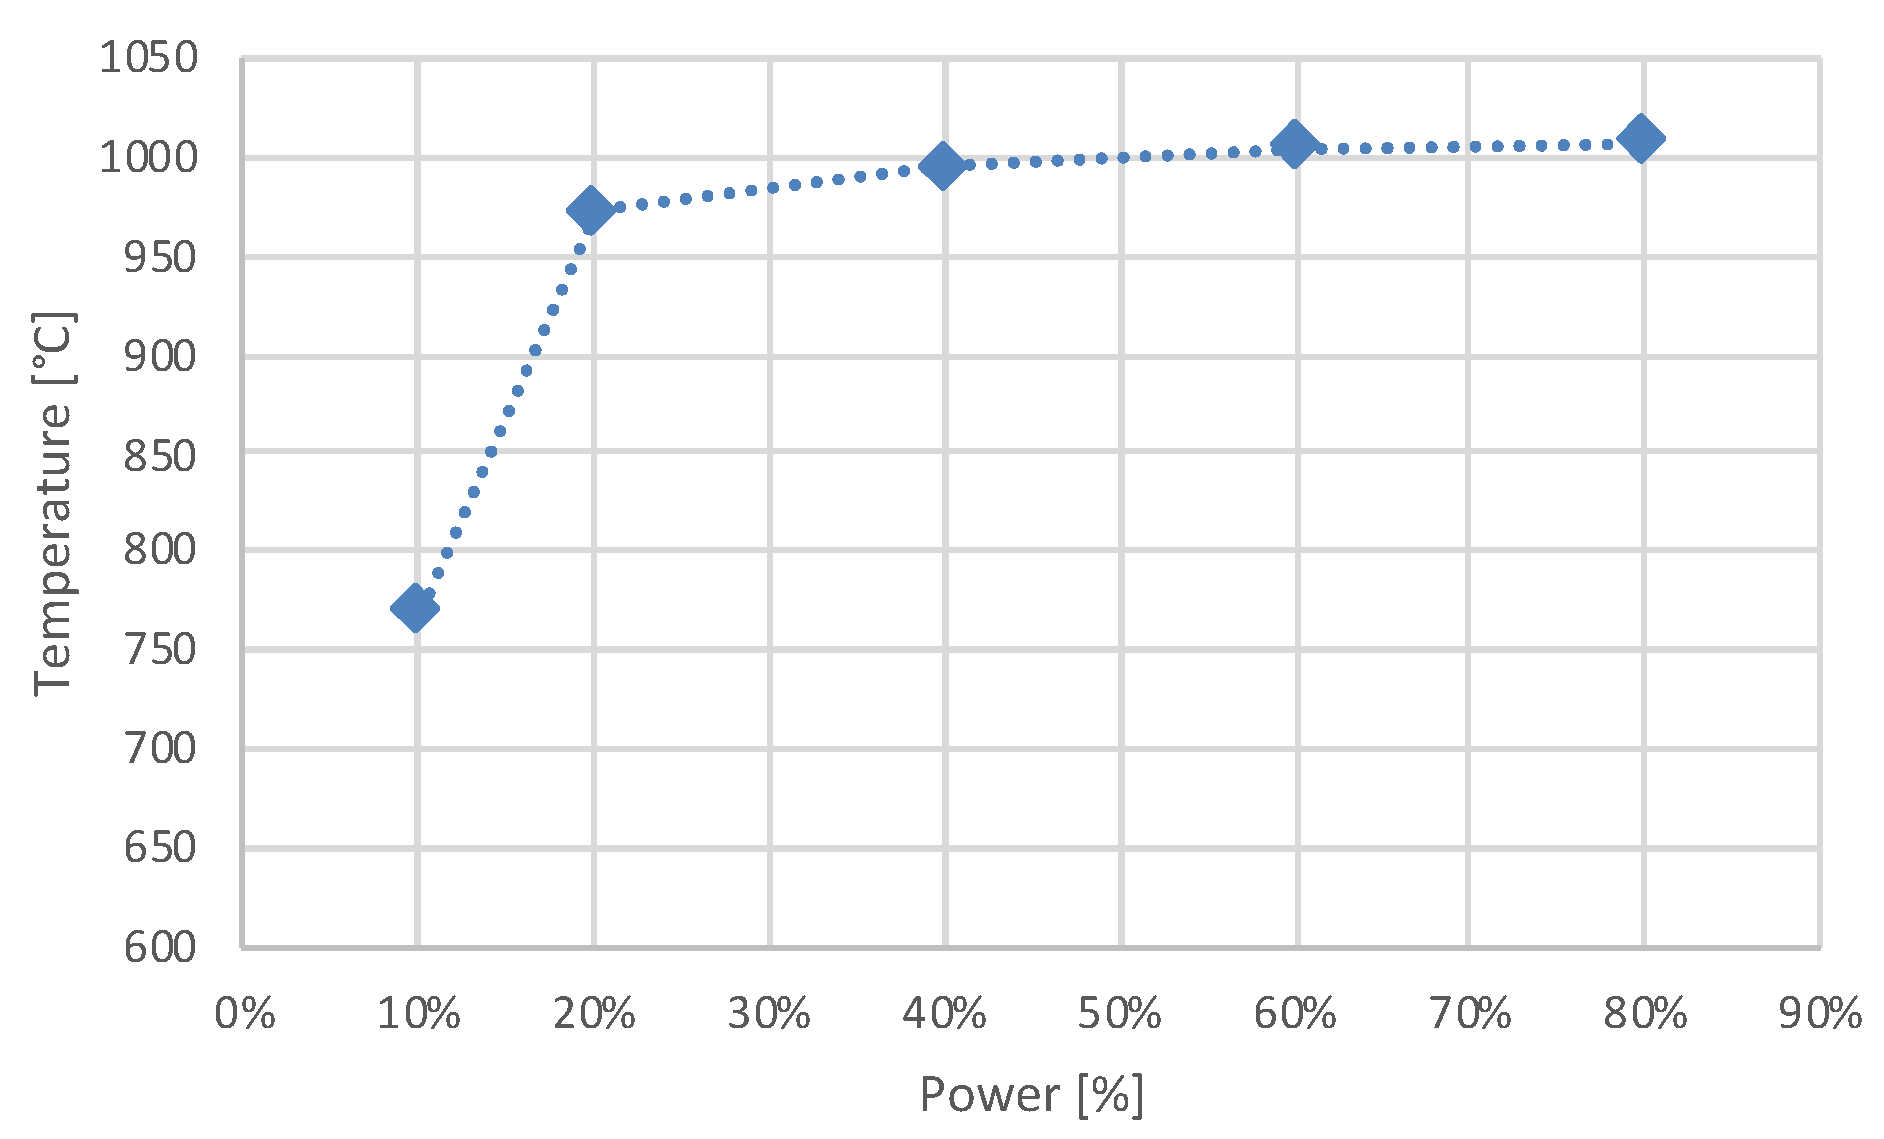
  • the radiant flux of the lamp is not proportional to the electrical power: its growth gradient is low for electrical power lower than 20%, then the radiant flux rises quickly up to reach an electrical power of about 60% (2400 W) and finally becomes quite stable;
  • differently from theoretical calculations, the best workbench height is not a point, but is an area ranged between 0 cm and +5 cm; this is due to the light source, which is not a point but is an arc of few millimeters.
  • the maximum irradiance reached by the lamp #7 is equal to 23.36 W/cm2: this value is in agreement with the numerical results of Figure 8.
The analysis of the graphs in Figure 15 and Figure 16 showed that:
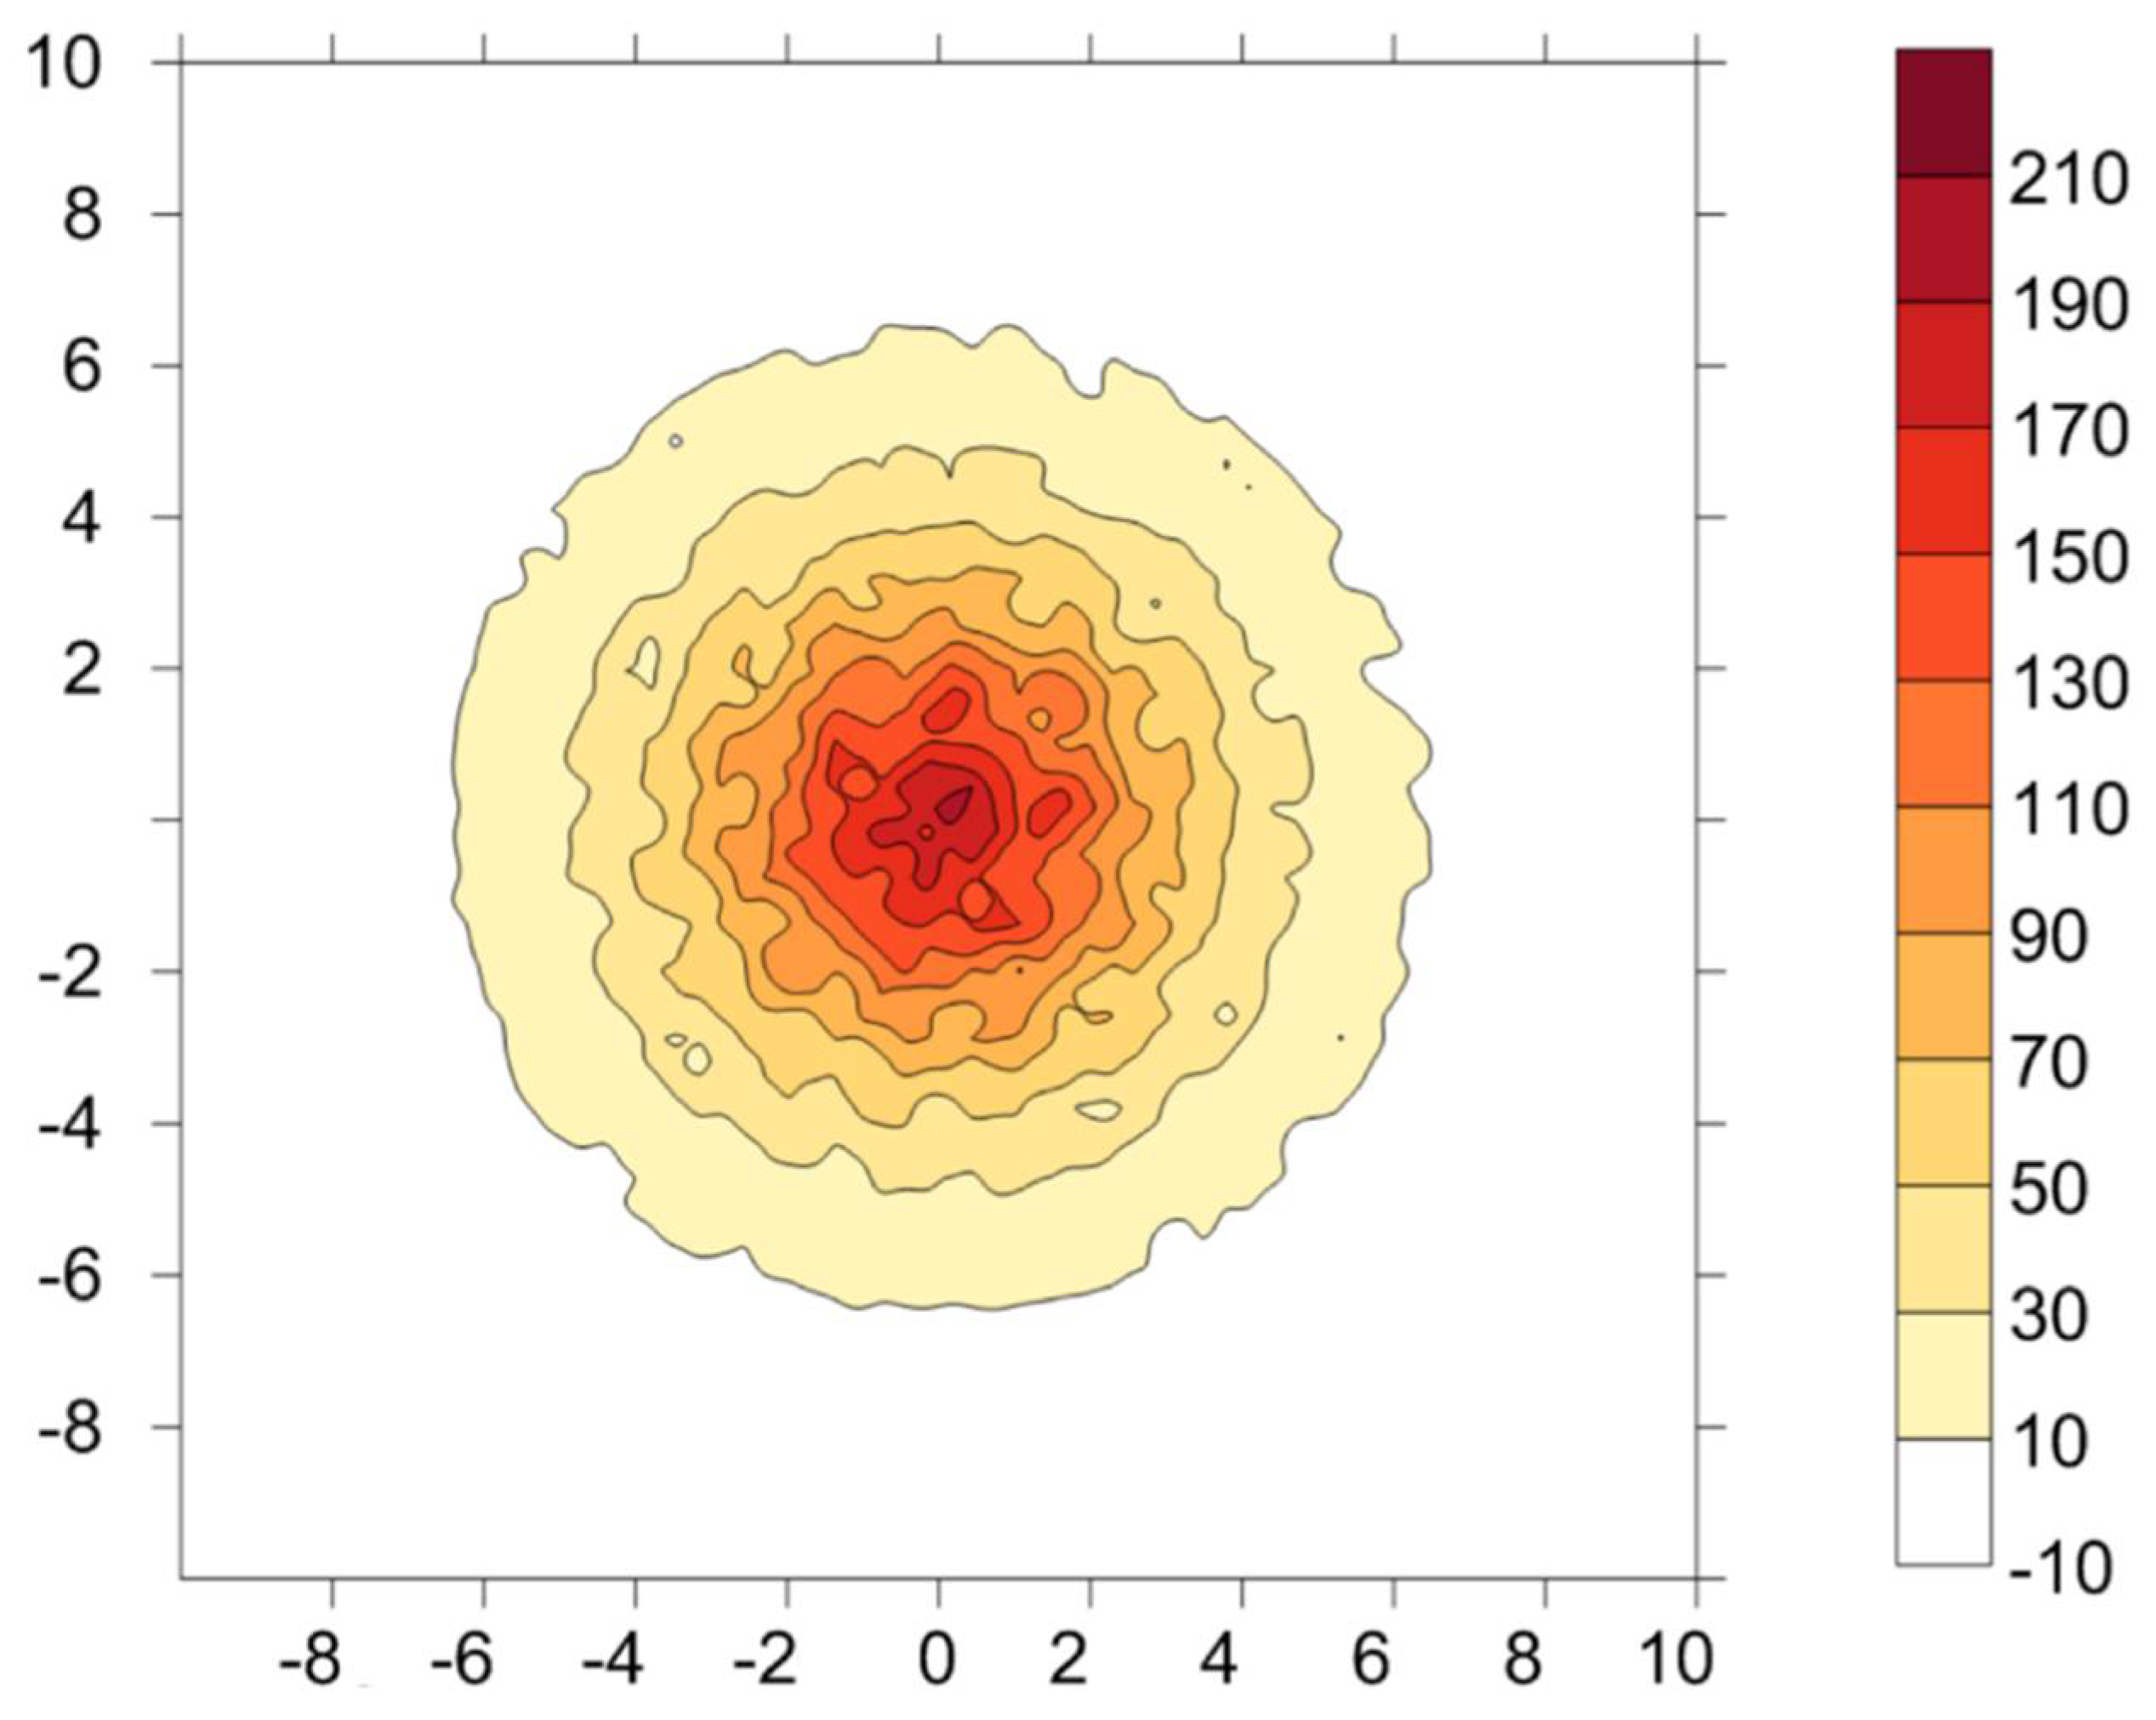
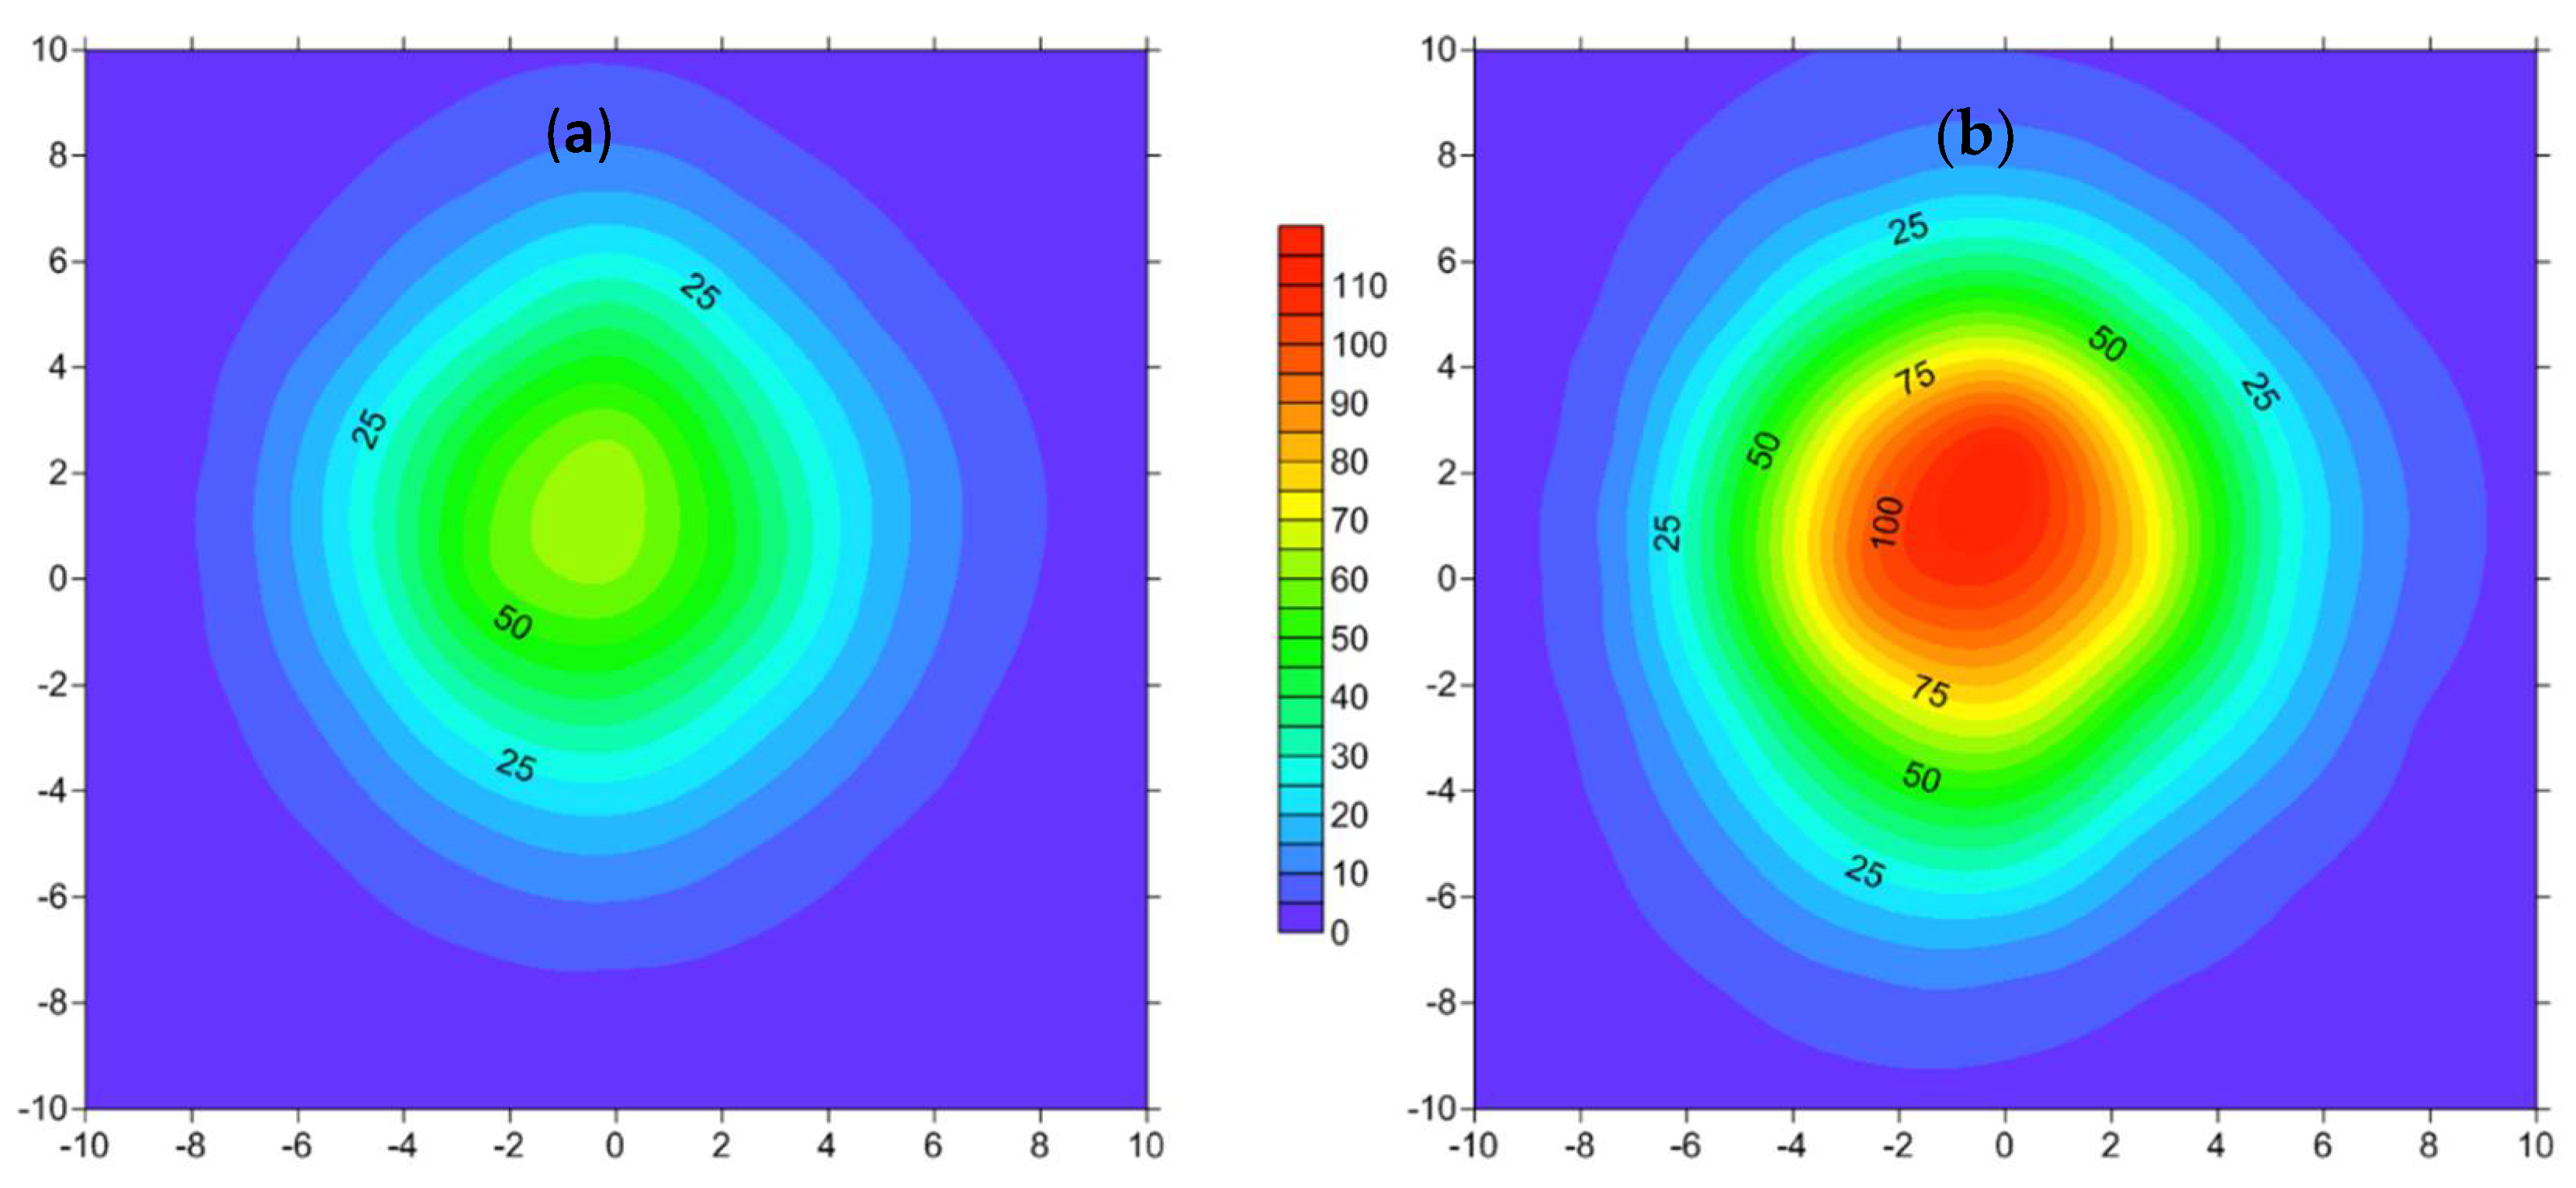
  • differently from Figure 14, the maximum irradiance is mainly reached along the central line of the workbench (0 cm);
  • the radiant flux of the lamp is quite proportional to the electrical power;
  • differently from both theoretical calculations and previous results of Figure 14, the best workbench height is shifted towards +10 cm: also in this case, this result can be explained taking into consideration the imperfect shape and position of the light source;
  • the radiant flux along the horizontal line +10 cm is bigger than zero, while the numerical results of Figure 8 show values of irradiance equal to zero already over 6 cm: this result demonstrated that the real focalization of the lamp is worse than the theoretical one.
  • in the peripheral area of the workbench (Figure 16), the irradiance remains quite stable within the range of 1 ÷ 6 suns. Therefore, this area may be useful for the analysis of all low-concentration solar applications.
Finally, Figure 17 shows the maximum irradiance reached on the workbench when all lamps are switched on, at 40% of power (1600 W) and at maximum power of 3600 W, respectively.
As can be seen, the maximum experimental irradiance of the HFSS was about 60% of the numerical values (Figure 9), reaching the value of 120.8 W/cm2. This level of light concentration is lower than the theoretical one, due to different issues:
  • small alignment errors of the lamps;
  • micro-imperfections of the mirrors;
  • in order to avoid excessive stress, the experimental characterization was carried out, with a maximum electrical power of 3600 W for lamp (equal to 80% of the maximum power of 4000 W);
  • the radiation, measured by Gardon sensor, is not punctual, but is averaged over its sensitive surface, equal to 126 mm2.
Finally, it is important to remark that the maximum measured irradiance of the HFSS, although lower than the theoretical one, is enough to develop experimental tests on lab-scale high-temperature solar reactors.
This result has been confirmed by measuring the temperature reached on the workbench at the point of maximum irradiance for different levels of power: from 10% to 80% (Figure 18).
As it can be observed, with a power equal to 10%, a temperature of 769 °C was reached, while with the maximum power of 80%, the temperature reached 1007 °C. Higher temperatures have not been reached because of thermal dispersions due both to convective phenomena (the inside of the simulator is constantly cooled by fans to avoid excessive overheating) and to radiation of heated surfaces (which is proportional to T4). However, with all lamps turned on at maximum power, the area of the workbench above 800 °C is larger than 100 cm2 and is therefore sufficient to perform experimental tests on lab-scale thermal and thermochemical solar applications.

5. Conclusions

This work aimed to design, built and characterize a new HFSS, capable of reaching a level of irradiance bigger than 100 W/cm2 (1000 suns), in which the parabolic mirrors were arranged face-down on a horizontal plane, to irradiate different concentrating solar thermo-chemical systems (e.g., fluidized bed for thermochemical fuel production, low-concentration direct absorption systems, etc.) from the upper side.
In the first part of this study, an optical analysis has been carried out by means of Opticad: all light sources, being constituted by electric arcs of length equal to 6.5 mm, have been simulated as five sub-sources, arranged at a distance of 1.625 mm from each other, in the focus of the mirror. From each lamp, a total of 108,000 beams have been simulated. As a result, maximum numerical irradiance values of about 25 W/cm2 (250 suns) and 200 W/cm2 (2000 suns) were reached with one lamp and eight lamps, respectively.
Therefore, the HFSS was built and characterized, measuring a maximum experimental irradiance of 120.8 W/cm2, coupled with a maximum temperature of 1007 °C, powering the lamps at 80% of their maximum power: these values of irradiance and temperature will be enough to develop experimental tests on lab-scale thermal and thermochemical solar applications.

Author Contributions

Conceptualization, M.M. and A.d.R.; methodology, M.M. and G.C.; validation, M.M. and G.C.; writing—original draft preparation, M.M.; writing—review and editing, M.M. and G.C.; supervision, A.d.R.; project administration, A.d.R.; funding acquisition, A.d.R. All authors have read and agreed to the published version of the manuscript.

Funding

This research was funded by Ministero dell’Istruzione, dell’Università e della Ricerca (MIUR) within the P.O.N. ricerca & competitivita’ 2007–2013 per le regioni della convergenza, Project CSEEM, CCI: 2007IT1619O006, Project code PONa3_00335.

Conflicts of Interest

The authors declare no conflict of interest.

References

  1. Gallo, A.; Marzo, A.; Fuentealba, E.; Alonso, E. High flux solar simulators for concentrated solar thermal research: A review. Renew. Sustain. Energy Rev. 2017, 77, 1385–1402. [Google Scholar] [CrossRef]
  2. Sarwar, J.; Georgakis, G.; La Chance, R.; Ozalp, N. Description and characterization of an adjustable flux solar simulator for solar thermal, thermochemical and photovoltaic applications. Sol. Energy 2014, 100, 179–194. [Google Scholar] [CrossRef]
  3. Levêque, G.; Bader, R.; Lipiński, W.; Haussener, S. High-flux optical systems for solar thermochemistry. Sol. Energy 2017, 156, 133–148. [Google Scholar] [CrossRef] [Green Version]
  4. Hirsch, D.; Zedtwitz, P.v.; Osinga, T.; Kinamore, J.; Steinfeld, A. A New 75 kW High-Flux Solar Simulator for High-Temperature Thermal and Thermochemical Research. J. Sol. Energy Eng. 2003, 125, 117–120. [Google Scholar] [CrossRef]
  5. Arribas, L.; González-Aguilar, J.; Romero, M. Solar-Driven Thermochemical Water-Splitting by Cerium Oxide: Determination of Operational Conditions in a Directly Irradiated Fixed Bed Reactor. Energies 2018, 11, 2451. [Google Scholar] [CrossRef] [Green Version]
  6. Kuhn, P.; Hunt, A. A New Solar Simulator to Study High Temperature Solid-State Reactions With Highly Concentrated Radiation. Sol. Energy Mater. 1991, 24, 742–750. [Google Scholar] [CrossRef]
  7. Petrasch, J.; Coray, P.; Meier, A.; Brack, M.; Haberling, P.; Wuillemin, D.; Steinfeld, A. A novel 50 kW 11,000 suns high-flux solar simulator based on an array of xenon arc lamps. J. Sol. Energy. Asme 2007, 129, 405. [Google Scholar] [CrossRef]
  8. Martínez-Manuel, L.; Peña-Cruz, M.I.; Villa-Medina, M.; Ojeda-Bernal, C.; Prado-Zermeño, M.; Prado-Zermeño, I.; Pineda-Arellano, C.A.; Carrillo, J.G.; Salgado-Tránsito, I.; Martell-Chavez, F. A 17.5 kWel high flux solar simulator with controllable flux-spot capabilities: Design and validation study. Sol. Energy 2018, 170, 807–819. [Google Scholar] [CrossRef]
  9. Zhu, Q.; Xuan, Y.; Liu, X.; Yang, L.; Lian, W.; Zhang, J. A 130 kWe solar simulator with tunable ultra-high flux and characterization using direct multiple lamps mapping. Appl. Energy 2020, 270, 115165. [Google Scholar] [CrossRef]
  10. Ekman, B.M.; Brooks, G.; Rhamdhani, M.A. Development of high flux solar simulators for solar thermal research. Sol. Energy Mater. Sol. Cells 2015, 141, 436–446. [Google Scholar] [CrossRef]
  11. Li, J.; Gonzalez-Aguilar, J.; Pérez-Rábago, C.; Zeaiter, H.; Romero, M. Optical analysis of a hexagonal 42 kWe High-Flux Solar Simulator. Energy Procedia 2014, 57, 590–596. [Google Scholar] [CrossRef] [Green Version]
  12. Alxneit, I.; Schmit, H. Spectral Characterization of PSI’s High-Flux Solar Simulator. J. Sol. Energy Eng. 2012, 134, 011013. [Google Scholar] [CrossRef]
  13. Synlight. Available online: https://www.dlr.de/content/en/research-facilities/synlight.html (accessed on 13 May 2021).
  14. Song, J.; Wang, J.; Niu, Y.; Wang, W.; Tong, K.; Yu, H.; Yang, Y. Flexible high flux solar simulator based on optical fiber bundles. Sol. Energy 2019, 193, 576–583. [Google Scholar] [CrossRef]
  15. Dai, S.; Chang, Z.; Ma, T.; Wang, L.; Li, X. Experimental study on flux mapping for a novel 84 kWe high flux solar simulator. Appl. Therm. Eng. 2019, 162, 114319. [Google Scholar] [CrossRef]
  16. Xiao, J.; Yang, H.; Wei, X.; Li, Z. A novel flux mapping system for high-flux solar simulators based on the indirect method. Sol. Energy 2019, 179, 89–98. [Google Scholar] [CrossRef]
  17. Li, Z.; Tang, D.; Du, J.; Li, T. Study on the radiation flux and temperature distributions of the concentrator-receiver system in a solar dish/Stirling power facility. Appl. Therm. Eng. 2011, 31, 1780–1789. [Google Scholar] [CrossRef]
  18. Ioannou, L.A.; Hapeshi, E.; Vasquez, M.I.; Mantzavinos, D.; Fatta-Kassinos, D. Solar/TiO2 photocatalytic decomposition of β-blockers atenolol and propranolol in water and wastewater. Sol. Energy 2011, 85, 1915–1926. [Google Scholar] [CrossRef]
  19. Codd, D.S.; Carlson, A.; Rees, J.; Slocum, A.H. A low cost high flux solar simulator. Sol. Energy 2010, 84, 2202–2212. [Google Scholar] [CrossRef] [Green Version]
  20. Li, L.; Wang, B.; Pottas, J.; Lipiński, W. Design of a compound parabolic concentrator for a multi-source high-flux solar simulator. Sol. Energy 2019, 183, 805–811. [Google Scholar]
  21. Abdulhamed, A.J.; Adam, N.M.; Ab-Kadir, M.Z.A.; Hairuddin, A.A. Review of solar parabolic-trough collector geometrical and thermal analyses, performance, and applications. Renew. Sustain. Energy Rev. 2018, 91, 822–831. [Google Scholar] [CrossRef]
  22. Felsberger, R.; Buchroithner, A.; Gerl, B.; Wegleiter, H. Conversion and Testing of a Solar Thermal Parabolic Trough Collector for CPV-T Application. Energies 2020, 13, 6142. [Google Scholar] [CrossRef]
  23. Fuqiang, W.; Ziming, C.; Jianyu, T.; Yuan, Y.; Linhua, L. Progress in concentrated solar power technology with parabolic trough collector system: A comprehensive review. Renew. Sustain. Energy Rev. 2017, 79, 1314–1328. [Google Scholar] [CrossRef]
  24. Jebasingh, V.K.; Joselin Herbert, G.M. A review of solar parabolic trough collector. Renew. Sustain. Energy Rev. 2016, 54, 1085–1091. [Google Scholar] [CrossRef]
  25. Wu, S.Y.; Xiao, L.; Cao, Y.; Li, Y.R. Convection heat loss from cavity receiver in parabolic dish solar thermal power system: A review. Sol. Energy 2010, 84, 1342–1355. [Google Scholar] [CrossRef]
  26. García-Ferrero, J.; Heras, I.; Santos, M.J.; Merchán, R.P.; Medina, A.; González, A.; Calvo Hernández, A. Thermodynamic and Cost Analysis of a Solar Dish Power Plant in Spain Hybridized with a Micro-Gas Turbine. Energies 2020, 13, 5178. [Google Scholar] [CrossRef]
  27. Okoroigwe, E.; Madhlopa, A. An integrated combined cycle system driven by a solar tower: A review. Renew. Sustain. Energy Rev. 2016, 57, 337–350. [Google Scholar] [CrossRef]
  28. Zhang, Q.; Jiang, K.; Kong, Y.; Wu, J.; Du, X. Study on Outlet Temperature Control of External Receiver for Solar Power Tower. Energies 2021, 14, 340. [Google Scholar] [CrossRef]
  29. Wang, K.; He, Y.L.; Zhu, H.H. Integration between supercritical CO2 Brayton cycles and molten salt solar power towers: A review and a comprehensive comparison of different cycle layouts. Appl. Energy 2017, 1951, 819–836. [Google Scholar]
  30. Lee, H.; Chai, K.; Kim, J.; Lee, S.; Kang, Y. Optical performance evaluation of a solar furnace by measuring the highly concentrated solar flux. Energy 2014, 661, 63–69. [Google Scholar] [CrossRef]
  31. Garcia, D.; Liang, D.; Tibùrcio, B.D.; Almeida, J.; Vistas, C.R. A three-dimensional ring-array concentrator solar furnace. Sol. Energy 2019, 19315, 915–928. [Google Scholar] [CrossRef]
  32. de Risi, A.; Milanese, M.; Laforgia, D. Modelling and optimization of transparent parabolic trough collector based on gas-phase nanofluids. Renew. Energy 2013, 58, 134–139. [Google Scholar] [CrossRef]
  33. Potenza, M.; Milanese, M.; Colangelo, G.; de Risi, A. Experimental investigation of transparent parabolic trough collector based on gas-phase nanofluid. Appl. Energy 2017, 2031, 560–570. [Google Scholar] [CrossRef]
  34. Kasaeian, A.; Daneshazarian, R.; Rezaei, R.; Pourfayaz, F.; Kasaeian, G. Experimental investigation on the thermal behavior of nanofluid direct absorption in a trough collector. J. Clean. Prod. 2017, 1581, 276–284. [Google Scholar] [CrossRef]
  35. Farhana, K.; Kadirgama, K.; Rahman, M.M.; Ramasamy, D.; Mahamude, A.S.F. Improvement in the performance of solar collectors with nanofluids—A state-of-the-art review. Nano Struct. Nano Objects 2019, 18, 100276. [Google Scholar] [CrossRef]
  36. Steinfeld, A. Solar thermochemical production of hydrogen—A review. Sol. Energy 2005, 78, 603–615. [Google Scholar] [CrossRef]
  37. Meier, A.; Bonaldi, E.; Cella, G.M.; Lipinski, W.; Wuillemin, D.; Palumbo, R. Design and experimental investigation of a horizotal rotary reactor for the solar thermal production of lime. Energy 2004, 29, 811–821. [Google Scholar] [CrossRef]
  38. Chueh, W.C.; Falter, C.; Abbott, M.; Scipio, D.; Furler, P.; Haile, S.M.; Steinfeld, A. High-flux solar-driven thermochemical dissociation of CO2 and H2O using nonstoichiometric ceria. Science 2010, 330, 1797–1801. [Google Scholar] [CrossRef] [Green Version]
  39. Charvin, P.; Abanades, S.; Beche, E.; Lemont, F.; Flamant, G. Hydrogen production from mixed cerium oxides via three-step water-splitting cycles. Solid State Ion. 2009, 180, 1003–1010. [Google Scholar] [CrossRef]
  40. Puig-Arnavat, M.; Tora, E.; Bruno, J.C.; Coronas, A. State of the art on reactor designs for solar gasification of carbonaceous feedstock. Sol. Energy 2013, 97, 67–84. [Google Scholar] [CrossRef]
  41. Dahl, J. Solar-thermal dissociation of methane in a fluid-wall aerosol flow reactor. Int. J. Hydrogen Energy 2004, 29, 725–736. [Google Scholar] [CrossRef]
  42. Milanese, M.; Colangelo, G.; Iacobazzi, F.; de Risi, A. Modeling of double-loop fluidized bed solar reactor for efficient thermochemical fuel production. Sol. Energy Mater. Sol. Cells 2017, 160, 174–181. [Google Scholar] [CrossRef]
  43. Milanese, M.; Colangelo, G.; Laforgia, D.; de Risi, A. Multi-parameter optimization of double-loop fluidized bed solar reactor for thermochemical fuel production. Energy 2017, 134, 919–932. [Google Scholar] [CrossRef]
  44. OptiCAD. Optical Analysis Program User’s Guide, Version 9; Opticad Corporation: Santa Fe, NM, USA, 1999. [Google Scholar]
Figure 1. Schematic model of double-loop fluidized bed solar reactor, for thermochemical fuel production.
Energies 14 03124 g001
Figure 2. Top view and front view of the HFSS (dimensions in mm).
Energies 14 03124 g002
Figure 3. HFSS CAD model: external and internal view.
Energies 14 03124 g003
Figure 4. Main geometrical data of Optiforms elliptical reflectors mod. E1585-0100 (dimensions in mm).
Energies 14 03124 g004
Figure 5. Rhodium coating reflectance as a function of incident light wavelength.
Energies 14 03124 g005
Figure 6. Characteristics of OSRAM XBO 4000 W/HSA OFR Xenon short arc lamp: (a) photometric solid; (b) comparison between spectral distribution of the radiative emissive power ( Q ˙ λ ) [7] and solar spectrum.
Energies 14 03124 g006
Figure 7. Example of Opticad simulation of a lamp.
Energies 14 03124 g007
Figure 8. Radiative flux map in W/cm2 calculated at the focal plane, related to the lamp n. 7; the coordinates are expressed in cm from the center of the workbench.
Energies 14 03124 g008
Figure 9. Radiative flux map in W/cm2 calculated at the focal plane, related to all lamps; the coordinates are expressed in cm from the center of the workbench.
Energies 14 03124 g009
Figure 10. Pictures of the HFSS: (a) overall view; (b) inside view; (c) detail of the lamps; (d) detail of the chilled mobile optical bench.
Energies 14 03124 g010
Figure 11. Pictures of the HFSS: (a) laser mounted in the center of the table; (b) alignment of a lamp with laser beam (red spotlight) in the focus.
Energies 14 03124 g011
Figure 12. Pictures of the Gardon sensor mounted on the slide.
Energies 14 03124 g012
Figure 13. Irradiance [W/cm2] of the case 13 of Table 3; the numbers #1 ÷ #8 represent the lamps, according to Figure 2; the coordinates are expressed in cm from the center of the workbench.
Energies 14 03124 g013
Figure 14. Irradiance along the horizontal central line (0 cm) highlighted in (a), for several heights of the workbench; all graphs are related to the lamp #7; (b) electrical power of lamp 5–10%; (c) electrical power of lamp 20%; (d) electrical power of lamp 40%; (e) electrical power of lamp 60%; (f) electrical power of lamp 80–100%.
Energies 14 03124 g014
Figure 15. Irradiance along the horizontal line (+5 cm) highlighted in (a), for several heights of the workbench; all graphs are related to the lamp #7; (b) electrical power of lamp 5–10%; (c) electrical power of lamp 20%; (d) electrical power of lamp 40%; (e) electrical power of lamp 60%; (f) electrical power of lamp 80–100%.
Energies 14 03124 g015
Figure 16. Irradiance along the horizontal line (+10 cm) highlighted in (a), for several heights of the workbench; all graphs are related to the lamp #7; (b) electrical power of lamp 5–10%; (c) electrical power of lamp 20%; (d) electrical power of lamp 40%; (e) electrical power of lamp 60%; (f) electrical power of lamp 80–100%.
Energies 14 03124 g016
Figure 17. Irradiance [W/cm2] reached with all lamps switched on; (a) 40% of power (1600 W); (b) 80% of power (3600 W); the coordinates are expressed in cm from the center of the workbench; the colormap scale is referred to both graphs.
Energies 14 03124 g017
Figure 18. Temperature reached in the point of maximum irradiance with all lamps switched on as a function of power.
Energies 14 03124 g018
Table 1. Main characteristics of OSRAM XBO 4000 W/HSA OFR Xenon short arc lamp.
Characteristic Value
Rated lamp wattage4000 W Energies 14 03124 i001
Rated lamp voltage29 V
Rated lamp current135 A
Ignition voltage36 kV
Luminous flux160 klm
Electrode gap e0 (cold)6.5 mm
Lamp length (overall) l1410 mm
Lamp length l2370 mm
Bulb diameter d70 mm
LCL a171 mm
Length cable400 mm
Maximum permissible base temperature230 °C
Min. air flow velocity around discharge vessel6 m/s
Table 2. Main parameters of Opticad simulations.
Main ParametersValue
Number of rays from each source21,600
Number of sources from each lamp5
Ray limits: max depth140
Ray limits: min trans0.01
Ray limits: max ghost2
Radiometer smooth25
Target attributes: reflectance0
Target attributes: absorbance1
Iteration: max count20
Iteration: tolerance1×10−6
Table 3. Cases of experimental characterization.
CaseElectrical Power [W]Height of the Workbench [cm]
1400−10
2800−10
31600−10
42400−10
53600−10
6400−5
−5
103600−5
114000
128000
1316000
25360010
Publisher’s Note: MDPI stays neutral with regard to jurisdictional claims in published maps and institutional affiliations.

