Article

CO2 Convective Dissolution in Oil-Saturated Unconsolidated Porous Media at Reservoir Conditions

1
NORCE Norwegian Research Center AS, P.O. Box 8046, 4068 Stavanger, Norway
2
Department of Energy Resources, University of Stavanger, P.O. Box 8600, 4036 Stavanger, Norway
*
Author to whom correspondence should be addressed.
Energies 2021, 14(1), 233; https://doi.org/10.3390/en14010233
Submission received: 9 December 2020 / Revised: 29 December 2020 / Accepted: 30 December 2020 / Published: 4 January 2021
(This article belongs to the Section B: Energy and Environment)

Abstract

:
During CO2 storage, CO2 plume mixes with the water and oil present at the reservoir, initiated by diffusion followed by a density gradient that leads to a convective flow. Studies are available where CO2 convective mixing have been studied in water phase but limited in oil phase. This study was conducted to reach this gap, and experiments were conducted in a vertically packed 3-dimensional column with oil-saturated unconsolidated porous media at 100 bar and 50 °C (representative of reservoir pressure and temperature conditions). N-Decane and crude oil were used as oils, and glass beads as porous media. A bromothymol blue water solution-filled sapphire cell connected at the bottom of the column was used to monitor the CO2 breakthrough. With the increase of the Rayleigh number, the CO2 transport rate in n-decane was found to increase as a function of a second order polynomial. R a number vs. dimensionless time τ had a power relationship in the form of R a   =   c × τ n . The overall pressure decay was faster in n-decane compared to crude oil for similar permeability (4 D), and the crude oil had a breakthrough time three times slower than in n-decane. The results were compared with similar experiments that have been carried out using water.

Graphical Abstract

1. Introduction

CO2 storage is a commonly considered topic when it comes to climate change mitigation. Injection of CO2 to active and abandoned oil and gas fields is a well-discovered solution for a viable utilization of CO2 due to its commercial benefits of enhancing the oil recovery (EOR) as well as achieving permanent CO2 storage [1,2]. During CO2 injection into existing oil fields for EOR, the added CO2 will swell and reduce the viscosity and will lead to an increase of the oil recovery percentage [3,4]. EOR for CO2 utilization can also reduce a significant cost of the whole CCS value chain [5,6,7].
When CO2 is injected into the oil fields, a CO2 plume will usually develop above the fluid phases inside the porous media due to the low density of CO2 compared to the density of the reservoir fluids, as shown in Figure 1 [8]. Initially, this CO2 plume mixes with the oil and water phases present in the reservoir mainly due to diffusion. The mixing process creates a density gradient (e.g., increase the density of oil). This phenomenon leads to a convective flow, which will accelerate the CO2 mixing and mass transfer and will significantly enhance the underground CO2 storage rate as well as the oil production [7,9,10,11].
It is essential to know the behavior of the CO2 plume in the reservoir along with how CO2 will dissolve convectively into the oil phase. This helps to understand how CO2 will be transported during long-term storage after injection for storage and EOR. The convectively driven dissolution has been extensively studied for accelerated CO2 dissolution in saline water for CO2 storage in 2-dimensional (2-dim) Hele-Shaw experimental setups [12,13,14,15,16,17,18] and using 3-dimensional (3-dim) confined experimental setups [19,20,21,22,23,24]. An extensive review on available CO2 convective mixing experiments in water is available in Amarasinghe et al. [12].
However, similar studies with the presence of oil (or residual oil) are still very limited. This represents a gap in defining and validating the adequate mathematical models and upscaling procedures for CO2 storage and EOR, and the lack of input parameters for uncertainty estimation. In the literature, Amarasinghe et al. [25] and Khosrokhavar et al. [16] have conducted CO2 convective dissolution visualization experiments into the oil phase inside a Hele-Shaw cell using the Schlieren visualization method. Farajzadeh et al. [26] performed a few PVT experiments using n-decane and n-hexadecane to investigate the CO2 mass transfer at gaseous conditions. They concluded that CO2 mass transfer increases in n-decane with the increase of pressure, while mass transfer in n-hexadecane is slower compared to n-decane. Zhao et al. [21] investigated and visualized CO2 flooding in porous media (bead pack) inside a vertical high-pressure PVT cell. They monitored CO2 front movement, piston-like miscible regions, CO2 channeling, and fingering using MRI technology for both supercritical and gaseous miscible conditions in n-decane. Meanwhile, Seyyedsar and Sohrabi [27] visually investigated the formation of a new oil phase during immiscible CO2 injection into heavy oil-saturated porous media under reservoir conditions. Wei et al. [28] carried out a visualization study on oil swelling due to CO2 miscibility inside a high-pressure cylindrical cell under reservoir conditions. In terms of simulations, Gasda and Elenius [11], Gasda et al. [29], Both et al. [30], Ahmed et al. [31], and Rongy et al. [32] have conducted CO2 gravity-driven convective mixing in oil. They showed the CO2 interaction with single component oil types and phase behavior including gravity convection fingering.
Furthermore, it is important to know the CO2 transport rate through an oil-saturated porous media to obtain a better understanding of real geological CO2 storage. It will provide a better indication of the behavior of CO2 plume and location of CO2 front at a given time. The results also can be further used to develop and validate mathematical models in order to upscale towards the whole reservoir. In the literature, such an experimental study has not been found. The same authors conducted an experimental study to investigate CO2 convective dissolution and breakthrough time in water-saturated unconsolidated porous media [24]. The objective of the presented work was to investigate CO2 convective dissolution in oil-saturated unconsolidated porous media of different permeabilities at realistic reservoir conditions. In this study, we only focused on pressure and temperature with relation to reservoir conditions. In terms of other reservoir properties such as usage of actual reservoir rock and three-phase systems, we have not addressed them in this study. This study reduces the gap of experimental results of CO2 convective mixing in oil, which will lead to a better understanding of the process in reservoirs.

2. Experimental Method

2.1. Materials

Hydrophilic glass beads of different diameters were used to prepare porous media of different permeabilities (0.5 D, 4 D, 16 D, and 76 D). The permeability of the bead packs was determined by the waterflooding of packed glass bead tubes. The particle size distribution of each glass bead type is shown in Figure 2. n-Decane and a North Sea crude oil (see Table 1 for the composition) were used as oils. Bromothymol blue (BTB) pH indicator solution (0.004 wt % BTB with 0.01M NaOH prepared in deionized water) of pH around 8 was used as the water phase. The BTB solution changes color from blue to yellow when the pH changes due to CO2 mixing.

2.2. Experimental Setup

A steel cell with an inner height of 27.5 cm and an inner diameter of 7.75 cm (approximately 1.3 L of volume) was used to carry out CO2 mixing experiments in oil-saturated porous media. The steel cell was vertically placed and was connected to water and oil-filled sapphire cell at the bottom (see in Figure 3, Figure 4a, Figure 5 and Figure 6a). The end piece at the bottom of the steel cell had a single hole that connected the steel cell and the sapphire cell (see Figure 4b). A Spectrum Spectra Mesh woven filter (Supplier: Spectrum Laboratories, USA) was added at the bottom of the cell to prevent glass beads penetrating the sapphire cell (see Figure 3). The sapphire cell was connected to a back-pressure regulator set at 100 bar. A piston cell filled with CO2 was used as the CO2 source and another piston cell was filled with the type of oil that was being used. A Quizix pump (Supplier: Chandler Engineering, USA) was used to control injection and pressure monitoring. A simplified sketch of the whole experimental setup is given in Figure 5, including the main valves that are used in following text to describe the experimental procedure. All the experiments were carried out at 50 °C using the pressure decay method starting from 100 bar.

2.3. Experimental Procedure

1.
The steel column was wet packed with glass beads manually (filled the column with oil type first and dry glass beads into oil), with the specified size to a height of 18 cm, and filled the rest of the volume to the top with the oil type that was being used.
2.
After mounting all the devices, V1, V3, and V5 were opened and the oil was pumped through the packed column using the Quizix pump and pressurized to 100 bar until produced through the back-pressure regulator to make sure 100% oil saturation was obtained.
3.
The pump was stopped and waterside from the CO2 piston cell (V2) was opened while V1, V3, and V5 were kept opened.
4.
Then, the system was heated to 50°. With the temperature increase, CO2 inside the CO2 piston cell expanded. Hence, water from the CO2 piston cell was transferred to the oil piston cell where pressurized oil was transferred through the packed column via the back-pressure regulator. This way, it was made sure that packed column pressure and the CO2 piston cell pressure stayed the same.
5.
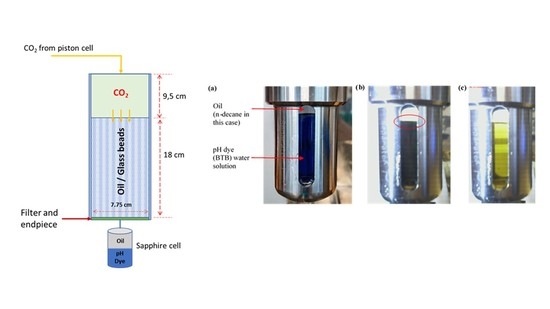
Afterward, V1 and V3 were closed. CO2 piston cell was introduced to the packed column by opening V4. A specified amount of CO2 (450 mL) was injected at a high rate (50 mL/min) and out through the back-pressure regulator (V5 was still opened) to create a 9.5 cm height of free phase of CO2 on top of the oil-saturated porous media (as shown in Figure 3). With previous experience, it was calculated that a height of 9.5 cm was required to compensate for the oil swelling so that swelled oil due to CO2 mixing was not transported into the CO2 piston cell.
6.
The connection between the packed column and back-pressure regulator (V5) was closed after the injection and the pump was stopped and pressure decay data were logged using the computer application.
7.
A small web camera with an interval timer shooting was used to monitor the breakthrough of CO2 into the sapphire cell. CO2 was transported through the oil-saturated porous media and a breakthrough was observed through the color change of water solution from blue to yellow (see Figure 6b).

2.4. Set of Experiments

The set of experiments carried out is shown in Table 2, together with the results of average breakthrough times and average CO2 transport speed. Rayleigh number R a was calculated using the equation R a = ρ g k H / μ D Φ , where ∆ ρ is the density increase of oil due to CO2 dissolution, g is the acceleration of gravity, k is the permeability of the porous media, H is the height of porous media, μ is the dynamic viscosity of the oil, D is the molecular diffusion coefficient of CO2 in oil, and Φ is the porosity of porous media. The height of porous media was 18 cm, while the other parameter values used to calculate the R a number are given in Table 3. R a number was calculated only for experiments with n-decane due to the unavailability of ρ o i l + C O 2 m i x   value and diffusion co-efficient of CO2 in crude oil value for crude oil.

3. Results and Discussions

The pressure decay data and the breakthrough times for 76 D (test 1), 16 D (test 2), and 4 D (test 3) are presented in Figure 7. The pressure decay data and the breakthrough time for the 0.5 D (test 4) is presented in Figure 8. In Figure 9 shows pressure decay data and the breakthrough times comparison for the experiments with 4 D permeability with n-decane (test 3) and crude oil (test 5).
The CO2 breakthrough time in n-decane-saturated 76 D porous media was very quick (8 min), which indicates that CO2 was mixing with oil instantly [25]. The breakthrough time was found to increase with the decrease of permeability (see Table 2). Due to the high miscibility of CO2 in oil, the pressure decreased rapidly at the beginning and was then gradually reduced. With the reduction of permeability, the initial pressure decay rate was reduced (see Figure 7). In 0.5 D porous media, a significant initial instant pressure decay was not observed. This was due to the low permeability, which led to a R a number ( R a = 13) lower than the R a c r i t i c a l value of 4 π 2 . The theory says that if the R a R a c r i t i c a l , then the flow is diffusion-dominant (i.e., natural convection is insignificant) [15,36].
For the crude oil, the initial pressure decay rate was slower than for n-decane in 4 D porous media. Moreover, the pressure decay rate was higher in n-decane compared to crude oil. The breakthrough time for n-decane-saturated porous media with 4 D permeability (7.5 h) was three times faster than for crude oil-saturated porous media with the same permeability (29 h). The overall pressure decay was also higher in n-decane than in crude oil, which indicated more CO2 was mixed in n-decane compared to in crude oil (see Figure 9). Generally, CO2 diffusion co-efficient in crude oil is lower than n-decane due to its presence of heavy carbon numbers (see Table 1) [34]. Hence, lower transport rate of CO2 in crude oil can be expected in comparison to n-decane.
Due to the CO2 mixing process inside the 3-dim porous media being random and fingering occurring randomly, the location of the CO2 front fingers at the bottom varies [37]. Especially when CO2 reached the bottom along the boundary, CO2 had to be transported to the connection of sapphire cell along the bottom surface (see Figure 10). Since the sapphire cell was connected to the bottom end piece from its center (see Figure 4), different breakthrough times were reasonable.
After breakthrough of CO2 produced a slight color change of the water solution in the sapphire cell, it took several minutes to change the color of the water solution completely from blue to yellow (see Figure 6c). This indicates that even after the breakthrough, CO2 was still invading the sapphire cell and still CO2 convection took place inside the porous media. From the pressure data (as in Figure 7, Figure 8 and Figure 9), the pressure was still decaying after the observation of the CO2 breakthrough.
For scaling purposes of the 3-dim experiments, we have used dimensionless time ( τ ), τ   =   D / H 2 × t s , where t s is considered as the breakthrough time. The relationship between τ and R a number was compared for n-decane (this study) and water [24] (see Figure 11). We found that the R a number vs. τ had a power relationship in the form of R a = c × τ n , with constants c = 2.051 and n = 0.763 for n-decane and c = 26.078 and n = 0.702 for water. A similar power trend has been found by Faisal et al. [15] and Farajzadeh et al. [38] in their study of the water phase.
The CO2 transport rate in oil was observed to increase with increasing permeability. Comparing the results with similar experiments carried out by Amarasinghe et al. [24] using water, we observed that the CO2 transport rate was generally lower in water than in n-decane. Density increase in water and oil due to CO2 mixing are 14.75 kg/m3 [39,40] and 25.2 kg/m3 [33], respectively. Hence, faster CO2 mixing in n-decane compared to water can be justified. With increasing R a number, the increase of the CO2 transport rate (V) increased as a function of power V   =   1 × 10 5 × R a 1.424 in water and as a function of a second order polynomial V   =   6 × 10 6 × R a 2 0.0001 × R a + 0.1652 for n-decane (see Figure 12 for the relationships between R a number and CO2 transport rate in both water and n-decane).
In this kind of experiment, measurement/calculation of CO2 mass transferred into the oil phase would be significant data. Due to the swelling of the oil phase, the CO2–oil boundary inside the vertical column moves upwards, as observed by Amarasinghe et al. [25] in their 2-dim Hele-Shaw experiments (see Figure 13). There is a disturbance to the CO2–oil interface during CO2 injection to generate a free volume of CO2 on top of the porous media. This may affect the breakthrough time. However, we neglected the effects for the observation of breakthrough time and the calculation of CO2 transport speed through the porous media. In the 3-dim experiments, due to boundary effects, slight heterogeneities within the porous pack, contact area CO2, and porous media, internal fingering merging does add substantial complication to the fingering phenomenon compared to 2-dim experiments [9,25,41].
The scaled experimental data forms a basis for the fine-tuning of the existing mathematical model and scaling-up [11,42]. As further work, we suggest carrying out more experiments in more different oil types (e.g., mixture of oil and different crude oil types with known compositions) using a wider range of permeabilities to gather more data.

4. Conclusions

We experimentally investigated CO2 convective mixing inside an oil-saturated porous media at realistic reservoir pressure and temperature conditions (100 bar and 50 °C). CO2 breakthrough time was quantitatively measured with porous media of different permeabilities. It was found that R a number vs. dimensionless time τ had a relationship in the form of R a   = c × τ n . In crude oil, the initial pressure decay rate was lower than for n-decane inside 4 D porous media. The overall pressure decay also was higher in n-decane than in crude oil for similar permeability (4 D), and crude oil had a breakthrough time that was three times slower than in n-decane. The results also were compared with similar experiments carried out by the same authors using water. It was shown that CO2 transport rate was generally lower in water compared to n-decane due to the lower density increase of the fluid mixture. With the increase of R a number, the increase of the CO2 transport rate increased as a form of power of V   =   1 × 10 5 × R a 1.424 in water and as a function of a second order polynomial for n-decane. It was concluded that due to geometry, boundary effects, slight heterogeneities within the porous pack, the contact area between CO2—porous media are responsible for the different results for 2-dim and 3-dim experiments. The scaled experimental data formed a basis for the validation of the existing mathematical model and scaling-up to further understanding of CO2 geological storage processes and plume behavior.

Author Contributions

Conceptualization, W.A., I.F., N.G., and Y.G.; methodology, W.A., I.F., and N.G.; validation, W.A.; formal analysis, W.A. and N.G.; investigation, W.A., I.F., and N.G.; resources, Y.G.; writing—original draft preparation, W.A., I.F., N.G., and Y.G.; writing—review and editing, W.A. and I.F.; visualization, W.A.; supervision, I.F. and Y.G.; project administration, Y.G.; funding acquisition, Y.G. All authors have read and agreed to the published version of the manuscript.

Funding

Research Council of Norway, CLIMIT program, Grant number—268439.

Institutional Review Board Statement

Not applicable.

Informed Consent Statement

Not applicable.

Data Availability Statement

All data are given in the paper. Separately there is no other data.

Acknowledgments

Not applicable.

Conflicts of Interest

The authors declare no conflict of interest. The funders had no role in the design of the study; in the collection, analyses, or interpretation of data; in the writing of the manuscript; or in the decision to publish the results.

Nomenclature

ρ C O 2 Density of CO2 ( kg / m 3 )
ρ o i l Density of oil ( kg / m 3 )
ρ o i l + C O 2 m i x   Maximum density of oil + CO2 mixture ( kg / m 3 )
ρ Density increase of the fluid due to CO2 dissolution ( ρ o i l + C O 2 m i x   ρ o i l ) (   kg / m 3 )
τ Dimensionless time (-)
Φ Porosity (-)
μ Dynamic viscosity of the fluid ( kg / ( s · m ) )
D Molecular diffusion co-efficient of CO2 in the fluid ( m 2 / s )
g Acceleration of gravity ( m / s 2 )
H Test height of porous media ( m )
k Permeability of the porous media ( m 2 )
R a Rayleigh number (-)
R a c r i t i c a l Critical Rayleigh number (-)

Abbreviations

s C O 2 Super critical CO2
2-dim2-dimensional
3-dim3-dimensional

References

  1. Hannis, S.; Lu, J.; Chadwick, A.; Hovorka, S.; Kirk, K.; Romanak, K.; Pearce, J. CO2 Storage in Depleted or Depleting Oil and Gas Fields: What can We Learn from Existing Projects? Energy Procedia 2017, 114, 5680–5690. [Google Scholar] [CrossRef]
  2. Godec, M.; Kuuskraa, V.; Van Leeuwen, T.; Stephen Melzer, L.; Wildgust, N. CO2 Storage in Depleted Oil Fields: The Worldwide Potential for Carbon Dioxide Enhanced Oil Recovery. Energy Procedia 2011, 4, 2162–2169. [Google Scholar] [CrossRef] [Green Version]
  3. Mansour, E.M.; Al-Sabagh, A.M.; Desouky, S.M.; Zawawy, F.M.; Ramzi, M. A Laboratory Investigation of Carbon Dioxide-Enhanced Oil Recovery by Focusing on CO2-Oil Physical Properties. Egypt. J. Pet. 2019, 28, 21–26. [Google Scholar] [CrossRef]
  4. Holm, L.W. CO2 Flooding: Its Time Has Come. J. Pet. Technol. 1982, 34, 2739–2745. [Google Scholar] [CrossRef]
  5. Blunt, M.; Fayers, F.J.; Orr, F.M. Carbon Dioxide in Enhanced Oil Recovery. Energy Convers. Manag. 1993, 34, 1197–1204. [Google Scholar] [CrossRef]
  6. Brock, W.R.; Bryan, L.A. Summary Results of CO2 EOR Field Tests, 1972–1987. In Proceedings of the Low Permeability Reservoirs Symposium, Denver, CO, USA, 6–8 March 1989; p. 10. [Google Scholar] [CrossRef]
  7. Ajayi, T.; Gomes, J.S.; Bera, A. A Review of CO2 Storage in Geological Formations Emphasizing Modeling, Monitoring and Capacity Estimation Approaches. Pet. Sci. 2019, 16, 1028–1063. [Google Scholar] [CrossRef] [Green Version]
  8. Han, W.S.; McPherson, B.; Lichtner, P.; Wang, F. Evaluation of Trapping Mechanisms in Geologic CO2 Sequestration: Case Study of Sacroc Northern Platform, a 35-Year CO2 Injection Site. Am. J. Sci. 2010, 310, 282–324. [Google Scholar] [CrossRef]
  9. Emami-Meybodi, H.; Hassanzadeh, H.; Green, C.P.; Ennis-King, J. Convective Dissolution of CO2 in Saline Aquifers: Progress in Modeling and Experiments. Int. J. Greenh. Gas Control 2015, 40, 238–266. [Google Scholar] [CrossRef]
  10. Sun, Y.; Li, Q.; Yang, D.; Liu, X. Laboratory core flooding experimental systems for CO2 geosequestration: An updated review over the past decade. J. Rock Mech. Geotech. Eng. 2016, 8, 113–126. [Google Scholar] [CrossRef] [Green Version]
  11. Gasda, S.; Elenius, M.T. CO2 Convection in Oil Driven by Non-Monotonic Mixture Density. In Proceedings of the 16th European Conference on the Mathematics of Oil Recovery, Barcelona, Spain, 3–6 September 2018; pp. 1–12. [Google Scholar] [CrossRef]
  12. Amarasinghe, W.; Fjelde, I.; Rydland, J.-Å.; Guo, Y. Effects of Permeability on CO2 Dissolution and Convection at Reservoir Temperature and Pressure Conditions: A Visualization Study. Int. J. Greenh. Gas Control 2020, 99, 103082. [Google Scholar] [CrossRef]
  13. Mahmoodpour, S.; Rostami, B.; Soltanian, M.R.; Amooie, M.A. Effect of Brine Composition on the Onset of Convection During CO2 Dissolution in Brine. Comput. Geosci. 2019, 124, 1–13. [Google Scholar] [CrossRef]
  14. Thomas, C.; Dehaeck, S.; De Wit, A. Convective Dissolution of CO2 in Water and Salt Solutions. Int. J. Greenh. Gas Control 2018, 72, 105–116. [Google Scholar] [CrossRef]
  15. Faisal, T.F.; Chevalier, S.; Bernabe, Y.; Juanes, R.; Sassi, M. Quantitative and Qualitative Study of Density Driven CO2 Mass Transfer in a Vertical Hele-Shaw Cell. Int. J. Heat Mass Transf. 2015, 81, 901–914. [Google Scholar] [CrossRef]
  16. Khosrokhavar, R.; Elsinga, G.; Farajzadeh, R.; Bruining, H. Visualization and Investigation of Natural Convection Flow of CO2 in Aqueous and Oleic Systems. J. Pet. Sci. Eng. 2014, 122, 230–239. [Google Scholar] [CrossRef]
  17. Vosper, H.; Kirk, K.; Rochelle, C.; Noy, D.; Chadwick, A. Does Numerical Modelling of the Onset of Dissolution-convection Reliably Reproduce this Key Stabilization Process in CO2 Storage? Energy Procedia 2014, 63, 5341–5348. [Google Scholar] [CrossRef] [Green Version]
  18. Taheri, A.; Torsæter, O.; Lindeberg, E.; Hadia, N.J.; Wessel-Berg, D. Qualitative and Quantitative Experimental Study of Convective Mixing Process During Storage of CO2 in Heterogeneous Saline Aquifers. Int. J. Greenh. Gas Control 2018, 71, 212–226. [Google Scholar] [CrossRef]
  19. Lv, P.; Liu, Y.; Chen, J.; Jiang, L.; Wu, B.; Liu, S.; Song, Y. Pore-scale Investigation of Effects of Heterogeneity on CO2 Geological Storage Using Stratified Sand Packs. Greenh. Gases: Sci. Technol. 2017, 7, 972–987. [Google Scholar] [CrossRef]
  20. Lv, P.; Liu, Y.; Jiang, L.; Song, Y.; Wu, B.; Zhao, J.; Zhang, Y. Experimental Determination of Wettability and Heterogeneity Effect on CO2 Distribution in Porous Media. Greenh. Gases Sci. Technol. 2016, 6, 401–415. [Google Scholar] [CrossRef]
  21. Zhao, Y.; Song, Y.; Liu, Y.; Liang, H.; Dou, B. Visualization and Measurement of CO2 Flooding in Porous Media Using MRI. Ind. Eng. Chem. Res. 2011, 50, 4707–4715. [Google Scholar] [CrossRef]
  22. Fang, F.; Babadagli, T. 3-D Visualization of Diffusive and Convective Solvent Transport Processes in Oil-saturated Porous Media Using Laser Technology. J. Vis. 2016, 19, 615–629. [Google Scholar] [CrossRef]
  23. Wang, S.; Liu, Y.; Zhao, Y.; Zhang, Y.; Jiang, L.; Yu, B.; Yin, Y.; Song, Y. Enhanced Mass Transfer by Density-Driven Convection During CO2 Geological Storage. Ind. Eng. Chem. Res. 2020. [Google Scholar] [CrossRef]
  24. Amarasinghe, W.; Fjelde, I.; Giske, N.H.; Guo, Y. CO2 Convective Dissolution in Water Saturated Unconsolidated Porous Media at Reservoir Conditions. In Proceedings of the 15th International Conference on Greenhouse Gas Control Technologies, GHGT-15, Abu Dhabi, UAE, 15–18 March 2021. [Google Scholar]
  25. Amarasinghe, W.S.; Fjelde, I.; Guo, Y. CO2 Dissolution and Convection in Oil at Realistic Reservoir Conditions: A Visualization Study. In Proceedings of the SPE Europec 2020 featured at 82nd EAGE Conference and Exhibition, Amsterdam, The Netherlands, 7 December 2020. [Google Scholar]
  26. Farajzadeh, R.; Delil, H.A.; Zitha, P.L.J.; Bruining, J. Enhanced Mass Transfer of CO2 Into Water and Oil by Natural Convection. In Proceedings of the EUROPEC/EAGE Conference and Exhibition, London, UK, 11–14 June 2007; p. 9. [Google Scholar] [CrossRef]
  27. Seyyedsar, S.M.; Sohrabi, M. Visualization Observation of Formation of a New Oil Phase During Immiscible Dense CO2 Injection in Porous Media. J. Mol. Liq. 2017, 241, 199–210. [Google Scholar] [CrossRef]
  28. Wei, B.; Gao, H.; Pu, W.; Zhao, F.; Li, Y.; Jin, F.; Sun, L.; Li, K. Interactions and Phase Behaviors Between Oleic Phase and CO2 From Swelling to Miscibility in CO2-Based Enhanced Oil Recovery (EOR) Process: A Comprehensive Visualization Study. J. Mol. Liq. 2017, 232, 277–284. [Google Scholar] [CrossRef]
  29. Gasda, S.E.; Elenius, M.T.; Kaufmann, R. Field-Scale Implications of Density-Driven Convection in CO2-Eor Reservoirs. In Proceedings of the Fifth CO2 Geological Storage Workshop, Utrecht, The Netherlands, 21–23 November 2018; pp. 1–5. [Google Scholar] [CrossRef]
  30. Both, J.; Gasda, S.; Aavatsmark, I.; Kaufmann, R. Gravity-driven Convective Mixing of CO2 in Oil. In Proceedings of the Third Sustainable Earth Sciences Conference and Exhibition, Celle, Germany, 13–14 October 2015; pp. 1–5. [Google Scholar] [CrossRef]
  31. Ahmed, T.; Nasrabadi, H.; Firoozabadi, A. Complex Flow and Composition Path in CO2 Injection Schemes from Density Effects. Energy Fuels 2012, 26, 4590–4598. [Google Scholar] [CrossRef]
  32. Rongy, L.; Haugen, K.B.; Firoozabadi, A. Mixing from Fickian Diffusion and Natural Convection in Binary Non-Equilibrium Fluid Phases. AIChE J. 2012, 58, 1336–1345. [Google Scholar] [CrossRef]
  33. Song, Y.; Jian, W.; Zhang, Y.; Shen, Y.; Zhan, Y.; Zhao, J.; Liu, Y.; Wang, D. Densities and Volumetric Characteristics of Binary System of CO2 + Decane from (303.15 to 353.15) K and Pressures up to 19 MPa. J. Chem. Eng. Data 2012, 57, 3399–3407. [Google Scholar] [CrossRef]
  34. Cadogan, S.P.; Mistry, B.; Wong, Y.; Maitland, G.C.; Trusler, J.P.M. Diffusion Coefficients of Carbon Dioxide in Eight Hydrocarbon Liquids at Temperatures between (298.15 and 423.15) K at Pressures up to 69 MPa. J. Chem. Eng. Data 2016, 61, 3922–3932. [Google Scholar] [CrossRef]
  35. Lee, A.L.; Ellington, R.T. Viscosity of n-Decane in the Liquid Phase. J. Chem. Eng. Data 1965, 10, 346–348. [Google Scholar] [CrossRef]
  36. Lindeberg, E.; Wessel-Berg, D. Vertical Convection in an Aquifer Column Under a Gas Cap of CO. Energy Convers. Manag. 1997, 38, S229–S234. [Google Scholar] [CrossRef]
  37. Wang, L.; Hyodo, A.; Sakai, S.; Suekane, T. Three-Dimensional Visualization of Natural Convection in Porous Media. Energy Procedia 2016, 86, 460–468. [Google Scholar] [CrossRef] [Green Version]
  38. Farajzadeh, R.; Salimi, H.; Zitha, P.L.J.; Bruining, H. Numerical Simulation of Density-Driven Natural Convection in Porous Media with Application for CO2 Injection Projects. Int. J. Heat Mass Transf. 2007, 50, 5054–5064. [Google Scholar] [CrossRef]
  39. Hebach, A.; Oberhof, A.; Dahmen, N. Density of Water + Carbon Dioxide at Elevated Pressures:  Measurements and Correlation. J. Chem. Eng. Data 2004, 49, 950–953. [Google Scholar] [CrossRef]
  40. Efika, E.C.; Hoballah, R.; Li, X.; May, E.F.; Nania, M.; Sanchez-Vicente, Y.; Martin Trusler, J.P. Saturated Phase Densities of (CO2+H2O) at Temperatures from (293 To 450) K and Pressures up to 64 MPa. J. Chem. Thermodyn. 2016, 93, 347–359. [Google Scholar] [CrossRef] [Green Version]
  41. Wang, L.; Nakanishi, Y.; Hyodo, A.; Suekane, T. Three-dimensional Finger Structure of Natural Convection in Homogeneous and Heterogeneous Porous Medium. Energy Procedia 2017, 114, 5048–5057. [Google Scholar] [CrossRef]
  42. Rasmussen, A.F.; Sandve, T.H.; Bao, K.; Lauser, A.; Hove, J.; Skaflestad, B.; Klöfkorn, R.; Blatt, M.; Rustad, A.B.; Sævareid, O.; et al. The Open Porous Media flow reservoir simulator. Comput. Math. Appl. 2020. [Google Scholar] [CrossRef]
Figure 1. Simplified sketch of convection-driving dissolution of CO2 with oil inside the reservoir.
Energies 14 00233 g001
Figure 2. Cumulative particle size distribution of the glass beads.
Energies 14 00233 g002
Figure 3. Simplified sketch of the main experimental setup with steel cell and porous media and sapphire cell for detection of CO2 breakthrough at bottom.
Energies 14 00233 g003
Figure 4. (a) Sapphire cell with the end piece; (b) end piece view from inside.
Energies 14 00233 g004
Figure 5. Piping and instrumentation (P and ID) diagram of the experimental setup.
Energies 14 00233 g005
Figure 6. (a) Oil (n-decane in this case) floating top of bromothymol blue (BTB) pH dye water solution inside the sapphire cell before the start of the experiment. (b) Visual investigation of CO2 breakthrough when CO2 changed the color of pH dye water solution from blue to green (red circled). (c) Color of pH dye solution a few minutes after the first indication of the breakthrough.
Energies 14 00233 g006
Figure 7. CO2 pressure decay data for 76 D (test 1), 16 D (test 2), and 4 D (test 3) porous media with n-decane including breakthrough (BT) times.
Energies 14 00233 g007
Figure 8. CO2 pressure decay data for 0.5 D (test 4) porous media with n-decane including breakthrough (BT) time.
Energies 14 00233 g008
Figure 9. CO2 pressure decay comparison for 4 D porous media tests with n-decane (test 3) and crude oil (test 5) including breakthrough (BT) times.
Energies 14 00233 g009
Figure 10. Estimated CO2 front (yellow arrows) reached the bottom of the 3-dimensional (3-dim) column and flow into the sapphire cell.
Energies 14 00233 g010
Figure 11. Ra number as function of dimensionless time for n-decane and water-saturated 3-dim porous media.
Energies 14 00233 g011
Figure 12. CO2 transport speed (mm/min) as a function of Rayleigh number (Ra) for n-decane (this study) and for water [24] in 3-dim column experiments.
Energies 14 00233 g012
Figure 13. Illustration of oil swelling due to CO2 mixing. Experiments were carried out by Amarasinghe et al. [25] inside a 2-dimensional (2-dim) Hele-Shaw cell using 76 D oil (n-decane)-saturated porous media at 100 bar and 50 °C. (a) Beginning of the experiment with oil-saturated porous media and free CO2 phase. (b) At the end of experiment, after 170 min, with swelled oil phase (46% of original oil in place (OOIP)). Red circle shows the moved CO2–oil interface.
Energies 14 00233 g013
Table 1. Crude oil composition.
Componentmol %
C52
C63
C75
C85
C96
C104
C114
C124
C134
C143
C153
C15+57
Total100
Table 2. Set of experimental cases with CO2/oil at 100 bar and 50 °C, and average breakthrough time and average CO2 transport speed.
Test No.Glass Beads (µm)Oil TypeEstimated Permeability (D) *Rayleigh Number (Ra)Average Breakthrough TimeAverage CO2 Transport Speed (V—mm/min)
1400–600n-decane7620158 min23.08
2100–200n-decane164242.75 h1.09
3 (2 repeats)70–110n-decane41067.5 h 0.11
40–50n-decane0.513102.5 h0.03
570–110crude oil4not calculated29 h0.1
* Determined in waterflooding of packed tubes.
Table 3. Parameters for Ra number calculation.
ParameterValue **Units
ρ C O 2 384.67kg/m3
H 0.18m
g 9.81m/s2
Φ 0.4-
n-DecaneCrude Oil
ρ o i l 730913kg/m3
ρ o i l + C O 2 m i x   755.2 [33]N/Akg/m3
ρ 25.2N/Akg/m3
D 6 × 10⁻⁹ [34]N/Am2/s
μ 6.9 × 10⁻⁴ [35]0.045kg/s·m
** Obtained at 100 bar/50 °C.
Publisher’s Note: MDPI stays neutral with regard to jurisdictional claims in published maps and institutional affiliations.

