1. Introduction
The operation of electricity generation is dominated by centralized power plants, whereby power is transmitted over long distances via transmission lines. Massive power loss takes place in the process of transmission and distribution. Distributed generation (DG) refers to distributed energy sources that are usually installed on the distribution network, which brings the generation unit closer to the consumer side of the network. The original purpose of installing DG units, which is also one of the reasons they came into existence, is to overcome the disadvantages of the widely used centralized power generation.
The allocation of DG units has been researched for the past decade due to the various benefits the DG units provide to the system [
1], such as a reduction in energy losses, improving power quality and voltage profile, delay grid expansion projects, increased system reliability, and various environmental benefits.
The optimal allocation problem usually has three optimization variables, which are size, location, and type. The utilized optimization technique depends on the models used to describe the system.
Any DG allocation problem is characterized by the following:
Objective
Considered types of DG
Static or dynamic allocation
Considered variability of generation and consumption
Considered uncertainty of generation and consumption
In the literature, different objectives or benefits have been addressed. Most of the research focuses on reducing power losses [
2,
3]. Other objectives proposed by researchers to improve the system performance include an enhanced voltage profile [
4], increased power factor [
5], increased DG penetration [
6], economic benefits to the system [
7], and economic benefits to investors.
From the perspective of the DG unit technology, some researchers have considered dispatchable units [
8], and others have considered non-dispatchable or renewable DG units [
9]. Most of the proposed allocation approaches are static and involve the allocation of DG units at one instant in time, such González, M.G. [
10]. In contrast, few approaches have proposed a dynamic allocation, whereby the DG unit installation year is optimized, such as in [
11].
Variabilities in DG output generation and load have been ignored González, M.G. [
10], while they have been considered in most other works, such as Alotaibi and Salama [
12]. Finally, the uncertainties associated with DG output and load have been addressed where renewable DG is considered, as in Gao’s, Hu’s , Yang’s and Liang’s [
13]. Despite that, some approaches have ignored the uncertainty and modeled renewable DG units with a capacity factor or with a simple profile, such as in Arriaga’s Cañizares’s and Kazerani’s [
14].
An important aspect is addressed in this work, which is the impact of a mix of DG units on the protection system. When a DG unit is installed in a distribution network, the existing protection scheme prior to DG installation will probably fail to operate efficiently and may cause harm or system blackout to the network through false tripping. The relay settings and placement must be studied and renewed after every DG installation [
15]. Moreover, even if the increase in current does not harm the protection device, it will certainly disturb the coordination between the primary and secondary relays, known as a protection device loss of sensitivity [
16]. Furthermore, the addition of DG units into the distribution system will cause a reverse/upstream current in the system, depending, respectively, on the DG location and the fault location. Thus, the protection coordination must be modified, which can be downstream network coordination or downstream–upstream network coordination. Many algorithms are proposed in the literature to solve the coordination problem through adaptive and nonadaptive algorithms. In Pereira’s, K. et al. [
17] proposed a methodology utilizing a multi-objective genetic algorithm to optimize the coordination of protective devices in a distribution network in the presence of DG. However, the work done by Huchel, L. et al. [
18] considered only synchronous-based DG.
Based on the aforementioned discussion, the DG allocation approaches proposed in the literature lack the simultaneous consideration of protective equipment characteristics and renewable DG allocation. The only time where protection cost is taken into consideration is after the placement of the DG units and never as a dynamic part of the optimization problem.
To that end, this paper proposes a new dynamic planning approach to find the optimal sizes, locations, years of installation, and types of DG units to maximize investor or utility benefits while minimizing the investment costs over the project lifetime.
The main contributions of the proposed approach consider the following:
2. Proposed Methodology
To simultaneously consider protection system upgrades and DG allocation, the proposed optimization problem includes a dynamic fault analysis technique, which is developed for the distribution system in the presence of both SDG and inverter-based DG units.
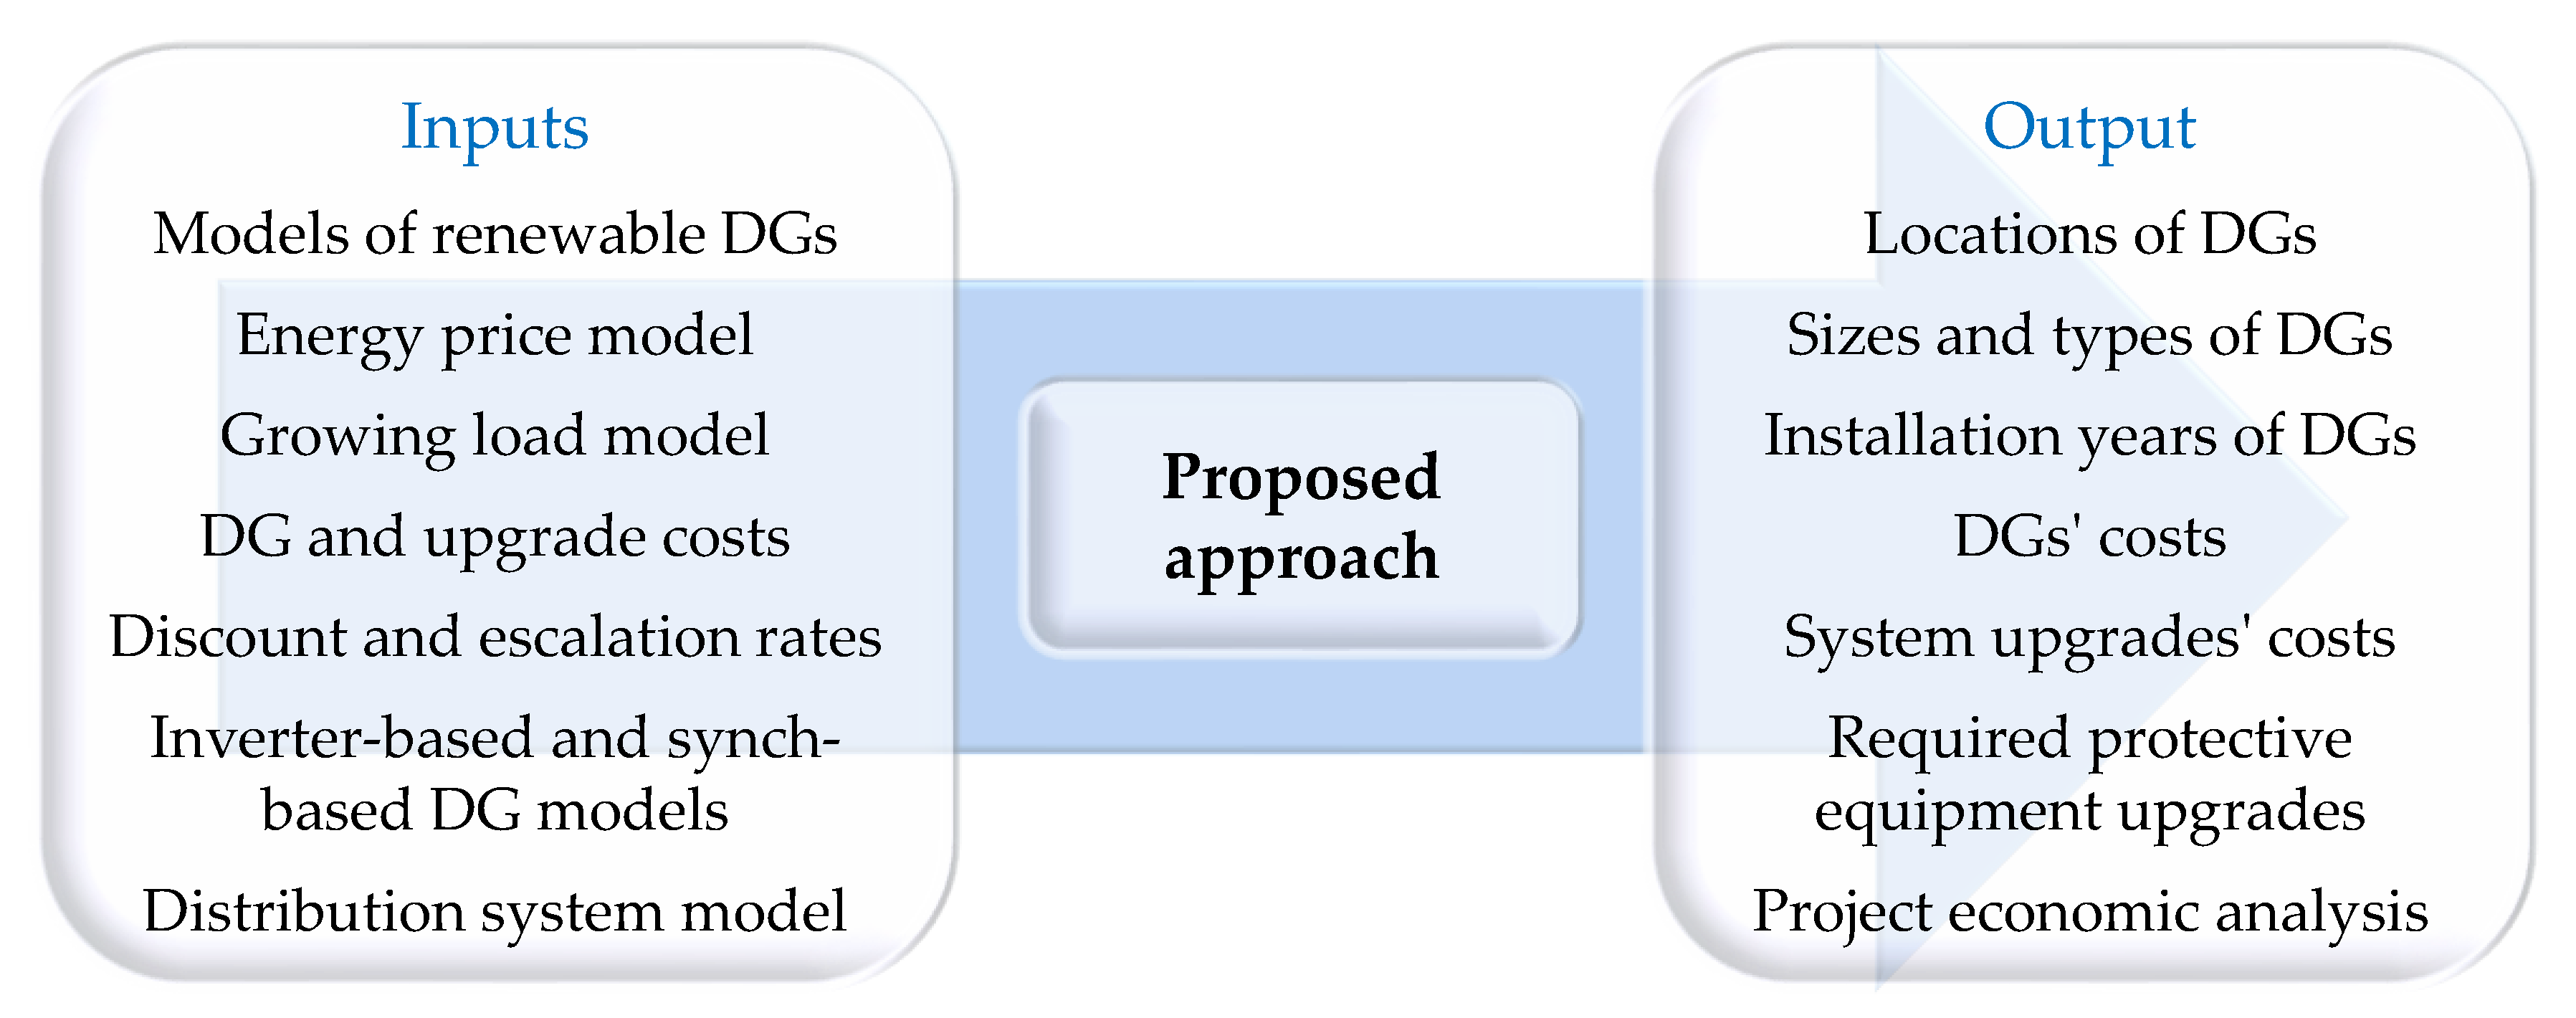
As shown in
Figure 1, the planning approach makes use of probabilistic models to describe the growing load, PVDG output, and energy price. For dynamic fault analysis, the SDG and PVDG models are used to represent the system under fault conditions.
Other economic inputs include the cost of DG and equipment upgrades, as well as discount and escalation factors.
The outputs of the proposed approach include the locations, sizes, types, and installation years of DG units as well as the required system upgrades. In addition, the outputs include a detailed economic analysis of the DG installation and operational costs, system upgrade costs, protection system costs, and the cost of energy purchased from the grid.
3. Modeling
To accurately model the variability and uncertainty of the generation, consumption, and energy price, all possible system conditions must be considered. Therefore, a multistate probabilistic model is constructed by joining the PV probabilistic state model, the load probabilistic state model, and the energy price model through a joint discrete probability distribution function to represent the system under different conditions.
3.1. Load Model
The multistate probabilistic load model is built using normalized hourly historical data for Ontario, Canada [
19]. K-means clustering is used to create
states from load demand data; then, the associated probability with each state is calculated, resulting in a multistate model representing the demand.
3.2. Photovoltaic Generation Model
The photovoltaic DG output is modeled as a multistate probabilistic model with
states. Each state represents the power generation output with its probability as given by Li, Y. and Zio, E. [
20]. The states represented are a result of Mohamed and Koivo [
21].
3.3. Energy Price Model
A multistate probabilistic price model is constructed for the buying and selling price of energy from and to the electrical grid. The probabilistic price multistate model is built using the Ontario hourly energy price [
22] with a total of
states. The energy price calculated from the K-means algorithm is only one part of the total energy cost paid by the distribution company. The total commodity cost for the electrical energy price also depends on the global adjustment. The global adjustment cost is usually added on top of the energy price.
3.4. DG Installation and Operational Cost
When evaluating a DG project, the specific investment costs of either SDG or PVDG are estimated from actual DG projects. In this work, we will consider the capital costs of installing the DG units and their operational costs. The main inputs that determine the SDG capital and operational costs are the generation unit capacity and the fuel price. Fuel price changes throughout the year depending on the fuel stock market, but it is generally assumed to increase on an annual basis. Thus, in this work, the SDG capital, operation, and maintenance costs are taken from Smaper’s and Vargas’s [
23] with a fuel price escalation factor of 2%. A thorough study is done on large-scale photovoltaic projects Castillo, A. et al. [
24], wherein a large-scale PVDG project is economically evaluated to determine the equivalent cost of the project in
$/kW, which represents the capital investment costs and operational costs.
Due to the fact that the value of money changes over time, in this work we use the principle of present worth (PW) to represent all the capital and operating costs. The PW is the equivalent value of the money in the present time, i.e., year 0. Using the PW of all costs allows us to algebraically add or subtract these costs and compare them.
3.5. Protection System Cost
Fuses are considered the main protection devices in traditional radial distribution systems due to their simplicity and inexpensive capital, operation, and maintenance costs. The main drawback of using fuses is their unidirectional current characteristics, which may cause false tripping of a healthy feeder in the case that a fault occurs in the presence of DG units in the radial system. This work considers the costs of the installation and upgrade of fuses in distribution power systems, which are directly related to the continuous current levels. Without the presence of DG units, all the system protection devices are assumed to be fuses since there are no DG units present in the system. Hence, no upstream currents are present in the network. If a DG results in a reverse current through a fuse, the fuse must be replaced with a circuit breaker and a relay.
The most commonly used type of protective relay is the overcurrent protective relay, which is one of the first developed and most widely used devices in the protection system [
25]. Overcurrent relays (OCRs) are characterized by their lower cost with respect to other types of protection systems. They also provide a vast range of tap options, adding flexibility to their settings characteristics. A directional OCR combines an OCR with a directional device that detects the current direction using the current magnitude and phase angle. This work considers the costs of the installation and upgrade of relays and circuit breakers in the power systems, which are directly related to the continuous current levels.
3.6. Power Line Upgrade
Power line conductors are available in various power capacity ranges. For the line upgrade criteria, the results from a power flow analysis are utilized to calculate the power passing through each line in the distribution system. When the power passing through a line is greater than the line’s thermal capacity, a parallel line is installed. After upgrading the power line, its thermal capacity doubles, while its resistance and impedances are halved through the rest of the planning period.
4. Fault Analysis and Protection
In this section, the fault analysis and criteria for protective device upgrades are presented. First, the system impedance matrix is developed, and then a fault analysis is carried out for SDG and inverter-based DG.
4.1. System Impedance Matrix with DG Units
The impedance matrix is essential for calculating fault currents and is usually easy to obtain from the Y matrix, but due to the nature of radial systems, the considered line upgrades, and the installation of different DG units, it is not possible to obtain the impedance matrix through traditional methods. The solution to this problem is to build the Z matrix from scratch each time a DG unit is added to the distribution system. In this approach, the whole system is built element by element as in [
26], starting from a single element connected to the reference bus. The reference bus in this study is assumed to be the grid bus, which is the substation feeding the distribution network.
4.2. Fault Analysis
The type of fault considered in this study is a symmetrical fault, with which the system remains balanced. This type of fault has the most severe effects on the network since it causes the highest fault current in the system. Fault analysis is carried out at the beginning of every year on maximum DG output capacity with a fault applied on each bus to record the fault currents for all possible fault locations. Then, the system is upgraded accordingly. Once an upgrade is made to the protection system, the upgrade is carried out throughout the remaining planning period.
4.3. Fault in Presence of SDG
These types of generators are usually modeled as a voltage source followed by a series impedance. In the case of a fault, a synchronous generator is modeled as a decaying voltage source with a constant impedance representing the characteristics of a synchronous machine [
27]. The effects of SDG units on the protection system have been analyzed in depth by Yazdanpanahi, H. et al. in [
28]. In this work, SDG units are represented as a voltage source in series with an impedance. The fault current injection of the SDG unit is calculated using Equations (1) and (2):
where
is the post-fault voltage,
represents the pre-fault voltages,
represents the faulted bus with
set to zero,
represents the elements corresponding to the impedance matrix after modification,
is the fault current injected at bus
, and
is the fault impedance. The synchronous DG inductive characteristic can be integrated into the formation of the Z bus matrix. The DG unit is a typical modification to the
Z bus matrix, adding an inductance of
between an existing bus
i to the ground. If the synchronous generator capacity, and hence the internal inductance, are known, the fault contribution of the synchronous generator can be studied by modifying the
Z bus matrix, where
represents the synchronous machine inductance.
is calculated based on the synchronous generation unit maximum capacity when installed with respect to a base value.
4.4. Fault in the Presence of PVDG
Inverter-based distributed generation (IBDG) units such as Class-D wind turbines and photovoltaic panels require a full-scale power electronics converter to be connected to the power system. Usually, an IBDG is modeled as a constant current source for simplicity [
29,
30]. The need to model such IBDG units is extremely crucial for complete and accurate fault analysis. The behavior of IBDG during fault conditions is highly dependent on the type, technology, and control unit. In the case of a fault, the control unit disconnects the IBDG when its current exceeds a certain threshold, which is usually 100–400% of the rated current, in order to protect the DG and reduce its contribution to the fault current [
31].
To model the IBDG under fault conditions, the IBDG is set to inject 120% of its rated current value to the network. The effect of the injected current on the system voltages is calculated as shown in Equation (3):
where
is the post-fault voltage,
is the bus with PVDG,
is the current injection from the PVDG unit connected to bus
with a magnitude equal to 120% of the PVDG rated current,
is the post-fault voltage on faulted bus
,
is the fault current injected at bus
, and
represents the elements corresponding to the impedance matrix after modification. The PVDG fault current contribution to the total fault current at the faulted bus
is subjected to current division.
5. Problem Formulation
The problem is classified as a mixed-integer nonlinear programming (MINLP). The vector of decision variables
Ω includes the types, sizes, locations, and installation years of the allocated DG units. The objective function to be minimized represents the overall total cost to operate the system for the planning horizon described in PW as shown in Equation (4). The total cost in (4) is presented in three factors: the PW of the capital costs
, the PW of the operation and maintenance cost
, and the PW of the energy purchased or sold to the grid
.
The capital cost
is represented in Equation (5) as the sum of the PW of the SDG
, PVDG
, line upgrades
, fuse replacement and upgrades
, directional relay upgrades and installation
, and circuit breaker installation
.
The total PW of the operational and maintenance cost of DG units
can be represented as the sum of the operational and maintenance cost for synchronous
and photovoltaic DG
as in Equation (6).
The
is the expected PW of the energy bought from the grid, which can be represented as in Equation (7):
where
and
are the PW of the energy bought from and sold to the grid, respectively, corresponding to the system state
,
is the probability of state
, and
is the set of all system states.
and
can be defined as follows in Equations (8) and (9):
where
and
are the indices of candidate buses,
and
are the price of energy for every state
after adjusting the buying price with the global adjustment,
is the delivered energy from the grid to the system at any state
, and
represents the losses in the distribution system at state
.
All the costs in (4)–(9) are subject to a discount rate
, which is used to calculate the net present worth (
NPW) of all expenses occurring in year
as shown in Equation (10):
where
is the total cost of the distribution company expenses for year
,
is the total
NPW of the distribution company expenses, and
is the number of years under study. Note that for grid selling and buying costs and the SDG operational costs, the fuel and escalation factor
is considered by replacing the discount rate with the effective discount rate
shown in Equation (11), which is given in [
32].
System Constraints
The proposed planning problem is subject to the following constraints.
- (1)
Power flow constraints: the optimization problem must satisfy the active and reactive power balance constraints for all system states
for year
on bus
described in Equations (12) and (13), where
is the power injection from the grid,
and
are the power injection from the SDG and PVDG units,
is the power consumption of bus
for state
in year
, and
is the element corresponding to the
i-th row and
j-th column of bus admittance matrix
with angle
.
and
are the per-unit voltage magnitude on bus
and
for state
in year
, and
and
are per-unit angles on bus
and
for state
in year
.
is the reactive power injection to the grid, and
is the reactive power consumption of bus
for state
in year
. The SDG output at any state
is defined as a fraction of the total allocated capacity
depending on the SDG state
as in (14) and similarly for PVDG, where
is the output of the PVDG as a fraction of the total installed capacity
, depending on the PVDG state
as in Equation (15).
- (2)
Voltage limit constraints on buses: the voltage magnitude
of the buses must be within the acceptable limits
and
for all system states
z, as in Equation (16).
- (3)
Line upgrade constraints: the power flowing through any distribution line
must be within the line power capacity
. If the power flowing through the line is greater than the line capacity, a line upgrade is required as in Equation (17).
- (4)
Protection equipment operation range: the current passing through fuses or relays
must be within the equipment’s operational limits. If the load current falls short of the fuse
or relay
minimum pickup currents or exceeds the operation range of a fuse
or a relay
, an upgrade to the protection system is required, as shown in Equations (18) and (19).
- (5)
Equations (20) and (21) describe the discrete size of DG capacity: the connected DG capacities at each bus are assumed to be discretized at a fixed step, where
and
are integer multiplier used in the Genetic Algorithm (GA) chromosome that is dependent on the type of DG:
- (6)
Candidate bus constraints: DG units are not permitted to be connected to any bus in the distribution system. DG units are only allowed to be installed on a predefined set of buses
and
called candidate buses as in Equations (22) and (23).
- (7)
Maximum DG installation: the maximum capacity of DG generation at any individual bus
is limited based on the system voltage profile and technical constraints chosen by the local distribution company, denoted by
as shown in Equation (24).
- (8)
Installation year constraints: DG installation
and
is permitted for bus
in specific years
and
throughout the planning period, as in Equations (25) and (26).
6. Solution Method
Metaheuristics techniques have been extensively used to find a near-optimal solution for these kinds of problems due to the high complexity, as in Zhang’s and Xu’s [
33]. This work adopts a Genetic Algorithm (GA) for the optimization process, which is one of the widely used algorithms in DG planning. Compared to other metaheuristic methods, GA offers faster convergence time and reduced computational efforts [
34]. GA is used to optimize the protection system in the presence of DG units rather than the planning of the DG units [
35]. The methodology adopted in this study is outlined in the following steps.
GA generates a population of candidate solutions.
For each candidate solution of DG unit size, year, and placement, execute steps 3 to 9.
Solve the power flow analysis using the Newton–Raphson for each system state throughout the planning period.
In cases of no convergence of the power flow or if the resulted voltages or currents violate the system technical limits, a large penalty is applied to the fitness function; go to step 10.
For all system states, record energy purchased from the grid and energy sold to the grid throughout the planning period.
Calculate the capital and operational costs of DG units throughout the planning period.
Calculate the required system upgrades throughout the planning period.
Check the system for violations, and if any violations exist, set a high-cost penalty on the objective function.
Perform an economic analysis on steps 5 to 8 to form the fitness of the individual, which is the net present value of the investment.
If the stopping criteria are met, terminate; otherwise, go to step 1.
The structure of the GA chromosome is divided into two sections. Each section is divided equally and has a length two times the number of candidate buses for the SDG and PVDG installation; i.e., the length of each section is , where and . In the first section, genes 1 to represent the SDG and PVDG installed capacities as a multiple of a fixed step, with each gene corresponding to a candidate bus. Similarly, the second section has the same length of , with each gene corresponding to the installation year of SDG and PVDG. All the gene values should be integers in this work.
7. Simulation Results
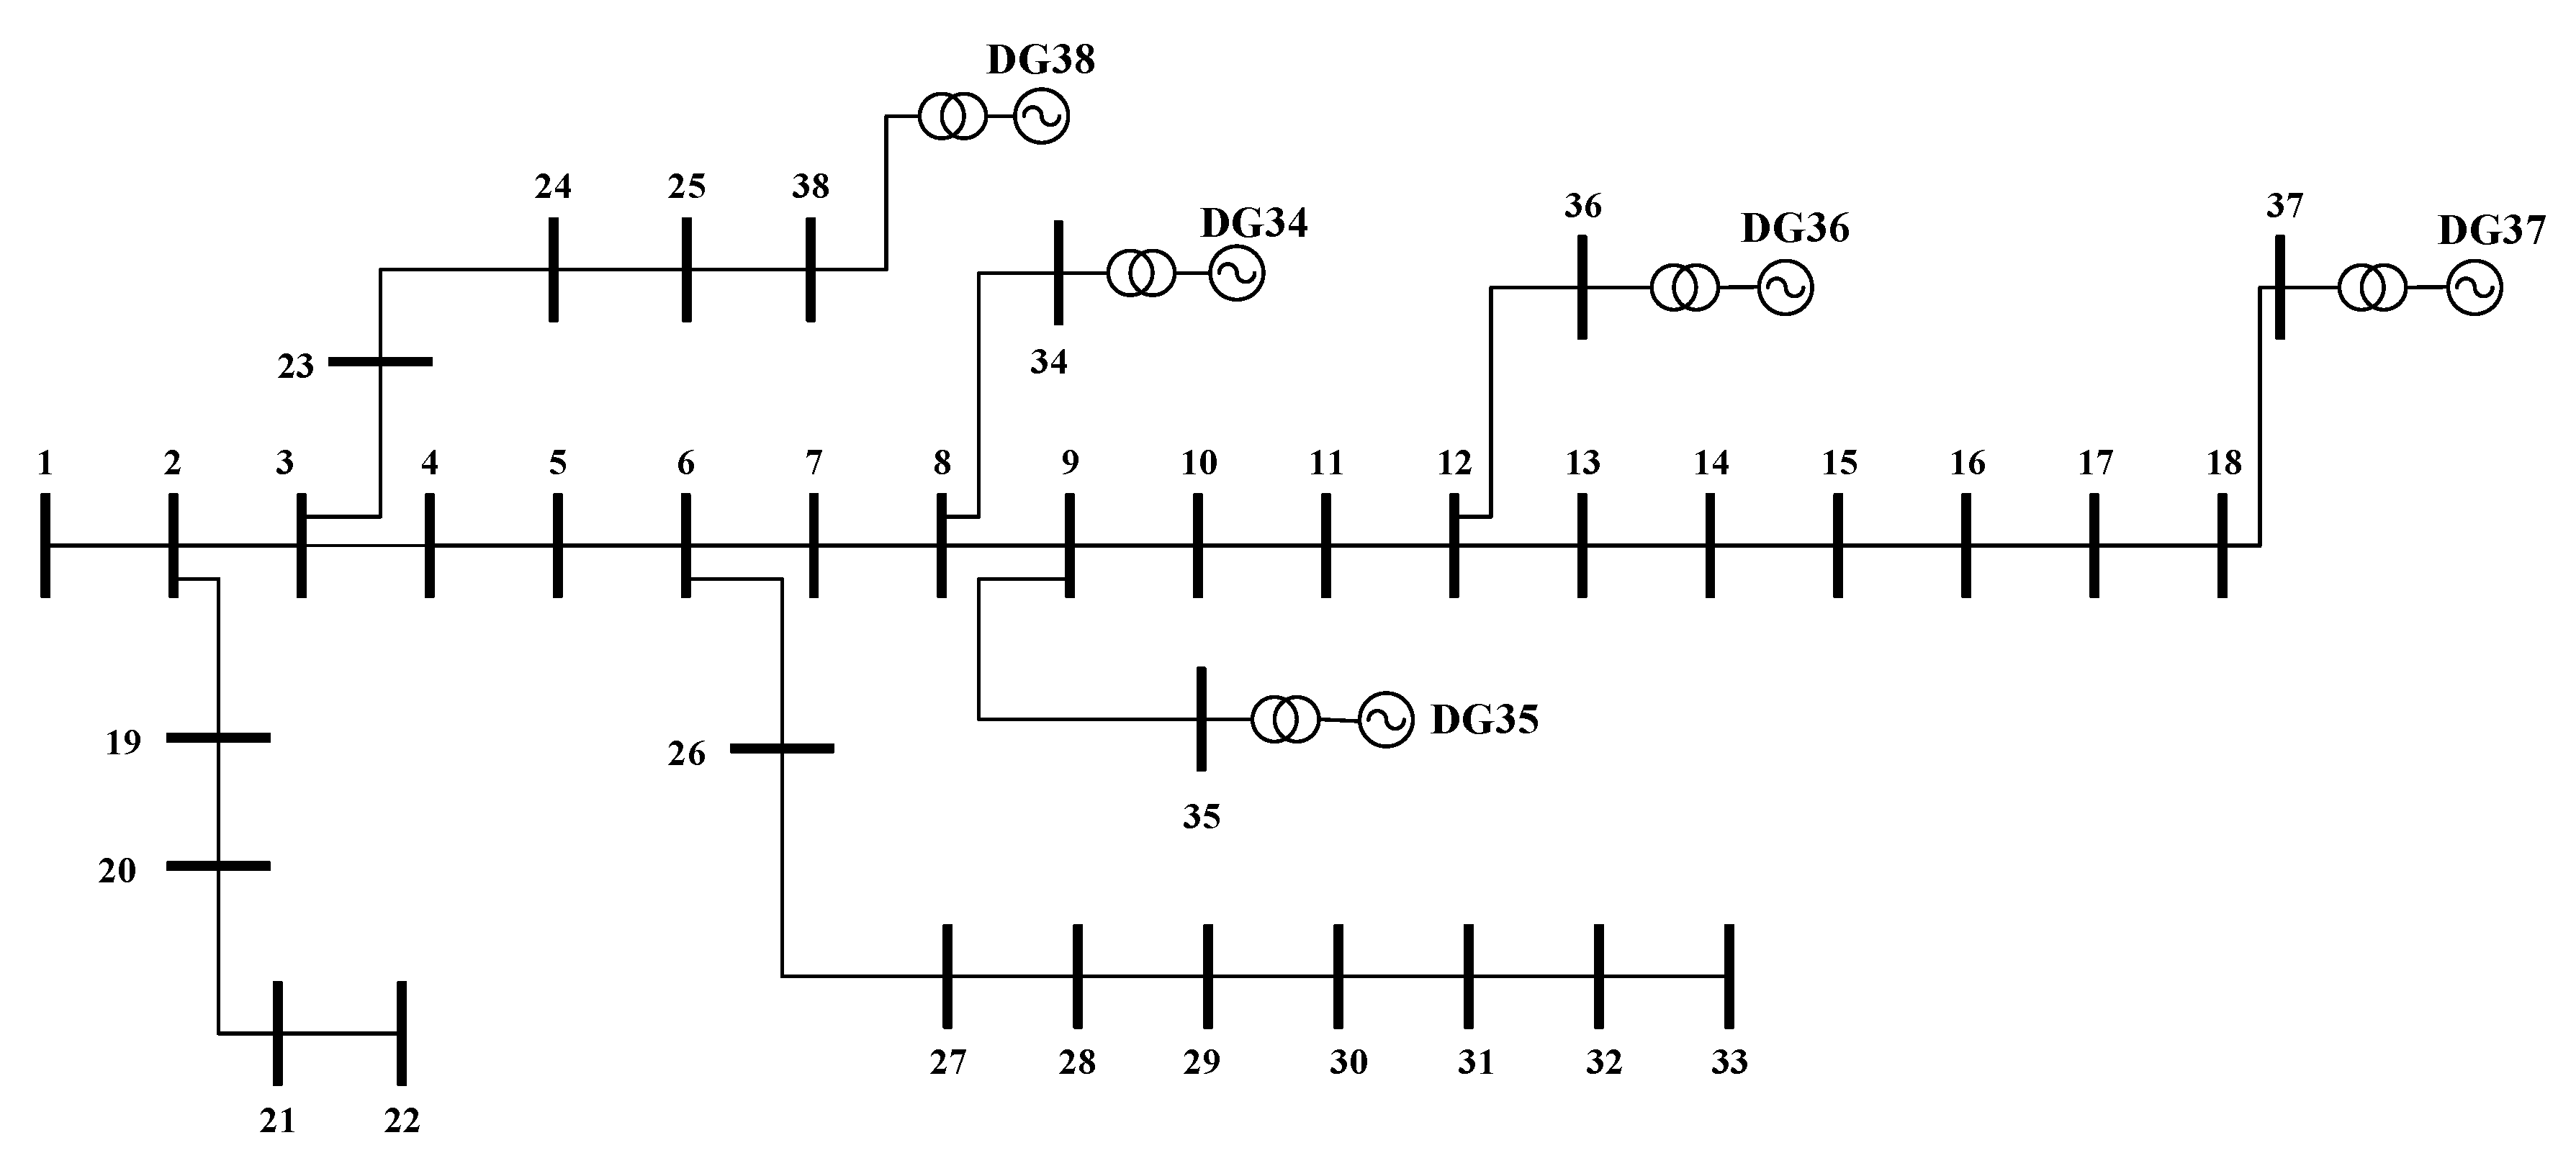
The distribution test system considered for this study is the 38-bus system shown in
Figure 2. The peak load of the entire system is initially 4.37 MVA. The distribution system and load data are given in [
36]. The annual load growth is assumed to be 5% over a planning period of 20 years. The voltage limit is assumed to be ± 6% of the nominal per unit value. Five buses are chosen as candidate buses for SDG and PVDG, which are 34, 35, 36, 37, and 38 as in Singh, D. et al. [
36]. Without loss of generality, the PVDG output is modeled by five states, and the load is modeled by six states, while the energy price is modeled by three states. A fixed annual transmission charge of 510
$/MW is applied to the peak load. The discount rate is assumed to be 4%, with an energy price escalation factor of 3.6%. The GA simulation parameters are shown in
Table 1.
For simplicity, the labor costs for fuses and OCR upgrades are fixed at
$2000. In contrast, the price of fuses and OCR costs depends on their current rating as Meneses and Mantovani [
37]. The cost for a circuit breaker is around
$40,000, and the line upgrade cost is approximately
$200,000 [
38].
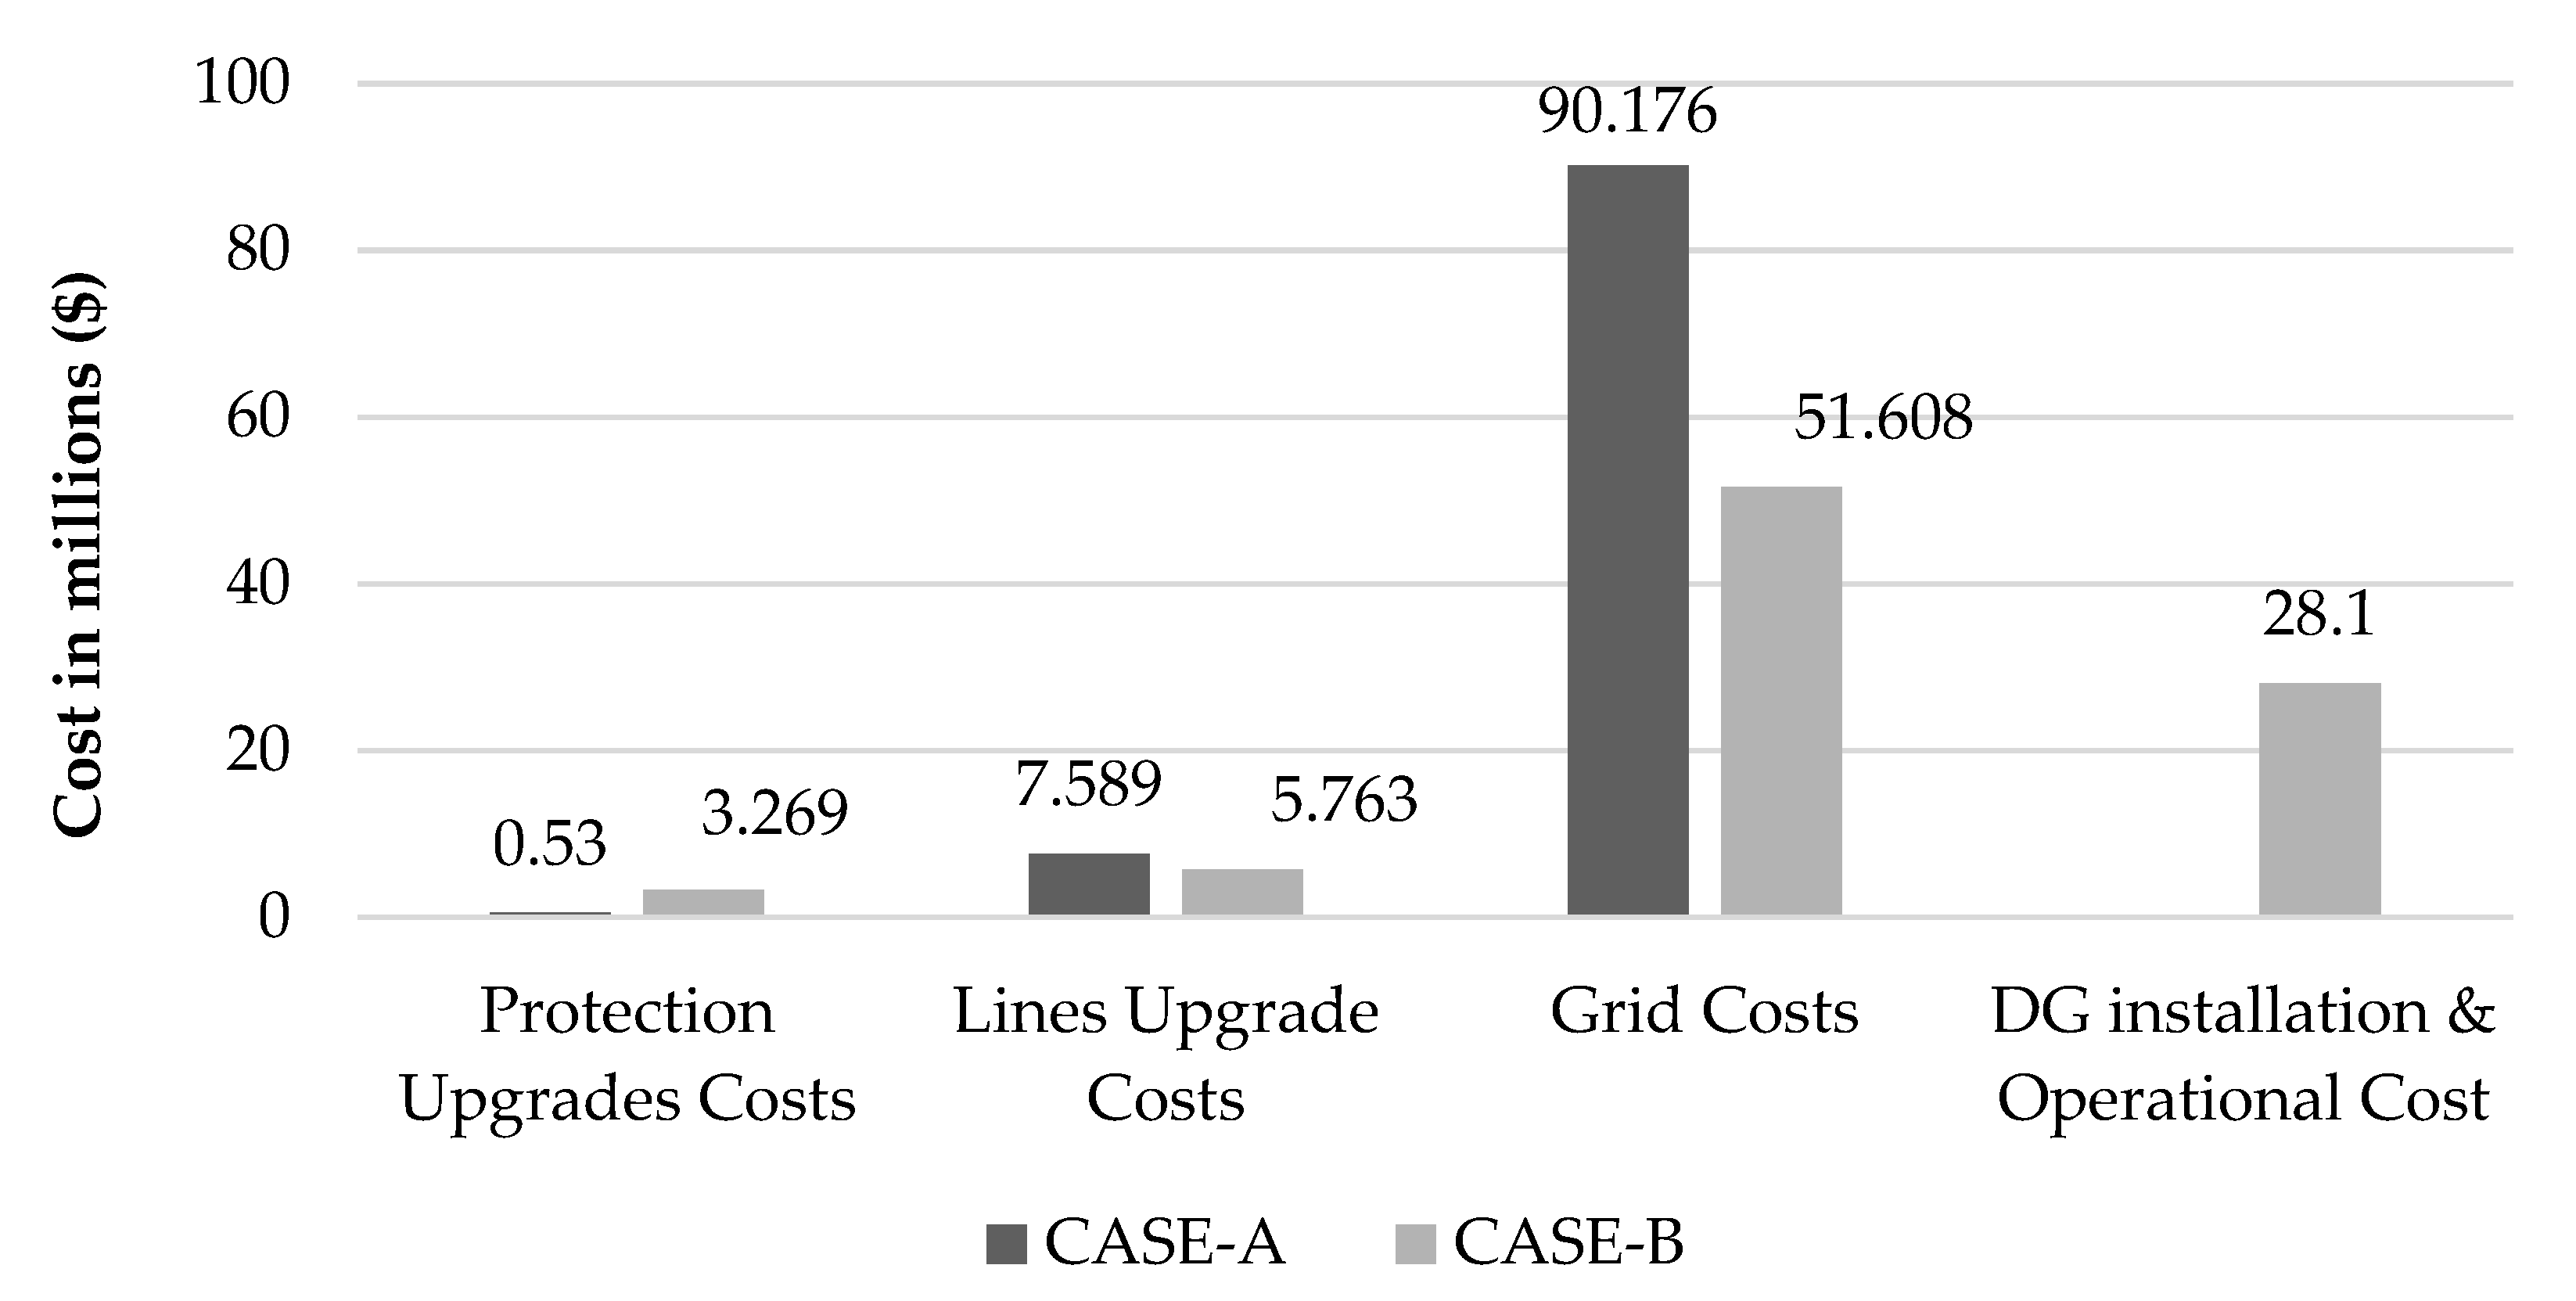
In this work, two cases are investigated. CASE-A represents the base case with no DG units installed in the system. CASE-B represents the proposed approach with optimal DG installations. In the following sections, all the costs involved in Equation (3) are analyzed.
7.1. Net Present Worth for All Costs
For CASE-A, the total cost to meet growing demand over the study period is $98.3M. The total cost is divided as follows: 0.539% is associated with protection upgrades, 7.720% is associated with line upgrades, and 91.692% is associated with purchased energy from the grid.
For CASE-B, the net cost over the total period of the study is approximately
$88.537M, which reflects an overall reduction of 9.93%. This amount is divided as follows: 3.446% for protection upgrades, 6.509% for line upgrades, 58.290% for purchasing energy from the grid, and 31.757% associated with capital and operational costs for DG units. The breakdown of the costs associated with each case is shown in
Figure 3. Overall, extra costs are paid for DG installation and protective equipment upgrades, but they resulted in a significant reduction in the cost of energy purchased from the grid and line upgrades.
7.2. DG Installation Cost
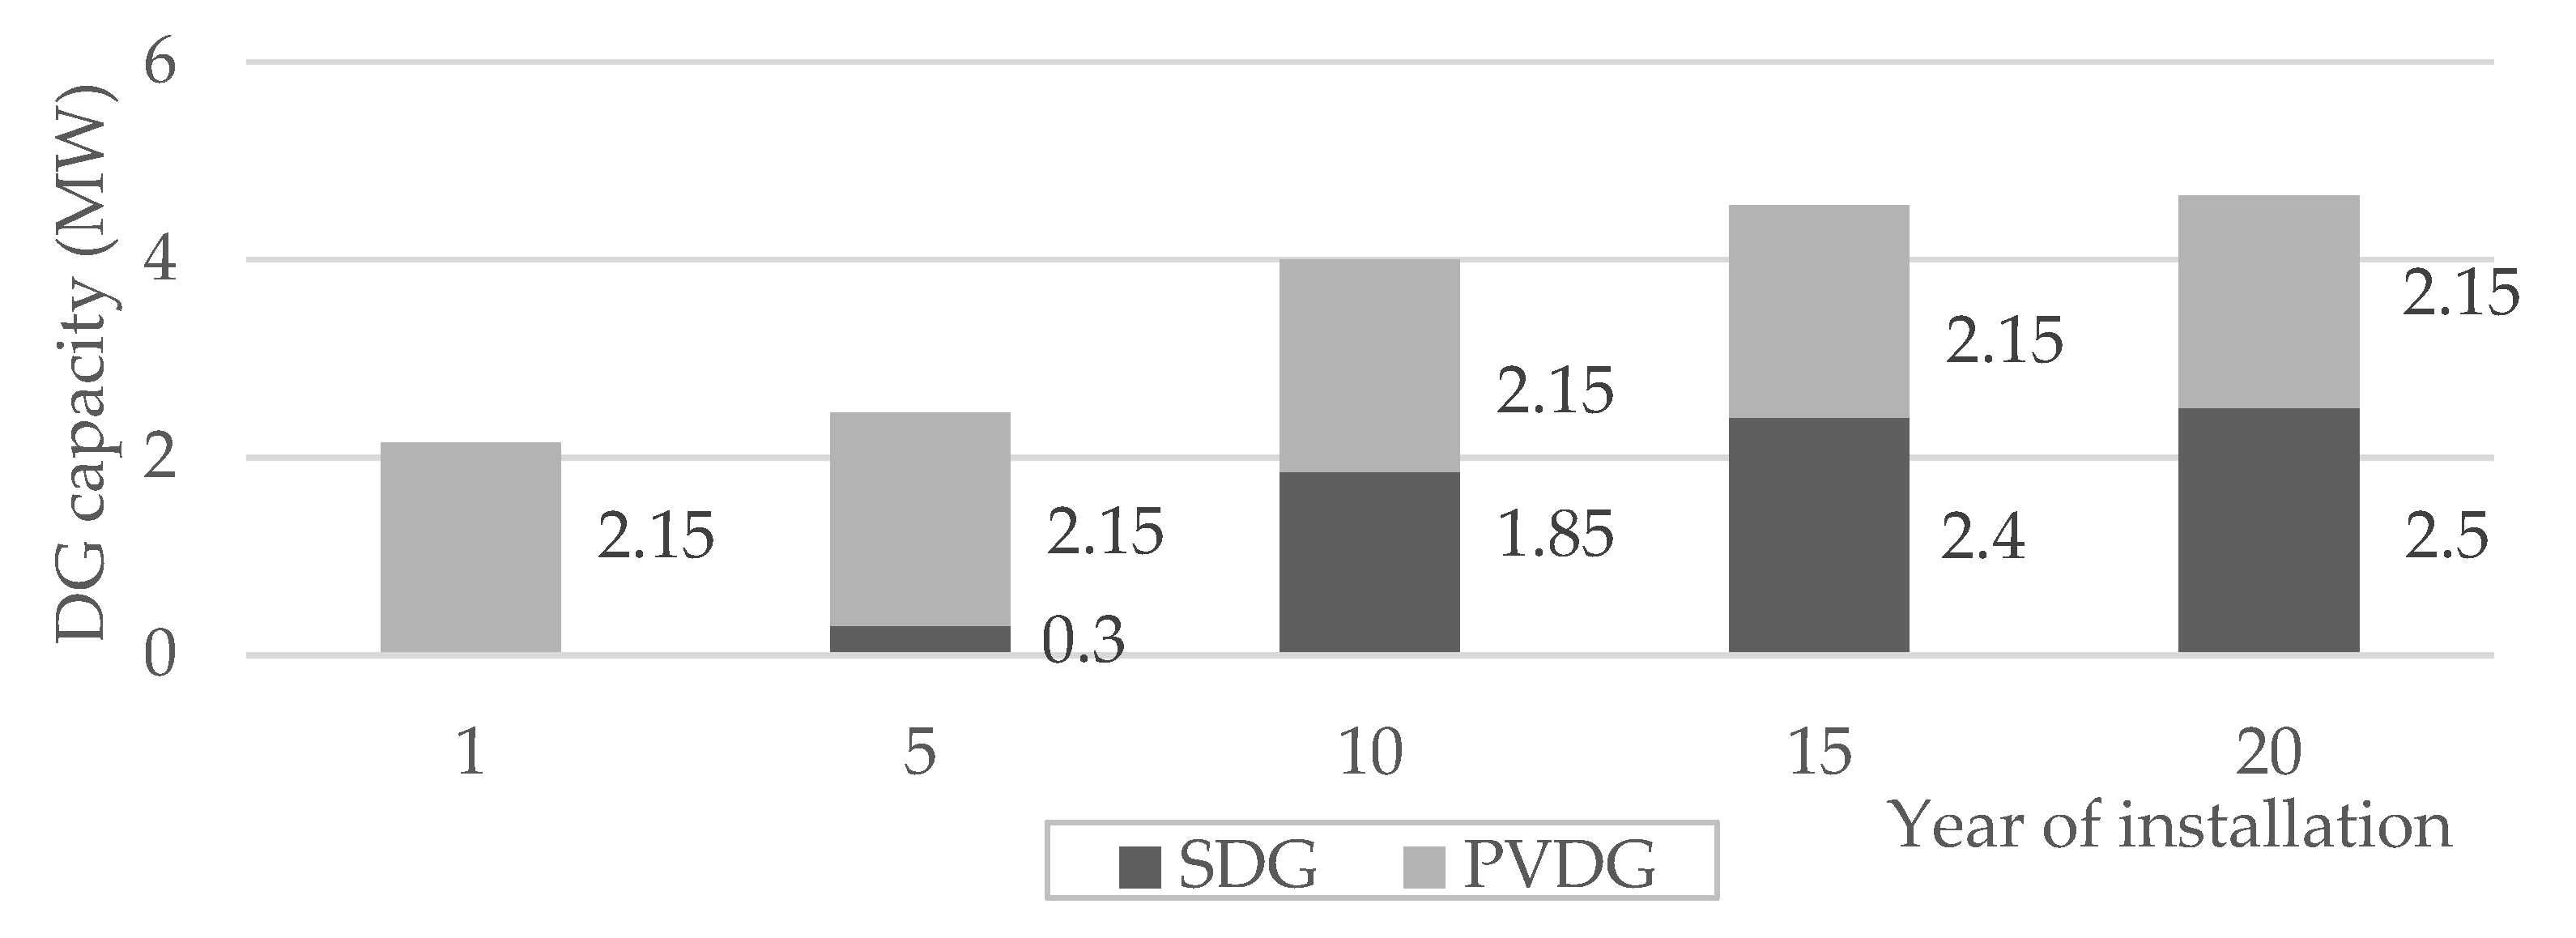
Only CASE-B is considered for the capital and operational costs for DG units. The optimal allocated DG units and years of installation are shown in
Table 2 and
Figure 4.
The total allocated DG capacity installed at the end of the planning period is 4.65 MW, composed of 2.15 MW in PVDG and 2.5 MW SDG as shown in
Figure 4, with an overall NPW of
$28.115M. The total NPW of SDG capital and operational costs is approximately
$20.880M, while the NPW of installation and operational costs of PVDG is approximately
$7.235M. The total PVDG capacity is installed in year 1, which is due to the negligible operating costs for this type of DG. However, to meet the load growth and to avoid line upgrades, SDG units are installed with different capacities through the planning period. The years of installation will be further discussed in the next sections when linked to other costs.
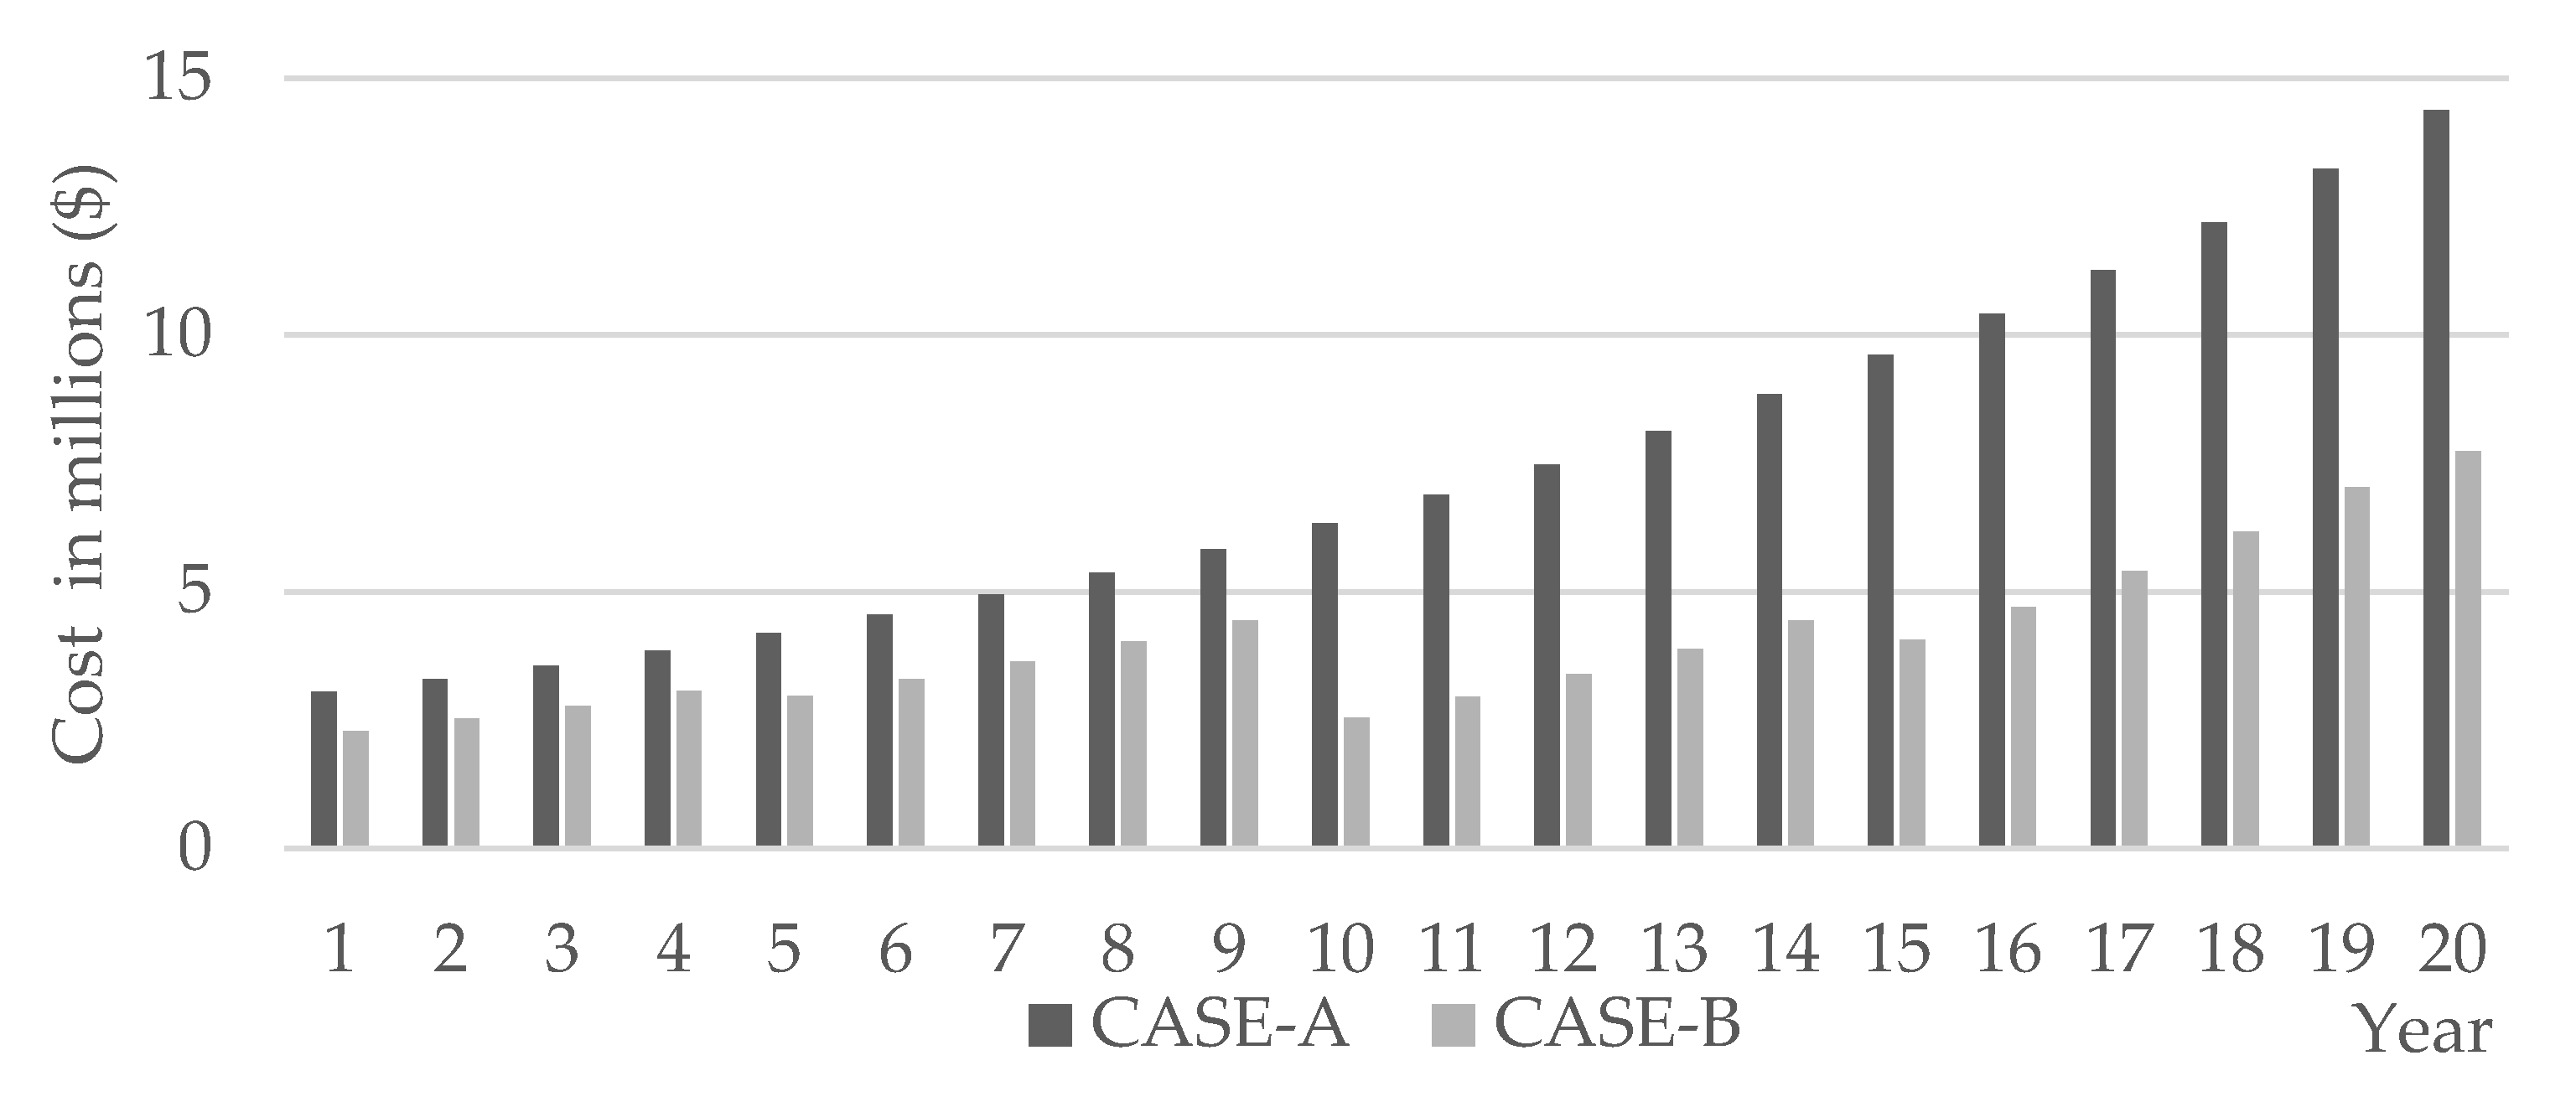
7.3. Cost of Energy Purchased From the Grid
For CASE-A, the total cost of purchased energy from the grid is
$90.176M, which is the PW of the costs paid every year as shown in
Figure 5. The increase in the cost is due to the cumulative load growth over 20 years.
However, the grid cost to meet the demand load over the study period for CASE-B is
$51.608M, which reflects a 42.77% reduction compared to CASE-A. The reduction is due to the DG unit supplying power to loads instead of the grid. As seen in
Figure 5, the decrease in the initial grid costs is due to the PVDG installed in the first year. A small decrease is noticed in years 5 and 15, which is due to the 0.3 MW and 0.55 MW SDG installed. The largest decrease in grid cost occurs in year 10, when 1.55 MW SDG units are installed on buses 34 and 38.
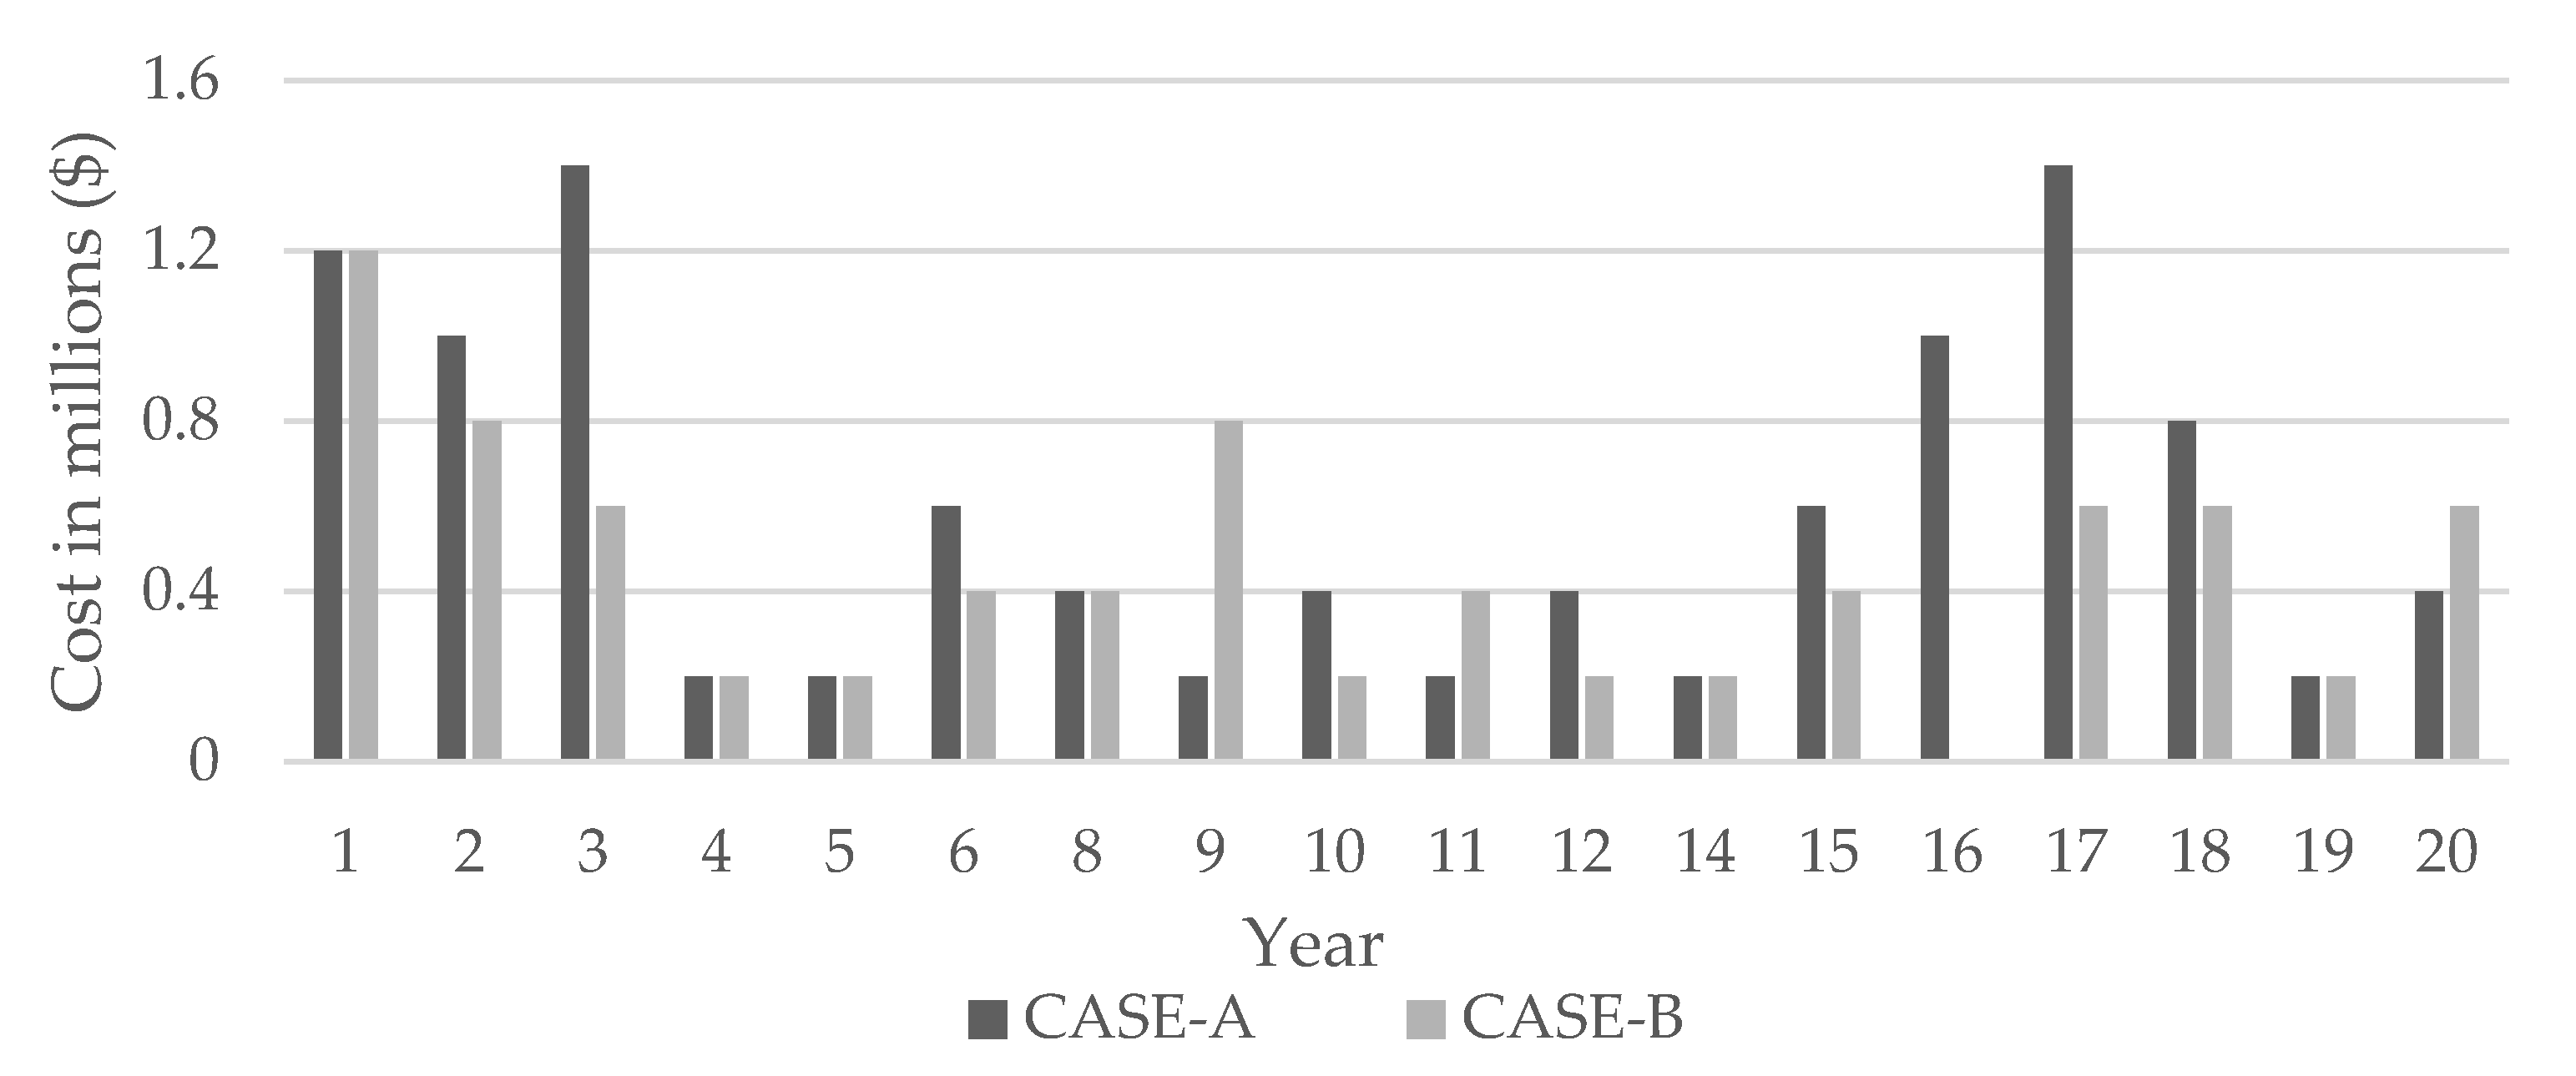
7.4. Cost of Line Upgrades
The NPW of line upgrades for CASE-A is
$7.589M, while for CASE-B it is
$5.763M, corresponding to a reduction of 24.06%, shown in detail in
Figure 6. This reduction is due to the deferral of required line upgrades to meet the load growth by installing DG units, which reduces the consumed current from the grid and consequently the current passing in the system lines.
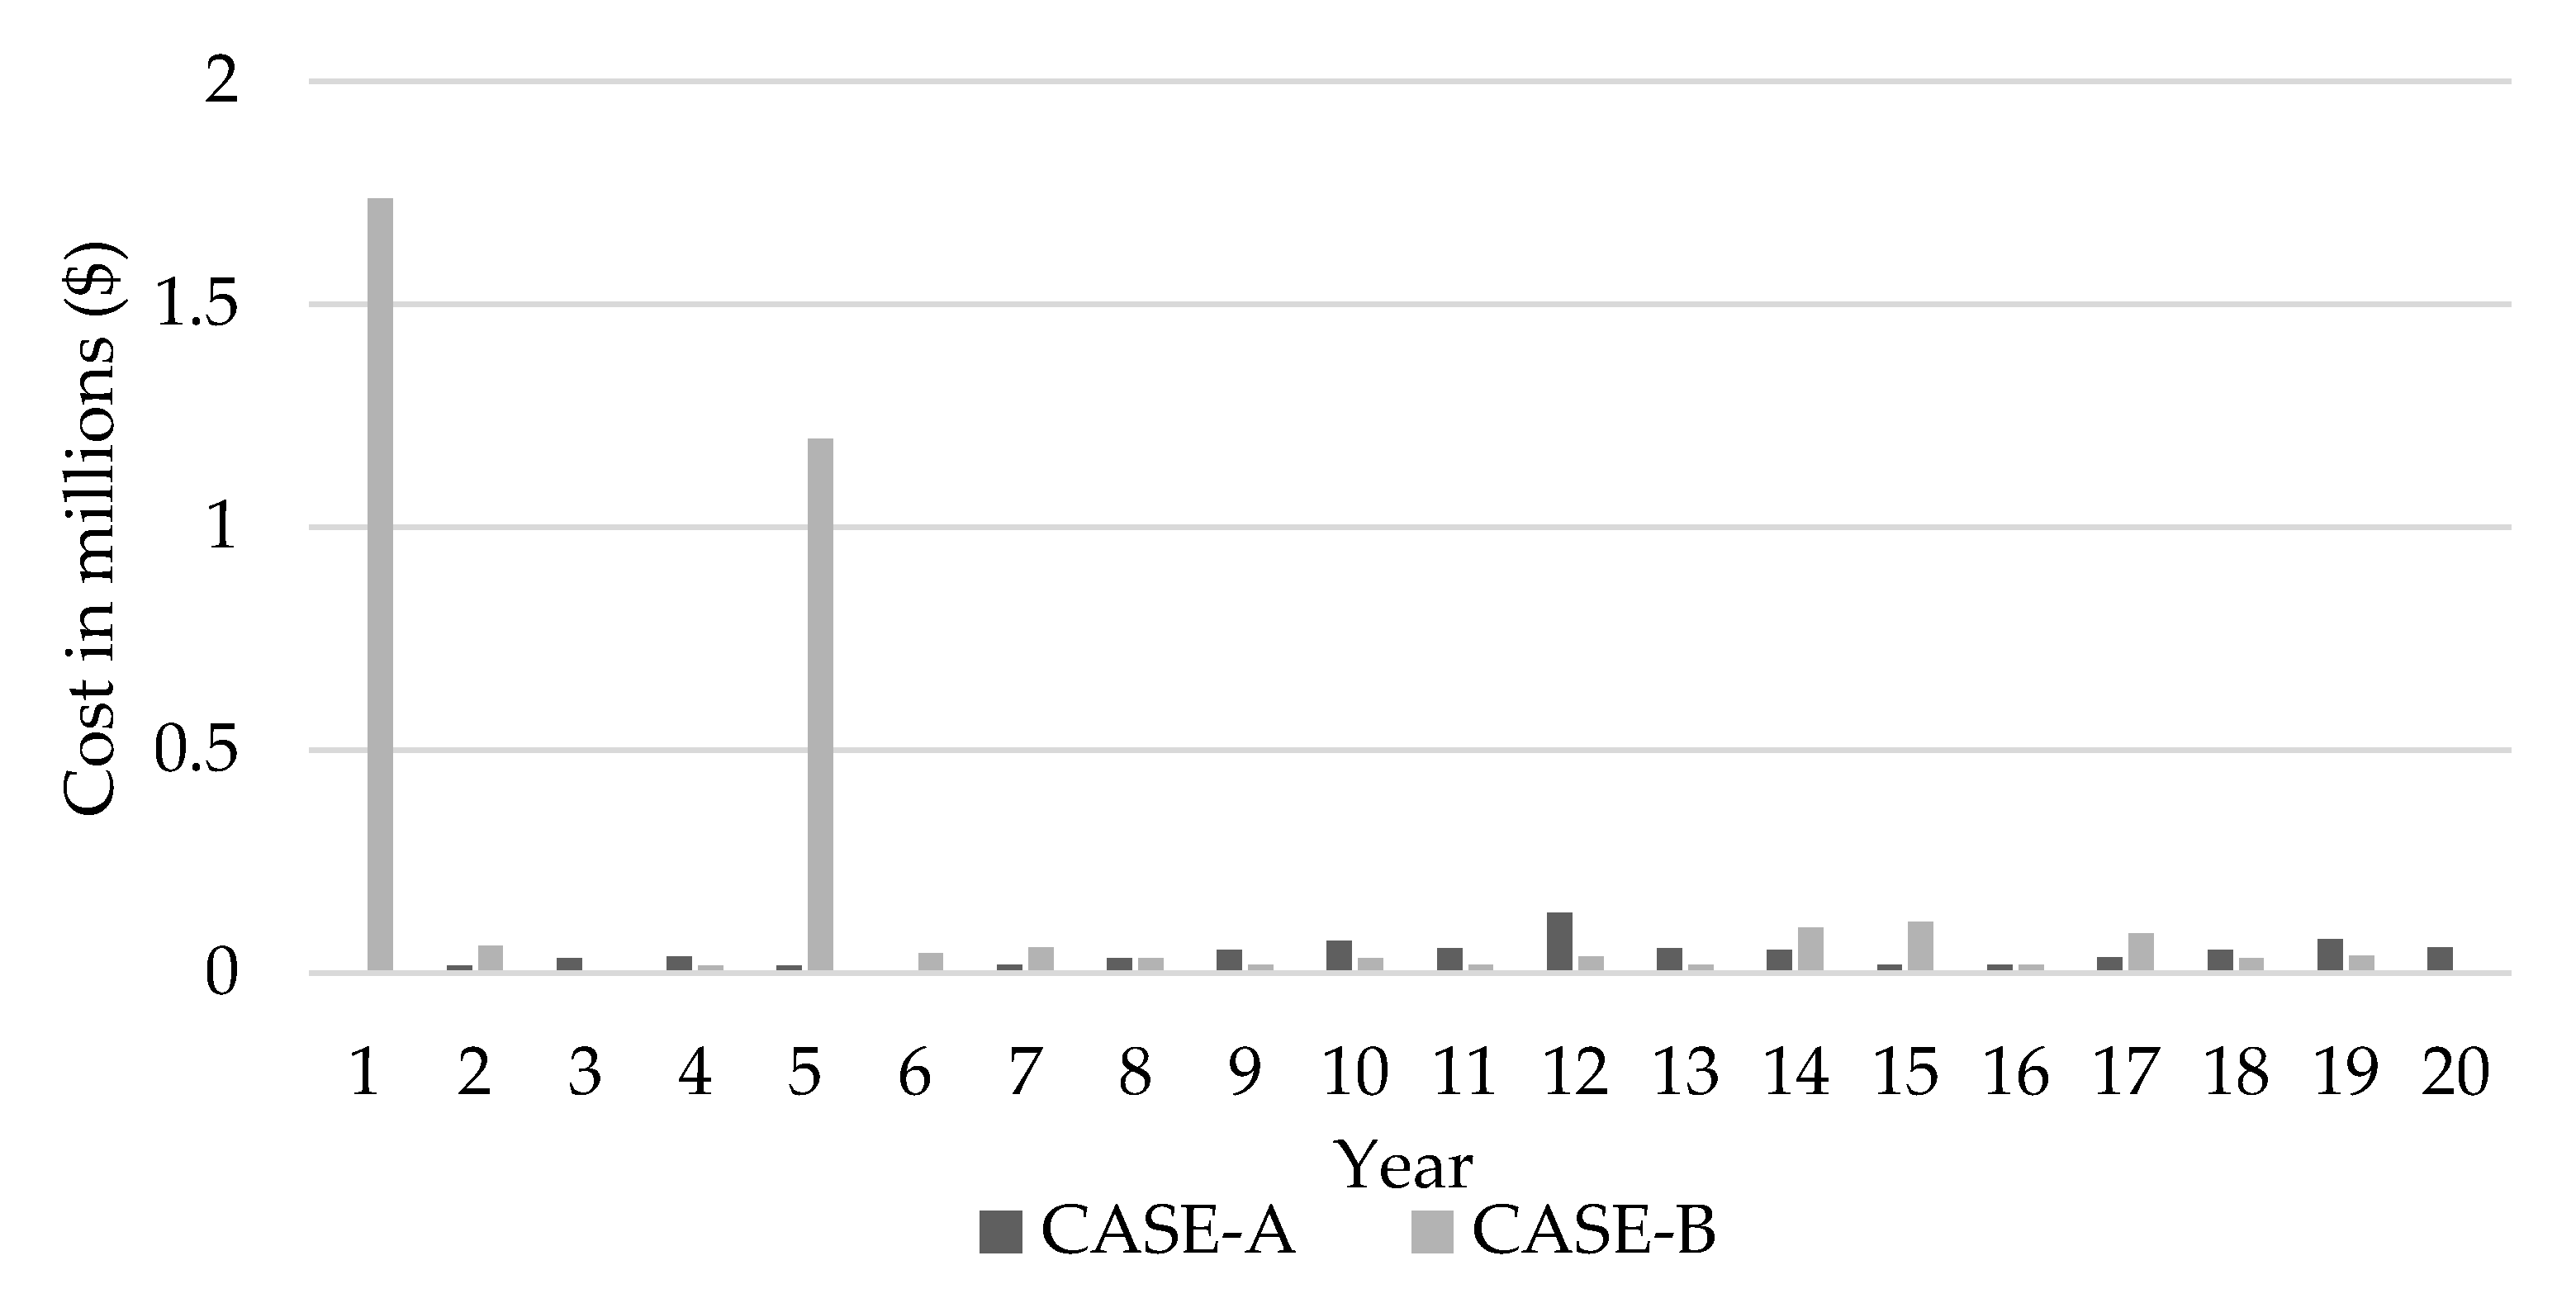
7.5. Cost of Protection System Upgrades
In CASE-A, the NPW for protection upgrades is $0.53M. These upgrades are due to the load growth and are distributed over the 20-year period.
The required protection system upgrades for CASE-B have an NPW of approximately
$3.269M, which is almost six times the required costs for CASE-A. The total cost in CASE-B is composed of
$0.19M for fuse upgrades and
$3.081M for relay and circuit breaker upgrades. These upgrades are required to maintain a functional protection system with DG installations. The initial high cost of protection upgrades shown in
Figure 7 is due to the installation of PVDG on buses 34, 35, and 38. In year 5, the other peak in protection costs is due to the SDG installed on bus 37. Note that the protection upgrades are mainly due to the reverse current.
8. Results Comparison and Discussion
The results shown in
Section 7 mirror the importance of DG integration and planning in power systems. The significant decrease in the total costs can help the utilities to increase their profits and decrease the consumer's cost. The main difference between the proposed approach compared to conventional planning approaches is the consideration of the protection cost in conjunction with the planning problem. In
Section 8.1, we present CASE-C, which is similar to CASE-B in all simulation parameters but without considering the protection system upgrades. Moreover, in
Section 8.2, the same DG planning methodology considering protection in CASE-B is solved using another heuristic technique, namely Particle Swarm Optimization (PSO), for the sake of comparison with the GA performance. The stopping criteria for both methods depend on the stall generation tolerance, as shown in
Table 1, which is the average change in the best fitness functions value. The average change must be less than a set tolerance for 50 consecutive iterations. In this study, the stall generation tolerance is set to 10
−6 for both the GA and the PSO, with such low tolerance that both the GA and PSO are guaranteed to yield a near-optimal solution for the problem.
8.1. Protection Cost Comparison
The DG planning phase for the system under study, without considering the protection costs, is represented as CASE-C.
Table 3 represents the results for CASE-C achieved by the GA. The total cost of the system throughout the 20-year planning horizon is approximately
$85.10M, which is 3.89% less compared to CASE-B. This result may seem better, but it is misleading from an economical perspective. Moreover, the main observation in this comparison is the total capacity, which is close in both cases; however, there are some variations in the DG locations and year of installation. For example, CASE-C optimal solution included the placement of PVDG on buses 36 and 37 in years 10 and 5, respectively, while none are present in CASE-B. It is also noticeable from both cases that PVDG is more profitable over long periods of time as both cases placed a high PVDG capacity in the first year. This is due to the low maintenance and running cost of PVDG units. Other differences are noticed in buses 35 and 37. In bus 35, the SDG units have a very high variance in the installation of 19 years between the two cases, while in bus 37 there is a 10-year gap between the two cases.
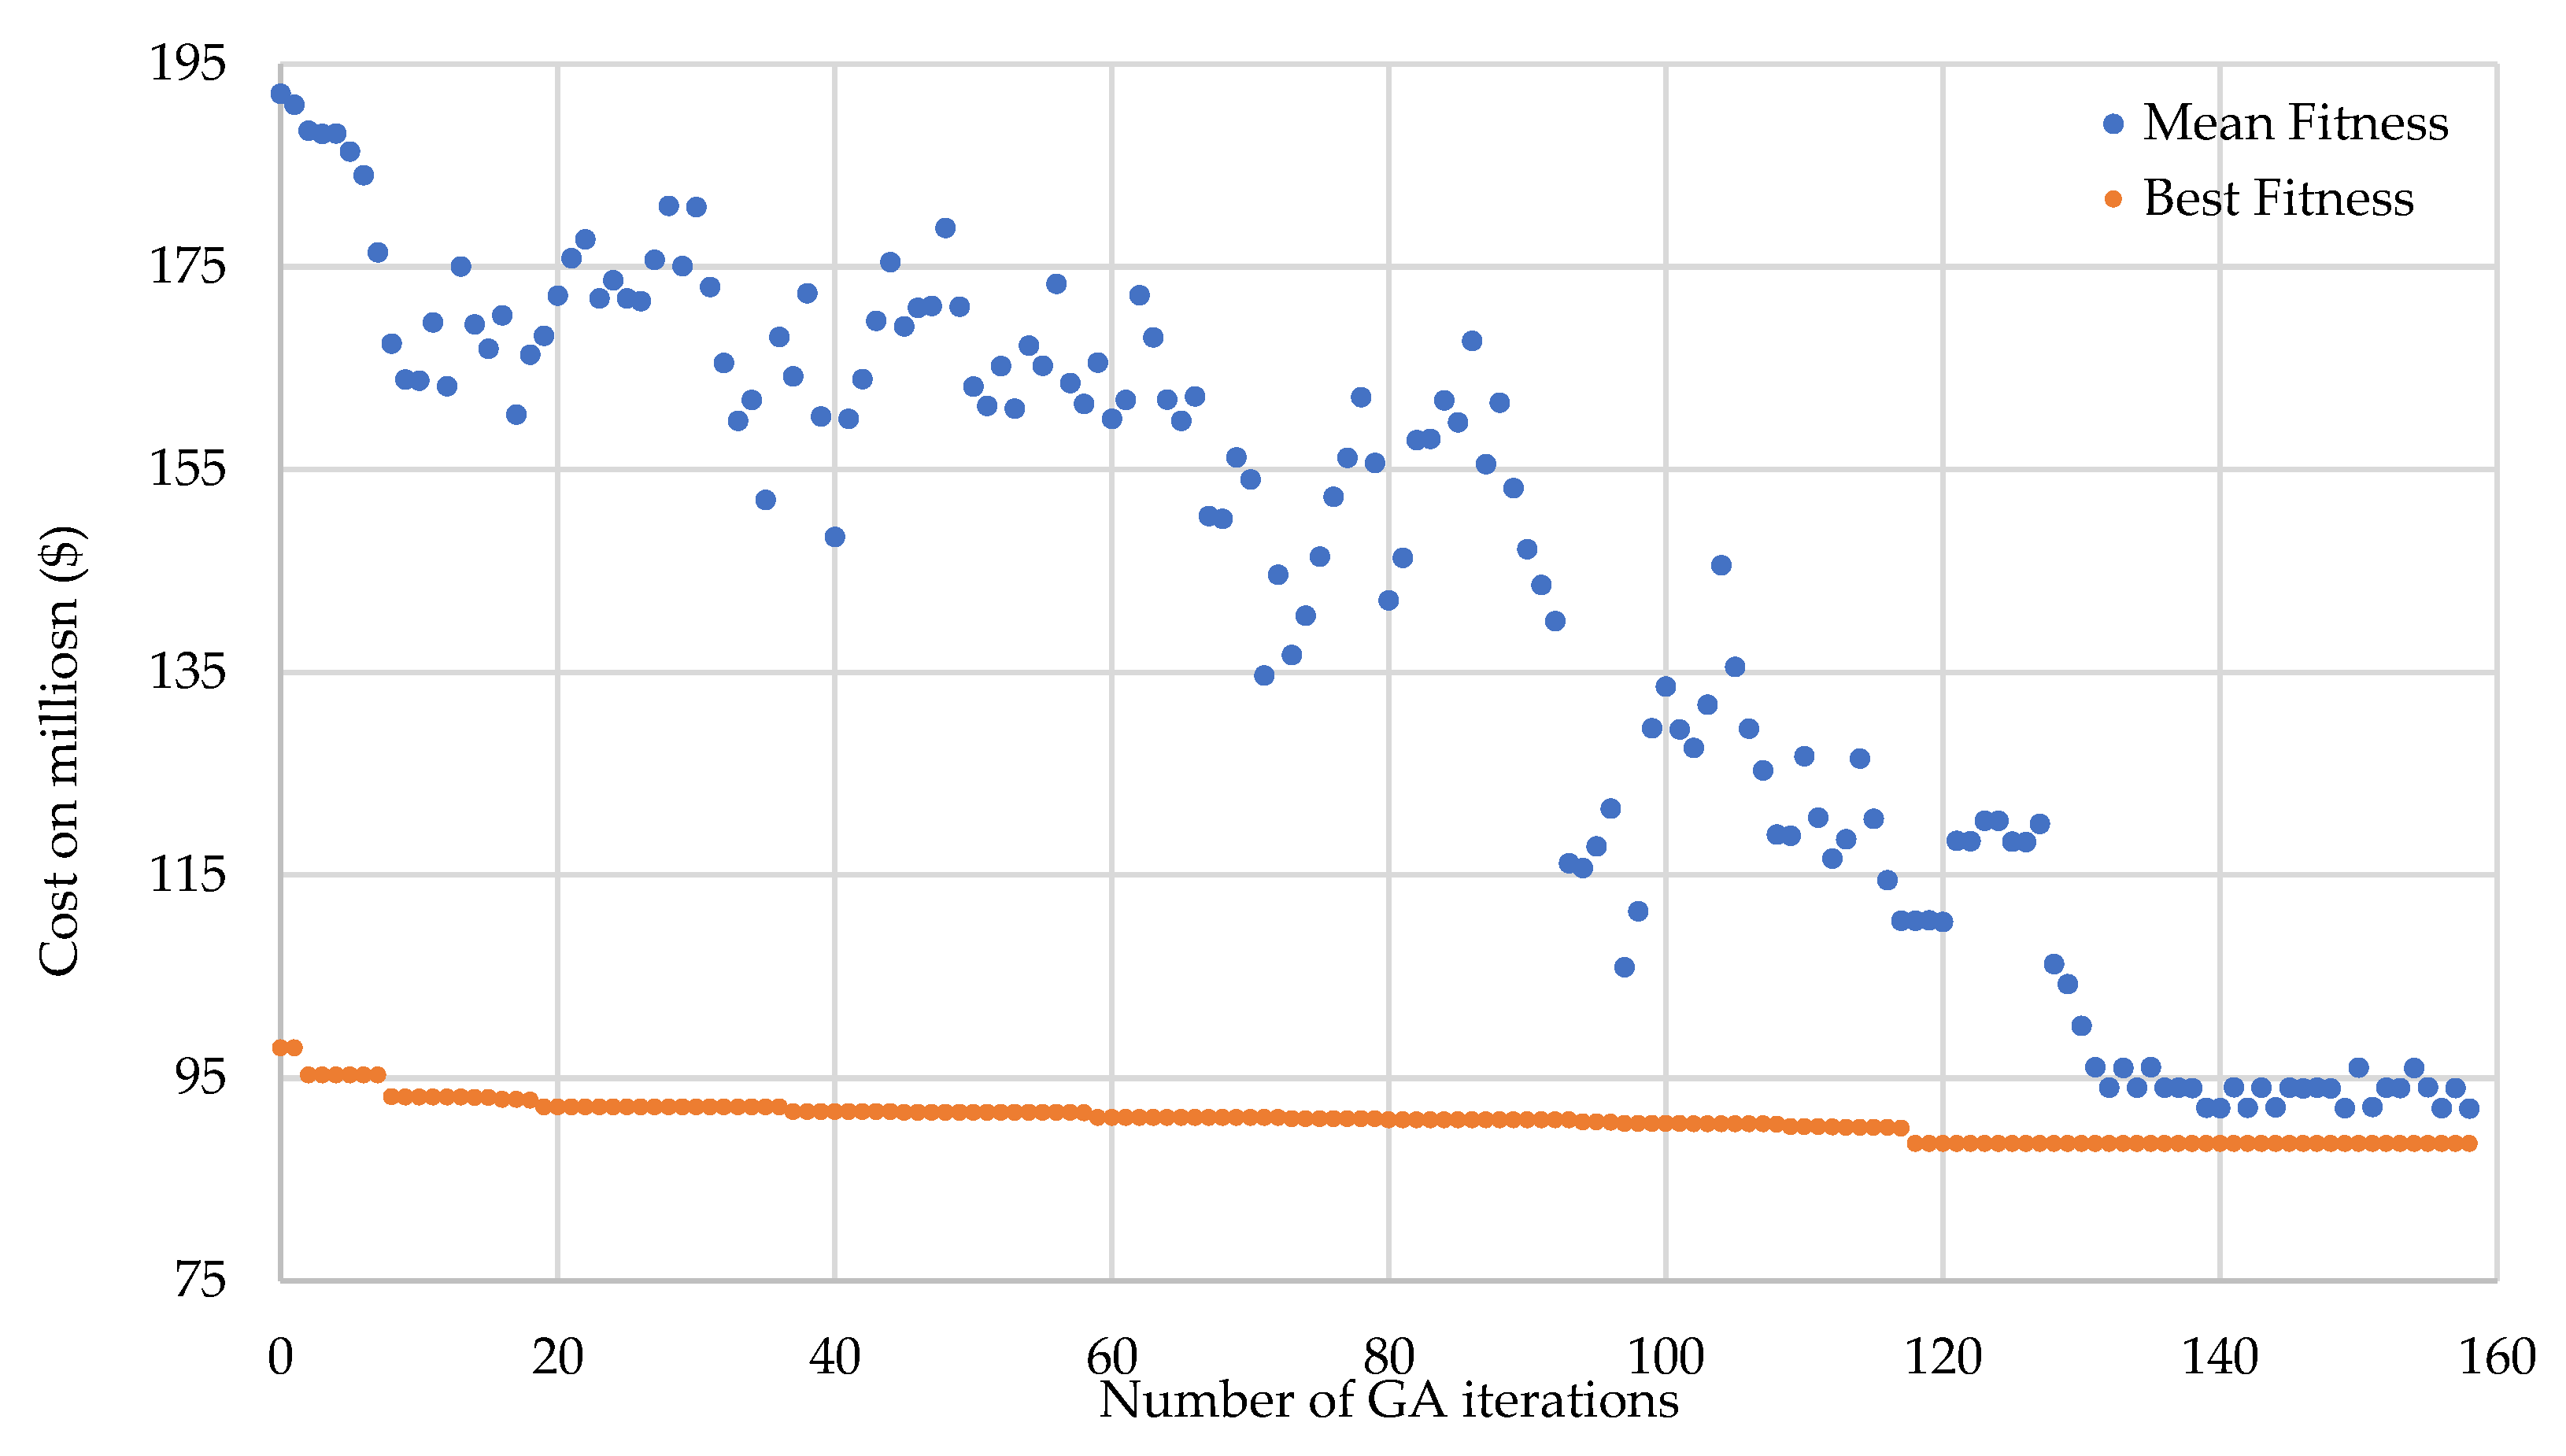
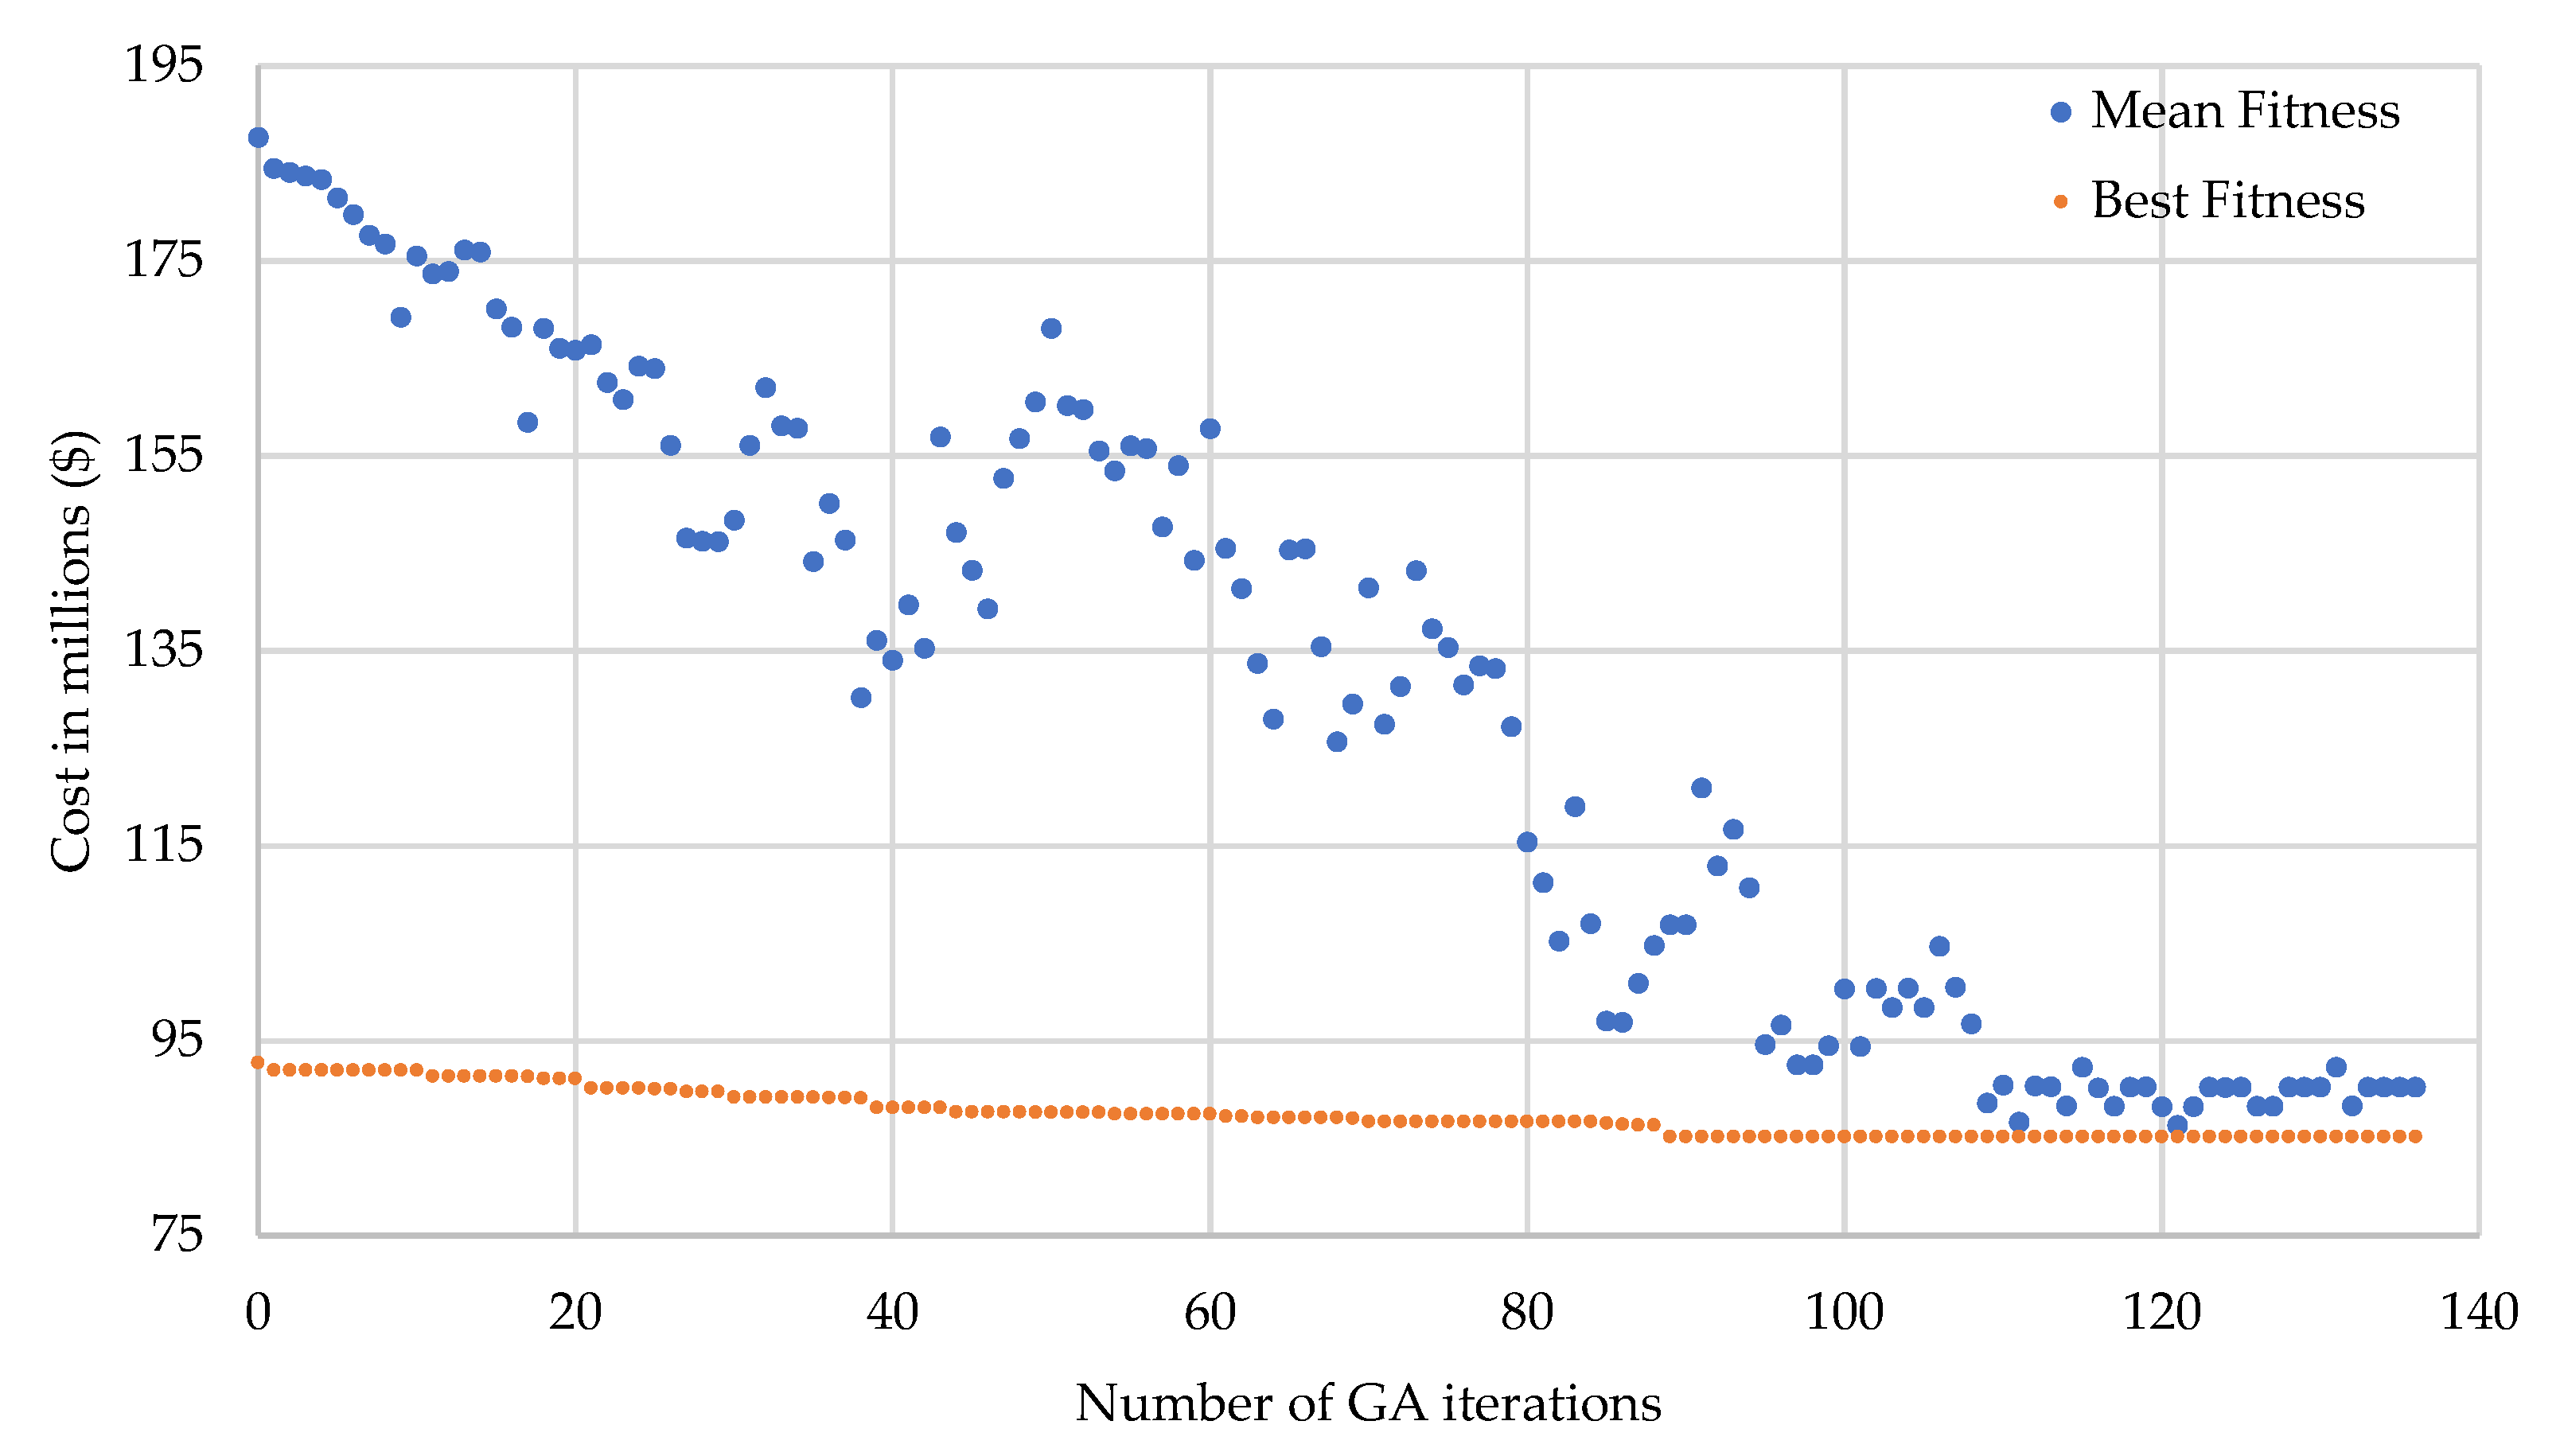
The convergence curves for CASE-B and CASE-C are shown in
Figure 8 and
Figure 9, respectively. The curves represent the mean and the best fitness of each iteration. As seen from the two figures, the GA converged successfully before reaching the maximum number of allowed generations. Both simulations used the same GA parameters shown in
Table 2.
Figure 8 shows that CASE-B needed more iterations to find the optimal solution. This is expected since the protection upgrades add to the complexity of the problem.
8.2. PSO Comparison
In PSO, the position of each particle in a particle swarm corresponds to a possible solution for the planning problem with a specific fitness function. In each iteration, the particles move as a function of their velocity. This movement is affected by three forces [
39]: the inertia, the global best solution, and the particle swarm best fitness. In this work, the particles represent the DG units’ capacities, locations, and year of installation, similar to the GA chromosomes structure in
Section 6.
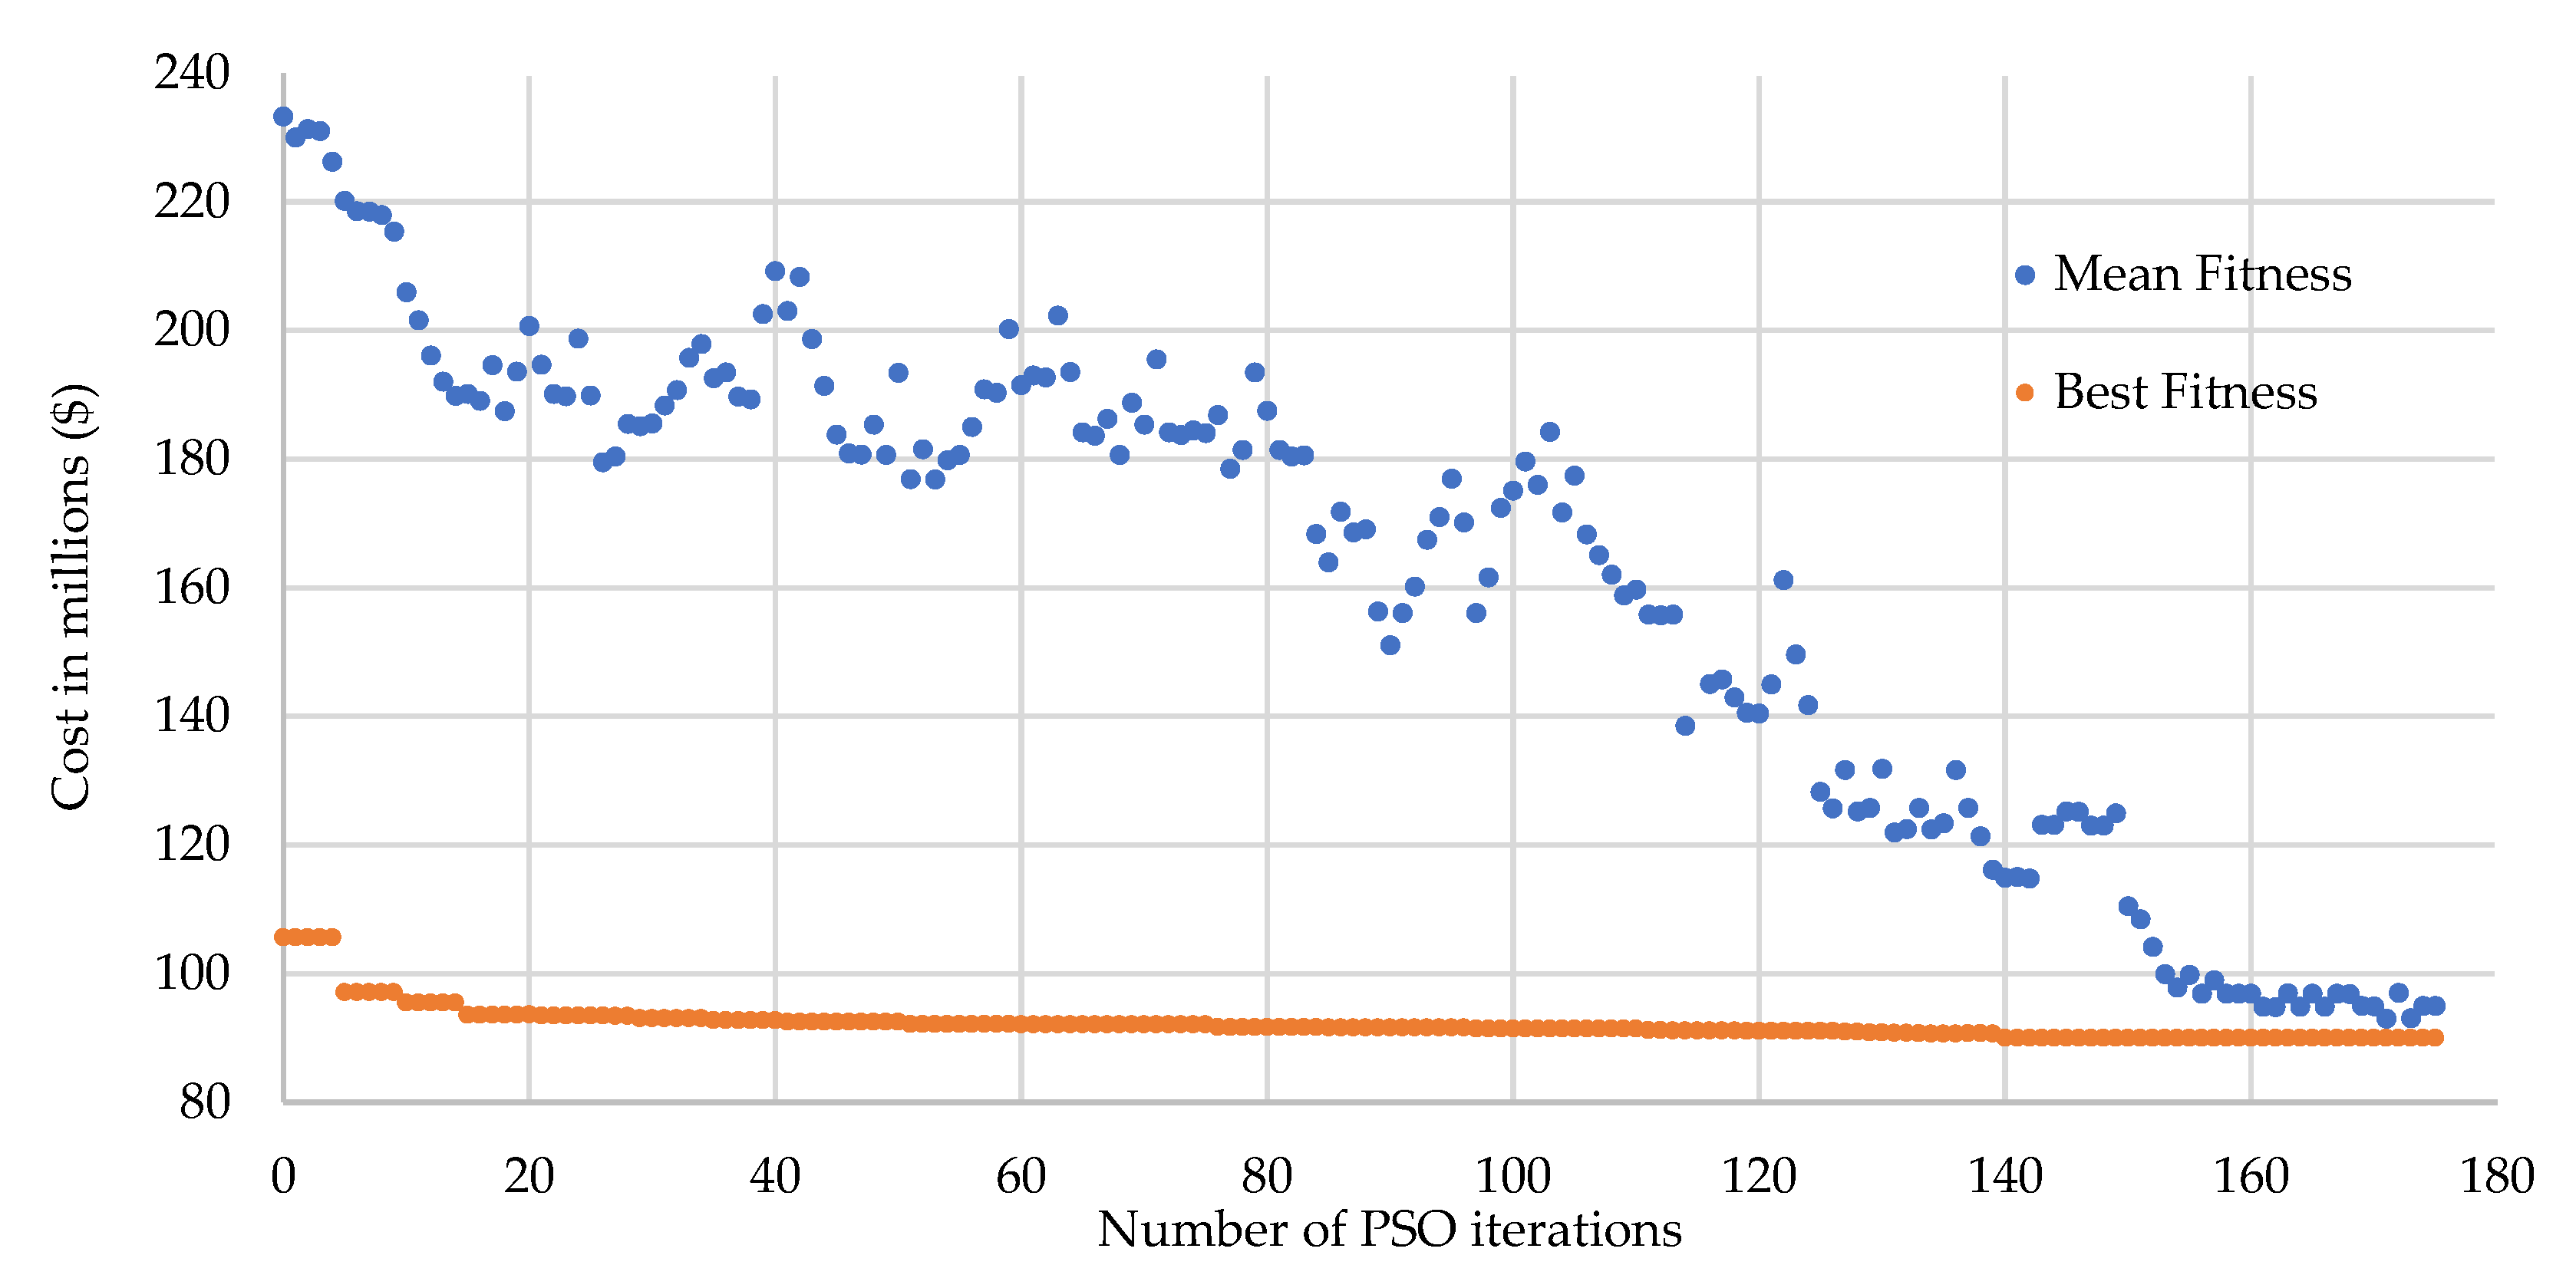
The PSO is applied to CASE-B, where the convergence curve is shown in
Figure 10. The total cost for the best fitness is approximately
$89.99M. Compared to GA, GA yielded a lower system cost by around 1.64%, which is within an acceptable variation from the GA solution. The low difference in the solutions between the two methods is expected. This low difference is solely due to the random nature of such heuristic methods. Using PSO to solve the same problem took more iterations and converged to a slightly higher total cost. A similar comparison between GA and PSO by Kannan’s and others in [
34] for a generation expansion planning problem leads to similar conclusions that GA is slightly more accurate and faster compared to PSO.
9. Conclusions
The proposed approach can help investors and distribution companies find the optimal locations, sizes, and types of DG units in order to minimize overall investment costs and expenses. This study takes into consideration the intermittent nature of renewable generation units, load variability, and energy pricing by considering all possible system states. Moreover, the main contribution of the proposed planning approach is the consideration of the costs associated with protection system upgrades, which cannot be ignored due to the significant impacts of DG units on the protection system operation. Without considering protective equipment upgrades, the allocated DG units can put the system at risk of malfunction. Moreover, the resulting reduction due to DG placement will be misleading. The overall reduction achieved in this case study is 9.93%, whereby the total cost is reduced from $98.3M to $88.537M. However, if the protection system upgrades are ignored, the conveyed reduction is 14.66%, and the costs are reduced from $97.77M to $85.27M.
Finally, the results show that a mix of renewable resources and dispatchable resources presents the optimal case for the system. Renewable resources are characterized by negligible operating costs; thus, they should be installed at the beginning of the study period to maximize their benefits. In contrast, dispatchable DG units have a significant impact on deferring line upgrades and are usually installed over the study period.
All previous work done in this area of study has not included the protection aspect of the DG planning problem. This study focuses on the DG planning problem while taking into consideration its effects on the costs of protection system upgrades.
The reduction in total cost results obtained from the GA in this study is very close to values obtained by other literature using different heuristic methods; the reduction in total cost in previous literature ranges from 8% to 14% for long planning periods. The variables are highly system-dependent, and changing any value may dramatically alter the results. Future work is needed as this study combines two vast areas of research, which are DG planning and power system protection. Future work includes adding wind-based DG units to the optimization problem, adding transformers cost upgrades. More work is needed as this study combines two vast areas of research, which are DG planning and power system protection. Future work includes adding wind-based DG units to the optimization problem, adding transformers cost upgrades, the decrease of PVDG units price, the addition of interruptions cost, allowing DG units to increase their capacity throughout the planning period, adding dispatchable units, and finding the optimal protection system operational time.


