Article

High Impedance Fault Detection and Location in Combined Overhead Line and Underground Cable Distribution Networks Equipped with Data Loggers

1
Young Researchers and Elite Club, Bushehr Branch, Islamic Azad University, Bushehr 7515895496, Iran
2
Clinical and Laboratory Center of Power System & Protection, Engineering Faculty, Persian Gulf University, Bushehr 7516913817, Iran
3
Center for Energy Informatics, University of Southern Denmark, 5230 Odense, Denmark
*
Author to whom correspondence should be addressed.
Energies 2020, 13(9), 2331; https://doi.org/10.3390/en13092331
Submission received: 8 April 2020 / Revised: 27 April 2020 / Accepted: 1 May 2020 / Published: 7 May 2020
(This article belongs to the Special Issue Protection and Communication Techniques in Modern Power Systems)

Abstract

:
Power distribution networks are vulnerable to different faults, which compromise the grid performance and need to be managed effectively. Automatic and accurate fault detection and location are key components of effective fault management. This paper proposes a new framework for fault detection and location for smart distribution networks that are equipped with data loggers. The framework supports networks with mixed overhead lines and underground cables. The proposed framework consists of area detection, faulty section identification, and high impedance fault location. Firstly, the faulty zone and section are detected based on the operation of over-current relays and digital fault recorders. Then, by comparing the recorded traveling times at both ends of lines, which are related to the protection zone, the faulty line is identified. In the last step, the location of the fault is estimated based on discrete wavelet transform. The proposed method is tested on a 20 kV 13 node network, which is composed of overhead lines and underground cables. The method is tested in both balanced and unbalanced configurations. The obtained results confirm the advantages of the proposed method compared with the current state-of-the art.

Graphical Abstract

1. Introduction

Power distribution networks are vulnerable to different faults. This is mainly due to conditions such as a harsh working environment, operating conditions, and system aging. Such faults can compromise the security of electricity supply and the reliability in our cities [1]. Fast automatic fault location is important in the process of power restoration and repair. After faults have been located and isolated, restoration plans are designed to maximize the re-energized loads [2,3].
Methods for automatic fault location in distribution networks can be categorized into two groups: (1) conventional automatic methods and (2) methods based on artificial intelligence [4]. The first is represented by impedance based methods [1,5,6], traveling wave methods [7,8,9], etc. The second is represented by intelligence methods, such as artificial neural networks (ANN) [10], support vector machines (SVM) [11], fuzzy logic [12,13,14], genetic algorithms (GA) [15,16], the matching approach [17], etc. The performance of intelligence methods is highly dependable on the training data [8]. Moreover, any network configuration changes require new data acquisition and update of the algorithm. The traveling wave method has a better performance in multi-branched radial topologies compared with the impedance based method [18].
The current fault location practice in distribution systems consists of network switching, subscriber notification to the dispatching center, use of protective and smart equipment, and deployment of fault indicators on the network and substations. Fault location is challenging for distribution networks because feeders are distributed over wide branched areas composed of several overhead lines and underground cables.
Fault location has been extensively studied, and different methods have been proposed, which can be classified into four main categories according to [19]. One of the main categories is the measurement based methods, which can be classified into three important groups: (1) power frequency signals [1,5,6,20,21,22], (2) high frequency signals [7,8,9,23,24], and (3) artificial intelligence [10,11,12,13,14,15,16,17].
Among shunt faults, high impedance (HI) faults are the most critical. When a high impedance fault occurs, the voltage and current levels in power systems do not increase significantly [7,25]. On the other hand, the HI faults may not be detected by the relay protection. Therefore, different methods have been proposed [1,7,9,25,26,27]. Fault location and parameters can be estimated within the first cycles after fault occurrence [9]. In the traveling wave method, Discrete wavelet transform (DWT) based multi-resolution analysis (MRA) gives better signal representation because its resolution is balanced at any time and frequency [7]. For characterization and extraction of transient signals with DWT transform, db4 has the best performance in the Daubechies family based on its detection and discrimination rates [25]. Furthermore, power line communication (PLC) technology can be utilized for communication and monitoring of lines [26,28].
In this paper, an accurate fault location framework is proposed by using over-current relays and an MRA wavelet transform. Compared with the traveling wave method [8,29], the proposed technique needs only half of the signal cycle to locate the HI fault section position. After the fault data are sampled and processed, the mutual effects of electromagnetic transient signals are decomposed into their modal signals by the alpha-beta ( α β 0 ) transformation. Finally, the arrival time of the traveling waves can be defined using DWT and the d b 4 mother wavelet.
The method supports distribution grids that are equipped with data loggers. The data loggers have the ability to record voltage and current data and relevant harmonic information. Furthermore, they have the event recorder module, which records the voltage and current in one cycle before and after the occurring event time with a step of 400 μ s.
For the evaluation of the proposed method, different types of short-circuit faults with various resistances are simulated in a combined overhead line and underground cable smart distribution network with tapped lines. The proposed method is simulated by DigSILENT and MATLAB in balanced and unbalanced configurations. The results confirm the high efficiency and accuracy of the proposed method.
This paper is structured into five sections. Besides the Introduction section, Section 2 describes the state-of-the-art on traveling wave fault location methods. The proposed extensions are discussed in Section 3. The evaluation of the proposed method and the results are presented in Section 4. Section 5 presents the conclusion of this paper.

2. Fault Location Using Traveling Waves

In this section, the state-of-the-art traveling wave fault location method using vector diagrams (Figure 1) is explained in detail.

Traveling Waves

If a fault occurs in an electrical line (Figure 1A), a disturbance with high frequency creates two traveling waves in both directions (toward Terminals A and B) with different velocities ( ν i ) in the modal signals ( S m ). In order to eliminate the electromagnetic induction interactions between fault signals, sampled signals using only a half signal cycle stored in fault recorders (FRs) should be transformed into a new theoretical signal using Equation (1). Equation (1) represents an alpha-beta transform where the ground mode ( S g ) and the aerial ( S α ) parameters can be used to estimate the location of faults. The traveling wave velocities will be estimated using Equation (2) where L i and C i are line inductance and capacitance, respectively. S a , S b , and S c are fault signals.
S g S α S β = 1 3 1 1 1 2 1 1 0 3 3 × S a S b S c
ν = 1 L i × C i ; i = g o r α
The mathematical transformations are used to extract the features, such as time and location, where information is not easily obtained. One of the advantages of processing fault signals using wavelet transform over other mathematical transformations is its high resolution, which enables the extraction of the frequency and location information (location in time) of the desired signal.
The high frequency components generated by the faults contain useful information for fault location in electrical networks. Signal processing using the wavelet transform technique is one of the strongest tools in this matter. Among the suggested methods in this subject, multi-resolution analysis (MRA) using the d b 4 mother wavelet has good performance in distribution networks with several branches and balanced and unbalanced configurations for high impedance fault location.
According to Figure 2, a discrete wavelet transform consists of a low pass filter ( C A n ) and a high pass filter ( C D n ). DWT transforms the input signal into two low frequency components and high frequency outputs. The low pass filter output is called the approximation component, and the high-pass filter provides the detailed coefficients [31]. Figure 2 shows a generic signal decomposition (Figure 2A) and the frequency bandwidth (Figure 2B) of a discrete wavelet transform.

3. The Proposed Method

Short-circuit faults compromise the network stability and can cause power disruption. The section and location of the short-circuit faults therefore should be determined quickly to speed up the required remedial actions. In this section, a new method is suggested for fault location in hybrid distribution networks, which consists of two main components: protection coordination and faulty section detection. The protection coordination method is suggested for over current relays and devices, which supports fault types and high impedance faults. The faulty section detection uses the traveling wave timestamps and supports the high impedance faults.

3.1. Protection Coordination

A new protection coordination method is presented, which is suitable for all current protection device settings. Moreover, it can detect the faulty section for all fault types. When the fault occurs and its current in OCRs (over current relays) becomes higher than the set current value, the relay sends a trip signal to the circuit breaker to disconnect the faulty section from the network. OCRs have their own operating time, which is determined by international standards, such as the IEC [32]. One of the most important issues in coordinating the protection of OCRs is the design of the protective zones. These zones should protect the network against all faults in each section. In this paper, for each branch, a protection device is considered. An overall schematic of the proposed method is illustrated in Figure 3. It uses an algorithm that includes FLs (fault locators), OCRs, and PLC (power line communication) coordinated in defined protection zones on combined networks (cables and OHL (overhead lines)).
To ensure that the relay protection zones do not overlap, the coordinated time interval ( C T I ) must be determined by Equation (3), where t i and t i , j are the main and backup relays operation times, respectively. Furthermore, we assumed C T I was 0.35.
t i , j t i C T I
Operation times are calculated for the considered OCRs in the defined zones according to Equation (4) ( I f k is the fault current and I p i the setting value of the pickup current) and Table 1. The time dial setting (TDM) used in Equation (4) is 0.5. In all zones, a relay is installed in the bus that represents the beginning of the zone.
t i , j k = α × T D M ( I f k I p i ) β 1
After determining the main relay and the backup relays, the coordination for each pair of the relays is carried out in time and current. The coordination flowcharts are shown in Figure 4 and Figure 5, which are done for OCRs. They consist of two successive steps: current setting and time setting. Firstly, the current setting algorithm shown in Figure 4 is run. In this algorithm, based on the load current and short-circuit fault current, the minimum and maximum currents of each relay are calculated, and accordingly, the set current is determined. It is run to the maximum set current in the user interval and larger than the main set. The setting current is therefore determined for each relay. In the second step, the time setting algorithm shown in Figure 5 should be run. As is shown clearly in Figure 5, at the first iteration, the first relay and the main relay are selected. Then, the three phase short-circuit current is calculated for each main and backup relay. Next, the operating time is calculated for the main relay. Afterward, according to CTI, the operating time of the backup relay is determined. Then, TDSis determined for each backup relay. Next, comparing the calculated TDS with the old TDS, the larger value is selected as the main TDS. If TDS is changed, the calculations should be run; else, these calculations are done for all existing relays. Optimizing the coordination of OCRs means at least a blackout as a result of fault incidence. In the case of tripping each relay, the faulty area will be isolated.

3.2. Faulty Section Detection Using Protection Coordination

After the definition of the protection zones defined by the operation of over-current relays, fault section detection is performed. Section detection is one of the most important issues in fault location. Usually, the difference between the first and the second peaks is used for the faulty section detection [8,29]. However, due to the difference between electrical parameters in cables and overhead lines, they do not work in mixed overhead line and underground cable networks. To solve this, we propose a new method described in Figure 6. The method uses communication systems to send the traveling wave arrival times’ information to FLs, which are located in the main feeders. For section detection (Figure 6), the comparison of the arriving times in feeders is used.
A traveling wave based method that considers two terminals was used in this study in order to locate the high impedance faults. The exact location of the faults (grounded and not grounded) regardless of the disturbance position located in the first or second half of the line can be calculated by Equation (5),
X = 1 2 ( L ν i · Δ t i ) , i = g o r α
where i can be g or α , which are the ground and arrival mode, respectively, and Δ t i are the fault’s section length, the traveling wave velocity, and the traveling wave time difference in fault recorders at both ends of the faulty line, respectively.

4. Results

A 13 node network, which is a combined overhead line and underground cable distribution network, is modeled according to Figure 7. High impedance fault location is performed in the balanced and unbalanced conditions by MATLAB and DigSILENT software. The simulated network contained 12 loads and 12 lines with 9 overhead lines and 3 underground cables of a 20 kV voltage level. Load values and their distribution on both configuration are presented in Table 2. Table 3 shows the overhead and the cable line parameters of the network. The cables are between Nodes 2 and 3, 6 and 7, and 11 and 12, and the others are OHLs.
Figure 8 shows the three-phase transient voltage waveforms during a single-phase-to-ground short-circuit fault (BG) between Nodes 2 and 3 with 85 Ω resistances and 11.58 km away from Node 2. The voltage waveforms in Figure 8a–d are recorded at Nodes 2, 3, 4, and 5, respectively.

4.1. Simulation

The simulation results included zone detection, section identification, and HI fault location based on the two terminals’ information. The results are presented in Section 4.1.1, Section 4.1.2 and Section 4.1.3, respectively. The faults conditions in Table 4 and Table 5 are the same as those described in Table 6.

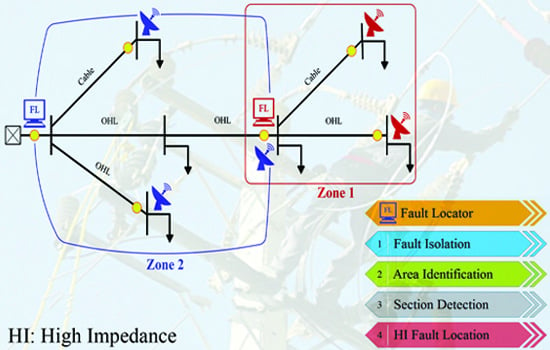
4.1.1. Zone Detection

It was possible to identify and recognize the fault area, by implementing the proposed protection plan (Section 3.1). Protection coordination of over current relays was done to isolate all types of short-circuit faults up to 100 Ω from the network (isolation performance for all relays).
The test network had 12 lines with different lengths, which included seven different paths. Conservation coordination for all lines (OHLs and cables) was implemented seamlessly. Table 4 shows the performance of the proposed coordination method for fault clearance and zone detection in balanced mode.
In the case of a fault, the relay responsible for the protection zone will isolate the faulty zone from other sectors in order to avoid the spreading of the disturbance and the collapse of the network.

4.1.2. Section Diagnosis

After the fault zone was identified by the operation of OCRs, the faulty line could be determined using the traveling wave timestamps inside the selected area. In this study, traveling times were extracted using DWT and the d b 4 mother wavelet in 10 levels. For this purpose, S g and S α were used for grounded and ungrounded faults, respectively. Table 5 shows the section diagnosis simulation results.

4.1.3. Fault Location

Fault location results are presented in this section considering balanced and unbalanced configurations. Estimated fault location simulation outcomes were tested in different conditions, and the results are shown in Table 6 for underground cables and overhead lines. As mentioned, these results were obtained for a distribution network (Figure 7) using two terminals’ information. It should be noted that high impedance faults occurred in full load conditions.

4.2. Discussions

In [27], the magnetic field sensors with a 3 km distance from each other were used for HI fault location in an overhead line distribution network. This method is not suitable for wide networks, especially with long-distance underground cables. The accuracy of the proposed method in [1] decreased as fault resistance increased. To use the continuous wavelet transform for analyzing fault signals in [8], high frequency sampling equipment (e.g., 1 GHz) is required. In addition, to have the same reference time for measurement units in [8,27], synchronization by a global positioning system (GPS) is required. The method that was presented in this paper improved the state-of-the-art as it did not have the weaknesses mentioned in [1,8,27]. According to the results in Table 7, it was also more accurate.
The works in [1,8,27] were only tested in OHL distribution power network (DPN) using voltage and current and voltage and magnetic field measurement (see Table 7) with a 1.5–2.8% error. However, in this paper, in addition to checking the validity of the proposed method in a combined overhead line and underground cable distribution network, the maximum error was −0.49%.
The high impedance fault usually presents a small fault current, which is not sufficient to trip the protection of the relay. However, in this work, the distribution zones were set by setting the sensitive relays or high impedance fault detection relays. The distribution network had data loggers on the nodes. The most common faults were unsymmetrical faults such as single phase fault to ground, double phase fault, and double phase fault to ground. The high impedance faults could be detected by sensitive EFrelays or high impedance fault detection relays. When the high impedance fault occurred, the mentioned relays detected the high impedance fault, and consequently, the faulty zone was determined. Based on the recorded time in the relays, the voltages of data loggers were extracted and converted, and WT was run and the transient times extracted. The one that had an earlier registration time determined the faulty section. Then, based on these times and the wave velocity, the fault distance was calculated. For this method, sensitive earth-fault relays were appropriate.

5. Conclusions

The purpose of the paper was to minimize outage in distribution networks. This study showed that the presented method was practical for area detection, faulty section identification, and high impedance short-circuit fault location in combined networks. The proposed method was tested on a 20 kV combined distribution network with 13 nodes in balanced and unbalanced conditions. The results confirmed that the proposed method was highly accurate in detecting faulty zones, sections, and location in a variety of OHLs, cables, and combined lines in different parts of the distribution networks. Comparing the proposed method with previous studies showed that the accuracy of the proposed method was higher, and more importantly, it was suitable for use in practical conditions. What distinguished this method from others was its ability to handle challenges such as unbalanced loads, combined lines, and HI faults. The accuracy of the proposed method in simulation was high, if all the data of relays and data loggers were provided and the communication service and GPS tags were available. However, some technical problems require further investigations in future work such as the effect of DGs, changing the network structure, and changing the system protection scheme by renewable energy resources, blinding, and false tripping in combined networks.

Author Contributions

Conceptualization, S.K. and R.D.; Data curation, S.K. and R.D.; Formal analysis, S.K.; Funding acquisition, H.R.S.; Methodology, S.K. and R.D.; Resources, R.D.; Supervision, R.D., H.R.S. and A.S.; Validation, S.K., H.R.S. and A.S.; Writing—original draft, S.K. and R.D.; Writing—review and editing, H.R.S. and A.S. All authors have read and agreed to the published version of the manuscript.

Funding

This research received no external funding.

Conflicts of Interest

The authors declare no conflict of interest.

References

  1. Gabr, M.A.; Ibrahim, D.K.; Ahmed, E.S.; Gilany, M.I. A new impedance based fault location scheme for overhead unbalanced radial distribution networks. Electr. Power Syst. Res. 2017, 142, 153–162. [Google Scholar] [CrossRef]
  2. Monadi, M.; Zamani, M.A.; Koch-Ciobotaru, C.; Candela, J.I.; Rodriguez, P. A communication-assisted protection scheme for direct-current distribution networks. Energy 2016, 109, 578–591. [Google Scholar] [CrossRef]
  3. Zidan, A.; El-Saadany, E. Incorporating customers’ reliability requirements and interruption characteristics in service restoration plans for distribution systems. Energy 2015, 87, 192–200. [Google Scholar] [CrossRef]
  4. Gururajapathy, S.; Mokhlis, H.; Illias, H. Fault location and detection techniques in power distribution systems with distributed generation: A review. Renew. Sustain. Energy Rev. 2017, 74, 949–958. [Google Scholar] [CrossRef]
  5. Daisy, M.; Dashti, R. Single phase fault location in electrical distribution feeder using hybrid method. Energy 2016, 103, 356–368. [Google Scholar] [CrossRef]
  6. Dashti, R.; Sadeh, J. Accuracy improvement of impedance based fault location method for power distribution network using distributed-parameter line model. Int. Trans. Electr. Energy Syst. 2014, 24, 318–334. [Google Scholar] [CrossRef]
  7. Bakar, A.; Ali, M.; Tan, C.; Mokhlis, H.; Arof, H.; Illias, H. High impedance fault location in 11 kV underground distribution systems using wavelet transforms. Int. J. Electr. Power Energy Syst. 2014, 55, 723–730. [Google Scholar] [CrossRef]
  8. Goudarzi, M.; Vahidi, B.; Naghizadeh, R.; Hosseinian, S. Improved fault location algorithm for radial distribution systems with discrete and continuous wavelet analysis. Int. J. Electr. Power Energy Syst. 2015, 67, 423–430. [Google Scholar] [CrossRef]
  9. Iurinic, L.U.; Herrera-Orozco, A.R.; Ferraz, R.G.; Bretas, A.S. Distribution Systems High-Impedance Fault Location: A Parameter Estimation Approach. IEEE Trans. Power Deliv. 2016, 31, 1806–1814. [Google Scholar] [CrossRef]
  10. Aslan, Y.; Yağan, Y.E. Artificial neural-network based fault location for power distribution lines using the frequency spectra of fault data. Electr. Eng. 2017, 99, 301–311. [Google Scholar] [CrossRef]
  11. Gururajapathy, S.S.; Mokhlis, H.; Illias, H.A.B.; Awalin, L.J. Support vector classification and regression for fault location in distribution system using voltage sag profile. IEEJ Trans. Electr. Electron. Eng. 2017, 12, 519–526. [Google Scholar] [CrossRef]
  12. Rafinia, A.; Moshtagh, J. A new approach to fault location in three-phase underground distribution system using combination of wavelet analysis with ANN and FLS. Int. J. Electr. Power Energy Syst. 2014, 55, 261–274. [Google Scholar] [CrossRef]
  13. Hossam-Eldin, A.; Lotfy, A.; Elgamal, M.; Ebeed, M. Combined traveling wave and fuzzy logic based fault location in multi-terminal HVDC systems. In Proceedings of the 2016 IEEE 16th International Conference on Environment and Electrical Engineering (EEEIC), Florence, Italy, 7–10 June 2016; pp. 1–6. [Google Scholar]
  14. Adhikari, S.; Sinha, N.; Dorendrajit, T. Fuzzy logic based on-line fault detection and classification in transmission line. SpringerPlus 2016, 5, 1–14. [Google Scholar] [CrossRef] [PubMed] [Green Version]
  15. Bedekar, P.P.; Bhide, S.R.; Kale, V.S. Fault section estimation in power system using Hebb’s rule and continuous genetic algorithm. Int. J. Electr. Power Energy Syst. 2011, 33, 457–465. [Google Scholar] [CrossRef]
  16. Jin, Q.; Ju, R. Fault location for distribution network based on genetic algorithm and stage treatment. In Proceedings of the 2012 Spring Congress on Engineering and Technology (S-CET), Xi’an, China, 27–30 May 2012; pp. 1–4. [Google Scholar]
  17. Mokhlis, H.; Li, H. Fault location estimation for distribution system using simulated voltage sags data. In Proceedings of the 42nd International Universities Power Engineering Conference, Brighton, UK, 4–6 September 2007; pp. 242–247. [Google Scholar]
  18. Borghetti, A.; Bosetti, M.; Di Silvestro, M.; Nucci, C.A.; Paolone, M. Continuous-wavelet transform for fault location in distribution power networks: Definition of mother wavelets inferred from fault originated transients. IEEE Trans. Power Syst. 2008, 23, 380–388. [Google Scholar] [CrossRef]
  19. Bahmanyar, A.; Jamali, S.; Estebsari, A.; Bompard, E. A comparison framework for distribution system outage and fault location methods. Electr. Power Syst. Res. 2017, 145, 19–34. [Google Scholar] [CrossRef]
  20. Dashti, R.; Ghasemi, M.; Daisy, M. Fault Location in Power Distribution Network with Presence of Distributed Generation Resources Using Impedance Based Method and Applying π Line Model. Energy 2018. [Google Scholar] [CrossRef]
  21. de Aguiar, R.A.; Dalcastagnê, A.L.; Zürn, H.H.; Seara, R. Impedance based fault location methods: Sensitivity analysis and performance improvement. Electr. Power Syst. Res. 2018, 155, 236–245. [Google Scholar] [CrossRef]
  22. Dashti, R.; Daisy, M.; Shaker, H.R.; Tahavori, M. Impedance-Based Fault Location Method for Four-Wire Power Distribution Networks. IEEE Access 2018, 6, 1342–1349. [Google Scholar] [CrossRef]
  23. Benato, R.; Sessa, S.D.; Poli, M.; Quaciari, C.; Rinzo, G. An On-Line Travelling Wave Fault Location Method for Unearthed-Operated High Voltage Overhead Line Grids. IEEE Trans. Power Deliv. 2018. [Google Scholar] [CrossRef]
  24. Lopes, F.V.; Dantas, K.M.; Silva, K.M.; Costa, F.B. Accurate two-terminal transmission line fault location using traveling waves. IEEE Trans. Power Deliv. 2018, 33, 873–880. [Google Scholar] [CrossRef]
  25. Chen, J.; Phung, T.; Blackburn, T.; Ambikairajah, E.; Zhang, D. Detection of high impedance faults using current transformers for sensing and identification based on features extracted using wavelet transform. IET Gener. Transm. Distrib. 2016, 10, 2990–2998. [Google Scholar] [CrossRef]
  26. Milioudis, A.N.; Andreou, G.T.; Labridis, D.P. Detection and location of high impedance faults in multiconductor overhead distribution lines using power line communication devices. IEEE Trans. Smart Grid 2015, 6, 894–902. [Google Scholar] [CrossRef]
  27. Bahador, N.; Namdari, F.; Matinfar, H.R. Tree-related high impedance fault location using phase shift measurement of high frequency magnetic field. Int. J. Electr. Power Energy Syst. 2018, 100, 531–539. [Google Scholar] [CrossRef]
  28. Madeti, S.R.; Singh, S. Online fault detection and the economic analysis of grid-connected photovoltaic systems. Energy 2017, 134, 121–135. [Google Scholar] [CrossRef]
  29. Sadeh, J.; Bakhshizadeh, E.; Kazemzadeh, R. A new fault location algorithm for radial distribution systems using modal analysis. Int. J. Electr. Power Energy Syst. 2013, 45, 271–278. [Google Scholar] [CrossRef]
  30. Saha, M.M.; Izykowski, J.J.; Rosolowski, E. Fault Location on Power Networks; Springer Science & Business Media: Berlin, Germany, 2009. [Google Scholar]
  31. Burrus, C.S.; Gopinath, R.A.; Guo, H. Introduction to Wavelets and Wavelet Transforms: A Primer; Prentice-Hall, Inc.: Upper Saddle River, NJ, USA, 1997. [Google Scholar]
  32. IEC. Measuring Relays and Protection Equipment—Part 151: Functional Requirements for over/under Current Protection; IEC 60255-151; IEC: Geneva, Switzerland, 2009. [Google Scholar]
Figure 1. Lattice diagram [30]. (a) Traveling wave (TW) behavior. (b) Defined TW times in Terminal A.
Energies 13 02331 g001
Figure 2. Structure of the discrete wavelet transform. (a) A generic signal decomposition. (b) The frequency bandwidth.
Energies 13 02331 g002
Figure 3. Overall schematic of the fault location method. FL, fault locator; OHL, overhead line.
Energies 13 02331 g003
Figure 4. Current relay coordination.
Energies 13 02331 g004
Figure 5. Timing relay coordination.
Energies 13 02331 g005
Figure 6. Section diagnosis algorithm. FR, fault recorder.
Energies 13 02331 g006
Figure 7. The combined overhead line and underground cable distribution case study.
Energies 13 02331 g007
Figure 8. Single phase to ground (BG) fault with 85 Ω placed between Nodes 2 and 3 in the balanced configuration. (a) Three phase fault voltages recorded from Node 2. (b) Three phase fault voltages recorded from Node 3. (c) Three phase fault voltages recorded from Node 4. (d) Three phase fault voltages recorded from Node 5.
Energies 13 02331 g008
Table 1. Constants for the IEC relay [32].
Curve Type α β
I0.140.02
V.I13.501.00
E.I80.002.00
L.I120.001.00
Table 2. Load values and distribution.
Node Balanced
Phase 1 Phase 2 Phase 3
P (MW)Q (MW)P (MW)Q (MW)P (MW)Q (MW)
2:130.6250.8330.6250.8330.6250.833
Node Unbalanced
Phase 1 Phase 2 Phase 3
P (MW)Q (MW)P (MW)Q (MW)P (MW)Q (MW)
20.3550.3220.2500.5330.4280.433
30.1250.1220.3000.4330.5650.666
40.4120.3220.4500.5330.3380.133
50.6340.8220.4500.2330.1450.633
60.6500.8330.4590.5330.5450.633
70.6120.5220.2700.3330.6230.811
80.1230.3220.4300.8330.5480.233
90.4550.6220.5550.4330.5780.833
100.3550.3220.3500.8330.4280.433
110.3680.7220.6200.1330.4280.433
120.6120.5220.3400.8330.4280.433
130.3550.3220.2500.5330.4280.433
Table 3. The overhead and cable line parameters.
ParameterOHLCableUnits
  R10.271520.07 Ω /km
  R00.414630.27 Ω /km
  L10.0011721 3.1831 × 10 4 H/km
  L00.00532070.0012H/km
  C1 1.1520 × 10 8 0.41 × 10 6 F/km
  C0 3.6612 × 10 9 0.43 × 10 6 F/km
Table 4. Faulty zone detection. OCR, over current relay.
OCRs’ Operation Times (s)
Fault PlaceR1R2R3R4R5Operated Relay
  2–30.942     0.7930.803  -   -R2
  11–121.018     2.1850.8311.477   0.345R5
  6–80.918     0.7700.253  -   -R3
  9–100.680     2.5920.850  0.522   -R4
  1–90.704     2.1270.818  -   -R1
Table 5. Section detection.
Fault ZoneArriving Times ( μ s) Defined Fault Section
R2Node23452–3
The first peak32.8532.5932.9733.00
R5Node11121311–12
The first peak32.6232.6132.75
R3Node6786–8
The first peak32.6032.7132.625
R4Node910119–10
The first peak32.6332.6032.72
R1Node1291–9
The first peak32.6532.7632.62
Table 6. Fault location results.
Fault TypeFault SectionActual FL (km)Calculated FL (km)FRError (km)Error (%)
Balanced Network
BG2–311.5811.72385−0.143−0.116
ABCG11–124.64.22950.380.309
AG6–81.61.86765−0.267−0.218
ABC9–107.37.89945−0.599−0.487
BCG1–99.59.89955−0.399−0.324
Unbalanced Network
AG1–92.252.4210−0.17−0.138
ABCG11–1344.31350−0.101−0.254
AG2–676.734250.2660.216
ABG5–73.53.375350.1250.101
CG6–85.55.725−0.22−0.178
FL: fault location. FR: fault resistance.
Table 7. Comparison of the previous studies with the proposed method.
MethodsStudies NetworkMeasurementMax. Error (%)
Measurement of High Frequency Magnetic Field [27]OHL 1 DPN 2Magnetic Field1.5%
Non-Iterative Impedance Based Method [1]OHL DPNVoltage and Current2.5%
Discrete and Continuous Wavelet Analysis [8]OHL DPNVoltage2.8%
Proposed MethodCDPN 3Voltage−0.49%
1 Overhead line. 2 Distribution power network. 3 Combined overhead line and underground cable power distribution network.

