Article

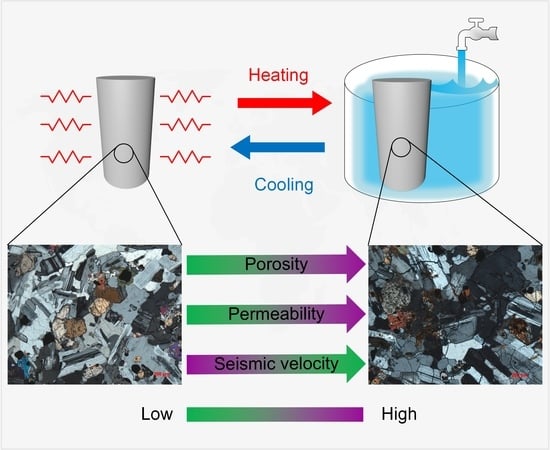
Effects of Cyclic Heating and Water Cooling on the Physical Characteristics of Granite

1
State Key Lab of Oil and Gas Reservoir Geology and Exploitation, Southwest Petroleum University, Chengdu 610500, China
2
Key Laboratory Deep Underground Science and Engineering (Ministry of Education), Sichuan University, Chengdu 610065, China
3
Department of Civil & Environmental Engineering, Rowan University, Glassboro, NJ 08028, USA
*
Author to whom correspondence should be addressed.
Energies 2020, 13(9), 2136; https://doi.org/10.3390/en13092136
Submission received: 21 January 2020 / Revised: 26 April 2020 / Accepted: 27 April 2020 / Published: 29 April 2020
(This article belongs to the Special Issue Geothermal Energy Utilization and Technologies 2020)

Abstract

:
This paper aims to study the effect of cyclic heating and flowing-water cooling conditions on the physical properties of granite. Ultrasonic tests, gas measured porosity, permeability, and microscope observations were conducted on granite after thermal treatment. The results showed that the velocity of P- and S-waves decreased as the number of thermal cycles increased. The porosity increased with the number of the thermal cycles attained at 600 °C, while no apparent changes were observed at 200 and 400 °C. The permeability increased with the increasing number of thermal cycles. Furthermore, microscope observations showed that degradation of the granite after thermal treatment was attributed to a large network of microcracks induced by thermal stress. As the number of thermal cycles increased, the number of transgranular microcracks gradually increased, as well as their length and width. The quantification of microcracks from cast thin section (CTS) images supported the visual observation.

Graphical Abstract

1. Introduction

Geothermal energy is an important component of renewable energy, and most of the deep geothermal resource is stored in hot dry rock (HDR) [1]. HDR is defined as a hot and almost waterless geothermal system. Common HDR systems include granite or other crystalline basement rocks. Rock temperature varies from 150 to 500 °C at maximum depths of 5–6 km [2,3]. The use of deep HDR resources will contribute to the mitigation of the environmental pollution caused by traditional fossil energy [4]. Enhanced geothermal system (EGS) is an effective engineering method to exploit HDR resources [5,6]. To enhance the permeability of HDR, typical methods include increasing the heat transfer area and improving the efficiency of the hydraulic fracturing system. During the creation of the fracture network and the subsequent thermal energy exploitation, water is injected into the bedrock [7]. Studying the variation of rock physical properties after cyclic thermal treatment with flowing water cooling can provide a theoretical foundation for the EGS system.
A number of previous studies have conducted experiments to investigate the evolution of the physical and mechanical properties of the bedrock under temperature variations. Typical factors to consider include the heating temperature, heating rate, and cooling condition. With increasing temperature, rock experiences more significant deterioration. Hydraulic properties, such as porosity [8,9] and permeability [10,11], increase with a rise of the temperature, whereas mechanical properties, such as the P-wave velocity [11,12], unconfined compressive strength [7,12,13,14,15], tensile strength [11,16,17,18], and Young’s modulus [9], decrease with increasing temperature [19]. The different types of microcracking also have been studied using 2D and 3D observations [20,21,22,23]. For example, thermal damage in Beishan granite subjected to high temperature treatment (from 100 to 800 °C at different heating rates, ranging from 1 to 15 °C/min) was studied in order to assess thermal effects on physical and mechanical properties. Results of acoustic emission (AE) monitoring, mechanical and physical properties measurements all indicated that heating rates had a significant impact on thermal damage. 5 °C/min was recognized as the critical heating rate for standard samples. Thermal stress induced by temperature gradients plays an important role in governing the damage in samples treated at a heating rate above 5 °C/min, at higher heating rates, thermal cracking is dominated by the stress concentrations caused by high thermal gradients [24,25]. Additionally, these physical and mechanical characteristics depend on different cooling conditions. Rock degradation caused by rapid cooling with water cooling or liquid nitrogen cooling was more severe compared with those under slower cooling such as air cooling, or cooling in a furnace [26,27,28]. Other rock types encountered in EGS projects, such as sandstone, have shown a similar trend [29,30,31,32]. The initial permeability of sandstone under certain pressure conditions was found to increased nonlinearly with the increase in temperature. Moreover, unconfined compressive strength and elastic parameters (i.e., elastic modulus and Poisson’s ratio) of calcarenite decreased as the temperature was increased from 105 to 600 °C [33].
Many previous studies have investigated rock damage after a single heating and cooling treatment, however, few have considered the effect of cyclic treatments. Gräf studied the effects of cyclic thermal-heating treatment on the thermal expansion behavior of granite, however, the heating temperature and the number of treatment cycles were limited [34]. Mahmutoglu investigated the effect of thermal cycles on the mechanical behavior of marble and Buchberger sandstone. The results of unconfined compression, Brazilian and ‘‘Continuous Failure State’’ triaxial tests, pointed out that all of the mechanical parameters decreased gradually with an increasing number of heating cycles [35]. Additionally, Rong et al. studied the effect of thermal cycles on marble and granite subjected to air cooling on P-waves, stress–strain relationships, and acoustic emissions. The results revealed that thermal cyclic loading weakens the mechanical properties of the rock [36]. Furthermore, Wu et al. studied the effects of thermal cycles on the density, permeability, and unconfined compressive strength of granite subjected to liquid nitrogen cooling. Liquid nitrogen cooling was found to have a greater effect on the physical and mechanical properties of granite than air cooling [37]. Previous literature has also revealed that microcracks influence the physical and mechanical characteristics of the rock. Research has also quantified the microscopic responses of rock, particularly microcracking [38], to such processes.
Considering that water is the most common fluid used to extract thermal energy from HDR, in this experimental study, we investigate the effects of cyclic heating and water cooling on the physical and mechanical properties of granite, including a quantitative analysis of the resulting microcracks.

2. Materials and Methodology

2.1. Rock Samples

Granite was selected as the experimental material in our study. The samples were fine-grained granite with a grain size ranging from 0.5 to 1.5 mm (Chinese granite G655), which were collected from an outcrop located in Zhangzhou, Fujian, China (117.86° E, 24.83° N). No fissures were observed in the original rock. Two shapes of granite specimens were used: cylinders with the dimensions of 25 mm in diameter and 50 mm in length and discs with the dimensions of 25 mm in diameter and 10 mm in thickness (Figure 1). The mineralogy of the granite is described in Section 3.4.

2.2. Methodology of Heating and Cooling

The granite cylinders were used for the measurement of porosity, permeability, P- and S-wave velocity measurements, whereas the granite disc samples were used for microstructural characterization. The P-wave and S-wave velocity of the cylindrical specimens were measured prior to thermal treatment. Thirty-one cylinders and thirty-one discs with similar P-wave velocities were divided into five groups with six specimens in each group (see Table 1). A SX-G04123 box-type electric furnace was used in heating (power 2.5 kW, maximum temperature 1200 °C). The process of heating a rock specimen to a pre-determined temperature and then cooling it down to room temperature with water was regarded as one thermal cycle. A heating rate of 1.5 °C/min was used to avoid the influence of thermal shock [39]. The pre-determined temperature, once reached, was kept constant for 5 minutes in the furnace to avoid the influence of subsequent heating time at a pre-determined temperature. The specimens were then taken out of the furnace and cooled down to room temperature (20 °C) with flowing water (shown in Figure 2). For each group, the pre-determined temperatures were set to 100–600 °C to mimic a high-temperature condition of deep bedrocks in an EGS system. The numbers of thermal cycles for each group was either 0 (i.e., no thermal treatment), 1, 2, 4, 8, and 16.

2.3. Ultrasonic Wave Velocity Measurements

Before measuring the porosity and permeability, P and S-wave velocities of the rock specimens were measured after thermal treatment for different temperatures and numbers of thermal cycles were measured using an ultrasonic apparatus (HS-YS2A Type). Two transducers fixed by a holder applying the same force were positioned at the ends of the specimen. A pressure gauge and hand wheel were used to apply an equal force with transducers during every test (see Figure 3). Each specimen was tested twice to ensure repeatability.

2.4. Porosity and Gas Permeability Measurements

We measured the porosity and steady-state permeability of the three temperature groups (200, 400, and 600 °C) using an SCMS-E high-temperature, high-pressure, multi-parameter core measurement system. The test procedure was performed in accordance with the methods suggested by the Practices for Core Analysis (GB/T 29172-2012) in Chinese. The measurement gas was nitrogen, while the test temperature was room temperature (10–15 °C), and the confining pressure was 3.5 MPa (Figure 4).

2.5. Microscopic Observation

Cast thin sections (CTS), i.e., thin sections of rock impregnated with colored epoxy, were used for highlighting the microcracks. The disc rock samples were saturated with blue epoxy to distinguish pores and fracture from rock matrices. The procedure of obtaining CTS is shown in Figure 5. All disc rock specimens were impregnated with colored epoxy after thermal treatment. After leveling, lapping and polishing, a thin section of size 25 × 0.03 mm was obtained. The impregnated sample was bonded to the surface of a piece of glass for further processing. The thin section image was then photographed under plane polarized light and cross polarized light by using a polarizing microscope (Zeiss Scope A1) with an attached digital camera.

2.6. Image Processing

Microcracks appear blue under plane-polarized light because the blue epoxy filled the microcracks. We selected the color of blue epoxy (R: 70, G: 132, B: 171). Usually, it is not consistent in every CTS image. Then, we set the tolerance to 70 to ensure that the blue parts of the image were successfully selected. The results are shown in Figure 6b. Manual interactive thresholding segmentation was used for the segmentation process. The thresholding of 40 was applied to the intermediate image based on the image histogram (see Figure 7). The binarized image result is shown in Figure 6d, which was further used for quantitative analysis (Figure 6c).
We then measured four different parameters to measure: area, size (width), size (length), dendrites—one pixel thick open branches (Figure 8). The number of isolated elements was automatically counted (Figure 6d). It should be noted that the size width was not the actual width of the fracture. Finally, the image statistical data were exported to a worksheet for post processing. The image porosity was calculated according to Equation (1).
P o r o s i t y = W h i t e   p i x e l s A l l   p i x e l s × 100 %

3. Results

3.1. Porosity

As shown in Figure 9, high temperatures (600 °C) had a greater effect on porosity than low heating temperatures (200 and 400 °C). Moreover, at 600 °C, porosity increased substantially as the cycle number increased from zero to two. At 200 and 400 °C, the influence of the number of thermal cycles on the porosity and permeability is negligible.

3.2. Gas Permeability

The permeability variations with the number of thermal cycles at different heating are plotted in Figure 10. The trends were similar for all three different heating temperatures. A positive correlation was observed between thermal cycling and permeability increase at 400 and 600 °C, while there was an irregular rise against thermal cycles at 200 °C. In addition, the permeability of granite at 600 °C was significantly higher than that at 400 °C and 200 °C. At 600 °C, the permeability of granite increased from 0.0001 to 4.7770 mD after 16 thermal cycles.

3.3. P- and S-Wave Velocity

Ultrasonic wave test is commonly used to detect the interior failure in a rock because of its simple and non-destructive characteristics. The typical P- and S-wave forms recorded and used to determine the velocities are presented in Figure 11 and the velocity results are shown in Figure 12. It appears that both P-wave velocity and S-wave velocity exhibited a similar negative correlation with heating temperature and the number of thermal cycles. The gradient of both P-wave and S-wave velocity decreased as the number of cycles increased. At 600 °C and one cycle of the thermal treatment, P- and S-wave velocities decreased by 73.6% and 58.6%, respectively. At 600 °C, after 16 cycles of the thermal treatment, the velocity reduced by 84.3% and 82.4%, respectively.

3.4. Rock Microstructure

The microscopic observations of A31 (no thermal treatment) are shown in Figure 13. The granite is mainly composed of feldspar, quartz, and biotite with a small amount of pyroxene and magnetite. Anorthosite is 578 μm in length and 251 μm in width. Quartz is 458 μm in length and 243 μm in width. Clear boundaries were observed between mineral grains (Figure 13b). No blue epoxy was not observed in the plane-polarized image (Figure 13a), indicating that the granite has negligible porosity.
Figure 14 presents the CTS observation results for the granite after one thermal cycle at 600 °C. The mineral grains and the associated microcracks are clearly affected by thermal treatment. Two types of microcracks were observed: grain boundary microcracks, transgranular microcracks (including intracrystalline microcracks) [12]. Grain boundary microcracks describe the microcracks developed at the boundary between different minerals, whereas transgranular microcracks are those developed in the interior of the mineral grains. These microcracks were predominantly confined within minerals, with some passing through multiple grains. Occasionally, transgranular microcracks and grain boundary microcracks developed connectivity at an angle of approximately 90°. Furthermore, the location of the microcracks was related to mineral species. Transgranular microcracks were typically developed in feldspar, and the development direction was almost perpendicular to the optical twin crystal direction of feldspar. Grain boundary microcracks were typically between feldspar and quartz, and between feldspar and feldspar [25,40]. Almost no transgranular microcracks were observed in biotite.
Plane-polarized and cross-polarized CTS images of the granite specimens with different heating temperatures (100–600 °C, one cycle) are presented in Figure 15 and Figure 16, respectively. Heating temperature affected the microcracks development behaviors. In the range of 100–300 °C, minimal blue epoxy was observed in the images. Grain boundary microcracks were sparsely distributed in a specimen heated to 400 °C (see Figure 15d), however, as the temperature exceeded 400 °C, more grain microcracks could be observed in the granite. For the specimen treated at 500 °C heating temperature (see Figure 15e and Figure 16e), transgranular microcracks were observed in feldspar. Grain boundary microcracks also existed but in a smaller proportion than those transgranular microcracks in the granite subjected to 600 °C. According to the plane-polarized microscope observation, as shown in Figure 15f (600 °C), abundant grain boundary microcracks were found along feldspar and quartz grains. Moreover, the transgranular microcracks and grain boundary microcracks occasionally coalesced.
Thermal cycles also had a significant influence on microcrack evolution, especially that of transgranular. The plane-polarized and cross-polarized photographs of CTS for granite specimens treated at 600 °C with different numbers of thermal cycles are presented in Figure 17 and Figure 18. With the increase of thermal cycles, both the length and width of transgranular microcracks increased, as well as the number of grain boundary microcracks and transgranular microcracks. Figure 17f and Figure 18f present sample A30, which was subject to 600 °C heating and 16 thermal cycles. The maximal width of transgranular reached approximately 20 μm. Microcracks were well developed and most mineral boundaries had grain boundary microcracks. The width of the transgranular microcracks was larger than that of grain boundary microcracks.

3.5. Microcrack Morphology

The granite morphology was analyzed through the CTS images (Figure 19), which were sorted according to the microcrack area and arranged vertically. The length of microcracks and the number of inflexion points increased with the number of thermal cycles (see Figure 19). This implies that the development and cross-cutting of grain-boundary microcracks and transgranular microcracks developed and crossed together. Hence, thermal cycles had a substantial influence on high-temperature granite subjected to water cooling.
We conducted a statistical analysis of the microcracks area to explore the distribution of pores size. As shown in Figure 20, relative frequency of microcracks descended rapidly from 0.35 to 0.05. 80% of pores contained less than 21 pixels or 17.01 μm2 (1 pixel ≈ 0.81 μm2). Tiny pores were the most numerous among all microcrack sizes.
The results of the CTS image processing are presented in Figure 21. Generally, differences were observed between the porosity measured via gas permeability measurement and microscope observations. The latter increased by 3.5 times from one cycle to 16 cycles, which rose from 1.61% to 5.67%. Conversely, the former only increased from 1.73% to 3.42% (Figure 21a). Measurements of maximum porosity, maximum length, and maximum width tended to increase with a greater number of thermal cycles (see Figure 21b–d). The line charts revealed that the development of microcracks induced by thermal stress increased with the rise of thermal cycles. The number of measured dendrites is shown in Figure 22, which also increased with the number of thermal cycles, by almost 13 times to 63. This clearly illustrates the expansion of microcracks with the number of thermal cycles at high heating temperatures.

4. Discussion

Porosity and crack density are the most important properties, playing a major role in the structural integrity of a rock [30]. They are related to the type and arrangement of mineral grains, internal pores, and microcracks. High temperature thermal treatment could increase the porosity of granite. Some researchers reported that 400 °C is a threshold temperature for granite to change its structure [9,30,41]. Below the threshold temperature, no significant relationship was found between the porosity of granite and the number of thermal cycles, suggesting that the increasing number of thermal cycles does not contribute to the propagation of microcracks. However, beyond a temperature of 600 °C, the increase of cyclic thermal treatment is associated with the increase of rock porosity.
Permeability is in relation to pores and especially fractures. Generally, fractures play an important role in the percolation capacity. Obviously, the thermal treatments can enhance the permeability of granite. The permeability is significantly improved as heating temperature rises [11,17,42]. Interestingly, the porosity at 400 °C was lower than that at 200 °C except after two thermal cycles, whereas the permeability exhibited the exact opposite trend. This reflected that the enhanced connectivity between granite microcracks was enhanced. Pore and crack networks facilitated fluid flow through the specimens, leading to the increased permeability. As a result, it demonstrated reversely that propagation of microcracks increased with the number of thermal cycles. The number of thermal cycles also had significant effects on the permeability of granite.
The CTS image processing employed in this study exhibits some limitations. First of all, the images cannot reveal all microcracks in the sample because of their finite resolution and size. Secondly, the images are 2D images rather than 3D images; thus, some microcracks cannot be observed for technical reasons. These two limitations would result in an underestimation of the porosity. Third, due to the inconsistent blue color of epoxy, some noise pollution is inevitable in the CTS image, which would lead to an overestimated porosity. Nevertheless, these images still provide useful and quantitative descriptions of microcracks in the granite.
During the process of heating and cooling, a series of physical and chemical reactions have occurred in granite (see Figure 23). When the heating temperature exceeded 100 °C, water inclusions that originally existed in the granite pores due to wettability and capillary force-escaped rock in the form of gas [8]. As a result, the P-wave velocity decreased. The chemical formula for biotite is K { ( Mg < 0.67 , Fe > 0.33 ) 3 [ AlSi 3 O 13 ] ( OH ) 2 } . In the temperature range of 300–500 °C, due to the escape of crystal water and dissociation of the H+ and OH (the existing form of constitution water in the mineral crystal lattice structure), the mineral framework was destroyed and microcracks developed in rock [17,42]. When the heating temperature reaches 573 °C, low-temperature α quartz turns into high-temperature β quartz, which is accompanied by a sudden volume expansion [7,43,44,45]. This transition results in severe derogation of the granite. During the heating process, due to differences in the thermal expansion coefficients of different minerals, thermal stresses accumulate at granular interfaces, even if the temperature field outside is uniform. This expansion mismatch primarily contributes to the development of grain boundary microcracks [24,46]. During the cooling process, granite specimens are placed in the flowing water, which induces the sudden variation of temperature and results in the gradual formation of grain boundary microcracks and transgranular microcracks among rock minerals. Water then invades the connected microcracks, resulting in new chemical reactions in the minerals. Because the transition of quartz to β quartz is a reciprocal reaction, the granite specimens experience repeated damage with an increasing number of thermal cycles.

5. Conclusions

We conducted a set of physical experiments to investigate the effect of cyclic thermal treatment and water cooling on the physical characteristics of granite. The results show that the thermal cycling has a significant influence on the physical characteristics (i.e., porosity, permeability, the seismic velocity). The results contribute to the fundamental understanding of the evolution of porosity and permeability in HDR geothermal systems. Qualitative and quantitative analyses of CTS images led to the following conclusions:
(1)
Physical characteristics changed significantly after flowing water cooling at high heating temperatures versus the number of thermal cycles. P- and S-waves reduced with the increase of thermal cycles. Porosity did not change substantially at heating temperatures of less than 400 °C. The permeability increased by four orders of magnitude compared to the samples without thermal treatment, which is susceptible than porosity.
(2)
Both grain boundary microcracks and transgranular microcracks were found. The primary effect of heating was grain boundary cracking during the first thermal cycle. Increasing the number of thermal cycles, transgranular microcracks also developed in the rock. Both types of grain boundary microcracks and transgranular microcracks coalesced to form a fracture network.
(3)
Quantification of the crack morphology from CTS images indicated that the large number of microcracks that developed in the granite during high-temperature treatment changed the rocks physical properties. The length of microcracks increased by one order of magnitude.

Author Contributions

Conceptualization, X.S. and C.Z.; data curation, J.W. and L.G.; formal analysis, L.G. and S.C.; supervision, C.Z. and L.G.; validation, X.Z. and X.S.; writing—original draft, L.G., X.Z. and X.S. All authors have read and agreed to the published version of the manuscript.

Funding

This research was funded by the National Science Foundation of China, grant number 51774428, and Sichuan International Science and Technology Innovation Cooperation/Hong Kong, Macao and the Taiwan Science and Technology Innovation Cooperation, grant number 2019YFH0166, and the National Students’ Innovation and Entrepreneurship Training Program of China, grant number 20180615013.

Conflicts of Interest

The authors declare no conflict of interest.

References

  1. Huang, W.; Cao, W.; Jiang, F. A novel single-well geothermal system for hot dry rock geothermal energy exploitation. Energy 2018, 162, 630–644. [Google Scholar] [CrossRef]
  2. Breede, K.; Dzebisashvili, K.; Liu, X.; Falcone, G. A systematic review of enhanced (or engineered) geothermal systems: Past, present and future. Geotherm. Energy 2013, 1, 4. [Google Scholar] [CrossRef] [Green Version]
  3. Tomac, I.; Sauter, M. A review on challenges in the assessment of geomechanical rock performance for deep geothermal reservoir development. Renew. Sustain. Energy Rev. 2018, 82, 3972–3980. [Google Scholar] [CrossRef]
  4. Pan, S.-Y.; Gao, M.; Shah, K.J.; Zheng, J.; Pei, S.-L.; Chiang, P.-C. Establishment of enhanced geothermal energy utilization plans: Barriers and strategies. Renew. Energy 2019, 132, 19–32. [Google Scholar] [CrossRef]
  5. Kelkar, S.; WoldeGabriel, G.; Rehfeldt, K. Lessons learned from the pioneering hot dry rock project at Fenton Hill, USA. Geothermics 2016, 63, 5–14. [Google Scholar] [CrossRef] [Green Version]
  6. Wan, Z.; Zhao, Y.; Kang, J. Forecast and evaluation of hot dry rock geothermal resource in China. Renew. Energy 2005, 30, 1831–1846. [Google Scholar] [CrossRef]
  7. Kumari, W.G.P.; Ranjith, P.G.; Perera, M.S.A.; Chen, B.K.; Abdulagatov, I.M. Temperature-dependent mechanical behaviour of Australian Strathbogie granite with different cooling treatments. Eng. Geol. 2017, 229, 31–44. [Google Scholar] [CrossRef]
  8. Wang, P.; Yin, T.; Li, X.; Zhang, S.; Bai, L. Dynamic Properties of Thermally Treated Granite Subjected to Cyclic Impact Loading. Rock Mech. Rock Eng. 2019, 52, 991–1010. [Google Scholar] [CrossRef]
  9. Zhang, F.; Zhao, J.; Hu, D.; Skoczylas, F.; Shao, J. Laboratory Investigation on Physical and Mechanical Properties of Granite After Heating and Water-Cooling Treatment. Rock Mech. Rock Eng. 2017, 51, 677–694. [Google Scholar] [CrossRef]
  10. Feng, Z.; Zhao, Y.; Zhang, Y.; Wan, Z. Real-time permeability evolution of thermally cracked granite at triaxial stresses. Appl. Therm. Eng. 2018, 133, 194–200. [Google Scholar] [CrossRef]
  11. Jin, P.; Hu, Y.; Shao, J.; Zhao, G.; Zhu, X.; Li, C. Influence of different thermal cycling treatments on the physical, mechanical and transport properties of granite. Geothermics 2019, 78, 118–128. [Google Scholar] [CrossRef]
  12. Peng, J.; Rong, G.; Cai, M.; Yao, M.-D.; Zhou, C.-B. Physical and mechanical behaviors of a thermal-damaged coarse marble under uniaxial compression. Eng. Geol. 2016, 200, 88–93. [Google Scholar] [CrossRef]
  13. Chen, Y.; Ni, J.; Shao, W.; Azzam, R. Experimental study on the influence of temperature on the mechanical properties of granite under uni-axial compression and fatigue loading. Int. J. Rock Mech. Min. Sci. 2012, 56, 62–66. [Google Scholar] [CrossRef]
  14. Gautam, P.K.; Verma, A.K.; Jha, M.K.; Sharma, P.; Singh, T.N. Effect of high temperature on physical and mechanical properties of Jalore granite. J. Appl. Geophys. 2018, 159, 460–474. [Google Scholar] [CrossRef]
  15. Yang, S.; Ranjith, P.G.; Jing, H.-W.; Tian, W.-L.; Ju, Y. An experimental investigation on thermal damage and failure mechanical behavior of granite after exposure to different high temperature treatments. Geothermics 2017, 65, 180–197. [Google Scholar] [CrossRef]
  16. Hu, X.; Song, X.; Liu, Y.; Cheng, Z.; Ji, J.; Shen, Z. Experiment investigation of granite damage under the high-temperature and high-pressure supercritical water condition. J. Pet. Sci. Eng. 2019, 180, 289–297. [Google Scholar] [CrossRef]
  17. Zhang, W.; Sun, Q.; Hao, S.; Geng, J.; Lv, C. Experimental study on the variation of physical and mechanical properties of rock after high temperature treatment. Appl. Therm. Eng. 2016, 98, 1297–1304. [Google Scholar] [CrossRef]
  18. Yin, T.; Li, X.; Cao, W.; Xia, K. Effects of Thermal Treatment on Tensile Strength of Laurentian Granite Using Brazilian Test. Rock Mech. Rock Eng. 2015, 48, 2213–2223. [Google Scholar] [CrossRef]
  19. Heuze, F.E. High-temperature mechanical, physical and Thermal properties of granitic rocks—A review. Int. J. Rock Mech. Min. Sci. Geomech. Abstr. 1983, 20, 3–10. [Google Scholar] [CrossRef]
  20. Fredrich, J.T.; Wong, T.-F. Micromechanics of thermally induced cracking in three crustal rocks. J. Geophys. Res. Solid Earth 1986, 91, 12743–12764. [Google Scholar] [CrossRef]
  21. Chen, Y.; Kobayashi, T.; Kuriki, Y.; Kusuda, H.; Mabuchi, M. Observation of microstructures in granite samples subjected to one cycle of heating and cooling. J. Jpn. Soc. Eng. Geol. 2008, 49, 217–226. [Google Scholar] [CrossRef] [Green Version]
  22. Arena, A.; Delle Piane, C.; Sarout, J. A new computational approach to cracks quantification from 2D image analysis: Application to micro-cracks description in rocks. Comput. Geosci. 2014, 66, 106–120. [Google Scholar] [CrossRef]
  23. Delle Piane, C.; Arena, A.; Sarout, J.; Esteban, L.; Cazes, E. Micro-crack enhanced permeability in tight rocks: An experimental and microstructural study. Tectonophysics 2015, 665, 149–156. [Google Scholar] [CrossRef]
  24. Rossi, E.; Kant, M.A.; Madonna, C.; Saar, M.O.; Rudolf von Rohr, P. The Effects of High Heating Rate and High Temperature on the Rock Strength: Feasibility Study of a Thermally Assisted Drilling Method. Rock Mech. Rock Eng. 2018, 51, 2957–2964. [Google Scholar] [CrossRef]
  25. Chen, S.; Yang, C.; Wang, G. Evolution of thermal damage and permeability of Beishan granite. Appl. Therm. Eng. 2017, 110, 1533–1542. [Google Scholar] [CrossRef]
  26. Zhao, Z.; Liu, Z.; Pu, H.; Li, X. Effect of Thermal Treatment on Brazilian Tensile Strength of Granites with Different Grain Size Distributions. Rock Mech. Rock Eng. 2018, 51, 1293–1303. [Google Scholar] [CrossRef]
  27. Isaka, B.; Gamage, R.; Rathnaweera, T.; Perera, M.; Chandrasekharam, D.; Kumari, W. An Influence of Thermally-Induced Micro-Cracking under Cooling Treatments: Mechanical Characteristics of Australian Granite. Energies 2018, 11, 1338. [Google Scholar] [CrossRef] [Green Version]
  28. Sarout, J.; Cazes, E.; Delle Piane, C.; Arena, A.; Esteban, L. Stress-dependent permeability and wave dispersion in tight cracked rocks: Experimental validation of simple effective medium models. J. Geophys. Res. Solid Earth 2017, 122, 6180–6201. [Google Scholar] [CrossRef]
  29. Liu, Q.; Qian, Z.; Wu, Z. Micro/macro physical and mechanical variation of red sandstone subjected to cyclic heating and cooling: An experimental study. Bull. Eng. Geol. Environ. 2017, 78, 1485–1499. [Google Scholar] [CrossRef]
  30. Sirdesai, N.N.; Mahanta, B.; Ranjith, P.G.; Singh, T.N. Effects of thermal treatment on physico-morphological properties of Indian fine-grained sandstone. Bull. Eng. Geol. Environ. 2017, 78, 883–897. [Google Scholar] [CrossRef]
  31. Yang, S.; Hu, B. Creep and Long-Term Permeability of a Red Sandstone Subjected to Cyclic Loading After Thermal Treatments. Rock Mech. Rock Eng. 2018, 51, 2981–3004. [Google Scholar] [CrossRef]
  32. Yang, S.; Xu, P.; Li, Y.; Huang, Y. Experimental investigation on triaxial mechanical and permeability behavior of sandstone after exposure to different high temperature treatments. Geothermics 2017, 69, 93–109. [Google Scholar] [CrossRef]
  33. Brotóns, V.; Tomás, R.; Ivorra, S.; Alarcón, J.C. Temperature influence on the physical and mechanical properties of a porous rock: San Julian’s calcarenite. Eng. Geol. 2013, 167, 117–127. [Google Scholar] [CrossRef]
  34. Gräf, V.; Jamek, M.; Rohatsch, A.; Tschegg, E. Effects of thermal-heating cycle treatment on thermal expansion behavior of different building stones. Int. J. Rock Mech. Min. Sci. 2013, 64, 228–235. [Google Scholar] [CrossRef]
  35. Mahmutoglu, Y. Mechanical Behaviour of Cyclically Heated Fine Grained Rock. Rock Mech. Rock Eng. 1998, 31, 169–179. [Google Scholar] [CrossRef]
  36. Rong, G.; Peng, J.; Cai, M.; Yao, M.; Zhou, C.; Sha, S. Experimental investigation of thermal cycling effect on physical and mechanical properties of bedrocks in geothermal fields. Appl. Therm. Eng. 2018, 141, 174–185. [Google Scholar] [CrossRef]
  37. Wu, X.; Huang, Z.; Cheng, Z.; Zhang, S.; Song, H.; Zhao, X. Effects of cyclic heating and LN2-cooling on the physical and mechanical properties of granite. Appl. Therm. Eng. 2019, 156, 99–110. [Google Scholar] [CrossRef]
  38. Freire-Lista, D.; Fort, R.; Varas-Muriel, M. Thermal stress-induced microcracking in building granite. Eng. Geol. 2016, 206, 83–93. [Google Scholar] [CrossRef] [Green Version]
  39. Dwivedi, R.D.; Goel, R.K.; Prasad, V.V.R.; Sinha, A. Thermo-mechanical properties of Indian and other granites. Int. J. Rock Mech. Min. Sci. 2008, 45, 303–315. [Google Scholar] [CrossRef]
  40. Isaka, B.L.A.; Ranjith, P.G.; Rathnaweera, T.D.; Perera, M.S.A.; Silva, V.R.S.D. Quantification of thermally-induced microcracks in granite using X-ray CT imaging and analysis. Geothermics 2019, 81, 152–167. [Google Scholar] [CrossRef]
  41. Chaki, S.; Takarli, M.; Agbodjan, W.P. Influence of thermal damage on physical properties of a granite rock: Porosity, permeability and ultrasonic wave evolutions. Constr. Build. Mater. 2008, 22, 1456–1461. [Google Scholar] [CrossRef]
  42. Wu, X.; Huang, Z.; Song, H.; Zhang, S.; Cheng, Z.; Li, R.; Wen, H.; Huang, P.; Dai, X. Variations of Physical and Mechanical Properties of Heated Granite After Rapid Cooling with Liquid Nitrogen. Rock Mech. Rock Eng. 2019, 52, 2123–2139. [Google Scholar] [CrossRef]
  43. Cheng, Y.; Luo, N.; Xie, X.; Li, M.; Yu, S. α-β phase transition of quartz based on molecular dynamics simulations. In Proceedings of the 9th International Conference on Properties and Applications of Dielectric Materials, Harbin, China, 19–23 July 2009. [Google Scholar]
  44. Duffrene, L. Molecular dynamic simulations of the alpha; -beta; phase transition in silica cristobalite. J. Phys. Chem. Solids 1998, 59, 1025–1037. [Google Scholar] [CrossRef]
  45. Griffiths, L.; Heap, M.J.; Baud, P.; Schmittbuhl, J. Quantification of microcrack characteristics and implications for stiffness and strength of granite. Int. J. Rock Mech. Min. Sci. 2017, 100, 138–150. [Google Scholar] [CrossRef]
  46. Wang, H.F.; Bonner, B.P.; Carlson, S.R.; Kowallis, B.J.; Heard, H.C. Thermal stress cracking in granite. J. Geophys. Res. 1989, 94. [Google Scholar] [CrossRef]
Figure 1. Photographs of the rock specimens.
Energies 13 02136 g001
Figure 2. Schematic diagram of the heating and cooling process.
Energies 13 02136 g002
Figure 3. Schematic of the ultrasonic test.
Energies 13 02136 g003
Figure 4. Schematic of the porosity and permeability measurement system.
Energies 13 02136 g004
Figure 5. Schematic of polarizing microscope observation process.
Energies 13 02136 g005
Figure 6. Schematic view of image processing. (The blue part is the preparation process, while the green part is the measurement process).
Energies 13 02136 g006
Figure 7. Segmentation via image thresholding.
Energies 13 02136 g007
Figure 8. Three different types of parameters for measurements.
Energies 13 02136 g008
Figure 9. Effect of the number of thermal cycles and temperature on granite porosity.
Energies 13 02136 g009
Figure 10. Permeability characteristics after thermal treatment. (a) Three different temperatures using same y axis. (b) The pre-determined temperature was 200 °C. (c) The pre-determined temperature was 400 °C. (d) The pre-determined temperature was 600 °C.
Energies 13 02136 g010
Figure 11. Typical P- and S wave forms recorded and used to determine velocities. (a) P-wave form. (b) S-wave form.
Energies 13 02136 g011
Figure 12. Variation of P-wave velocity and S-wave velocity changes with the number of thermal cycles and temperature. (a) Variation of P-wave velocity with temperature. (b) Variation of S-wave velocity with temperature. (c) Variation of P-wave velocity with the number of thermal cycles. (d) Variation of S-wave velocity with the numbers of thermal cycles.
Energies 13 02136 g012
Figure 13. Polarized micrographs of granite without thermal treatment. (a) Plane polarized image; (b) cross polarized image. Qtz—Quartz; An—Anorthite; Bt—Biotite; Px—Pyroxene; Mag—Magnetite.
Energies 13 02136 g013
Figure 14. The types and location of granite fracture. (a) Plane polarized image; (b) cross polarized image. Qt—Quartz; An—Anorthose; Bt—Biotite; Px—Pyroxene. 1—grain boundary microcracks; 2—transgranular microcracks. (600 °C, 1 cycle).
Energies 13 02136 g014
Figure 15. Plane polarized images of microcracks in granites subjected to different heating temperatures. (a) 100 °C; (b) 100 °C; (c) 200 °C; (d) 400 °C; (e) 500 °C; (f) 600 °C; 1—grain boundary microcracks; 2—transgranular microcracks.
Energies 13 02136 g015
Figure 16. Cross polarized images of microcracks for granites subjected to different heating temperatures. (a) 100 °C; (b) 100 °C; (c) 200 °C; (d) 400 °C; (e) 500 °C; (f) 600 °C. Qtz—Quartz; An—Anorthose; Bt—Biotite; Px—Pyroxene.
Energies 13 02136 g016
Figure 17. Plane polarized images of microcracks for granites with 600 °C heating temperature subjected to different numbers of the thermal cycle. (a) No thermal treatment; (b) 1 cycle; (c) 2 cycles; (d) 4 cycles; (e) 8 cycles; (f) 16 cycles. 1—grain boundary microcracks; 2—transgranular microcracks.
Energies 13 02136 g017
Figure 18. Cross polarized images of microcracks for granites with 600 °C heating temperature subjected to different numbers of the thermal cycle. (a) No thermal treatment; (b) 1 cycle; (c) 2 cycles; (d) 4 cycles; (e) 8 cycles; (f) 16 cycles. Qtz—Quartz; An—Anorthose; Bt—Biotite; Px—Pyroxene.
Energies 13 02136 g018
Figure 19. The morphology for granite with 600 °C heating temperature and different thermal cycles. (a) 1 cycle; (b) 2 cycles; (c) 4 cycles; (d) 8 cycles; (e) 16 cycles.
Energies 13 02136 g019
Figure 20. Distribution of microcracks with 600 °C heating temperature and 8 thermal cycles.
Energies 13 02136 g020
Figure 21. Results of the cast thin section (CTS) image processing versus the numbers of the thermal cycle. (a) Variation of image porosity. (b) Variation maximum image porosity. (c) Variation maximum fracture length. (d) Variation maximum fracture width.
Energies 13 02136 g021
Figure 22. Effect of the number of thermal cycles on the number of dendrites.
Energies 13 02136 g022
Figure 23. Mechanisms of thermal damage in heating and cooling.
Energies 13 02136 g023
Table 1. Thermal treatment conditions of granite employed in this study. (A: disc specimens, B: cylindrical specimens).
Temperature (°C)100200300400500600
Number of cycles1A1, B1A2, B2A3, B3A4, B4A5, B5A6, B6A31, B31
(No thermal treatment)
2A7, B7A8, B8A9, B9A10, B10A11, B11A12, B12
4A13, B13A14, B14A15, B15A16, B16A17, B17A18, B18
8A19, B19A20, B20A21, B21A22, B22A23, B23A24, B24
16A25, B25A26, B26A27, B27A28, B28A29, B29A30, B30

