Article

A Method for Analyzing Energy-Related Carbon Emissions and the Structural Changes: A Case Study of China from 2005 to 2015

1
State Key Laboratory of Power Systems, Department of Energy and Power Engineering, Tsinghua-BP Clean Energy Research and Education Centre, Tsinghua University, Beijing 100084, China
2
Tsinghua-Rio Tinto Joint Research Centre for Resources, Energy and Sustainable Development, Tsinghua University, Beijing 100084, China
*
Author to whom correspondence should be addressed.
Energies 2020, 13(8), 2076; https://doi.org/10.3390/en13082076
Submission received: 28 February 2020 / Revised: 17 April 2020 / Accepted: 19 April 2020 / Published: 21 April 2020

Abstract

:
To systematically analyze energy-related carbon emissions from the perspective of comprehensive energy flow and allocate emissions responsibility, we introduce energy allocation analysis to carbon flow process based on Sankey diagrams. Then, to quantitatively compare different diagrams and evaluate the structural changes of carbon flow, we define changes from three dimensions including total amount change, relative growth rate and occupation ratio change (TRO), propose TRO index. The method is applied to China’s case study from 2005 to 2015. We map China’s energy-related carbon flow Sankey diagrams with high technical resolution from energy sources, intermediate conversion, end-use devices, passive systems to final services, and conduct TRO index decomposition by stages. The results indicate that in energy sources, the emission share of coal has declined due to energy transition although coal is still the largest contributor to China’s energy-related carbon emissions. In passive systems, the factory passive systems are the largest contributors, among them, emission reduction should focus on the steel, non-ferrous and chemical industries; the building passive systems should pay attention to household appliances; the vehicle passive systems should focus on cars. In final services, the demand for structural materials is the strongest driving force for carbon emissions growth.

Graphical Abstract

1. Introduction

Controlling energy-related carbon emissions and realizing a low-carbon transition in the energy system are important ways to globally address climate change and achieve sustainable development [1]. Considering that energy-related carbon emissions are closely related to complex energy flows in the energy system, it is necessary for policymakers to understand carbon emissions from the perspective of overall energy systems so as to formulate more targeted emission reduction policies [2]. As climate change becomes more severe, recent researches are stimulated to analyze energy-related carbon emissions and emission responsibility underlying the entire process of energy flow, and to discern the changing trend.
In the area of energy system analysis, Sankey diagrams are popular and useful tools for visualizing processes [3], which use arrows to show the flow of a certain object (e.g., energy, exergy, resources, etc.) with width representing the quantity and the colors indicating the types. Some recent examples of Sankey diagrams applied to energy system analysis are shown in Table 1. The literature shows that the Sankey diagrams have been widely used to analyze energy flow or greenhouse gas (CO2) flow processes.
In this field, Cullen and Allwood [4] were early scholars who proposed a systematic energy allocation analysis method based on Sankey diagrams. The method suggested that energy losses in energy conversion sectors should be calculated into and compensated for in the end-use energy consumption but not be presented separately, so as to evaluate the primary energy consumption responsibility of end use sectors and final energy services. This method was then followed by many other scholars, for example, Ma et al. [6] applied the method to national level mapping China’s energy flow diagram, Chong et al. [7] introduced it to Malaysia showing the allocation of primary energy consumption responsibility in the energy system. Furthermore, the method was applied to regional energy flow such as China’s provinces [8] and Canada’s territories [9]. Recent researches also used the method to map CO2 flow diagrams [12], however, through our literature review, we found some limitations in three main aspects:
  • Although the application of Sankey diagrams in the analysis of complex energy flow process was popular including comprehensive stages, the application in the analysis of energy-related carbon emissions flow was relatively limited. In the published work about carbon flow diagrams, the division of energy stages was somewhat simple with only supply and end use sides [11]. The resolution of the carbon flow diagram needs to be increased.
  • Research gap also existed in some other diagrams [10] in which a large amount of carbon emissions caused by energy loss in the conversion sector were calculated as a loss, which made it difficult to observe the carbon emission responsibility allocation of the end-use sectors well. It is needed to apply the idea of energy allocation analysis to carbon allocation analysis to show the emission responsibility comprehensively.
  • Most of existing work using Sankey diagrams focused on the situation of a certain year. Although some research presented carbon flow diagrams in different years [12], it still lacked systematical comparison of diagrams in different years. While comparing these diagrams might reveal in-depth structural changes and trends of energy transition. Considering this, a new method for comparing Sankey diagrams and evaluating structural changes is needed.
Recognizing the above limitations, this paper aims to develop a method for analyzing energy-related carbon flow from the perspective of comprehensive energy flow, quantitatively comparing different Sankey diagrams and evaluating the structural changes and trends with energy transition. Firstly, we introduced energy allocation analysis to carbon flow analysis, fully considering the carbon emission responsibility allocation in the whole energy flow process from energy sources, intermediate conversion, end-use conversion devices, passive systems to final services. Secondly, we mapped the energy flow and the energy-related carbon flow Sankey diagrams. Thirdly, we defined the structural changes of Sankey diagrams from three dimensions, proposed index including total amount change (T), relative growth rate (R) and occupation ratio change (O), i.e., TRO index, compared different Sankey diagrams and discussed the political and practical reasons behind these changes.
To apply the method to actual objects, we chose China as a case for its tremendous and dynamic energy consumption and energy-related carbon emissions (see Appendix A, Figure A1). China accounted for 23.6% of global energy consumption and 27.8% of global energy-related CO2 emissions as the largest energy consumer and CO2 emission source in 2018 [13]. We chose the decade of 2005–2015 as the research period, because in this decade China’s energy development experienced a tough transition. In this period, to achieve energy transition, China issued a package of energy plans ([14,15,16,17,18,19] as listed in Appendix B, Table A1). These policies resulted in great influences on the energy system and energy-related carbon emissions. Choosing this period can help us understand the notable changes of carbon emissions brought by the transition of the energy system and compare the results with relevant policies to verify this method.
The contribution of this work is to provide a method for analyzing national energy-related carbon emissions and evaluating structural changes based on Sankey diagrams and apply this method to China’s case study from 2005 to 2015. Although some parts of methodology referred closely to previous work of energy allocation analysis of China [6], we further introduced the method to carbon allocation analysis of China, mapped its energy-related carbon flow Sankey diagrams in 2005 and 2015 (as well as a newly updated energy flow Sankey diagram in 2015). Additionally, the TRO index was proposed to compare the Sankey diagrams. This method can help us comprehensively understand national energy-related carbon emissions and the structural changes behind energy transition.
The rest of this paper is organized as follows: Section 2 introduces the method for depicting carbon flow process, evaluating structural changes, and data input; Section 3 discusses the carbon flow Sankey diagram results, TRO index decomposition, and the uncertainty; finally, Section 4 presents the conclusions.

2. Methodology and Data Input

The procedure of the methodology applied in this study is divided into three steps: In the first step, we conducted energy allocation analysis to fully understand the features of China’s energy system and mapped China’s energy flow Sankey diagram in 2015. In the second step, based on the energy flow Sankey diagram in 2015 and a previous one in 2005 [6], we calculated carbon emissions of each section in the energy system by introducing relevant emission factors. Then we plotted China’s energy-related carbon flow diagrams in 2005 and 2015 showing carbon emissions underlying the whole process of energy flow. In the last step, in order to analyze the main trend of carbon flow and determine the key structural changes quantitatively, we applied TRO index decomposition method on these two carbon flow diagrams and analyzed the results of several main sectors.

2.1. The Framework for Energy Allocation Analysis Based on Sankey Diagrams

This study divided the energy flow process into five sub-sections: energy sources, intermediate conversion, end-use conversion devices, passive system and final services. In order to keep in line with previous work for later comparison, the concept and scope of each section refer to Ma et al. [6], which is detailed described in Appendix C, Table A2.
We used the Sankey diagram tool to present the energy flow process. The diagrams were plotted on the software called “e!Sankey” [20]. The framework of the energy flow Sankey diagram is shown as Figure 1. In the diagram, the energy flows from left to right with the allocation in different departments. The vertical lines show different stages of energy flow. In the specific Sankey diagrams, the width of the arrow shows the values of energy and the colors show different energy types or uses.
The core of energy allocation analysis is to allocate the energy loss in intermediate conversion stage into the energy consumption responsibility of the end-use stages. Therefore, the energy loss is not shown in energy flow process, and there are only energy allocation among different uses in the whole process from supply to service. How should we look at the energy allocation diagram? Except the clear demonstration of the energy flow process distinguished in different categories, different departments and different links, one of the advantages of the map is an effective combination of three levels of supply-conversion-demand: looking from the left side, it’s the distribution of supplies (such as energy sources), from the right side, it’s the allocation of demands (such as final services), while in the middle is the condition of specific technical departments (such as end-use conversion devices and passive systems). These will also be the key links to be discussed in the following text.

2.2. Carbon Allocation Analysis Based on Energy Allocation Analysis

2.2.1. The Carbon Flow Sankey Diagram

As carbon allocation analysis is based on energy allocation analysis, the structure of carbon flow Sankey diagram is similar to that of energy flow Sankey diagram (see Figure 1). However, it should be noted that the real carbon emissions occur in the intermediate conversion stage where the energy is burned as direct fuel, electricity generation, heating and energy system own-use. At this stage, the carbon which cannot be oxidized in the fuel will be left, thus leading to a ‘non-oxidation’ flow in the diagram. In the previous stage of conversion, emissions have not occurred, so the flow shows the total carbon embodied in relevant energy. While in the subsequent stage of conversion, emissions have occurred, this part of diagram shows the carbon emission responsibility of each department because we allocate the energy loss into the end-use energy consumption responsibility, the carbon emission loss is the same.

2.2.2. Carbon Emissions Calculation

Because this study only focuses on energy-related carbon emissions, the calculation of emissions is based on the fossil fuel consumption. There are mainly three broad categories and 18 types of fossil fuel (see Table 2) considered in this paper. Equation (1) is used to calculate fuel-related carbon emissions:
C i = j E i j × N C V j × C C V j × O j
In this equation, the subscripts i and j denote the i-th sector and the j-th fuel, respectively, Ci is the total carbon emissions of different sectors, Eij represents the different energy consumption in different sectors, NCVj refers to the net calorific value of different energy types, CCVj is the carbon content per calorific value of different fuels, Oj is the carbon oxidation rate of the fuel. Due to the possible error between the actual carbon emission factors of China’s coal and that recommended by Intergovernmental Panel on Climate Change (IPCC) [21], the data of NCVj, CCVj and Oj used in this paper are mainly taken from China’s official statistics including General Principles for Calculation of the Comprehensive Energy Consumption [22] and Guidelines for GHG Inventories [23], a few of the data not published are from the default value recommended by IPCC [24], all of them are shown in Table 2.

2.3. The Method for Evaluating Structural Changes of Sankey Diagrams–TRO index

Through our literature review, we found that the method for evaluating structural changes of the Sankey diagram itself was still limited. It is difficult to systematically and quantitatively compare two Sankey diagrams and to discern the structural changes, because there are too many complex departments with detailed data in the diagram and the changes are reflected in many aspects. In order to solve this problem, we proposed TRO index to evaluate the structural changes, defining the structural change from three dimensions: total amount change, relative growth rate and occupation ratio change. In this study, specifically, the method was applied to compare carbon flow Sankey diagrams.
The meaning of TRO index is to help us quickly identify structural changes in complex carbon flow Sankey diagrams, including both obvious total amount changes and relative growth rate that is not easy to visualize. TRO is not only a mathematical indicator, but also has actual physical meaning, e.g., the total amount change reveals change in the industrial production capacity, the relative growth rate reveals potential development trends, and the occupation ratio change reflects the results of structural transition. These three indicators are complementary to each other for comprehensively revealing the structural changes. The meaning and calculation method of each index is explained in detail in the following text.

2.3.1. Total Amount Change (T)

Total amount change T refers to the change of the total carbon emissions in a relevant section in the Sankey diagrams between different years. To a certain degree, total amount change reflects the change in the size of the industry’s production capacity. The sectors with larger total amount change should be paid more attention for emission reduction, because improving the same energy efficiency or reducing the same carbon intensity in these sectors may lead to more emission reduction. The formula of the total amount change of sector i is as Equation (2):
T i = C T i C t i
where Cti is the total carbon emissions of sector i in the base year t, CTi is the total carbon emissions of sector i in the observed year T.

2.3.2. Relative Growth Rate (R)

Relative growth rate R refers to the ratio of the carbon emission change of a relevant section in the Sankey diagrams during the observed period to the carbon emission in base year. It can make up for the shortcomings when T index is used for the industry that used to be small and unconcerned but has rapid development in recent years thus leading to high emission growth rate. R index also reflects the orientation of relevant policies and changes of market demand to some extent. These parts are also the ones that should be paid special attention to, because they are likely to become the main driving force for the growth of carbon emissions in the future. Identifying this indicator can help policy makers adjust the energy structure of relevant industries at an early stage, so as to control carbon emissions more effectively. The formula for calculating the relative growth rate of carbon emissions of sector i is as shown in Equation (3):
R i = C T i C t i C t i

2.3.3. Occupation Ratio Change (O)

Occupation ratio change O refers to the change of the proportion of a relevant sector in the corresponding stage of the Sankey diagrams during observed period. It reflects the actual changes of carbon flow structure that influenced by energy structure transition. The formula for calculating the occupation ratio change of sector i is seen in Equation (4):
O i = P T i P t i
In this equation, Pti is the ratio of carbon emissions of sector i to the total emissions in the corresponding link in the base year t, PTi is that in the observed year T.

2.4. Data Input

China’s energy data for 2015 are obtained and calculated from China’s official statistics sources such as China Energy Statistical Yearbook 2016 [25], The 11th Five-Year Plan for Energy Development [14], The 12th Five-Year Plan for Energy Development [18], and a series of reports such as Energy Data of China 2016 [26], and Survey Analysis of Lighting Power Consumption in China [27]. The China’s energy data in 2005 are from Ma et al. [6]. The carbon emission factors are calculated from General Principles for Calculation of the Comprehensive Energy Consumption [22], China Guidelines [23] and IPCC Guidelines [24]. Some other data are from authors’ calculation. Detailed data sources and processing are shown in Appendix D, and some key data in the processing are listed in Table A3, Table A4, Table A5, Table A6, Table A7, Table A8 and Table A9.

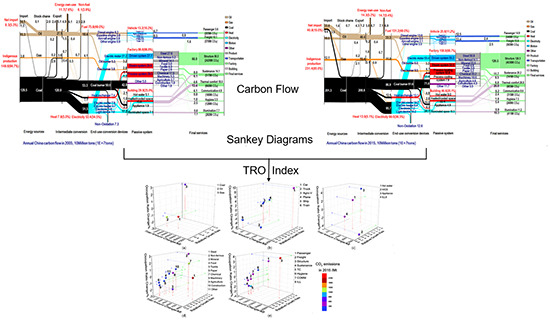
3. Results and Discussion

3.1. China’s Energy Flow and Energy-Related Carbon Flow Sankey Diagrams

Based on energy allocation analysis method, we first plotted a Sankey diagram of China’s energy flow in 2015, as shown in Figure 2, which is a latest Sankey diagram that reflects energy flow process in China’s energy system. In the diagram, the energy flow is traced from left to right, and allocated to five stages: energy sources, intermediate conversion, end-use conversion devices, passive systems and final services. The detailed description of each stage can be seen in Table A2. The colors of the various arrows indicate different energy types and different departments, as shown in the legend on the right of the diagram. The thickness of each arrow represents the scale of energy flow, with numbers on it giving the values. The whole energy flow obeys the energy conservation law. Energy losses are not shown in the map but remain included in the energy flow to illustrate the energy allocation through all stages. The energy values are shown in EJ (1018 J).
Based on the Figure 2 and a previous energy flow diagram of China in 2005 [6], by introducing carbon emission factors, we further mapped China’s energy-related carbon flow Sankey diagrams in 2005 and 2015, as shown in Figure 3 and Figure 4.
The framework of carbon flow Sankey diagrams is consistent with that of the energy flow Sankey diagrams. The only difference is that the energy-related carbon flow diagram shows the flow of carbon but not energy. In this work, we assumed that energy-related carbon emissions only come from three broad categories and eighteen types as listed in Table 2. Therefore, in the stage of energy sources and intermediate conversion, there are only oil, coal and gas in the diagram. The colors of the various arrows indicate carbon emissions coming from different energy types and consumed by different departments, as shown in the legend on the right of the diagram. The thickness of each arrow represents the scale of carbon flow, with numbers giving the values. The whole carbon flow obeys the law of carbon conservation. The carbon values are reported in 10 Million tons (107 tons).
The main advantage of the carbon flow Sankey diagram is that it shows the carbon emission responsibility of each sector in each stage of the energy system because energy losses are allocated into consumption sectors but not presented separately. The arrows in energy sources stage show the total amount of carbon entering the system. The arrows in energy conversion stage show actual carbon emissions. In the conversion stage, the carbon in fuels is oxidized and released, while the non-oxidized parts flow to ‘non-oxidation’. The arrows in passive systems and final services reflect the carbon emissions embodied in users’ consumption and demand. According to Figure 2, Figure 3 and Figure 4, the general situation of China’s energy system and energy-related carbon emissions can be seen as follows:
(1)
Coal dominated in China’s energy supply and consumption, accounting for 64.0% of primary energy supply in 2005 and 57.6% in 2015, and its contribution to energy-related carbon emissions was as high as 79.4% and 78.1%, respectively.
(2)
At the intermediate conversion stage, more than half of the primary energy was directly used as fuel (54.0% in 2005, 50.7% in 2015), contributing 49.0% and 48.0% of energy-related carbon emissions, followed by electricity generation (accounting for 37.0% in 2005, 39.1% in 2015), and its contribution to energy-related carbon emissions increased from 34.5% to 36.3%.
(3)
In passive systems, the factory passive system was the largest energy consumer, in which the carbon emissions increased by 83.1% from 3182 Mt CO2 to 5826 Mt CO2, followed by building passive system, but its contribution to carbon emissions decreased from 23.0% to 20.1%. In the factory passive system, the steel and chemical industries took the main carbon emission responsibility, accounting for 32.0% and 22.2% of factory emissions in 2015. In the building passive system, heated/cooled space was the main energy consumption and carbon emission source with 14.9 EJ energy consumption and 821 Mt CO2 emissions in 2015. In the vehicle passive system, the largest contributor changed from trucks (accounting for 39.4% carbon emissions of vehicle in 2005) to cars (accounting for 39.8% carbon emissions of vehicle in 2015).
(4)
As for final services, the structural material is the most important demand. In 2015, it accounted for 52.6% of energy consumption and contributed 54.7% of carbon emission responsibility as 4638 Mt CO2. Demand for thermal comfort, sustenance, freight transportation, passenger transportation, illumination, communication, and hygiene accounted for 11.6%, 8.7%, 6.9%, 6.4%, 4.8%, 3.7%, and 3.2%, respectively.

3.2. The Structural Changes of Carbon Flow Sankey Diagrams

After getting the full picture of carbon emissions allocation, to evaluate the structural changes more comprehensively, we conducted TRO index decomposition of each section in the diagram to compare the situation of energy-related carbon emissions. The results of the TRO index decomposition of several important sections including energy sources, three passive systems (vehicle, building and factory), and final services are shown as Table 3 and Figure 5. In the following text, the results of each section are discussed one by one and are compared with relative policies, other statistics, and other studies to verify the method.

3.2.1. The Energy Sources Level

In energy sources (Figure 5a), results show that the most significant structural changes were from coal. During 2005–2015, although the coal was still the largest contributor to energy-related carbon emissions with largest increment (total amount increased by 3076Mt), its proportion conversely decreased a lot (occupation ratio decreased by 1.2%). Compared with China’s policy objectives [18], it can be seen that the effect of coal reduction work in China during this period was quite successful. The proportion of coal in China’s energy structure decreased by 6.4% in this period. For one reason, it was related to the national efforts to increase the proportion of natural gas and non-fossil energy consumption [15]. For another reason, it was also closely related to the industrial upgrading and technological progress of the coal industry itself [28].
In contrast, natural gas has become an important energy source for replacing coal in the transition of China’s energy structure leading to a rapid growth rate of carbon emissions by 205%, which was closely related to China’s strong investment in natural gas infrastructure construction and deep international cooperation. Facts show that in 2009, China cooperated with Russia and Central Asian countries to build the first natural gas pipeline for the introduction of long-distance natural gas delivery from Central Asia; in 2013, China-Myanmar natural gas pipeline was established in cooperation with Myanmar, which became the second onshore natural gas pipeline; in the meantime, the liquefied natural gas (LNG) business was also booming, and the countries China imported LNG from had expanded from Australia, Indonesia and Malaysia to Qatar and Brunei [29]. Renewable energy represented by wind and solar power also developed rapidly in China during this period. For example, the wind power became the energy source with fastest relative growth rate (by 55.7 times) in the decade and contributed a lot of increase of the proportion in energy structure (increased by 1.1 %). The rise of natural gas and renewable energy had slowed the growth of energy-related carbon emissions to some degree.

3.2.2. The Vehicle Passive System Level

In the vehicle passive system (Figure 5b), results show that the largest driving force was the passenger car, which not only had the largest increase in total amount change (231Mt CO2) but also remained a high relative growth rate (158%), making its occupation ratio increased by 9.5% in vehicle passive system and exceed trucks as the largest emission source. While trucks and ships represented a significant decline in the occupation ratio of the emissions structure (trucks reduced by 8.1%, ships reduced by 5.2%). Compared with other statistics, the results kept in line with the fact that China’s highway infrastructure had been gradually improved in the past decade (in 2015, the total length of China’s highways reached 4.57 Million km, the total length of freeways reached 123,500 km, the proportion of towns with roads reached 99.99% [30]), and the number of civilian vehicles increased rapidly (reached 163 million in 2015, which was ten times more than that in 2005 [26]). In this period, new energy vehicles such as electric vehicles had not been promoted, so the increment of private cars were mainly gasoline-powered cars, which significantly increased the carbon emissions of passenger cars. The transition of the economic structure was another proof. In 2015, the proportion of increased GDP in the tertiary industry exceeded 50% for the first time [31]. As in this period, the tertiary industry had less demand for physical goods compared with the primary and secondary industry, the overall freight demand and the growth rate of the road freight industry slowed down in 2015. Thus the energy consumption growth of trucks and ships slowed down, and carbon emissions did not increase significantly.

3.2.3. The Building Passive System Level

In the building passive system (Figure 5c), in terms of the energy consumption, the most significant increase came from hot water systems (relative energy consumption growth rate by 157%, energy consumption proportion increased by 4.9%), but as for carbon emissions, household appliance was noteworthy. Although appliances energy consumption growth rate was only 19%, the relative growth rate of carbon emissions was as high as 158%, and its occupation ratio in the emissions structure increased the most by 4.1%. This result shows the role of R index to reveal potential trends. To explain this, we further calculated the carbon emissions per unit energy consumption (CPE) of these two sectors and found the difference. In this period, the CPE of the hot water system decreased by 31.4%, but that of the household appliance increased by 116.8%. This finding was consistent with another statistics [26], which shows that in the process of replacing traditional home appliances, a large part of the original biofuel appliances were replaced (such as electric cookers, gas stoves replaced firewood stoves, biofuel direct use decreased by 29.7% from 2010 to 2015 [26]), which made carbon emissions of appliances increase significantly although the total energy consumption did not change so much, for biomass was assumed to be carbon neutral. As a policy implication, it could be solved by adjusting the power source structure and introducing more non-fossil energy or biomass power.
The heated/cooled space system contributed the largest increase in total amount change (242 Mt CO2), but considering its large emission base, the relative growth rate is just 42%, which is the smallest in the building system, its occupation ratio also decreased by 4.7%. This was mainly due to the gradual improvement of the infrastructure of municipal heat pipe networks. Centralized heat-supply and gas heat-supply replaced traditional heating methods and improved heating efficiency. The changes were also related to the improvement of energy efficiency of household devices such as heaters. Wang et al. [32] also agreed that China’s domestic heating reformation could play a crucial role in achieving energy saving and emission reduction goals. At the spiritual level, this trend reflected a significant improvement of the residents’ living standards, the constantly increasing demand for life quality.

3.2.4. The Factory Passive System Level

In the factory passive system (Figure 5d), the steel mining industry was still the sector with the largest carbon emissions and increment (CO2 emissions increased by 851 Mt). This was related to the over-capacity inertia of the steel industry in China, and it was difficult to achieve de-capacity in short term which was also pointed out by Zhou and Yang [33]. Results also show that the non-ferrous metal mining industry and chemical industry had become new driving forces of carbon emission growth (the relative growth rate of non-ferrous metal industry reached 171%, accounting for an increase of 2.9% in the emission structure, and the chemical industry’s emission growth rate reached 1.01, accounting for an increase of 2.0% in the emission structure). The improvement of macroeconomics, industrialization and urbanization had brought huge demand for non-ferrous metal materials and chemical raw materials, and also provided a good economic environment for relevant manufacturing. The significant profit growth of chemical industry (in 2015, its profit increased by 7.7%, which is the largest increase in all industrial sectors of China [34]) brought great opportunities for the development of chemical-related enterprises.
Compared with previous work in this field, Li et al. [11] conclude that in 2013 the ‘electricity and heating’ emitted the most in the secondary industry (factory), following by ‘metals’ (including ferrous and non-ferrous), while chemical industry just accounted for nearly 3.1%. This differs from our results, as the division of stages of carbon flow diagram in their work only included energy sources and end use sectors, and the ‘electricity and heating’ was regarded in a parallel relation with other industrial sectors. But in fact, most of electricity and heating served as secondary energy supply and were consumed by steel, non-ferrous metal and chemical industries. When we discuss carbon emissions responsibility, it is inappropriate to allocate all of these emissions to the electricity generation sector. Concerning this, in another work, Li et al. [35] allocated the emission responsibility of electricity generation to end use sectors and kept in line with our result that the ferrous (steel) industry took the largest CO2 emissions responsibility, but the main difference was that the non-ferrous metal industry only accounted for 3% of end use sectors responsibility in their study. This was because in their carbon flow Sankey diagram, a large amount of emissions caused by energy loss in the conversion stage such as electricity and heat generation were regarded as conversion loss and not allocated to end use responsibility. However, the fact is that the non-ferrous industry consumed a lot more electricity and heat but less direct fuels than other industries [25]. Since the emissions responsibility of electricity generation had been allocated to end use sectors, the loss of this stage should also be considered. This just illustrates the importance of energy allocation analysis method in carbon emissions analysis.
We also found that the industry whose growth of carbon emissions slowed significantly was the non-metallic mineral mining manufacturing industry. Although it had large emissions (517 Mt CO2 in 2005), the relative growth rate was only 60%, and the occupation ratio of emissions shrunk by 2.0%. This partly differs from previous work [11] concluding that the non-metallic mineral would continue to increase rapidly. Actually, during the “12th Five-Year Plan” period when China had strengthened the management and rectification of non-metallic mineral mines, standardized the mining order, and shut down nearly 10,000 nonstandard enterprises [36]. The result illustrates the effectiveness of comprehensively considering TRO index to analyze the changing trend.

3.2.5. The Final Services Level

In final services (which is also the demand side, as shown in Figure 5e), results show the strongest driving force of carbon emissions was the demand for structural materials (CO2 emissions increased by 2218Mt, the occupation ratio of emissions increased by 3.9%) and passenger service (the relative growth rate was as high as 166%, the occupation ratio increased by 2.1%). The increase of demand for structural materials was closely related to the rapid urbanization process and the rapid development of the infrastructure construction industry in China in the past decade. Compared with national economic statistics [37], during 2006–2011, the total output value of the construction industry maintained a super-high-speed growth of more than 20% for six consecutive years as the pillar industry of economic growth, which caused large demand for structural materials.
In contrast, the occupation ratio of thermal comfort and sustenance demands in emission responsibility significantly reduced (thermal comfort reduced by 2.3% and sustenance reduced by 2.2%). The slowdown in emissions growth of thermal comfort was mainly related to the improvement of energy efficiency of heated/cooled system in building passive systems, which had been explained in Section 3.2.3. The slowdown in emissions growth of sustenance was related to the reduction of proportion of the primary industry such as agriculture [26]. This also reflected the rising of people’s life pursuit from sustenance to high-quality life.

3.2.6. Overall Trends

After comprehensively considering above analysis of each section, if we review the carbon flow Sankey diagrams combing demand side and supply side, we can discern the overall trends and interpret the inherent dilemma and of China’s energy low-carbon transition during 2005–2015. In this period, China was still in the stage of rapid industrialization and urbanization investing huge amounts of infrastructure construction and fixed assets (China invested CNY 4 trillion in infrastructure construction during 2008–2010 [38]), which kept the demand for structural materials huge and growing. This made the industry represented by steel, chemical and non-ferrous metal maintain booming, some even over-capacity. These energy-intensive industries relied on coal and electricity, which brought difficulty for the energy system to cut coal consumption and to decarbonize. Meanwhile, the structure of energy final services did have changed. An obvious trend was that people’s demand for high-quality life kept increasing, for example, the demand for passenger transportation, hygiene and communication services grew rapidly. Accordingly, the energy consumption and carbon emissions underlying the cars, planes, hot water supply and modern appliances increased rapidly, which could be new driving forces for energy-related carbon emissions. Discerning the trends may help policy makers to formulate more effective emission reduction strategies.

3.3. Uncertainties

Although authors have tried to make the method and data more accurate, uncertainties still exist in two aspects. One is the uncertainty of energy consumption data. When mapping the energy flow Sankey diagram, due to the lack of local data, the proportion of energy consumption in some sectors of factory passive systems and building passive systems referred to the average level of global-level research (see Appendix D.3.). Due to the outdated statistical data of the electric motors and light devices, we extrapolated relevant historical energy consumption data. Non-commercial energy consumption (although mainly are biomass including straw and wood which adopt carbon neutrality assumptions) related to CO2 emissions was not audited in this study due to a lack of official statistical data.
The other one is the uncertainty of carbon emission data. Although most of the emission factors used in this paper were from China’s local official statistics, there were still some data not provided referring the default values recommended by the IPCC [24], which lacked aboriginality to some extent. Carbon capture and storage technology were not discussed in this study as well.

4. Conclusions

This study proposed a method for systematically analyzing energy-related carbon emissions and quantitatively evaluating internal structural changes from the perspective of energy system. The method includes visualizing carbon flow process and emission responsibility allocation based on Sankey diagrams and energy allocation analysis and analyzing structural changes of carbon emissions based on TRO index decomposition which was put forward for the first time in our work. Then, this method was applied to China’s case. We mapped China’s energy-related carbon flow Sankey diagrams in 2005 and 2015 from energy sources, end-use conversion devices, passive systems to final services, then used TRO index decomposition to compare these two diagrams and reveal internal structural changes of carbon emissions caused by energy transition, finally discussed the trend and relevant reasons.
The results indicate that China’s huge investment on infrastructure construction during 2005–2015 expanded the demand for structural materials on the consumption side, which made some high energy-intensive industries such as steel, chemical and non-ferrous metal maintain their booming status or even led to over-capacity, thus making it difficult for the energy system to cut coal consumption and decarbonize, while a new trend was that people’s demand for high-quality of life kept increasing, and the demand for passenger transportation, hygiene and communication services grew rapidly. Accordingly, the energy consumption and carbon emissions underlying the cars, planes, hot water supply and modern appliances increased rapidly, which needed attention as new driving forces for energy-related carbon emissions. The results also provide a new perspective to analyze structural changes of energy-related carbon emissions from the terminal demand side. Compared with other statistics and studies, the method proved to be effective for analyzing energy-related carbon flow and evaluating structural changes.
However, there is still some uncertainty in processing of the energy data and emission factors. The limitation also lies in that the carbon emissions of energy loss in conversion stage were not considered separately in the analysis. In future work, the accuracy of the relevant data will be further improved, the impact of energy efficiency will be shown separately in carbon flow diagrams, and this method will be applied to more regions.

Author Contributions

H.Y. coordinated the main theme of this paper and wrote this manuscript. L.M. provided methodological guidance. L.M. and Z.L. discussed the research results and reviewed the manuscript. All authors have read and agreed to the published version of the manuscript.

Funding

This research received no external funding.

Acknowledgments

This work was supported by Tsinghua-BP Clean Energy Research and Education Centre. The authors also gratefully acknowledge support from Institute of Climate Change and Sustainable Development as well as Tsinghua-Rio Tinto Joint Research Centre for Resources, Energy and Sustainable Development. Finally, Honghua Yang wants to thank, in particular, the invaluable support from Yiwei Dai over the years.

Conflicts of Interest

The authors declare no conflict of interest.

Appendix A

Historical data of China’s primary energy consumption and energy-related CO2 emissions in 1965–2018 from British Petroleum (BP) statistics [13].
Figure A1. China’s primary energy consumption and energy-related CO2 emissions in 1965–2018, data from BP statistics [13] (the renewable energy includes hydroelectricity).
Energies 13 02076 g0a1

Appendix B

Table A1. China’s important energy policies during 2005–2015.
PolicyIssue Date
The 11th Five-Year Plan for Energy Development [14]2007
The Mid-Long Term Plan for Renewable Energy Development [15]2007
The 11th Five-Year Plan for Renewable Energy Development [16]2011
Renewable Energy Law of the People’s Republic of China [17]2012
The 12th Five-Year Plan for Energy Development [18]2013
Enhanced Actions on Climate Change: China’s Intended Nationally Determined Contributions [19]2015

Appendix C

In the energy Sankey diagram of this study, the energy sources reflect the sources (including indigenous production, import, export, and stock change) of various primary energy (including oil, coal, gas, biomass, and other) that input into the energy system. The intermediate conversion reflects different forms of utilization of primary energy, e.g., directly used as fuels for engines and burners, used for power generation and heat generation, used by energy industrials themselves, and transformed to other industrial materials. The end-use conversion devices are devices where the primary energy is converted into useful energy such as motion, heat, cooling etc. The passive systems are places where useful energy output by end-use conversion devices is lost as low-grade heat in exchange for final services, such as vehicle, factory and building. The final services are the goods and services provided by useful energy in passive systems, such as transport services, production services and living services. The detailed classification and description of each part in the Sankey diagram is listed in Table A2.
Table A2. Classification and description of each part in the Sankey diagram 1.
StagesItemsSub-ItemsDescription
Energy sourcesSource supplyIndigenous productionPrimary energy produced in China
ImportPrimary energy imported to China, including the fuel consumption of China’s aircraft and ships in foreign countries
ExportPrimary energy exported from China, including the fuel consumption of foreign aircraft and ships in China
StockPrimary energy from stock and to stock
Primary energyOilCrude oil, petroleum products, and liquids produced from other primary sources such as coal and biomass
CoalHard coal, lignite, coke, and coking products such as coke tar
GasNatural gas, coal bed methane, coke oven gas, gas works, and bio-gas
BiomassCombustible plant/animal products, and municipal/industrial wastes
OtherElectricity from nuclear power and hydro, electricity/heat from geothermal, solar, wind, tide, and wave energy; and electricity imported and exported
Intermediate conversion-FuelOil, biomass, gas, and coal directly used as fuel for engines and burners
ElectricityElectricity from power generation plant (including electricity for CHP plant) and other sources such as nuclear and renewable
HeatHeat from utility plants, CHP plants (heat proportion), and renewable sources such as solar thermal water heater and geothermal
Energy own useEnergy consumed by energy industries themselves
Non-fuelThe non-fuel use of energy sources for example in industrial materials
End-use conversion devicesMotionDiesel engineCompression ignition diesel (or fuel oil) engine: truck, bus, ship, train; agricultural machinery
Gasoline engineSpark ignition Otto engine: car only; and LPG engine
Aircraft engineKerosene engine: turbofan and turboprop engine
Other engineNatural gas (CNG) vehicles and electricity vehicles/train
Electric motorAC/DC induction motor (excl. refrigeration)
HeatOil burnerOil combustion device: boiler, petrochemical cracker, and chemical reactor
Biomass burnerWood/biomass combustion device: open fire, stove, and boiler
Gas burnerGas combustion device: open fire, stove, boiler etc.
Electric heaterElectric resistance heater, and electric arc furnace
Heat exchangerDirect heat application: district heat, heat from CHP, geothermal, and solar thermal
OtherCoolerRefrigeration, air conditioning: industry, commercial, and residential
Light deviceLighting: tungsten, fluorescent, halogen etc.
ElectronicComputers, televisions, handheld and portable devices
Passive systemsVehicleCarLight-duty vehicle: car, mini-van, SUV, and pick-up
TruckHeavy duty vehicle: urban delivery, long-haul, and bus
PlaneAircraft: jet and propeller engines
ShipOcean, lake and river craft: ship, barge, and ferry
TrainRail vehicle: diesel, diesel-electric, electric, and steam
Agro-vehicleAgriculture vehicles such as tractors
FactorySteelMining and processing of ferrous metal ores, smelting and pressing of ferrous metals and manufacture of metal products
Non-ferrousMining and processing of non-ferrous metal ores, smelting and pressing of non-ferrous metals
MineralMining and processing of nonmetal ores; manufacture of non-metallic mineral products
FoodProcessing of food from agricultural products, manufacture of foods, beverages and tobacco
TextileManufacture of textiles, apparel, footwear, and headgear
PaperManufacture of paper and paper products, articles for culture, education and sport activity; printing, reproduction of recording media
ChemicalManufacture of raw chemical materials and chemical products, medicines, chemical fibers, rubber, and plastics
MachineryManufacture of general-purpose machinery, special purpose machinery, transport equipment, electrical machinery, communication equipment, computers and other electronic equipment, measuring instruments and machinery for cultural activity and office work
AgricultureFarming, forestry, animal husbandry, fishery & water conservancy
ConstructionConstruction
OtherMining of other ores, manufacture of artwork and other manufacturing, recycling and disposal of waste, production and distribution of water, processing of timber, manufacture of wood, bamboo, rattan, palm, straw products, leather, fur, feather, furniture and related products
BuildingHot water systemHot tap water, e.g., shower water heaters and hot water for washing and drinking
Heated/cooled spaceResidential/commercial indoor space
ApplianceRefrigerators, cookers, washers, dryers, dishwashers, and electronic devices
Illuminated spaceResidential/commercial indoor space, and outdoor space
Final servicesTransportPassengerTransported by car, train, ship, and plane
FreightTransported by truck, agro-vehicle, train, ship, and plane
ProductionStructureMaterials used to provide structural support
LivingSustenancePreparation, storage, and cooking of food
HygieneClothes washing/drying, hot water use, and other household appliances
CommunicationDigital and written communication
Thermal comfortHeating and cooling of air in buildings, clothes, and other textile products
IlluminationProvision of light
1 Reproduced with permission from [6], Elsevier, 2012.

Appendix D

Appendix D.1. Data for Energy Sources and Intermediate Conversion

The data for energy sources and intermediate conversion are mainly obtained from the 2015 Energy Balance Sheet (Standard Quantity) in the China Energy Statistical Yearbook 2016 [25], including data of energy sources, conversion, and end use. The data of some renewable energy that are not contained in the yearbook (e.g., photovoltaics, solar heating and geothermal energy) are from China’s Utilization of Renewable Energy Sheet in the Energy Data of China 2016 [26].

Appendix D.2. Data for End-use Conversion Devices

The data for energy consumed for motion supply are calculated from oil and gas consumption by final sectors, which are referring to the 2015 Energy Balance Sheet [25]. The allocation of electricity among end-use conversion devices are assessed based on China’s official statistics of end-use power consumption [26,27]. The energy flows from conversion devices to passive systems are allocated as classification in Table A2.

Appendix D.3. Data for Passive Systems

In passive systems, the energy flows from engines (including diesel engines, gasoline engines, aircraft engines, and other engines) are input into the vehicle passive system. All of electric motors, and most of electric heater and electronic devices are input into the factory passive system. The rest of electric devices are allocated to the building passive system.
The flows of different vehicles are based on previous flows of engines and the proportion are estimated based on the energy consumption data of transportation [26], as shown in Table A3 (e.g., the diesel engines are used not only by trucks, but also by trains, ships, agro-vehicles and motors in factories).
Table A3. The shares of engines energy flows to different vehicles of China in 2015.
VehiclesCarTruckTrainPlaneShipAgro-VehicleTo Factory
Engines
Diesel-59%4%-15%9%13%
Gasoline100%------
Aircraft---100%---
Other48%-52%----
The proportion of heat flows into the factory and the building [25] is shown in Table A4.
Table A4. The shares of heat flows into the factory and the building of China in 2015.
Heat DeviceOil BurnerBiomass BurnerGas BurnerCoal BurnerHeat Exchanger
Passive System
Factory42%52%73%87%67%
Building58%48%27%13%33%
Due to lack of indigenous data, after getting the total input data, the fuel directly used in the factory is estimated based on the proportion of fuel used in U.S. industry [39] as shown in Table A5.
Table A5. The shares of fuel directly used in the factory.
Fired HeatingCoolingSteamOther
Fuel use47%2%42%9%
And the energy allocation of fuel and heat used in the building is estimated by the shares of household energy use on global average [40] as shown in Table A6.
Table A6. The shares of flows from fuel and heat to building systems on global average.
Energy TypeCoalBiomassOilGasHeat
Building System
Hot water13.4%10%10.3%13.4%-
Space heating59.1%44.1%51.6%61.8%82.2%
Space cooling--0.1%1.2%17.8%
Appliance27.5%45.9%36.1%23.0%-
Illuminated space--1.9%0.6%-

Appendix D.4. Data for Final Services

The energy flows from vehicles to transportation services are estimated from transportation statistics [26]. In this study, road transportation has been allocated (cars for passenger, trucks for freight), but shares of passenger and freight transport in other transportation (e.g., train, ship, plane) are estimated according to their utilization as shown in Table A7.
Table A7. The shares of flows from vehicles to transport services in China in 2015.
VehicleCarTruckTrainShipPlane
Transport
Passenger100%-33%-71%
Freight-100%67%100%29%
The energy flows from buildings to final services is estimated based on the global average data of household fuel use [40] and the data of electricity consumption by home appliances in China [26], as shown in Table A8.
Table A8. The shares of final services from building systems in China in 2015.
Building SystemsHot WaterHeated/Cooled SpaceApplianceIlluminated Space
Final Services
Structure--12%-
Sustenance2%11%16%-
Thermal comfort-89%1%-
communication--63%-
Hygiene98%-7%-
Illumination--1%100%
It is difficult to allocate energy flows from the factory passive system into various final services, because there are too many sub-sectors in the system serving for different final services. To simply the calculation, firstly, we divided the industrial sectors in the sheet of 2015 Final Energy Consumption by Industrial Sector (Standard Quantity) [25] into 11 groups as shown in Table A2 (factory). Then, the allocation of energy flows into relevant final services is estimated based on these subdivided departments. For instance, the steel, mineral, non-ferrous metals and construction are allocated into structure. The energy used for producing transport equipment is reckoned to be divided equally between the passenger and the freight. Some items in the machinery and other industrials whose usage can not be easily sorted (e.g., manufacture of general equipment, recycling of the waste) are assumed to be equally allocated among the various final services. Food and agriculture are allocated to sustenance. Textile flows to thermal comfort. Paper is allocated to communication.

Appendix D.5. Data for Energy-Related Carbon Emissions

In this study, we assumed that biomass is carbon neutral, other renewable energy (hydroelectricity, wind power, solar power and geothermal) and nuclear have no carbon emissions. Therefore, only the fuels listed in Table 2 are considered. The allocation of carbon emission responsibility in different sectors is calculated according to various types of fuel the sector uses. Since the use of different fuel types in the secondary energy (electricity and heat) is difficult to be distinguished in the consumption stage, we calculated the comprehensive emission factors of electricity and heat according to the supply structure in the 2015 Energy Balance Sheet [25], as shown in Table A9.
Table A9. The carbon emission factors of electricity and heat in 2015.
ElectricityHeat
Emission factor16.42 t C/TJ19.35 t C/TJ

References

  1. IPCC. AR5 Synthesis Report: Climate Change 2014. Available online: https://www.ipcc.ch/site/assets/uploads/2018/02/SYR_AR5_FINAL_full.pdf (accessed on 10 February 2020).
  2. Manepalli, J. Ways of “greening the economy”. In Green Energy Technology, Economics and Policy; CRC Press Inc.: Vienna, Austria, 2010. [Google Scholar]
  3. Soundararajan, K.; Ho, H.K.; Su, B. Sankey diagram framework for energy and exergy flows. Appl. Energy 2014, 136, 1035–1042. [Google Scholar] [CrossRef]
  4. Cullen, J.M.; Allwood, J.M. The efficient use of energy: Tracing the global flow of energy from fuel to service. Energy Policy 2010, 38, 75–81. [Google Scholar] [CrossRef]
  5. UK Department of Energy and Climate Change. Energy Flow Chart 2010. Available online: https://webarchive.nationalarchives.gov.uk/20130106133854/http://www.decc.gov.uk/assets/decc/11/stats/publications/flow-chart/2276-energy-flow-chart-2010.pdf (accessed on 10 February 2020).
  6. Ma, L.; Allwood, J.M.; Cullen, J.M.; Li, Z. The use of energy in China: Tracing the flow of energy from primary source to demand drivers. Energy 2012, 40, 174–188. [Google Scholar] [CrossRef]
  7. Chong, C.; Ni, W.; Ma, L.; Liu, P.; Li, Z. The Use of Energy in Malaysia: Tracing Energy Flows from Primary Source to End Use. Energies 2015, 8, 2828–2866. [Google Scholar] [CrossRef]
  8. Li, X.; Chong, C.; Ma, L.; Liu, P.; Shen, X.; Jia, Z.; Wang, C.; Li, Z.; Ni, W. Coordinating the Dynamic Development of Energy and Industry in Composite Regions: An I-SDOP Analysis of the BTH Region. Sustainability 2018, 10, 2093. [Google Scholar] [CrossRef] [Green Version]
  9. Davis, M.; Ahiduzzaman, M.; Kumar, A. Mapping Canadian energy flow from primary fuel to end use. Energy Convers. Manag. 2018, 156, 178–191. [Google Scholar] [CrossRef]
  10. Mu, H.; Li, H.; Zhang, M.; Li, M. Analysis of China’s carbon dioxide flow for 2008. Energy Policy 2013, 54, 320–326. [Google Scholar] [CrossRef]
  11. Li, X.; Cui, X.; Wang, M. Analysis of China’s carbon emissions base on carbon flow in four main sectors: 2000–2013. Sustainability 2017, 9, 634. [Google Scholar] [CrossRef] [Green Version]
  12. Ma, L.; Chong, C.; Zhang, X.; Liu, P.; Li, W.; Li, Z.; Ni, W. LMDI Decomposition of Energy-Related CO2 Emissions Based on Energy and CO2 Allocation Sankey Diagrams: The Method and an Application to China. Sustainability 2018, 10, 344. [Google Scholar] [CrossRef] [Green Version]
  13. BP. Statistical Review of World Energy—All data, 1965–2018. Available online: https://www.bp.com/en/global/corporate/energy-economics/statistical-review-of-world-energy.html (accessed on 10 February 2020).
  14. The 11th Five-Year Plan for Energy Development. Available online: https://www.ndrc.gov.cn/fggz/fzzlgh/gjjzxgh/200709/P020191104623138936402.pdf (accessed on 10 February 2020).
  15. The Mid-Long Term Plan for Renewable Energy Development. Available online: https://www.ndrc.gov.cn/xxgk/zcfb/ghwb/200709/W020190905497518622709.pdf (accessed on 10 February 2020).
  16. The 11th Five-Year Plan for Renewable Energy Development. Available online: http://www.nea.gov.cn/2011-08/22/c_131065984.htm (accessed on 10 February 2020).
  17. Renewable Energy Law of the People’s Republic of China. Available online: http://www.nea.gov.cn/2012-01/04/c_131260380.htm (accessed on 10 February 2020).
  18. The 12th Five-Year Plan for Energy Development. Available online: http://www.gov.cn/zwgk/2013-01/23/content_2318554.htm (accessed on 10 February 2020).
  19. Enhanced Actions on Climate Change: China’s Intended Nationally Determined Contributions. Available online: http://www.gov.cn/xinwen/2015-06/30/content_2887330.htm (accessed on 10 February 2020).
  20. IFU Hamburg. e!Sankey Software (2020). Available online: https://www.ifu.com/en/e-sankey/ (accessed on 10 February 2020).
  21. Liu, Z.; Guan, D.; Wei, W.; Davis, S.J.; Ciais, P.; Bai, J.; Peng, S.; Zhang, Q.; Hubacek, K.; Marland, G.; et al. Reduced carbon emission estimates from fossil fuel combustion and cement production in China. Nature 2015, 524, 335–338. [Google Scholar] [CrossRef] [PubMed] [Green Version]
  22. General Principles for Calculation of the Comprehensive Energy Consumption of the People’s Republic of China. Available online: http://c.gb688.cn/bzgk/gb/showGb?type=online&hcno=F2113A2857611297ECF9A1683BE77F15 (accessed on 10 February 2020).
  23. China Guidelines for Provincial Greenhouse Gas Inventories. Available online: http://www.cbcsd.org.cn/sjk/nengyuan/standard/home/20140113/download/shengjiwenshiqiti.pdf (accessed on 10 February 2020).
  24. IPCC. 2006 IPCC Guidelines for National Greenhouse Gas Inventories; United Kingdom Metoorological Office: Backnell, UK, 2006. [Google Scholar]
  25. China’s National Bureau of Statistics. China Energy Statistical Yearbook 2016; China Statistics Press: Beijing, China, 2016. [Google Scholar]
  26. Wang, Q. Energy Data of China 2016; China Energy Group: Beijing, China, 2016. [Google Scholar]
  27. Zheng, B.; Gao, F.; Guo, X. Survey Analysis of Lighting Power Consumption in China. China Light Lighting 2016, 10, 18–22. [Google Scholar]
  28. The 12th Five-Year Plan for Coal Industry Development. Available online: http://zfxxgk.nea.gov.cn/auto85/201203/W020120322368710161760.pdf (accessed on 10 February 2020).
  29. Zhang, G. The Way of Natural Gas Development in China: Concentrate on Making Great Achievements and Promote Development Through all Ownership Systems. International Gas Cooperation & Development Forum, Wuhan, China, 13 September 2017. Available online: http://www.ceweekly.cn/2017/0913/205096.shtml (accessed on 10 February 2020).
  30. The 13th Five-Year Plan for Modern Comprehensive Transportation System Development. Available online: http://www.mot.gov.cn/zhuanti/shisanwujtysfzgh/guihuawenjian/201703/t20170301_2170528.html (accessed on 10 February 2020).
  31. National Economic and Social Development Statistics Bulletin 2015. Available online: http://www.stats.gov.cn/tjsj/zxfb/201602/t20160229_1323991.html (accessed on 10 February 2020).
  32. Wang, J.; Zhou, Z.; Zhao, J.; Zheng, J.; Guan, Z. Towards a cleaner domestic heating sector in China: Current situations, implementation strategies, and supporting measures. Appl. Therm. Eng. 2019, 152, 515–531. [Google Scholar] [CrossRef]
  33. Zhou, K.; Yang, S. Emission reduction of China’s steel industry: Progress and challenges. Renew. Sustain. Energy Rev. 2016, 61, 319–327. [Google Scholar] [CrossRef]
  34. Profit Data of China’s Industrial Enterprises above Designated Size in 2015. Available online: http://www.stats.gov.cn/tjsj/zxfb/201601/t20160127_1310925.html (accessed on 10 February 2020).
  35. Li, H.; Wei, Y.; Mi, Z. China’s carbon flow: 2008–2012. Energy Policy 2015, 80, 45–53. [Google Scholar] [CrossRef] [Green Version]
  36. The Status of the Development of China’s Non-Metallic Mineral Industry and the Prospect of the 13th Five Year. Available online: http://www.cgs.gov.cn/ddztt/kydh/2016kydh/mtbb/201609/t20160922_405026.html (accessed on 10 February 2020).
  37. The 13th Five-Year Plan for Construction Industry Development. Available online: http://www.mohurd.gov.cn/wjfb/201705/W020170504041246.pdf (accessed on 10 February 2020).
  38. China’s State Council Executive Meeting Deploys Measures to Expand Domestic Demand and Promote Economic Growth. Available online: http://www.gov.cn/ldhd/2008-11/09/content_1143689.htm (accessed on 10 February 2020).
  39. Energy Use, Loss and Opportunities Analysis: U.S. Manufacturing & Mining. Available online: https://www.energy.gov/sites/prod/files/2013/11/f4/energy_use_loss_opportunities_analysis.pdf (accessed on 10 February 2020).
  40. Nakicenovic, N.; Gilli, P.V.; Kurz, R. Regional and global exergy and energy efficiencies. Energy 1996, 21, 223–237. [Google Scholar] [CrossRef]
Figure 1. The framework of the energy flow Sankey diagram.
Energies 13 02076 g001
Figure 2. China’s energy flow diagram in 2015, unit in EJ (1018 J).
Energies 13 02076 g002
Figure 3. China’s energy-related carbon flow diagram in 2005, unit in 10 Mt C (107 tons C).
Energies 13 02076 g003
Figure 4. China’s energy-related carbon flow diagram in 2015, unit in 10 Mt C (107 tons C).
Energies 13 02076 g004
Figure 5. The TRO index decomposition of energy-related CO2 emissions in 5 sections including: (a) Energy sources; (b) Vehicle; (c) Building; (d) Factory; (e) Final services. (f) The color of the dots in the diagram represents the total CO2 emissions of relevant sectors in 2015.
Energies 13 02076 g005
Table 1. Studies applying Sankey diagrams to energy system analysis.
SourceRegion, Metric and Date Stages of Energy Flow
Cullen and Allwood 2010 [4]Global
Energy flow (EJ)
2005
Energy sources, end-use conversion devices, passive systems, final services.
UK DOECC 2010 [5]UK
Energy flow (Mtoe)
2010
Primary supply, oil refineries and power stations, end use sectors
Ma et al. 2012 [6]China
Energy flow (EJ)
2005
Energy sources, end-use conversion devices, passive systems, final services, demand drivers
Chong et al. 2015 [7]Malaysia
Energy flow (Mtoe)
2011
Primary supply, secondary supply, end use
Li et al. 2018 [8]Beijing, Tianjin, Hebei province
Energy flow (EJ)
2013
Energy supply, transformation, end use
Davis et al. 2018 [9]Territories of Canada
Energy flow (PJ)
2012
Primary supply, electricity generation and oil products, end use
Mu et al. 2013 [10]China
CO2 flow (Mt)
2008
Energy sources, transformation, end use sectors
Li et al. 2017 [11]China
CO2 flow (Mt)
2013
Energy sources, end use sectors
Ma et al. 2018 [12]China
CO2 flow (100 Mt)
2004, 2014
Energy supply, transformation, end use
Abbreviations: GHG: Greenhouse gas; Mtoe: Million tons of oil equivalent; EJ: 1018 Joules; PJ: 1015 Joules; CHP: Combined heat and power; Mtce: Million tons of coal equivalent; Mt: Million tons.
Table 2. Parameters for Calculating Carbon Emissions.
CategoryFuelNCVCCV 3O
CoalRaw coal20,908 kJ/kg26.37 t C/TJ0.94
Cleaned coal26,344 kJ/kg25.41 t C/TJ0.98
Briquettes17,562 kJ/kg33.60 t C/TJ0.90
Other washed coal8363 kJ/kg25.41 t C/TJ0.98
Coke28,435 kJ/kg29.50 t C/TJ0.93
Other coking products 138,052 kJ/kg29.50 t C/TJ0.93
GasCoke oven gas17,353 kJ/m313.58 t C/TJ0.99
Blast furnace gas3763 kJ/m313.00 t C/TJ0.99
Other Gas5227 kJ/m313.00 t C/TJ0.99
Natural Gas38,931 kJ/m315.30 t C/TJ0.99
Refinery gas46,055 kJ/m318.20 t C/TJ0.98
OilCrude oil41,816 kJ/kg20.10 t C/TJ0.98
Gasoline43,070 kJ/kg18.90 t C/TJ0.98
Kerosene43,070 kJ/kg19.50 t C/TJ0.98
Diesel oil42,652 kJ/kg20.20 t C/TJ0.98
Fuel oil41,816 kJ/kg21.10 t C/TJ0.98
LPG50,179 kJ/kg17.20 t C/TJ0.98
Other petroleum products 235,125 kJ/kg20.00 t C/TJ0.98
1,2 Data of other coking products and other petroleum products are from the IPCC [24], while other values are from China’s official statistics [22,23]. 3 TJ is 1012 Joules.
Table 3. The TRO index decomposition of relevant sections.
ItemSection 1T 2/MtR/%O/%Section 1T 2/MtR/%O/%
Energy sourcesCoal307671−1.2Oil53258−1.6
Gas4142052.8
VehicleCar2311589.5Truck10656−8.1
Agro-V261400.8Plane481632.0
Ship1118−5.2Train441200.9
BuildingHot water143762.2H/CS24242−4.7
Appliance1101584.1ILLS11745−1.6
FactorySteel851840.2Non-Ferrous3261712.9
Mineral30860−2.0Food6660−0.5
Textile7048−0.9Paper2223−1.0
Chemical6491012.0Machinery172890.2
Agriculture3324−1.4Construction881260.5
Other59840.0
Final servicesPassenger3411662.1Freight21357−0.9
Structure2218923.9Sustenance22443−2.2
TC32349−2.3COMM13676−0.1
Hygiene1391090.5ILL12845−1.1
1Abbreviations: Agro-V: Agro-vehicle; H/CS: Heated/cooled space; ILLS: Illumination space; TC: Thermal comfort; COMM: Communication; ILL: Illumination. 2 The total amount change of carbon emissions here is calculated as carbon dioxide while the data in Sankey diagrams are calculated as carbon element.

