1. Introduction
Competence in performing Building Performance Simulation (BPS) is a fundamental skill for energy specialists. Teaching BPS with the aim of training students to predict and critically analyse the results may be challenging, especially in courses with students of diverse backgrounds [
1], often with no previous experience in BPS and when time for class teaching is limited.
Lund University, Sweden, provides a two-year Master Programme in Energy-Efficient and Environmental Building Design [
2], yearly attended by about 25 international students with a background in engineering and architecture. The Master programme adopts BPS during both years. The scope of teaching BPS is to generate a tight link between education and practice, which is in line with the expectations of students enrolling in this type of courses [
3] and with the vision of the International Building Performance Simulation Association (IBPSA) [
4].
Previous teaching experiences and informal conversations with students suggested that students struggled to reach high competence levels in BPS, like predicting the effect of changes in the building envelope on the final energy use. In order to improve the introduction in BPS, a new guided method to BPS was introduced. The method was called ‘control method’.
The control method was conceived for students with limited or no experience in BPS, different educational backgrounds and where time to teach BPS in class is limited. The control method does not aim to teach BPS faster or at a more advanced level, rather it tries to bring the entire class to a level of knowledge where each student feels capable enough to run and interpret a simple BPS in a methodically correct way.
This paper describes the control method from a pedagogical perspective. Later, it evaluates the method based on two small studies. The first study is published elsewhere [
5] and only its main findings are reported here. The second study provides a more in-depth analysis of: I) the area of concerns identified in [
5], and II) the development of self-reported competence in BPS following the introduction of the control method.
1.1. BPS in Engineering and Architectural Education
Traditionally, BPS complemented the learning of building physics theory. However, teaching of BPS is rapidly becoming a topic in and of itself and, not surprisingly, literature on pedagogical approaches to BPS teaching has been expanding relatively fast in recent years. A review study by Alsaadani and Bleil de Souza (2019) identified two main approaches resulting in three different teaching paradigms to teach BPS [
6]:
domain-specific approach, aiming at training the BPS student as an
user-centric approach, aiming at training the architectural student to be a BPS
The ‘expert’ teaching paradigm is prevalent in older literature, arguably because many BPS tools were domain-specific, due to interface constraints and limited computational power. Parasol, for example, is a DEROB-based BPS software that focuses on solar and thermal properties of windows. The software, which was developed and validated only fifteen years ago at Lund University [
7], presents an interface that today would be considered as outdated. There are limited functionalities, almost no possibility to customise the room model, and it works for only a thermal zone. Yet Parasol allows a critical and in-depth analysis of solar and thermal properties of windows, which can truly support users’ understanding of theoretical building physics knowledge.
Today’s BPS tools is more closely connected to the architectural workflow; there is a connection with a 3D modelling environment to draw models with complex geometry, generate parametric designs, investigate different physical phenomena together, and run simulations requiring high computational resource, like extensive image-based daylight glare analysis. BPS tools have become necessarily complex, in both interface and underlying mathematical models. Arguably, the user-centric approach with a BPS ‘performer’ or ‘consumer’ are the product of such technological shift. ‘Performers’ and ‘consumers’ operating on complex BPS are possibly more prone to generate unreliable BPS predictions [
8] or making erroneous assumption on some of the input variables [
9]. The risk is that BPS does not reach its final high-level goal, namely, to mitigate environmental impact of buildings [
9].
Because of the importance of having a deep understanding of the complex links between buildings physics, design and simulation process, our standpoint is that education should train ‘experts’ or ‘performers’, even when the profession will require them to be ‘consumers’. However, a recent survey carried out in Spain showed that over 70% of architects are BPS ‘consumers’ and they consider learning BPS challenging [
10]. Beausoleil-Morrison (2019) proposed an ‘expert’ teaching paradigm to modern BPS tool by theorising an experiential learning model [
11]. In respect to traditional building physics curricula, this teaching approach integrates, rather that juxtaposing, the learning of BPS with theory. On the practical side, it would require a revision of building physics courses, which can be difficult to implement in the short term.
However, it is desirable to train the ‘expert’ even with basic simulations, as a smooth and gradual interaction with BPS promotes confidence among students and allows students to move independently to more specific tools at a later stage [
10]. Such training—of which the ‘control method’ is a possible approach—can be implemented already today in existing building physics curricula.
1.2. Existing Methods to Introduce BPS in Classes
There is a lack in literature for a universal pedagogical approach to teach BPS, but several studies reported on specific methods that can be re-used [
6]. Therefore, we conducted a small review on those methods before conceiving ours.
Reinhart et al. (2012) introduced a game-based method to improve students’ understanding of different design solutions [
12]. The game proposes a range of design choices that, combined, offers about 400 000 solutions with different energy use intensity (EUI) and costs; student groups achieving the lowest EUI and acceptable costs were awarded with extra credits in their examination [
12]. The method focuses on how to inform design, while, in our course, there was a need to develop basic BPS skills. Togashi, Miyata and Yamamoto (2020) [
13] adopted an analogous approach to [
12]. They created a competition to optimise energy use and thermal comfort by operating the HVAC of cybernetic office buildings HVAC. Thirty-three participants from academy and industry participated in this ‘championship in cybernetic building optimisation’, which resulted in more than 12% reduction of energy use in respect to the base case scenario [
13]. This initiative was also interesting, but it was addressed to skilled professionals. A third competition-based method was addressed to beginners [
14]. In this method, the trainer provided a full-modelled building in IDA-ICE. A number of building parameters were not optimised; the students were required to identify and optimise such parameters in a two-step process. First, the students defined and optimised areas of intervention (e.g., building envelope). Second, the students could choose any combination of measures leading to energy performance optimisation. The competition regarded this second step [
14]. However, the method does not focus on modelling skills, as the students are provided with a complex and fully functional model from the beginning. Instead, in our course, we need to introduce the student even to the modelling part.
Charles and Thomas (2009) [
15] described experiences of teaching BPS tools to undergraduate students by using a real-life consultant/architect interaction. They invited practicing experts as guest lecturers/consultant(s). The consultancy was booked for more occasions during the whole duration of the course. In each occasion, the practicing expert provided consultancy only on specific issue(s) of the BPS (energy, light, airflow, water, etc.). This forced students to come prepared to their design studio to get feedback from the expert on that specific issue only, which is a sort of domain-specific approach. One of the outcomes was that simulations were performed iteratively and in a timely fashion so that the simulation results could really be part of the design process [
15].
Rabenseifer (2015) highlighted three obstacles in learning BPS for beginners: (i) complexity of quality software, (ii) time for modelling and (iii) existence of many different standards to describe identical building physics issues [
16]. The author illustrated a method based on a simple generic simulation model controlled via external custom interface aiming at overcoming such obstacles [
16]. The control method is, to some extent, similar to what Rabenseifer (2015) proposed, since it provides a ready-made model to start with, and it reduces the degrees of freedom in the model in order for the students to deal more easily with complex software. Differently from Rabenseifer (2015), the control method uses a commercial ‘complex’ interface, and it compares the results with these from a basic degree hour model using Excel.
Moving from stand-alone methods to more generalised pedagogical frameworks, Beausoleil-Morrison and Hopfe [
17] formalised a teaching approach to BPS based on the Experiential Learning Theory (ELT) by Kolb [
18]. The framework is based on a continuous cycle in which the student recursively faces theoretical learning, application of BPS, analysis of BPS results, and reflections linking learning experience to theory. The framework was applied successfully to students with no previous experience on BPS, which were able to handle two BPS tools in just three weeks of training [
11]. One issue highlighted by Beausoleil-Morrison [
11] is that the ELT-based framework does not assure that students could make reliable predictions. The issue of making reliable predictions is commonly highlighted in literature [
8,
19] and most of BPS trainers have probably experienced that in their careers.
Therefore, Beausoleil-Morrison [
11] further developed the ELT-based framework and extended it to a so-called BPS learning spiral. In the generalisation of this model, several of the continuous cycle “theoretical learning > application of BPS > analysis of BPS results > and reflections linking learning experience to theory” are interconnected. Together, they built a learning spiral aiming at a full understanding of BPS, from underlying theory to the actual handling of software. By providing specific examples from teaching experience, the author demonstrated that the framework allows students to make more reliable predictions, and they gain confidence in simulating. The full implementation of this method would require an entire semester, but the method is modular to some extent. For shorter courses—as for the case of considered in this paper—a trainer may simply use less cycles and leave the remaining cycles for follow up sessions.
Interestingly, the control method is somewhat similar to the BPS learning spiral. However, while the control method is built on expected learning outcomes, the learning spirals are built on the students’ learning process [
11], see
Section 2.3.
2. Methods
2.1. How BPS is Introduced in the Master Programme
The structure of the Master Programme is shown in
Figure 1. The schedule alternates three months with theoretical course and three months with a project course.
The first half-semester course, called “Energy use and thermal comfort”, includes ten hours of practical introduction to BPS. The control method is introduced in those ten hours. A substantial amount of self-study, around 150 h, is also expected. In the following “Passive house” course, the students design their own building and verify that it meets the passive house criteria. The students carry out the work independently in this course, and the teachers provide tutoring.
In both courses, the students work in groups of three or four members. The teachers create groups by mixing educational backgrounds, country of origin and gender. Literature on group cognition seems to support collaborative learning in small groups [
20], particularly for computer technology [
21,
22]. Diversity should be an added value, although diversity in the team’s expertise may negatively affect the quality of teamwork [
23].
In order to prepare students to the profession, the BPS tools which are introduced are software widely used among Swedish and international practitioners. They consist of three different tools: a 3D modelling interface (Rhinoceros 3D [
24]), a visual programming environment (Grasshopper, GH [
25]), and the actual energy simulation engine (EnergyPlus, E+ [
26] via Archsim [
27] or Honeybee [
28]).
Prior knowledge of building physics is an admission requirement for the Master programme, but the knowledge level can be very different and maybe never applied to a project.
In summary, the students face the following challenges:
they have (or may have) to learn up to three different new tools at the same time to be able run their first BPS,
they must understand the relationship between the energy performance of a building, its geometry and its characteristics, which is actually the goal of the two courses, Energy use and thermal comfort and Passive house.
they must learn to work effectively in groups with teammates from diverse backgrounds.
2.2. The Control Method in Practice
After the theoretical lectures in the
Energy use and thermal comfort course, the lecturer provides an Excel sheet for calculating the annual energy intensity of a simple shoebox (
Figure 2), which is based on the Swedish Building Code BBR [
29]. The Excel sheet is based on a degree hour method and the calculation considers transmissions losses through the building envelope, ventilation and infiltration losses, the thermal mass, and a template value to account for internal loads and solar gains, see
Figure 3.
In previous years (indicated as C2017 in
Figure 3), as assignment, the students were required to model a shoebox identical to the one calculated in Excel and try to match the resulting annual energy use intensity by forcing the dynamic simulation to be ‘static’, for example by creating a weather file with constant outdoor temperature. However, the students were not able to link differences to physical factors, software issues or errors by the student. In 2018 and 2019, the control method was introduced in the course structure (
Figure 4).
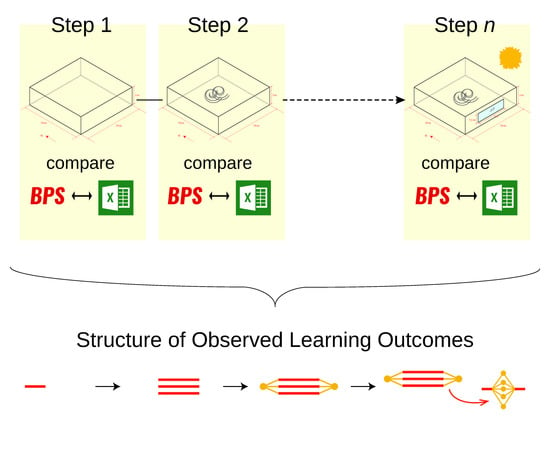
In the control method, the comparison is guided step by step by the teacher. The control method considers the shoebox, initially without windows (Step 1). The annual energy use intensity and the energy peak load simulated with BPS tools are compared to those from Excel. Then, the window (
Figure 2) is included for the following steps described in
Table 1. The final step is to add irradiation and a varying ambient temperature, but in this case, Excel is not able to calculate that. Differences in results between BPS and Excel are provided to students (
Table 1).
The teacher runs each simulation step together with the students. This has two important advantages:
If the student gets a different result, she/he is immediately aware of some errors at that step in her/his simulation; hence, the student can check in detail where the error was made. To support students in that, they are provided with video tutorials on Vimeo explaining how to redo the control method at home.
On the contrary, if results match, the student knows that the difference between BPS and Excel depends on underlying equations and approximations, and not on her/his own mistake; hence, the student may autonomously scrutinise the theoretical reasons of such difference. To support the students in that, they are provided with the documentation of E+ and they are invited to incite students to perform further research.
2.3. Pedagogical Background of the Control Method
In a pedagogical perspective, the control method was built on the expected learning outcomes (or competences) from the course. Those were categorised according to the Structure of Observed Learning Outcomes (SOLO) taxonomy by Biggs and Collis [
30]. The SOLO taxonomy classifies the learner’s competence based on growing complexity of learning outcomes (
Figure 5). The level of competence moves from initial surface to deep understanding. Lower levels of competence (
prestructural to
multistructural) are associated to a more quantitative knowledge (collection of information), while higher levels of competence imply learner’s capacity to integrate such knowledge in a consistent whole (
relational level), or even to generate new consistent knowledge (
extended abstract).
Most of the students enter the course with a unistructural (e.g., they know only how to handle 3D modelling) or a multistructural level of competence (e.g., they can model in 3D and run an energy simulation, but they cannot give an interpretation to the results). The control method aims at approaching a relational level of competence at the end of the first ten hours of introduction to BPS. The students may autonomously reach an extended abstract level of competence in the following “Passive house” course, where they design their own building, make assumptions, try different solutions, and test the result.
While the control method was created in terms of expected learning outcomes, it implies implicitly a spiral learning process similar to the one proposed by Beausoleil-Morrison [
11]. Indeed, during classes, the students experience what the learning spiral called “study theory” and “simulation exercise” modes of learning. The deep reflection occurring after class and during the “
Passive house” project course, may account for the “autopsy” and “reflect and connect” modes of learning [
11].
2.4. Evaluation of the Control Method
The evaluation consisted of online surveys handed in to three classes: C2017, C2018 and C2019, see
Figure 6. Only in C2018 and C2019, BPS was introduced through the control method. A first evaluation included C2017 and C2018 and it consisted of an exploratory between-subjects design. A second evaluation included only C2019 with a within-subjects design. The surveys were sent at the end of the
Passive house project course (
Figure 6). The link to the survey was sent via mail. The mail informed that the survey aimed at understanding and improving teaching of BPS, and that participation was voluntary and anonymous. No information about the introduction of a new teaching method in C2018 and C2019 was given.
The following was collected in both evaluations:
In the first exploratory evaluation, students from C2017 and C2018 class were surveyed via open-ended questions addressing challenges in learning of BPS (
Appendix A,
Table A1). The data analysis was performed via thematic coding approach [
32]. A limitation of this first evaluation is that surveys were handed in December 2018, which is one year after the end of the course for the C2017, but right after the end of the course for C2018 (
Figure 6). More information is provided in [
5].
Findings from the exploratory study allowed a more targeted investigation in C2019. In this evaluation, the learning outcomes were assessed via closed-ended questions complemented by open-ended reflections (
Appendix A,
Table A2). The questions consisted of a self-assessment of competences in respect to 3D modelling, visual programming, and energy simulation. Each option in the closed-end questions corresponded to a description of students’ own competence in the framework of the SOLO taxonomy. In addition, a specific open-ended question on group work was added (
Appendix A,
Table A2).
3. Results
3.1. Background and Previous Experience
Seven students of C2017 (34% response rate) and 17 students of C2018 (81% response rate) answered to the first evaluation. In C2019, 15 students (56% response rate) answered to the questionnaire before the course, but only ten of those (37%) answered also to the follow-up after the course.
There was a majority of European students in C2017 and C2019, and a majority of students from outside EU in C2018 (
Figure 7). The classes were similarly split in architects and engineers, although in C2018 there was a majority of architects.
The experience level of 3D modelling has increased over the years, going from about 50% of the students having had some training in 3D modelling in C2017, to almost all student in C2019. The experience with visual programming also increased over the years, but it remained an asset for a minority of students. In C2017, only one student out of seven declared experience in visual programming, while three out of ten declared the same experience in C2019. Finally, roughly a third of the students in each class had some previous experience with energy simulations.
The architects in all classes have more experience in 3D modelling (93%), in respect to the engineers (62%). There are no differences in previous experience in visual programming between architects and engineers (about 20% with previous experience in both groups), while more engineers (37%) than architects (17%) have run some energy simulation before entering this master. AutoCAD (71% of engineers/53% of architects) and Revit (58%/40%) were the most widespread software tools in both groups.
3.2. Results from the CEQ
The answers to the CEQ questionnaires were handed in by 16 students in C2017 (76% response rate), 15 students in C2018 (71% response rate) and 19 students (66%) in C2019.
The course received positive CEQ scores in all editions (
Figure 8). After the introduction of the control method, the scores were higher for all the items except “Appropriate assessment”. The improvement is more marked for the items “Clear goals and standards”, “Generic skills”, and “The course seems important for my education”. The overall satisfaction also increased after the introduction of the control method.
Students could provide free-text answers. In that section, we looked for BPS-related answers. C2017 students answered amongst others that they had a good experience with the Excel sheet, but they wanted more time to understand “Grasshopper” (which could mean GH or BPS connected to GH). Students were also complaining about the amount of different software to be learned. The students in C2018 and C2019 thought it was positive to learn multiple programs. They judged the comparison between Excel and BPS “interesting”, but C2018 also stated that they needed more time to learn BPS.
3.3. Evaluation of the Control Method
3.3.1. First Evaluation, C2017 and C2018: Exploratory Study
The thematic coding analysis of the students’ answers identified three main thematic areas: learning BPS tools in general, visual programming and group work. More detailed results are provided in [
5].
The first thematic area, learning of BPS tools, did not show major differences between C2017 and C2018. The students recognised the powerfulness of the three tools taken together (Rhino, GH, E+), but they identified a steep learning curve. Despite some initial difficulties, students of both classes thought that the learning of BPS with those tools would represent a huge asset for them in their future professions. They pointed out that the choice of set of tools was appropriate for the course purposes.
The second thematic area dealt with visual programming, in particular GH. In this aspect, there was a clear improvement between C2017 and C2018. In C2017, most of answers were negative and the discussion focused on the actual handling of GH. There were almost no comments about energy simulations, as if this was not a course topic. In C2018, comments on GH reduced drastically. Positive and negative feedback were on some specific aspects of any of the three BPS tools, including E+.
The third thematic area regarded group work. In C2017, three out of seven students reported that they split their work based on expertise, working as a cooperative group. In C2018, only one student out of seventeen had a similar comment, suggesting that C2018 worked in a more collaborative way. It seems that frustration promoted cooperative learning in C2017, namely since students could not handle all the difficulties together, they split work equally.
3.3.2. Second Evaluation, C2019: Self-Reported Competence
The students reported higher levels of learning outcomes after the application of the control method in all the three BPS tools (
Figure 9).
There was a marginal improvement in 3D modelling, with only four students reporting higher level of understanding and two students reporting a lower one.
On the contrary, there was a pronounced improvement for visual programming and energy simulations, which was statistically significant at p < 0.05 for a simple sign test.
Levels of learners’ understanding raised from
unistructural (μ = 2.30, SD = 0.483) to
relational (μ = 3.90, SD = 0.568) (
p < 0.05) for visual programming, i.e. GH. In this case, there was consensus among students, as eight out of ten respondents believed to be able to use GH to both build a 3D model and run a simulation (
Appendix A,
Table A2).
For energy simulation, i.e. E+, the self-reported learning outcomes raised from pre-structural (μ = 1.80, SD = 1.476) to relational (μ = 3.90, SD = 0.994, p < 0.05).
The students had room for comments in the surveys. About 3D modelling, students appreciated Rhinoceros 3D for its capability to integrate with additional software, like GH and E+. However, a student highlighted that similar capabilities are offered by more well-known software, like Revit. Another student, who had no previous experience in 3D modelling, criticised that the tool has a steep learning curve, which takes up time from learning of building physics principles. One student clearly mentioned that she/he accessed the video tutorials provided with the control method, and the comments from other students seemed to imply the same.
All the students claimed a steep learning curve for GH and little intuitiveness of the interface at first. However, in sharp contrast with C2017, they were not frustrated. They were simply aware that more time should be allowed in order to have full control on the tool. A student recognised that lectures only are not sufficient to explore the tool and self-study time is needed. They were enthusiastic that GH was introduced in the course.
The final and perhaps most important part, the actual energy simulation, was largely discussed. The students had contrasting feelings about being provided with a pre-programmed simulation as the control method does. In part, they thought that this was a smooth way to get started, but they also claimed difficulties to emancipate from the pre-programmed example. In addition, students mentioned that, sometimes, it could be difficult to understand underlying equations in a simulation. The simple fact that students are actually thinking about underlying equations in this introductory course in BPS was a positive sign in itself and a clear change from C2017.
3.3.3. Second Evaluation, C2019: Group Work
The students were generally positive about group work both before and after the course.
Cooperative learning could be a risk in big groups, according to two students with previous experience with group work. One student believed that three members is the optimal size. Another student pointed out that group work helped in fully understanding all aspects of the course, which could not be covered by teachers. Due to diverse background, each group member had some knowledge to share and which the other teammates could benefit from, which is what collaborative learning aims for. However, one student out of the ten claimed that some team members ended up working on tasks where they had more experience in instead of broadening group knowledge (cooperative learning).
The students highlighted the diversity of the group members as a learning driver. Before the course, they had high expectations on knowledge and value sharing within the group. Although this view did not change after the course, students’ opinions were multifaceted. For example, a student recognised that diversity comes with initial difficulties in communication among members. Another student thought that teammates with different educational backgrounds complicated the work, but she/he claimed that frictions in the group were a valuable learning lesson for themselves. Two students raised the issue of choosing members. The first suggested that choosing teammate autonomously would be more effective in order to achieve the result. On the contrary, the second student suggested that random selection of teammates should be kept, but also suggested having a sort of statement of contribution, supposedly because not all classmates equally contributed to the deliverables.
4. Discussion
The background of the three classes was rather homogeneous. Few students responded for C2017, probably because the survey was submitted one year after the course and students were less willing to reply. Since C2017 is the only “control” group, i.e., before the introduction of the control method, it is difficult to make robust comparison between the traditional and the control method strategies to teach BPS. However, discussion on strengths and weaknesses of the control method is still possible.
The first thematic area found in the exploratory study, which dealt with BPS tools, was more difficult to identify in C2017. In C2017, indeed, most of concerns about BPS tools focused on GH only, with ubiquitous criticism to this tool. Visual programming was not common in the previous education of students, thus difficulties in learning this tool were predictable. There were indications that the control method in C2018 improved development of competence in BPS. Such indications were confirmed for C2019. The students gained competence and confidence, especially in the visual programming part, which was the most critical. At the same time, they also reported a considerable increase in competence in energy simulation (E+), which is the main goal of the control method. Moderate developments in competence about 3D modelling were expected as this is part, but not a focus of the course. Independently from the teaching method, an improvement in competence after the course should be expected, but such improvement was marked for C2019. This seems to support the effectiveness of the control method.
For visual programming and energy simulations, the students self-reported a relational level of competence, which falls below the extended abstract to which the control method aims. This could depend on several factors. It is possible that the control method is too simple, and it should include further and more challenging steps. Another, and somewhat similar, hypothesis, is that the project course passive house is too challenging, and students feel lost despite a smooth—yet basic—introduction to BPS.
Finally, group work has been highly appreciated by students in C2019. It is difficult to conclude whether the control method alone could promote collaborative learning, but there some indications in this sense. As mentioned, several students reported that diversity contributed to the knowledge of the whole group. If operative issues are less problematic, it is plausible that group member could equally contribute to the group work and they could engage in higher-level reflections on the assignment.
In the wider perspective of introducing BPS to beginners, the control method aimed at train ‘expert’ users for basic simulations. The ‘expert’ teaching paradigm requires a ‘training ladder’ [
6] which goes through structured exercise in controlled environment. However, today’s BPS tools are not designed to conduct a control method, as proposed and implemented in this study. The control method as presented here required, for instance, an adaptation of weather data, for which there is no standard procedure and might in some cases lead to errors in the program. Adding possibilities to perform such a control method, or for instance having the possibility to ‘turning off the sun’, would make it easier to make a step-by-step introduction to the program.
Another point is that BPS tools can be divided into two main groups: either the tool has a simple user interface is very simple, thus considering a lot of simplifications and assumptions without the user knowing it; or the user interface is very complicated, allowing the user to set more settings, but also results in a very steep learning curve. Students using BPS with a more simplified user interface will, after starting to use the program, face the problem that they want to increase the complexity of the model, which is not possible within that specific program. Pre-programming an advanced program so it can meet the level of new users (students) is one option, but this requires a high competence of the teachers as well as it might make the software look as it is very easy to handle because the students get a ready solution.
5. Conclusions
This paper illustrates a simple method, called control method, used to introduce building performance simulation to beginners with a diverse background. The method was created for classes where there is little time for class teaching, and more time for self-study. The goal is to increase students’ individual competences of building performance simulation in terms of critical thinking and analysis of results.
The method is based on the expected learning outcomes, framed into the SOLO taxonomy. The method was implemented in two editions of the same course and then evaluated via two surveys: the first exploratory, the second addressing self-reported competence in BPS.
The surveys showed an increase of self-reported competence in visual programming and energy simulation after the introduction of the control method. The open comments showed that the students introduced to BPS via the control method were more aware of the potentialities and risks associated with BPS, while students who did not experience the control method generally provided comments only on operative issues with software tools. Comments on group dynamics indicated that the control method may also support collaborative learning.
In conclusion, the control method seems to offer a smooth way to introduce BPS in classes with diverse background and knowledge. However, the control method could benefit from more time dedicated to its guided introduction. Although the study could not provide evidence to judge whether the control method was actually beneficial to make reliable prediction of results of BPS, the fact that the students had a desire and allocated time to dig into these results is certainly a positive sign in this direction.


