Article

Ideology and Value Determinants of Public Support for Energy Policies in the U.S.: A Focus on Western States

School of Public Policy, Oregon State University, Corvallis, OR 97331, USA
*
Author to whom correspondence should be addressed.
Energies 2020, 13(8), 1890; https://doi.org/10.3390/en13081890
Submission received: 17 March 2020 / Revised: 6 April 2020 / Accepted: 9 April 2020 / Published: 13 April 2020
(This article belongs to the Special Issue Social Acceptability of Alternative Energy Technology)

Abstract

:
Energy policy is often a contentious issue in the U.S. in the areas of infrastructure, conservation, and price discrimination. From the siting of new pipelines, conservation regulations, and variable pricing based on times and usage, many policies have been met by intense opposition as well as support from a variety of sources. In this context, this study examines individual-level attributes (e.g., political ideology, environmental values, and demographic characteristics) that lead to support for or opposition to infrastructure, conservation, and price discrimination policies. The identification of demographic and value correlates of energy policy preferences is important for the successful development of energy policies. Data from 2019 random household surveys in the U.S. western states of California, Idaho, Oregon and Washington are used to examine the variation in views on a variety of energy policies. Multivariate analyses reveal that those with more liberal political ideology and people holding stronger pro-environmental values (as measured by the New Ecological Paradigm) were more likely to support conservation campaigns, energy efficiency, funding for renewable energy technology and price discrimination policies than those who held more conservative views. Several demographic variables also have a significant impact on support for or opposition to policies concerning infrastructure, conservation, and price discrimination. Younger people and people with higher levels of formal education are more likely to support voluntary energy conservation campaigns and increased funding for research into renewable energy technologies, and people with higher incomes are more supportive of requiring high-energy efficiency standards in new construction. Finally, state residency independently affected policy preferences with Idahoans’ views more consistent with political conservatives and those lower on the NEP than residents of the other three western states. These findings should be useful to policy makers as they work toward the development of energy policies.

1. Introduction

The United States is the second-highest global greenhouse gas (GHG) emitter [1], emitting almost 15% of total GHGs into the atmosphere [2]. Continued accumulation of GHGs in the Earth’s atmosphere is accelerating global warming and exacerbating the existential climate change crisis. The majority of GHG emissions (65%) comes from carbon dioxide (CO2), a byproduct of burning fossil fuels and land use degradation [1]. Although awareness of climate change is at an all-time high, and state action on reducing GHGs is on-going, in 2018 the United States consumed more energy than any other year [3] since 2010, indicating work is needed to quickly align carbon reduction strategies with policy actions. While there are many potential policy options to minimize CO2 (and are not mutually exclusive), public input on policy preferences is crucial to policy acceptance and implementation.
Using a survey conducted in the western U.S. states of Washington, Oregon, California, and Idaho, we examine public acceptance of varying infrastructural, conservation, and price discrimination energy policies. Specifically, we explore how environmental values, political ideology, demographic variables and geography inform policy preferences. By understanding underlying variables impacting energy policy preferences, it is an opportunity for policy makers to focus on energy policies that have the greatest potential for public acceptability. Further, it can help illuminate where resources into education, incentives, and investments can generate public support.

2. Background

2.1. Literature Review

As the United States grapples with large-scale reduction of carbon emissions (and GHG emissions generally) to address climate change, Americans have increasingly supported energy policies that will lessen the carbon footprint. For example, a study in 2018 found that 85% of Americans favored their state utilities to produce 100% of electricity from renewable resources by 2050 [4]. Further, 58% of Americans feel that a renewable energy transition will improve the economy and create jobs [4]. Examining which policies Americans will support to transition to clean energy is a bit more nuanced. For example, while a majority of scientists (65%) support nuclear energy as part of a clean energy portfolio, only 45% of the public support nuclear [5] with 53% of Americans believing nuclear energy is “harmful” [4]. While overall support for a clean energy transition is positive, obtaining the right mix of infrastructural, conservation, and pricing policies can depend, in part, on public support or opposition to different policy tools.
For the U.S. to move forward on a comprehensive clean energy strategy, “there exists a need to understand the state of public opinion relating to energy preferences” because“ trade-offs wills have to be made in funding supply-side (such as new energy production) versus demand-side (such as energy conservation) research initiatives” [6]. Many studies have found individual variables in support for, or opposition to environmental policies based on demographics, political ideology, environmental values, and geography warranting a closer look at how these variables can potentially inform energy policy preferences.
Demographic variables that have been shown to influence views on environmental policies include income, gender, education and age. Higher income individuals, for example, are more likely to support renewable energy [7,8] as well as a carbon tax [9]. Research finds that women are more likely to support renewable energy [10], are more willing to pay for a carbon tax or for energy research and development, and are more opposed to fracking than are men [8,9]. Education has also shown to be associated with certain viewpoints with people with higher levels of formal education [9,10] being more favorable of environmental policies in general, as well as supporting government policies for renewable energy [11]. With respect to age, older individuals are less likely to be willing to pay for a carbon tax [9], and more likely to support greater energy production in the U.S. like fracking [6,12] when compared to younger individuals, who show more support of renewable energy technologies [11].
The New Ecological Paradigm (NEP) is a scale created by Dunlap et al. [13] to measure “pro-environmental” orientations. Research reveals that holding a higher NEP score is associated with strong support for climate mitigation policies [14] including support for renewable energy [11,15,16]. Consistent with these studies, Olson-Hazboun et al. [17] found that the NEP was negatively related to support for fossil fuel and nuclear energy development, but only slightly related to renewable energy development. Additional research by Steel et al. [11] and Pierce and Steel [18] found a strong correlation between NEP scores and support for renewable energy technologies such as wind, solar and wave in U.S. western states. Support for traditional energy sources and technologies was higher among those with lower NEP scores.
Several scholars have noted the increasing ideological divide surrounding environmental issues, specifically climate change over the last several decades [19]. A 2015 study found that only 29% of conservatives believed in anthropogenic climate change compared to 76% of liberals [20]. This study also found that support for offshore oil and gas drilling, increased fracking, and building more power plants were favored by a majority of conservatives, while opposed by the majority of liberals [20]. Energy development priorities have conservatives more split in their views with 47% prioritizing alternative energy, and 43% prioritizing the expansion of current oil and gas production [20]. This was in contrast to a clear majority (77%) of liberals who favor prioritizing alternative energy like wind and solar [20]. Finally, research has shown that individuals holding more liberal political views [8,15] or those who identify as Democrats [6,9] are more willing to pay for energy research and a carbon tax than political conservatives.
Geographic location can also influence public opinion about environmental issues such as energy production. A study conducted by Stokes and Warshaw [21] found that in California, Washington, and Oregon (each with a binding renewable portfolio standard (RPS) requiring 25% or more of energy to come from renewable energy sources) public support for RPS was between 60–70%. However, Idaho, which does not have a RPS requirement, had about 40–50% support for RPS. Similarly, Howe et al. [22] found that “geographic patterns in beliefs are often consistent with what one might expect from political patterns, with traditionally “blue states” such as California…showing relatively high concern about climate change, and “red states” showing lower concern” (8). This study also found that people living in rural areas are less likely to believe that climate change is a problem than are people residing in urban areas [22]. Geographic variation then can help understand policy support for environmental policies like renewable energy [22]. Along this same line, Greenberg [16] found that residents in Idaho were more likely to support nuclear energy development compared to counterparts in other regions surveyed.
Based on the review of research literature, we expect to find that both political and environmental attitudes will be significant predictors of people’s policy preferences. Those who are more liberal and more “pro-environment” in their orientations will be less likely to support building more infrastructure and more supportive of conservation policies and price discrimination than those who hold more conservative views. We also expect to find that, controlling for other variables, residents of Idaho will have policy preferences similar to conservatives’ views compared to the other states.

2.2. Energy Profiles of California, Idaho, Oregon and Washington

Our initial project design was to focus on California, Oregon and Washington as all three are signatories to the 2016 Pacific Coast Climate Leadership Plan. This Plan calls for each state to use a regional approach when tackling climate change, environmental protection and economic development. To construct and implement successful policies, an understanding of residents’ views throughout the region is critical. Including Idaho provides us with an interesting comparator. It borders OR and WA, and faces many of the same energy challenges of all three other states. However, Idaho has a more conservative political culture, with more resistance to governmental interventions and therefore is an interesting comparison with the more liberal states.
The California energy crisis in the early 1990s led to a deregulation freeze, limiting consumer choice in energy suppliers that resulted in overall higher costs for energy and rolling blackouts (or brownouts). Due in part to the energy crisis in the 90s, California now pays some of the highest rates in the U.S. for energy, overall, paying 40% more than the rest of the nation [23]. Due to population and geographic size of the state, California follows Texas in terms of energy consumption [3]. However, while the state is the second largest energy consumer in the country, it is the fourth lowest in per capita consumption in part to “its mild climate and energy efficiency programs” [24]. Most of the State’s energy comes from natural gas (34.91%), renewables (31.36%) and large hydroelectric production (10.68%) [25]. California now has a binding renewable energy portfolio requiring 50% of all energy come from renewable resources by 2030. Moving toward that goal, in 2018, CA ranked first in the nation for renewable energy production, specifically solar, geothermal, and biomass [24].
Idaho’s electricity is primarily from hydropower (53%), followed by 17% coal, 14% natural gas, 7% wind and 2% nuclear [26]. Currently, Idaho has no commitments to renewable energy through a mandated RPS or state-wide goals [27]. However, Idaho does offer low-interest loans for residents for energy efficient and renewable energy projects [27]. Idaho also pays some of the lowest electricity rates in the nation [28], potentially affecting policy preferences regarding price manipulation.
Washington state is the largest producer of hydroelectric power in the U.S. [29] resulting in approximately 68% of energy supply to the state. Other than hydro, coal supplies roughly 13% of the State’s energy, followed by approximately 11% natural gas, 4% nuclear, and 3% wind [30]. Due to the abundance of hydroelectric production, Washington has the third lowest cost of electricity in the nation and was the top renewable energy producer in 2018 [29]. In May of 2019, Washington signed into law the Clean Energy Transformation Act (CETA) committing the State to “an electricity supply free of greenhouse gas emissions by 2045” [30], and by 2025 the elimination of coal-fired electricity from the state’s energy portfolio [24].
Similar to Washington, Oregon gets most of its energy from hydropower, about 40%, followed by approximately 32% coal, 17% natural gas, 6% wind, and 3% nuclear energy [25]. In 2018, Oregon generated 12% of energy from wind farms, from roughly 1900 wind turbines throughout the state [31]. Further, Oregon was the “second-largest producer of hydroelectric power in 2018, accounting for 12% of U.S. utility-scale hydroelectric generation” [32]. The Oregon Renewable Energy Act of 2007 committed Oregon to a renewable energy portfolio requiring 50% of electricity to consumers come from renewable energy by 2040. Right now, much of Oregon’s renewable energy production is going to other states, like California, so California can meet their renewable energy requirements [33] necessitating more renewable energy production to meet Oregon’s own renewable energy requirements.

3. Methods and Sample

3.1. Study Design

This study utilized an on-line and mail-in self-administered survey of residents of California, Idaho, Oregon, and Washington. Participation in the survey was completely voluntary, with consent established upon completing and submitting the survey. A modified version of Dillman’s [34] tailored design method was used to develop and administer both the online and mail-in survey. Each household receiving the survey was asked to participate based on the following prompt: “If available, we would prefer the person, 18 years or older, who most recently celebrated a birthday to complete the survey.” Following Dillman’s [34] method, respondents were first sent a postcard notifying them of the survey and providing an option to complete the survey online. Next, a physical copy of the survey was sent to household’s that had not completed an online or mail-in survey. Finally, another wave of reminder letters and surveys were sent to households that had not completed the survey and did not ask to be removed from the mailing list. All mailings to potential respondents provided an overview of the research project, and contact information for the principle investigator (P.I.), and was hand signed by the P.I. and one of student researchers. In addition to the survey, respondents were provided with a first class, pre-paid return envelope for responses.

3.2. Sample

Participants were randomly selected from a national sampling company. Random address-based sampling (ABS) using the U.S. Postal Service’s computerized delivery sequence file (CDS) generated 4,695 valid residential addresses for households in CA, ID, OR, and WA (CA = 1170, ID = 1175, OR = 1173 and WA = 1177). The survey was administered during the spring of 2018. Response rates were only slightly different between states (see Table 1). Most respondents preferred the mail survey, with California respondents using the Qualtrics online survey option the most (31.7%).
Using 2010 Census data to determine representativeness, our respondents (from all four states) were slightly older, more affluent, and educated than the Census average, which is not uncommon for survey research [35]. These data comparisons are presented in Table 2.

3.3. Measures and Descriptive Statistics

3.3.1. Independent and Control Variables

Measures for independent and control variables are provided in Table 3. Age was ascertained by asking respondents “What is your current age in years?” that resulted in a range of responses from 18 to 98 years old and a mean age of 51.6 years. Gender was offered as a dichotomous choice of female or male, then recoded (and renamed) to a 1 = women, 0 = men for analysis with a mean of 0.504 (indicating slightly more women responded to the survey). Both education and income were multi-categorical allowing respondents to indicate their highest level of formal education and household income before taxes. For education, the mean was 4.80 indicating most respondents had “Some college, no degree”, whereas the income mean was 5.88 with more respondents (24.5%) making between $50,000–$74,999 in 2017 before taxes. Lastly, political ideology was measured using a nine-point scale ranging from 1 = “Very Liberal” to 9 = “Very Conservative” and resulted in a mean of 4.68 (moderate with a liberal leaning).
Environmental values were assessed using the six-item New Ecological Paradigm (NEP) index [18]. Respondents were asked to indicate their level of agreement on a five-point scale (1 = “Strongly Disagree” to 5 = “Strongly Agree”) to the following statements: (1) “The balance of nature is very delicate and easily upset by human activities”; (2) Humans have the right to modify the natural environment to suit their needs”; (3) “We are approaching the limit of people the earth can support”; (4) “The so-called “ecological crisis” facing humankind has been greatly exaggerated”; (5) “Plants and animals have as much right as humans to exist”; and (6) “Humans were meant to rule over the rest of nature.” Questions 2, 4, and 6 were then reverse coded, and responses were added across all six items to produce an overall index ranging from 6 to 30, with low scores indicating low environmental values (more human centric) and 30 indicating strong environmental values (pro-ecological values). The mean score was 20.73 suggesting respondents are somewhat more pro-environmental overall and the Cronbach’s alpha was 0.766 indicating that respondents were relatively consistent in their responses to the six-items.

3.3.2. Dependent Variables: Energy Policy Support

Energy policy preferences explored in this study were developed by Portney et al. [36] and focus on three types of energy policy: infrastructure, conservation, and price discrimination (see Table 3). Respondents were asked to provide their level of support or opposition to eight energy policy proposals to manage energy resources. Responses were given on a 5-point Likert scale ranging from 1 = “Strongly Oppose” to 5 = “Strongly Support.” Infrastructure policies included: (1) “Build additional power plants”; (2) “Build pipelines to bring oil from other regions”; and (3) “Relax environmental standards for energy industries.” Three conservation related policies proposed were: (1) “Conduct campaigns for voluntary energy conservation”; (2) Require that new construction meets high energy efficiency standards”; and (3) “Increase federal funding for research on renewable energy technologies.” Support for price discrimination policies was given through responses to the following two policy proposals: (1) “Charge higher energy rates during high demand times of day”; and (2) “Charge higher energy rates for high volume users.”
As seen in Table 3, there is considerable variation in levels of support for different policies. In terms of infrastructure, there was not a majority supporting any one type of policy, with the highest level of support going to building additional power plants (43.1%). The greatest level of opposition was for allowing a relaxation of environmental standards (64.4%). Energy policies focused on conservation received wide support overall, with almost 80% agreeing that new construction must meet high energy efficiency standards. A slight majority of respondents (54.1%) supported charging higher rates for high volume uses, while increasing rates during high demand times produced a more divided response. We turn now to a discussion of how views on these energy policies vary by state, followed by our multivariate analyses. All analyses were produced using SPSS v.25.

4. Results

4.1. Bivariate Analysis

Table 4 displays frequencies for the eight questions concerning support for or opposition to infrastructure, conservation and price discrimination energy policies. For presentation purposes, response categories were collapsed into three attributes: oppose, neutral, and support. For the 3 energy infrastructure questions, California and Idaho respondents are statistically more likely to support building additional power plants when compared to Oregon and Washington. Forty-eight percent of California respondents and 53.5% of Idaho respondents supported building additional plants, while only 29.7% of Oregon respondents and 34.5% of Washington respondents supported building additional plants (Chi-square = 77.95, p = 0.000). It should also be noted that over a third of all respondents were “neutral” for this first infrastructure question.
Concerning the second energy infrastructure question of building pipelines to bring oil from other regions, not surprisingly California, Oregon and Washington residents were statistically less supportive than Idaho respondents. In California 48.8% of respondents opposed building pipelines while in Oregon 56.2% opposed pipeline construction and in Washington 56.1% are in opposition. For Idaho, 34.9% opposed pipeline construction yet 45.9% are in support. Far fewer respondents in all states were neutral for this policy proposition when compared to building more power plants, suggesting this to be a more contentious policy to develop.
A majority of all respondents in each state were in opposition to the policy proposition of relaxing environmental standards for energy industries. Opposition to relaxing environmental regulations ranged from 54.9% in Idaho, 64.0% in Oregon, 68.0% in California and 78.1% in Washington. The state with the highest level of support is Idaho at 22.2% and the lowest is 8.8% for Oregon respondents. Once again politically conservative Idaho is more supportive than the other states, but even so the majority is in opposition to this policy proposal.
The next set of energy proposals in Table 3 concern energy conservation policies. As we saw in the univariate distribution, there is support for all policies but there are also notable differences across states. The first proposed policy concerns support for voluntary energy conservation campaigns. There is very strong support for this policy with support in California at 68.7%, Idaho at 68.9%, Oregon at 76.4%, and 78.1% for Washington respondents. The highest level of opposition is in California at 21% and the lowest level is in Oregon at just 3.6% of respondents. Idaho, Oregon and Washington had higher percentages of neutral respondents ranging from 15.9% in Washington to 20.0% in Oregon and a high of 21.0% for Idaho.
Strong levels of support also exist for an energy conservation policy of requiring that new construction meets high energy efficiency standards was evident in all four states. Over 70% of respondents in each state supported high energy standards, although there is some variation in level of support among the states. Oregon had the highest level of support at 92.0%, Washington at 80.8% support, California at 73%, and 70.9% for Idaho respondents. The highest level of “neutral” responses were found in Idaho at 20.2%, followed by California and Washington, which were 11.3% and 11.0% respectively.
A policy proposal to increase funding for research on renewable energy technologies, once again shows strong support in all four states similar to what other studies have found [18]. Over 66% of respondents in each of the four states supports federal funding for research on renewable energy technologies. The highest levels of support are found in Oregon (72.0%) and Washington (70.4%), followed by California and Idaho 66.7% each. Interestingly, the highest level of opposition can be found in California (21.2%) followed by Idaho at 17.7%. Only 8.4% of Oregon respondents and 11.3% of Washington respondents opposed federal funding for renewable energy research.
Price discrimination energy policies received more mixed views. The first policy concerns charging higher energy rates during high demand times during the day. Responses to this policy proposal is varied in each state with California and Washington respondents more likely to support than oppose and Idaho and Oregon respondents more likely to oppose than support. In terms of opposition, 48.9% of Idaho respondents were in opposition, followed by 44.4% in Oregon, 35.5% in California, and 32.5% in Washington. The strongest support for charging higher rates in high demand times was found in Washington at 46.1%, followed by 42.8% in California, 31.6% in Oregon, and 31.1% in Idaho.
The final energy policy proposal asked respondents their level of support for charging higher energy rates for high volume users. There was more support for this price discrimination policy as respondents may view this policy as not potentially affecting themselves. For three states—California, Oregon, and Washington—a majority of respondents supported this policy with 59.7% of California respondents in support, 59.2% of Washington respondents, and 50.9% of Oregon respondents. For Idaho, 46.7% were in support of the policy proposal while 30.0% were in opposition.
For all energy policy proposals investigated in Table 4, the Chi-square tests were significant at the p = 0.000, indicating that views on policies are not independent of people’s state of residence. The more politically left and hydroelectric abundant U.S. Pacific Northwest states of Oregon and Washington were more opposed than Idaho and even California to the development of additional power plants and oil pipelines. This may be due to the fact that California has had more energy disruptions over the years impacting households while Idaho, as a more politically conservative state, may be more supportive of traditional energy sources as previous research has found [18]. In addition, while respondents in all states were opposed to relaxing environmental standards for energy industries, Idaho respondents were more likely to support this policy proposal and least likely to oppose it as expected.
In terms of responses to the proposed energy conservation policies, respondents in all states supported voluntary energy conservation efforts, supported high energy efficiency efforts in in new construction projects, and supported increased federal funding for renewable energy technologies. Residents of Oregon and Washington were more likely to support all three of these energy policy proposals than California and Idaho respondents. While the level of support for the three policies is not large between the states, they are statistically significant difference. Once again, as a more conservative state Idaho respondents may feel these policies are slightly less needed than the liberal states of Oregon and Washington. The California results are a little harder to explain as the state is liberal, but the state also has experienced energy disruptions over the last decade. Perhaps Californians are also more likely to have lived under conservation due to drought and maybe have become dreary of such policies? [37].

4.2. Multivariate Analyses

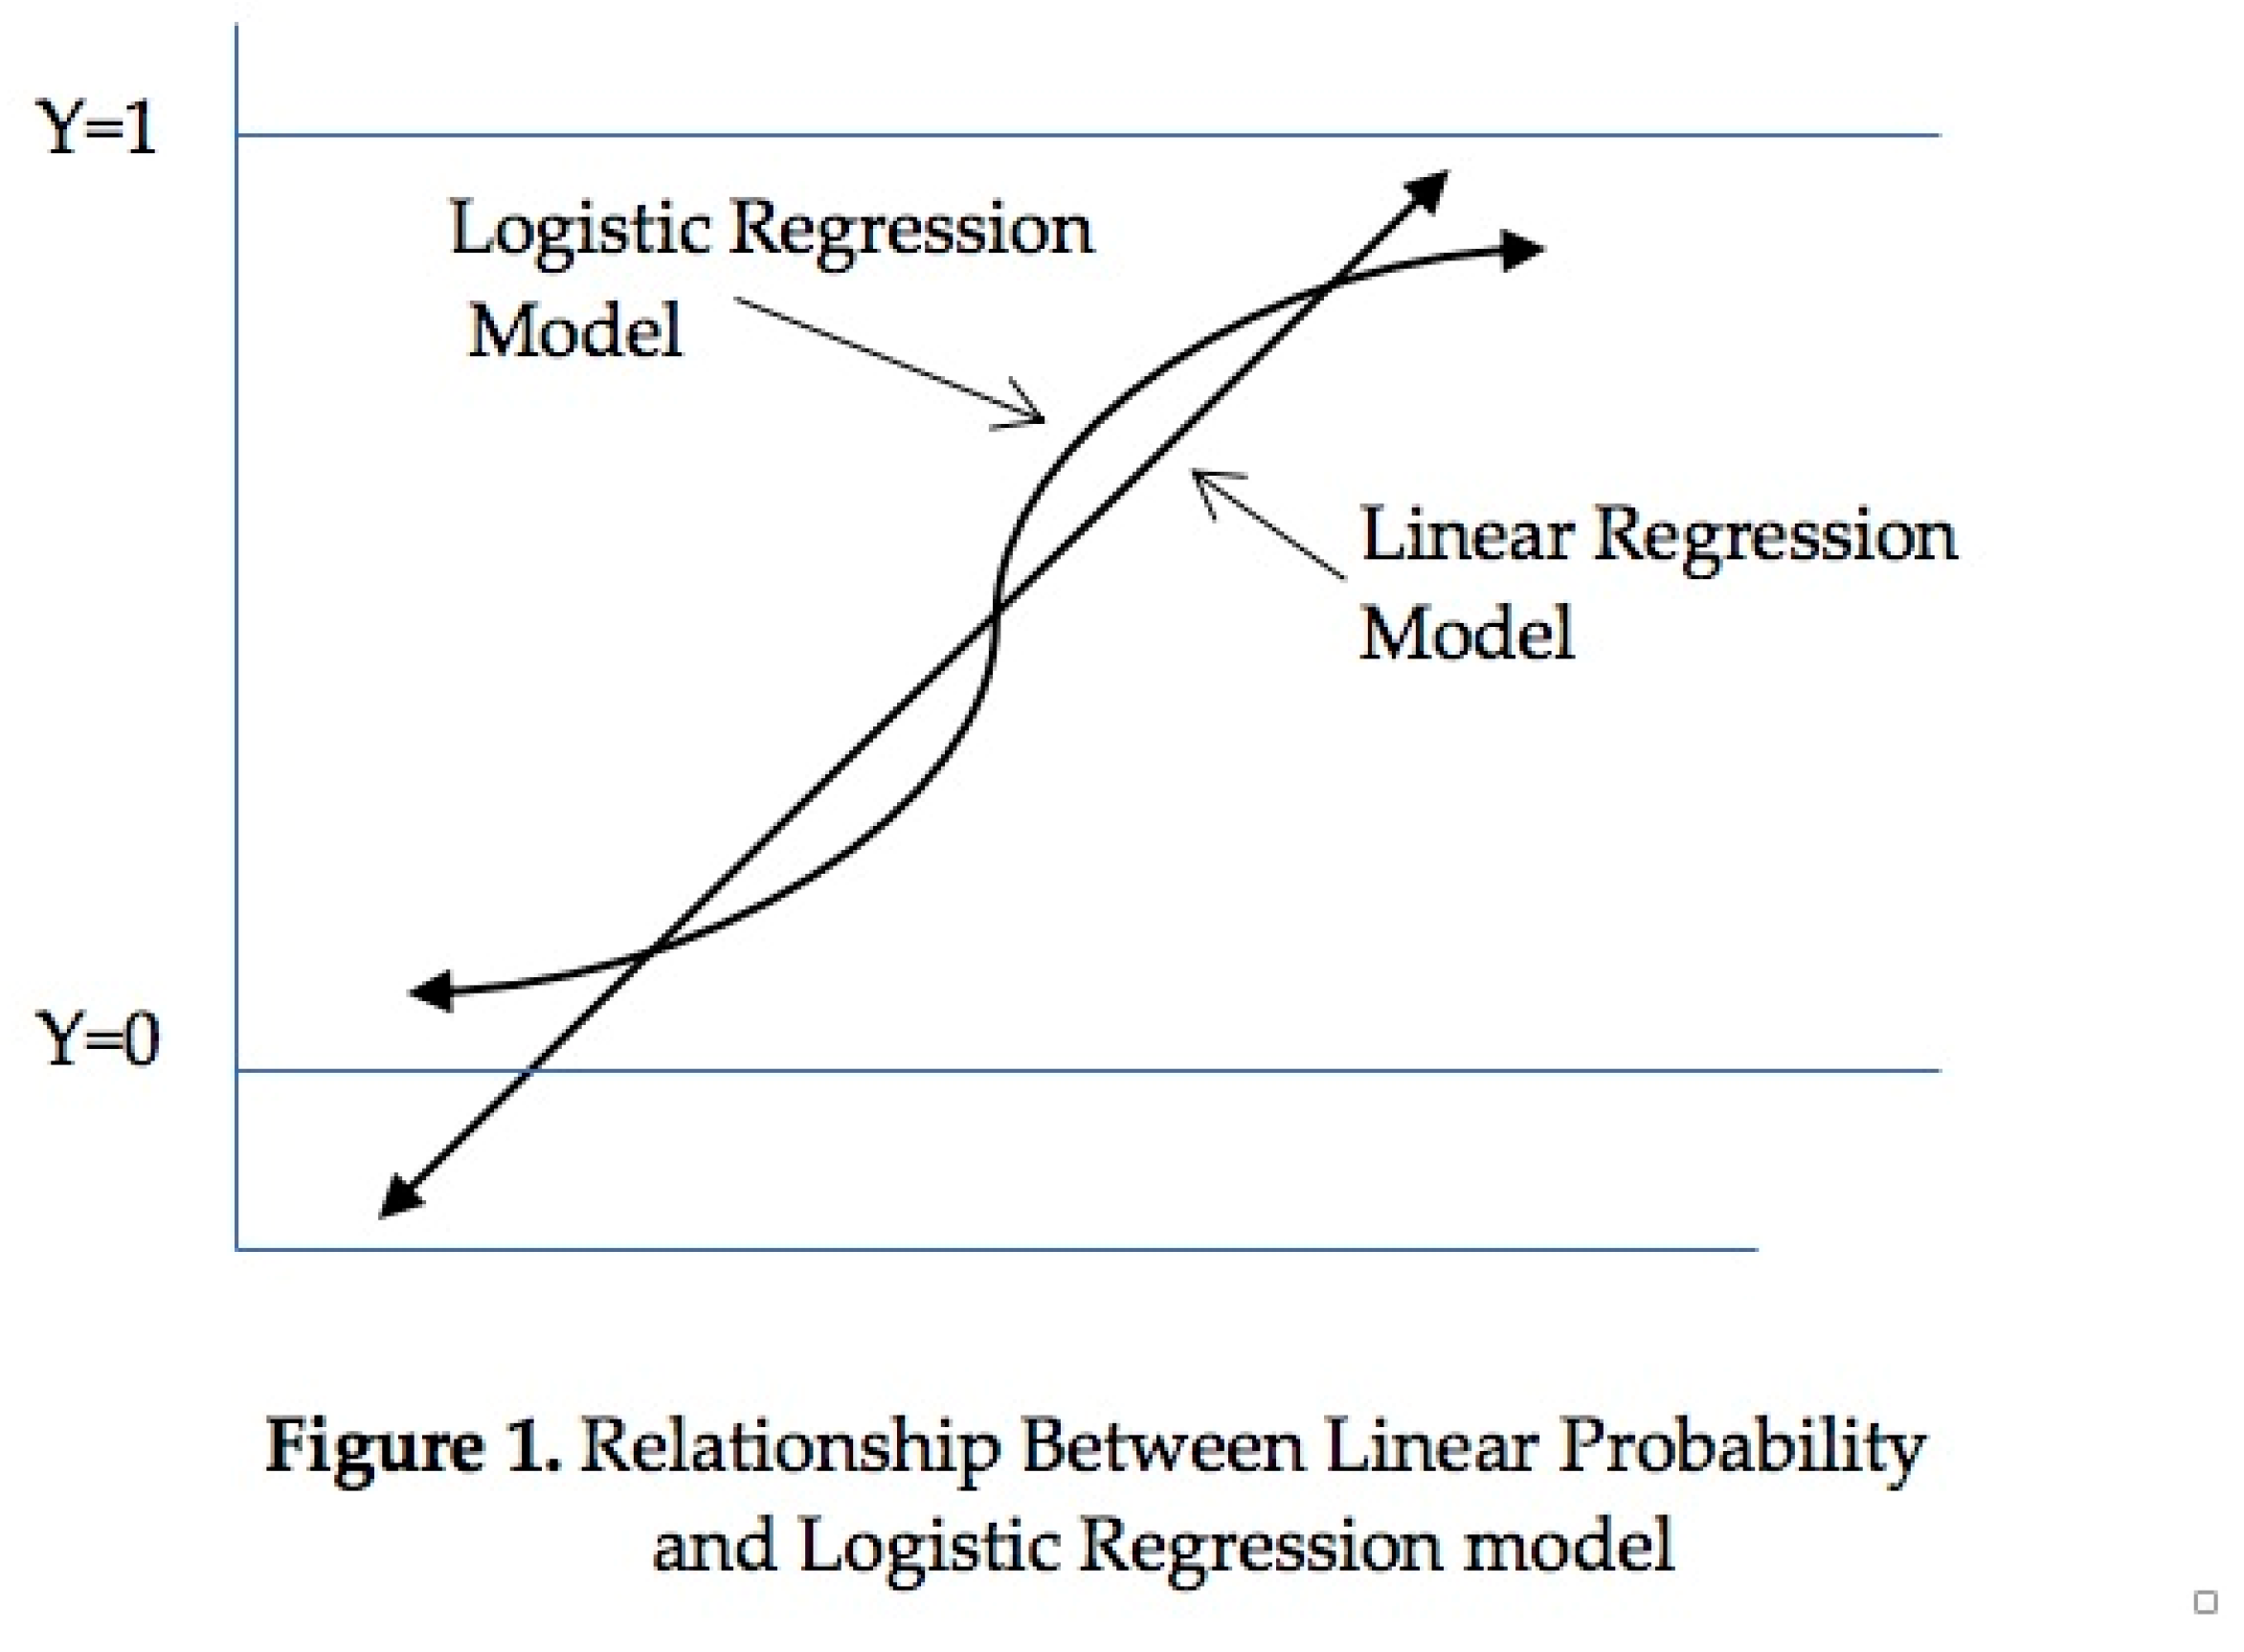
The dependent variables for this project are categorical, and often have skewed distributions in responses. Therefore, we have decided to make respondent preferences for the various energy policies be either “support” (y = 1) or “otherwise” (y = 0). Linear regression models are not a good fit to predict binary outcomes as the predictions could be outside the possible range (0,1). The most frequently used model in this case is binary logistic regression, in which the dependent variables are transformed so we can get around this restricted range problem. In logistic regression, independent variables can be either continuous (interval, ratio) or categorical (nominal, ordinal). The formal model for logistic regression, or the logit model, is written as:
Log(p/p − 1) = β0 + β1X1 + β2X2 + ………βkXk
Where:
  • Ln is the natural log
  • P is the probability that y = 1; (1 − p) is the probability that y = 0
  • Ln[p/(1 − p] is the log-odds ratio (logit)
  • β0 is the expected log-odds ratio when all independent variables = 0
  • β1−k and X1−k are understood the same was as in linear regression. For each unit increase in an independent variable, the dependent variable is expected to change by β (here the log-odds are expected to change by that amount), holding other variables constant
  • K is the number of independent variables in the model.
Figure 1 shows how these models look for regressions with one predictor (independent) variable.
For our binary logistic regressions in Table 5, Table 6 and Table 7, the model looks like this:
Log(p/p − 1) = β0 + β1(Age) + β2(Gender) + β3(Education) + β4(Income) + β5(NEP) + β6(Ideology) + β7(Idaho dummy)
Where:
  • Log(p/p − 1) are the log-odds of supporting a particular policy
  • β1 through β7 represent the amount of increase or decrease in the log-odds of “supporting a policy” that would be predicted for a one unit increase in a specific independent variable, holding all other variables constant.
An interpretation of the logit coefficient can be difficult, and a more intuitive approach would be to look at the “odds ratio” or the probability of supporting a policy divided by the probability of not supporting. This is done by exponentiating the coefficients (eβ). Now, for each unit increases in an independent variable, the odds ratio changes by this amount. For example, if eβk = 2, then a one unit change in Xk would make the likelihood of policy support twice as likely to occur. We have included both types of coefficients in the tables.
We saw in our bivariate analyses that there are some geographical differences in views of energy policies when we separate the data by states. The Idaho results had less in common with the other states for many of the policies examined. Therefore, we include a dummy variable (Idaho = 1, other states=0) in each model to test for state differences. We did conduct analyses by rotating state dummy variables to test for other state differences as well, with only Idaho producing significant results in the multivariate models. Table 5 displays results for the three energy infrastructure policy options of building more power plants, building more pipelines and relaxing environmental standards for energy industries. The Chi-square statistic is statistically significant for all three models indicating a relatively good fit overall. The Nagelkerke R2 is 0.230 for the “build power plants” model, and 0.437 for the “build pipelines” model, and 0.347 for the “relax environmental standards” model. For the impact of the demographic control variables on the policy preferences, age had a statistically significant impact only in the model for building additional power plants. Older respondents are more likely to support this option versus younger respondents who are more likely to oppose building more power plants. Similarly, gender also has a significant impact for only the building additional power plants model, with women more likely to oppose this option when compared to men. Education was significant for two models including building power plants and relaxing environmental standards. Those respondents with higher levels of formal education are more supportive of building additional power plants when compared to those with lower levels of formal education. However, for the relaxing environmental standards model more highly educated respondents were significantly more likely to oppose this policy option when compared to those with lower levels of education. Finally, income also has a statistically significant impact for two models including building oil pipelines and relaxing industry environmental standards. Those respondents with higher levels of household income were both more likely to support the building of oil pipelines and relaxing industry environmental standards when compared to lower household income respondents.
Political ideology has a statistically significant impact for all three models in Table 5, and are in the predicted direction. More conservative respondents are significantly more likely to support the building of additional power plants, building oil pipelines, and relaxing environmental standards when compared to more liberal respondents. As discussed previously, conservatives are more supportive of traditional energy policies such as the use of fossil fuels and the reduction of regulations on the fossil fuel energy industry. Similarly, and as we proposed, scores on the NEP have a statistically significant effect for all three models with respondents with higher NEP scores (i.e., more pro-environmental values) less likely to support building additional power plants, less likely to build additional oil pipelines, and less likely to relaxing environmental standards compare to those respondents not as supportive of NEP values.
The final variable included in each model is the dummy variable for Idaho, which is statistically significant as expected. When controlling for the various demographic, political and environmental value variables, Idaho respondents are more likely to support enhancing infrastructure, while holding constant all other variables in the model. Using the exponentiated coefficients, we find that residents of Idaho are 1.55 times more likely to support additional power plants, 1.8 times more likely to support building oil pipelines, and twice as likely to be in favor of relaxing environmental standards for industry.
The multivariate results displayed in Table 6 examine the impact of our various demographic, ideology and environmental value variables on the three energy conservation policies of conducting voluntary energy conservation campaigns, requiring high energy efficiency standards for new construction projects, and increasing federal funding for research on renewable energy technologies. Similar to the models in Table 5, the Chi-square statistic is statistically significant for all three models indicating a relatively good fit overall. The Nagelkerke R2 is 0.421 for the “conduct campaigns” model, 0.421 for the “require energy efficiency” model, and 0.394 for the “increase funding for renewable research” model.
For the demographic variables, age has a statistically significant impact for two models including conducting voluntary campaigns and increasing federal funding for research on renewable energy technologies. As expected, younger respondents are more likely to support conducting voluntary energy conservation campaigns and to support increased federal funding for renewable energy technology research when compared to older respondents. Women and men were statistically similar in their views on the first two models. Unexpectedly, women were less likely to support increasing funding for renewal energy technologies when compared to men, which is not consistent with prior research [8].
Formal educational attainment was statistically significant for the conduct voluntary energy conservation campaigns and increase funding for renewable energy technology research policy options. As was expected, those respondents with higher levels of education are more likely to support conducting voluntary campaigns and increased funding for research on renewable technologies. Income was significant for only the requiring high-energy efficiency standards for new construction model, with higher income respondents more supportive of the policy when compared to lower income respondents.
Turning now to the impact of political ideology on support for energy conservation policies, we find that ideology is statistically significant in all three models, and in line with expectations based on prior research. Liberal respondents, when compared to conservative respondents, are more likely than conservatives to support conducting voluntary energy efficiency campaigns, requiring high-energy standards for new construction projects, and increased federal funding for renewables research. Similar to ideology, the NEP had a significant effect for all three energy efficiency policies with those respondents with high levels of support for the NEP more likely to support conducting voluntary campaigns, require energy efficiency for new construction, and increased funding for renewable energy research when compared to respondent with lower levels of NEP support. State residency played a less important role in these models. Only for the policy proposal to require greater energy efficiency on new construction did we find that Idahoans were significantly less supportive than residents of other states.
Two energy price discrimination policies were presented to respondents. These were to charge higher energy rates during high demand times and charge higher energy rates for high volume users. Table 7 displays the results for the two logistic regression models. For both models the Chi-square statistic is significant indicating that both models are a good fit. The Nagelkerke R2 statistic is 0.261 for the “charge higher rates high during demand times” model and 0.294 for the “charge higher rates for high volume users” model.
The demographic variables are fairly effective predictors of policy preferences for both models. Age is significant for both models with younger respondents more likely to support charging higher rates for high demand times and higher rates for high volume users when compared to older respondents. Gender had a statistically significant effect in one model—but again in the opposite direction from what we expected. Men were more supportive of these policy options when compared to women (significant only for the “time of day” usage).
Educational attainment has a statistically significant and positive effect in both models, with those respondents with higher levels of education more likely to support both policies of charging higher rates during high demand times and high-volume users when compared to those with lower levels of education. Income also is statistically significant in both models with higher income respondents more likely to support both policies when compared to lower income respondents. Perhaps this support comes from a greater ability to pay high rates but could be part of a pattern where high socioeconomic status (SES) individuals are more open to policies that discourage use.
As expected, political ideology has a negative and statistically significant effect in each model with liberals more likely to support charging higher rates for high use times and high-volume users, while conservatives who are more market driven are less supportive of such regulative approaches. The NEP also has a statistically significant impact in both models, with those having higher support for the NEP in favor of both policies when compared to respondents with lower levels of support for the NEP. Residents of Idaho are less supportive of price discrimination policies compared to people living in CA, OR, or WA, but was significant only for the “high volume user” policy.

5. Discussion

As was discussed in the introduction of this article, energy policy is often a very contentious issue in the U.S., especially concerning the siting and construction of energy infrastructure, energy conservation and investment policies, and variable pricing based on volume of use and the time of use. This study examined individual-level attributes as potential predictors of public support for and opposition to various energy policy efforts in all three of these areas. It is argued that the identification of demographic, political ideology and environmental value correlates of policy preferences can be important considerations when designing effective and implementable policy alternatives. The U.S. western states of California, Idaho, Oregon and Washington were used as the study location site as three of the states have signed the 2016 Pacific Coast Climate Leadership Plan that commits the states to a regional planning approach to climate change, environmental protection, and regional economic development. Idaho was also included in the study as regional comparator state facing many of the same energy policy issues as the three Pacific states, but having a more conservative political culture and more prone to limited governmental intervention and activity in the energy policy sector [18].
Concerning similarities and differences in terms of levels of support for energy policies across the western states, we found that California and Idaho respondents were more supportive of building additional power plants and oil pipelines than Oregon and Washington respondents. In part this may be due to brownouts and energy shortages Californians have suffered in recent decades, and in Idaho it may be more the product of a conservative political culture that is more supportive of traditional energy sources and infrastructure [11,18]. There was very little support and much opposition in all four states for relaxing environmental standards for energy industries, although not surprisingly Idaho respondents were a little less opposed on average when compared to the three Pacific coast states.
In terms of support for energy conservation policies, there was strong support in all four states for voluntary conservation campaigns, requiring high-energy efficiency standards, and increased federal funding for research on renewable energy technologies. However the strongest levels of support were evident in the Pacific Northwest states of Oregon and Washington when compared to California and Idaho.
We find more variation in levels of support for policy proposals concerning price discrimination within each state, and between states. California and Washington respondents were more likely to support than oppose charging higher rates during higher demand times of the day, while Idaho and Oregon respondents were more likely to oppose than support. The responses from Idaho are understandable given the more conservative political culture of the state, but the results from Oregon are a little more perplexing to explain. Perhaps it may be the result of current pricing systems in place across the state? The price discrimination policy option of charging higher energy rates for high volume users was supported by over half of California, Oregon and Washington respondents. As would be expected, Idaho respondents were less supportive and slightly more likely to oppose the policy.
As for the determinants of support for energy policies across the four states, several of the demographic characteristics of respondents had statistically significant effects. Education had a significant effect in six models, age and income had significant effects in five models each, and gender was only significant in three models. When compared to lower education respondents, those respondents with higher levels of education were more likely to support building more power plants, but were also more opposed to relaxing environmental standards for new energy construction projects. More highly educated respondents were also more supportive of voluntary conservation campaigns and increasing federal funding for research on renewable technologies. Finally, more highly educated respondents were more supportive of the two price discrimination policies of charging higher rates during high demand times and for high volume users.
Looking now at the impact of age on policy support and opposition, younger respondents when compared to older respondents were less likely to support power plant construction, more supportive of voluntary conservation campaigns, more supportive of increased federal funding for renewable technology research, and were more supportive of both price discrimination policies of charging more at high use times and for high volume users. In terms of the impact of income on energy policy support, we find that higher income respondents when compared to lower income respondents were more supportive of building oil pipe lines, but were less supportive of relaxing of environmental standards in energy construction projects. Higher income respondents were also more supportive of requiring higher energy efficiency standards on constructions projects and were more supportive of both price discrimination policies of increased rates for high volume users and high demand times.
In general, these relationships were as expected based on prior research. In terms of the impact of gender, however, its relationship to policy preferences is not as clear. Women are less supportive of building power plants than men, yet are less supportive of increased federal funding for renewable energy technology research. Women also showed less support than men for charging higher rates for energy in high use times. Clearly more attention is needed here given the abundance of research that has documented that gender matters.
Political ideology and environmental values as measured by the NEP, were statistically significant in all eight energy policy models. More liberal respondents were less supportive of building power plants, building oil pipelines, and relaxing environmental standards on construction projects. Liberals were more supportive of voluntary conservation campaigns, requiring new construction projects have energy efficiency standards, and increasing federal funding for renewable energy technology research. Finally, Liberals were significantly more likely to support the two price discrimination policies of charging higher rates for high volume users and high demand times during the day. Energy policy is often framed along political ideology lines with conservatives favoring of increasing supplies, building pipelines and new power plants, and deregulating energy markets, while liberals are more likely to support conservation efforts, use of alternative/renewable sources, and use of regulatory approaches [11,18,38]. Certainly the analyses presented here offer additional evidence of the importance of political ideology for energy policy preferences.
As with political ideology, environmental values also have a profound impact on public preferences concerning energy policy for all eight models. Those respondents with higher levels of support for the NEP are significantly less supportive of building power plants, building oil pipelines, and relaxing environmental standards than respondents with lower levels of support for the NEP. Higher NEP scores are also associated with support for conducting voluntary conservation campaigns, requiring energy efficiency standards for new construction, and increased federal funding for renewable energy technology research. Finally, higher NEP respondents are also more supportive of the price discrimination policies of charging higher rates during high use times and for high-end energy users. These results also contribute to the growing literature focused on the impact of environmental values on energy policy preferences and behaviors [39,40,41,42].
In sum, our findings are line with prior research that finds more support for policy “carrots” like voluntary efforts [6], increased funding for renewable energy technologies [43], and increased energy efficiency standards [44] from respondents in all four states. Demographic characteristics of individuals are independently related to support for the eight policy questions, and our findings were relatively in-line with previous research. Political ideology and environmental values consistently predicted policy preferences, as expected, for all eight policy models. Geographic location of respondents also was important. In general, residents of Idaho were more likely to support building new infrastructure, and less likely to support conservation or price discrimination policies.
Future research could extend the survey into other, more politically conservative states like Utah, that might help further illuminate potential similarities or differences in energy policy preferences. However, this study provides some insight on how to best garner energy policy support from residents in Idaho, California, Oregon, and Washington, specifically regarding incentives or voluntary actions. Energy conservation among residents can play a role in the overall reduction of energy demand. Therefore, discouraging energy use during peak times, offering incentives for energy efficiency, and providing education on energy use and efficiency can all impact total energy demand.
California, Oregon, and Washington each have a renewable energy mandate for their state that will require the development and/or acquisition of additional renewable energy in order to meet state goals. It should be noted that many of the states’ goals to achieve renewable energy portfolios will come from buying energy from other states, and not necessarily added production. While support or opposition for nuclear energy is aligned with political ideology and the NEP, efforts to increase support for nuclear may be warranted as carbon emissions can be significantly reduced with nuclear energy part of a renewable (or sustainable) energy profile. Future research should explore this in more detail to understand potential avenues for policy support.
This research sought to understand public support for a variety of energy policies. Aside from the demographic, ideological and environmental values variables affecting policy support, results from this research found that a majority of respondents from all four states supported each of the conservation policies (conduct campaigns for voluntary energy conservation, require new construction to meet high energy efficiency standards, and increase federal funding for research on renewable energy technologies) and opposed relaxing environmental standards for energy industries. While there was more variation in responses to questions on infrastructure and price discrimination policies, support for conservation and maintaining environmental standards suggest a strong foundation on which to build more policy support for other energy policies. It is also possible to invest in incentives to conserve (for new construction, etc.) that can blend price discrimination policies with conservation and further build on public support. Regardless, it is encouraging that the majority of respondents in each state do not want to roll back requirements or standards, but instead would like to find ways to further energy conservation providing an avenue for energy policy support in different domains.

Supplementary Materials

Supplementary File 1

Author Contributions

Conceptualization, B.S.S., E.A.W., R.L.W.; Methodology, B.S.S., E.A.W., R.L.W.; Analyses, B.S.S., R.L.W. All authors have read and agreed to the published version of the manuscript.

Funding

This research received no external funding. The survey was funded by the Oregon Policy Analysis Laboratory, School of Public Policy, Oregon State University (U.S.A.)

Acknowledgments

The authors thank the graduate student survey research team of Warda Ajaz, Allison Daniel, Najam uz Zehra Gardezi, Patricia T. Fernandez-Guajardo, Rebecca Langer, Heather Mae Moline, Gregory J. Stelmach, Maria Dolores Vazquez Rascon and Benjamin Wickizer.

Conflicts of Interest

The authors declare no conflict of interest.

References

  1. United States Environmental Protection Agency. Global Greenhouse Gas Emissions Data. Available online: https://www.eia.gov/state/analysis.php?sid=WA (accessed on 11 October 2019).
  2. Friedrich, J.; Ge, M.; Pickens, A. This interactive Chart Explains World’s Top 10 Emitters, and How They’ve Changed. World Resources Institute. Available online: https://www.wri.org/blog/2017/04/interactive-chart-explains-worlds-top-10-emitters-and-how-theyve-changed (accessed on 16 October 2019).
  3. United States Energy Information Administration. In 2018, the United States Consumed More Energy than Ever Before. 2019. Available online: https://www.eia.gov/todayinenergy/detail.php?id=39092 (accessed on 11 October 2019).
  4. Leiserowitz, A.; Maibach, E.; Rosenthal, S.; Kotcher, J.; Gustafson, A.; Bergquist, P.; Ballew, M.; Goldberg, M. Energy in the American Mind, December 2018; Yale University and George Mason University; Yale Program on Climate Change Communication: New Haven, CT, USA, 2018. [Google Scholar] [CrossRef]
  5. Pew Research Center. An Elaboration of AAAS Scientists’ Views. Available online: https://www.pewresearch.org/science/2015/07/23/an-elaboration-of-aaas-scientists-views/ (accessed on 11 October 2019).
  6. Truelove, H.B.; Greenberg, M. Preferences for Government Investment in Energy Programs: Support for New Energy Production vs. Energy Conservation. Environ. Pract. 2011, 13, 184–197. [Google Scholar] [CrossRef]
  7. Tabi, A.; Hille, S.L.; Wüstenhagen, R. What makes people seal the green power deal? —Customer segmentation based on choice experiment in Germany. Ecol. Econ. 2014, 107, 206–215. [Google Scholar] [CrossRef]
  8. Li, H.; Jenkins-Smith, H.C.; Silva, C.L.; Berrens, R.P.; Herron, K.G. Public support for reducing US reliance on fossil fuels: Investigating household willingness-to-pay for energy research and development. Ecol. Econ. 2009, 68, 731–742. [Google Scholar] [CrossRef]
  9. Kotchen, M.J.; Boyle, K.J.; Leiserowitz, A.A. Willingness-to-pay and policy-instrument choice for climate-change policy in the United States. Energy Policy 2013, 55, 617–625. [Google Scholar] [CrossRef]
  10. Kollmuss, A.; Agyeman, J. Mind the Gap: Why do people act environmentally and what are the barriers to pro-environmental behavior? Environ. Educ. Res. 2002, 8, 239–260. [Google Scholar] [CrossRef] [Green Version]
  11. Steel, B.S.; Pierce, J.C.; Warner, R.L.; Lovrich, N.P. Environmental value considerations in public attitudes about alternative energy development in Oregon and Washington. Environ. Manag. 2015, 55, 634–645. [Google Scholar] [CrossRef] [PubMed]
  12. Boudet, H.; Clarke, C.; Bugden, D.; Maibach, E.; Roser-Renouf, C.; Leiserowitz, A. “Fracking” controversy and communication: Using national survey data to understand public perceptions of hydraulic fracturing. Energy Policy 2014, 65, 57–67. [Google Scholar] [CrossRef]
  13. Dunlap, R.E.; VanLiere, K.; Mertig, A.; Jones, R. Measuring endorsement of the new ecological paradigm: A revised NEP scale. J. Soc. Sci. Issues 2000, 56, 425–442. [Google Scholar] [CrossRef]
  14. Dietz, T.; Dan, A.; Shwom, R. Support for Climate Change Policy: Social Psychological and Social Structural Influences. Rural Sociol. 2007, 72, 185–214. [Google Scholar] [CrossRef] [Green Version]
  15. Larson, E.C.; Krannich, R.S. “A Great Idea, Just Not Near Me!” Understanding Public Attitudes about Renewable Energy Facilities. Soc. Nat. Resour. 2016, 29, 1436–1451. [Google Scholar] [CrossRef]
  16. Greenberg, M. Energy sources, public policy, and public preferences: Analysis of US national and site-specific data. Energy Policy 2009, 37, 3242–3249. [Google Scholar] [CrossRef]
  17. Olsen-Hazboun, S.K.; Krannich, R.S.; Robertson, P.G. Public views on renewable energy in the Rocky Mountain region of the United States: Distinct attitudes, exposure, and other key predictors of wind energy. Energy Res. Soc. Sci. 2016, 21, 167–179. [Google Scholar] [CrossRef] [Green Version]
  18. Pierce, J.C.; Steel, B.S. Prospects for Alternative Energy Development in the U.S. West: Tilting at Windmills? Springer Press: Cham, Switzerland, 2017. [Google Scholar]
  19. McCright, A.M.; Xiao, C.; Dunapl, R.E. Political polarization on support for government spending on environmental protection in the USA, 1974–2012. Soc. Sci. Res. 2014, 48, 251–260. [Google Scholar] [CrossRef] [PubMed]
  20. Pew Research Center. Americans, Politics, and Science Issues. Available online: https://www.pewresearch.org/internet/wp-content/uploads/sites/9/2015/07/2015-07-01_science-and-politics_FINAL-1.pdf (accessed on 11 October 1999).
  21. Stokes, L.C.; Warshaw, C. Renewable energy policy design and framing influence public support in the United States. Nat. Energy 2017, 2, 1–6. [Google Scholar] [CrossRef]
  22. Howe, P.D.; Mildenberger, M.; Marlon, J.R.; Leiserowitz, A. Geographic variation in opinions on climate change at state and local scales in the USA. Nat. Clim. Chang. 2015, 5, 596–603. [Google Scholar] [CrossRef] [Green Version]
  23. Denning, L. How Much More Can California Pay For Power? The Washington Post. 25 January 2019. Available online: https://www.washingtonpost.com/business/how-much-more-can-california-pay-for-power/2019/01/25/da5aaca8-20a6-11e9-a759-2b8541bbbe20_story.html (accessed on 14 October 2019).
  24. U.S. Energy Information Administration. California State Profile and Energy Estimates: Profile Overview. Available online: https://www.eia.gov/state/?sid=CA (accessed on 15 March 2020).
  25. California Energy Commission. Total System Electric Generation: 2018 Total System Electric Generation in Gigawatt Hours. 2018. Available online: https://ww2.energy.ca.gov/almanac/electricity_data/total_system_power.html (accessed on 17 October 2019).
  26. Idaho Governor’s Office of Energy and Mineral Resources. Idaho Energy Landscape. 2019. Available online: https://oemr.idaho.gov/wp-content/uploads/FINAL-Energy-Landscape-2019.pdf (accessed on 11 October 2019).
  27. U.S. Energy Information Administration. Idaho State Profile and Energy Estimates: Profile Analysis. 2018. Available online: https://www.eia.gov/state/analysis.php?sid=ID (accessed on 17 October 2019).
  28. U.S. Energy Information Administration. Idaho State Profile and Energy Estimates: Profile Overview. 2018. Available online: https://www.eia.gov/state/?sid=ID (accessed on 18 October 2019).
  29. U.S. Energy Information Administration. Washington State Profile and Energy Estimates: Profile Analysis. Available online: https://www.eia.gov/state/analysis.php?sid=WA (accessed on 11 October 2019).
  30. Washington State Department of Commerce. Fuel Mix Disclosure—Washington State Department of Commerce. Available online: https://www.commerce.wa.gov/growing-the-economy/energy/ (accessed on 17 October 2019).
  31. Oregon Department of Energy. Electricity Mix in Oregon: Fuels Used to Generate Electricity Consumed in Oregon (2014–2016). Available online: https://www.oregon.gov/energy/energy-oregon/Pages/Electricity-Mix-in-Oregon.aspx (accessed on 11 October 2019).
  32. U.S. Energy Information Administration. Oregon State Profile and Energy Estimates: Profile Overview. Available online: https://www.eia.gov/state/?sid=OR (accessed on 15 March 2020).
  33. Profita, C. Why Oregon Imports Power from Fossil Fuels and Exports Renewable Energy. Oregon Public Broadcasting. Available online: https://www.opb.org/news/blog/ecotrope/why-oregon-imports-power-from-fossil-fuels-and-exports-renewable-energy/ (accessed on 15 March 2020).
  34. Dillman, D.A. Mail and Internet Surveys: The Tailored Design Method, 2nd ed.; John Wiley and Sons: Hoboken, NJ, USA, 2007. [Google Scholar]
  35. Messer, B.L.; Edwards, M.L.; Dillman, D.A. Determinants of Item Nonresponse to Web and Mail Respondents in Three Address-Based Mixed-Mode Surveys of the General Public; Technical Report 12-001; Social and Economic Sciences Research Center: Pullman, WA, USA, 2012; Available online: https://subsites.sesrc.wsu.edu/dillman/papers/2012/SESRC%20Technical%20Report%2012-001.pdf (accessed on 12 December 2019).
  36. Portney, K.E.; Hannibal, B.; Goldsmith, C.; McGee, P.; Liu, X.; Vedlitz, A. Awareness of the food-water-energy nexus and public policy support in the United States: Public attitudes among the American people. Environ. Behav. 2017, 50, 1–26. [Google Scholar] [CrossRef]
  37. Sprang, E.E.; Holguin, A.A.; Loge, F.J. The estimated impact of California’s urban water conservation mandate on electricity consumption and greenhouse gas emissions. Environ. Res. Lett. 2018, 13, 014016. Available online: https://iopscience.iop.org/article/10.1088/1748-9326/aa9b89/pdf (accessed on 7 February 2020). [CrossRef]
  38. Gromet, D.M.; Kunreuther, H.; Larrick, R.P. Political ideology affects energy-efficiency attitudes and choices. Proc. Natl. Acad. Sci. USA 2013, 110, 2314–2319. [Google Scholar] [CrossRef] [Green Version]
  39. Fobissie, E.N. The role of environmental values and political ideology on public support for renewable energy policy in Ottawa, Canada. Energy Policy 2019, 134, 110918. [Google Scholar] [CrossRef]
  40. Buylova, A.; Steel, B.S.; Simon, C.A. Public perceptions of energy scarcity and support for new energy technologies: A western U.S. case study. Energies 2020, 13, 238. [Google Scholar] [CrossRef] [Green Version]
  41. Wolters, E.A.; Steel, B.S.; Warner, R.L. The food-water-energy nexus and household behavior: An Oregon case study. J. Rural Community Dev. 2019, 14, 11–22. Available online: https://journals.brandonu.ca/jrcd/article/view/1642 (accessed on 11 October 1999).
  42. Steel, B.S.; Wolters, E.A.; Warner, R.L. Public preferences for food-energy-water tradeoffs in the western U.S. Sustainability 2019, 11, 5200. [Google Scholar] [CrossRef] [Green Version]
  43. Bolsen, T.; Cook, F.L. The Polls—Trends: Public Opinion on Energy Policy: 1974–2006. Public Opin. Q. 2008, 72, 364–388. [Google Scholar] [CrossRef]
  44. Noblet, C.L.; Teisl, M.F.; Evans, K.; Anderson, M.W.; McCoy, S.; Cervone, E. Public preferences for investments in renewable energy production and energy efficiency. Energy Policy 2015, 87, 177–186. [Google Scholar] [CrossRef] [Green Version]
Figure 1. Comparison of Linear Probability to Logistic Regression.
Energies 13 01890 g001
Table 1. Survey Response Rates.
StateSample Size ResponsesResponse Rate% Online Return
California117043537.2%31.7%
Idaho117544037.4%18.9%
Oregon117347540.5%24.2%
Washington117745438.6%19.2%
Table 2. Survey Response Bias.
California
Demographic VariableSurvey SampleCensus Estimates 1
Mean Age (Over 18)47.747.1
Median Household Income$50,000–$74,999 (Survey category 6)$60,883 (2006–2010 adjusted average)
Gender (Over 18)Men 51.3%, Women 48.7%Men 49.5%, Women 51.5%
Associates Degree or Higher (Over 18)40.3%36.7%
Idaho
Demographic VariableSurvey SampleCensus Estimates 1
Mean Age (Over 18)52.648.0
Median Household Income$50,000–$74,999 (Survey category 6)$46,890 (2006–2010 adjusted average)
Gender (Over 18)Men 49.9%, Women 50.1%Men 50%, Women 50%
Associates Degree or Higher (Over 18)42.3%39.1%
Oregon
Demographic VariableSurvey SampleCensus Estimates 1
Mean Age (Over 18)55.349.5
Median Household Income$50,000–$74,999 (Survey category 6)$49,260 (2006–2010 adjusted average)
Gender (Over 18)48.7% Men, 51.3% Women48.4% Men, 51.6% Women
Associates Degree or Higher (Over 18)38.1%35.0%
Washington:
Demographic VariableSurvey SampleCensus Estimates 1
Mean Age (Over 18)50.348.5
Median Household Income$50,000–$74,999 (Survey category 6)$57,224 (2006–2010 adjusted average)
Gender (Over 18)48.3% Men, 51.7% Women48.7% Men, 51.3% Women
Associates Degree or Higher (Over 18)44.8%38.8%
1 Data obtained from the U.S. 2010 American Community Survey Public Use Microdata Sample, United States Census Bureau, https://www.census.gov/programs-surveys/acs/data/pums.html.
Table 3. Descriptive Statistics.
Variable NameVariable DescriptionDescriptive Statistics
AgeAge in years (range = 18 to 98)Mean = 51.6
s.d. = 16.83
n = 1796
GenderGender dummy variable (1=women, 0=men)Mean = 0.504
n =1787
EducationFormal educational attainment (1=less than high school to 8=postgraduate degree)Mean = 4.80
s.d. = 1.46
n = 1798
IncomeHousehold income before taxes in 2017. (1 = less than $10,000 to 10 = $200,000 or more)Mean = 5.88
s.d. = 1.80
n = 1772
NEPNew Ecological Paradigm (6=low level of support to 30 = high level of support)Mean = 20.73
s.d. = 5.43
n = 1782
IdeologySubjective Political Ideology (1 = very liberal to 9 = very conservative)Mean = 4.68
s.d. = 2.16
n = 1782
%Oppose%Neutral%Support
Energy Policies: InfrastructureBuild additional power plants20.738.141.3
Build pipelines to bring oil from other regions49.217.633.2
Relax environmental standards for energy industries64.421.214.4
%Oppose%Neutral%Support
Energy Policies: ConservationConduct campaigns for voluntary energy conservation10.016.973.1
Require that new construction meets high energy efficiency standards8.811.779.5
Increase federal funding for research on renewable energy technologies14.516.569.0
%Oppose%Neutral%Support
Energy Policies: Price DiscriminationCharge higher energy rates during high demand times of day40.321.837.9
Charge higher energy rates for high volume users25.120.854.1
Table 4. Public Support and Opposition to Energy Policies.
Question: A Number of Policy Options Have Been Proposed to Manage Energy Resources. Please Indicate Your Level of Opposition or Support for Each of the Following Options.
CaliforniaIdahoOregonWashington
Infrastructure
a.Build additional power plants [Chi-square = 77.95, p = 0.000]
% Oppose17.712.726.924.6
% Neutral33.633.943.440.9
% Support48.653.529.734.5
N=434434472452
b.Build pipelines to bring oil from other regions [Chi-square = 67.57, p = 0.000]
% Oppose48.834.956.256.1
% Neutral17.119.219.914.3
% Support34.145.923.929.6
N=434438473453
c.Relax environmental standards for energy industries [Chi-square = 54.77, p = 0.000]
% Oppose68.054.964.070.5
% Neutral17.322.927.217.1
% Support14.722.28.812.4
N=434437475451
Conservation
d.Conduct campaigns for voluntary energy conservation [Chi-square = 102.49, p = 0.000]
% Oppose21.010.13.66.0
% Neutral10.421.020.015.9
% Support68.768.976.478.1
N=434437475453
e.Require that new construction meets high energy efficiency standards [Chi-square = 102.24, p = 0.000]
% Oppose15.78.93.28.2
% Neutral11.320.24.811.0
% Support73.070.992.080.8
N=434437475453
f.Increase federal funding for research on renewable energy technologies [Chi-square = 42.61, p = 0.000]
% Oppose21.317.78.411.3
% Neutral12.015.619.618.3
% Support66.766.772.070.4
N=433436475453
Price Discrimination
g.Charge higher energy rates during high demand times of day [Chi-square = 42.43, p = 0.000]
% Oppose35.548.944.432.5
% Neutral21.720.024.021.4
% Support42.831.131.646.1
N=438438475453
h.Charge higher energy rates for high volume users [Chi-square = 77.95, p = 0.000]
% Oppose26.330.026.717.7
% Neutral14.023.322.323.1
% Support59.746.750.959.2
N=434437475451
Table 5. Logistic Regression Estimates for Energy Infrastructure Policies.
Build Power Plants aBuild PipelinesRelax Environmental Standards
CoefficientCoefficientCoefficient
(S.E.)(S.E.)(S.E.)
Exp(B)Exp(B)Exp(B)
Age0.008 *−0.0040.005
(0.003)(0.004)(0.005)
1.010.9961.005
Gender−0.273 *0.1860.005
(0.110)(0.131)(0.166)
0.7611.2051.005
Education0.087 *−0.064−0.202 ***
(0.040)(0.047)(0.060)
1.0911.2050.817
Income−0.0070.092 *0.184 ***
(0.032)(0.038)(0.049)
0.9931.0971.202
Ideology0.095 **0.330 ***0.337 ***
(0.031)(0.037)(0.051)
1.101.3911.401
NEP−0.137 ***−0.196 ***−0.149 ***
(0.013)(0.015)(0.017)
0.8720.8220.861
Idaho0.437 ***0.586 ***0.694 ***
(0.125)(0.142)(0.171)
1.5491.7962.002
N =171517181718
Chi-square =321.372 ***649.276 ***374.378 ***
Percent predicted =71.380.588.0
Nagelkerke R2 =0.2300.4370.347
a 1 = support policy, 0 = else * p ≤ 0.05; ** p ≤ 0.01; ***p ≤ 0.001.
Table 6. Logistic Regression Estimates for Energy Conservation Policies.
Conduct Campaigns aRequire Energy EfficiencyIncrease Funding
CoefficientCoefficientCoefficient
(S.E.)(S.E.)(S.E.)
Exp(B)Exp(B)Exp(B)
Age−0.014 ***−0.004−0.023 ***
(0.004)(0.005)(0.004)
0.9860.9960.977
Gender−0.2400.010−0.299 *
(.131)(.153)(0.131)
0.7861.0100.742
Education0.350 ***0.0460.181 ***
(0.050)(0.053)(0.047)
1.4201.0471.198
Income0.0340.160 ***0.033
(0.037)(0.044)(0.037)
1.0351.1731.033
Ideology−0.134 ***−0.315 ***−0.098 **
(0.036)(0.035)(0.035)
0.8751.3910.907
NEP0.155 ***0.274 ***0.226 ***
(0.014)(0.018)(0.016)
1.1671.3151.273
Idaho−0.118−0.456 **0.241
(0.144)(.163)(0.148)
0.8890.6341.273
N =171817181717
Chi-square =535.440 ***535.440 ***560.998 ***
Percent predicted =79.686.580.8
Nagelkerke R2 =0.4210.4210.394
a 1 = support policy, 0 = else * p ≤ 0.05; ** p ≤ 0.01; *** p ≤ 0.001.
Table 7. Logistic Regression Estimates for Energy Price Discrimination Policies.
Charge Higher Rates During Demand Times aChange Energy Rates for High Volume Users a
CoefficientCoefficient
(S.E.)(S.E.)
Exp(B)Exp(B)
Age−0.012 ***−0.016 ***
(.003)(0.003)
0.9880.984
Gender−0.298 **−0.195
(0.114)(0.113)
0.7420.822
Education0.339 ***0.247 ***
(0.041)(0.041)
1.4041.280
Income0.262 ***0.126 ***
(0.034)(0.033)
1.2991.134
Ideology−0.088 **−0.137 ***
(0.031)(0.031)
0.9160.872
NEP0.094 ***0.133 ***
(0.014)(0.013)
1.0981.143
Idaho−0.246−0.314*
(0.130)(0.135)
1.2791.370
N =17191717
Chi-square =367.604 ***426.098 ***
Percent predicted =69.572.5
Nagelkerke R2 =0.2610.294
a 1 = support policy, 0 = else * p ≤ 0.05; ** p ≤ 0.01; *** p ≤ 0.001.

