1. Introduction
A low-permeability sandstone petroleum reservoir is usually characterized by low porosity, a tiny pore throat, low productivity, and poor permeability. Because of its unique features, it always needs to be fractured to maintain normal production [
1,
2,
3,
4,
5]. At present, there are differences in the partitioned standard of low-permeability reservoirs in different countries. For example, a low-permeability reservoir was defined by the former Soviet Union as one with permeability of less than (50–100) × 10
−3 µm
2 [
5], and by the Federal Energy Regulatory Commission (FERC) in the United States as less than 0.1 × 10
−3 µm
2 [
4]. On the basis of the Peoples’ Republic of China Natural Gas Industry Standards (Oil–Gas Reservoir Evaluation) (SY-T6285-1997), low-permeability sandstone reservoirs containing oil are divided into low-permeability (50 × 10
−3 to 10 × 10
−3 µm
2), very low-permeability (10 × 10
−3 to 1 × 10
−3 µm
2), ultralow-permeability (1 × 10
−3 to 0.1 × 10
−3 µm
2), and non-permeability (<0.1 × 10
−3 µm
2) reservoirs; low-permeability sandstone reservoirs containing gas are divided into low-permeability (10 × 10
−3 to 0.1 × 10
−3 µm
2) and ultralow-permeability (<0.1 × 10
−3 µm
2) reservoirs [
6]. In this study, a reservoir with permeability of less than 10 × 10
−3 µm
2 was deemed to be a low-permeability sandstone reservoir.
Gas resources in low-permeability reservoirs are globally distributed, such as in North America, Asia, North Africa, Northern Europe, and other regions [
1,
2,
3,
4,
7]. With wide oil and gas exploration, gas resources in low-permeability reservoirs are growing. In China, according to the third hydrocarbon-resource survey, prospective gas resources in low-permeability reservoirs take up 42.8% of the national resource total [
8]. In 2013, gas production in low-permeability reservoirs was 510 × 10
8 m
3 in China, which is 42.1% of the country’s total production. The proportion of gas production in low-permeability reservoirs is rising by each year. At present, the stock of gas resources in China is 49.6 × 10
12 m
3, and gas resources in low-permeability reservoirs are 24.8 × 10
12 m
3, occupying 51% of the total [
5].
The Sulige gas field with low-permeability sandstone is the largest natural gas field in China, of which the gas production is mainly from the Shan1 member of the Shanxi formation and the He 8 member of the Xiashihezi formation in the lower Permian [
9,
10,
11,
12]. The gas field had reserves of about 0.419 × 10
12 m
3 in the He 8 member, and 1.147 × 10
12 m
3 in the Shan1 member by the end of 2005. Extensive gas exploration and development in Sulige began in 1999. Daily gas production was over 0.46× 10
8 m
3 in 2011, and annual production was over 200 × 10
8 m
3 in 2016. Although the Sulige gas field is abundant of natural gas resources, complex geological conditions and strong reservoir heterogeneity increase the risks of gas exploration. Many studies on the upper Paleozoic gas pools of the Ordos basin were performed in recent years, and agreed in some respects, such as hydrocarbon-source rocks, main reservoirs, and gas distribution [
13,
14,
15,
16,
17]. Exploration showed that gas accumulation in low-permeability sandstone was characterized by unique formations and distribution, such as complex gas–water distribution, high water saturation, and large-area gas distribution. Thus, it is difficult to explain it by using conventional gas accumulation theory [
1,
4,
7,
18,
19,
20,
21]. As a low-permeability sandstone gas reservoir, studies on the formation and distribution of the gas reservoir in Sulige play an important role in promoting the exploration and development of this area.
Based on data obtained from exploration and development of petroleum, previous achievements, and physical simulation experiment of gas percolation, the gas reservoir distribution and the formation mechanism in a low-permeability sandstone gas reservoir are discussed comprehensively in this paper in the upper Paleozoic gas pool of the Sulige gas field in the Ordos basin. It is hoped that this study will be guide to the further exploration and development of low-permeability sandstone gas reservoir in Ordos basin.
2. Geological Settings
As part of the craton in North China, the Ordos basin is one of the most stable craton blocks. The whole basin is a simple megasyncline with two asymmetrical wings, of which the rectangular outline is formed by the northern and southern ends inclining to the basin. The main part of the basin is limited by the surrounding fracture, and the bulk of the basin inclines gently to the west with an angle of less than 1° [
9,
10,
11,
12,
22,
23]. Besides structures including the edge fold, breakage, and bend developed around the basin, faults and anticlines are not well-developed in the basin [
12,
24]. On the basis of previous studies, the Ordos basin could be divided into six first-order tectonic units (
Figure 1) [
25]. As a gentle monocline with 3 to 10 m/km gradient, the Sulige gas field is located in Suligemiao in the Ordos basin, Inner Mongolian Autonomous Region, of which the structure belongs to the northwest part of the Yishan slope (
Figure 1). There are multiple rows of northeastern low nose uplifts (10 to 20 m uplifted range, 5 to 15 km north–south wide, and 10 to 20 km long) developed in the monoclinic back of the Sulige gas field. The Sulige exploration area is 2 × 10
4 km
2 [
11].
Sedimentary strata include Cambrian, Ordovician, Carboniferous, Permian, Triassic, Jurassic, Tertiary, and the Quaternary sequences in the Ordos basin. The Upper Paleozoic is made up of the Benxi formation of the upper Carboniferous; the Taiyuan, Shanxi, and Xiashihezi formations of the Low Permain; the Shangshihezi and Shiqianfeng formations of the upper Permain; and the missed Devonian and Low and Middle Carboniferous [
9,
11,
12] (
Figure 2).
Coal and dark mudstone were developed in the Taiyuan and Shanxi formation (
Figure 2), and they are widely distributed hydrocarbon-source rocks in the Ordos basin [
16]. Coal seams are 10–20 m in thickness on average (up to 25 m in places). The organic carbon content in coal ranges from 70% to 84%, chloroform bitumen “A” content from 0.6% to 0.8%, and total hydrocarbon content from 1760 to 2540 ppm [
10,
15]. Dark mudstones are 100–150 m in thickness, having 2.25% to 3.33% organic carbon content, 0.037 to 0.12 chloroform bitumen “A” content, and 163.76 to 361.6 ppm total hydrocarbon content [
10,
15].
The tectonic subsidence and tectonic thermal event during the Yanshanian orogeny resulted in a high paleogeothermal gradient in the end of the Early Cretaceous. The source rocks reached a mature or high mature stage, of which vitrinite reflectance (
Ro) was 1.48–2.21% [
16,
26]. There are large amounts of gas generation. The gas generation intensity is 18 × 10
8 to 40 × 10
8 m
3/km
2 around the Sulige gas field during its peak period [
23].
The gas reservoirs distributed in the Shan1 and He8 members are controlled by a delta plain distributary channel sand body, and are north–south stripped spread [
12,
17]. The sand body in the He8 member has 10 to 50 m thickness and 10– to 0 km width, and spreads 200 km above to the north and south; the sand body in Shan1 has 5 to 15 m thickness and 3 to 5 km width. The polyphase-sand layers are reciprocally superposed. Reservoir sands are mainly made up of gray medium (0.25–0.5 mm), coarse-grained (0.5–1.0 mm), and very coarse-grained sandstones (1.0–2.0 m), quartzy sandstone, and light-gray medium–coarse-grained litharenite [
10,
11,
15]. The quartz content in sandstone was relatively higher than the content of others, with an average of 85%. The lithology of the reservoir is chiefly midfine-grained sandstone with intergranular pores and all kinds of dissolution pores.
The distributary channel sand body is often thin around and changes into floodplains or distributary channel mudstone. The sandy mudstone and mudstone distributed between the He8 and He7 members are the direct caprock, while mudstone distributed in the Xiashihezi–Shiqianfeng formation forms the regional caprock. Since it was reported that mudstone is a favorable lateral seal, it is speculated that the regional caprock is favorable for gas preservation.
3. Methods
Data were from petroleum exploration and early development in the Ordos basin. The characteristics of gas reservoirs and their formation mechanism are investigated on the basis of data obtained by drilling, well logging, mercury injection, development, previous research, and physical simulation experiments of gas migration and accumulation.
The data such as permeability, reservoir pressure, and gas saturation, were collected from 654 exploratory drillings for petroleum. The pore structure data were determined by mercury injection testing. The gas flow data were obtained by the physical simulation experiment.
The mercury injection testing was carried out on Auto Pore9505 mercury porosimetry produced by Micromeritics Instrument Corporation. The pressure of porosimetry ranges from 0 to 228 MPa, and the aperture measurement ranges from 0.005 to 360.000 µm. The samples were grinded and sieved below 200 mesh before they were added in a vacuum drying oven and dried for 2 h at 105 °C. The dry samples of 4 g were sealed in the airtight tube for experiments.
The gas–water distribution was analyzed by well logging and gas testing. The dry layer and permeable layer were divided by well logging and gas testing. There is no gas and water in the dry layer that is characterized by high natural gamma value, medium-high density, nor high resistivity. The permeable layer was divided to the dry layer, water layer, gas-water layer, and gas layer by the AC-DEN, and GR-Rlld intersection diagram method [
27]. Based on the gas-water identification, the gas-water distribution characteristics were studied by a large number of single well loggings.
The physical simulation experiments were executed on the simulation experiment set of gas migration and accumulation in the State Key Laboratory for Petroleum Resources and Prospecting, China University of Petroleum, Beijing. The original reservoirs were filled with water before gas charging in geological setting. Gas generates in source rocks and migrates into the reservoirs, and water is substituted by gas in reservoirs [
28,
29]. The characteristics of gas migration and accumulation were investigated by the experiments of gas displacing water. The experimental cores were selected from the Shan1 and He8 members in Sulige. The location of the selected core samples is shown in
Figure 1; the diameter, length, permeability, and porosity of the core samples were 2.5 cm, 4.6~8 cm, 0.013 × 10
−3 µm
2 to 1.78 × 10
−3 µm
2, and 1.1% to 13.9%, respectively.
As shown in
Figure 3, the experiment setup was composed of five parts: the fluid injection, fluid driving, temperature and pressure control, fluid testing, and the data collection and processing systems. Every system was automatically controlled by computer. The experiments were performed under room temperature. Argon served as the experiment gas to avoid core adsorption on gas.
In order to wipe off the hydrocarbon, water, salt, and other compounds, core samples were washed by alcohol and benzene with a ratio of 3:1 using a fully automatic washing oil instrument with a wash time of ~30 days. The washed cores were dried in an oven at 60 °C for ~12 h. Then, the obtained cores were measured for weight, length, diameter, porosity, and permeability.
Core samples were placed in a high-tension container and vacuumized with a vacuum pump for ~12 h. Subsequently, samples were saturated with water at a solid concentration of 20 g L−1, and vacuumized for ~4 h. Lastly, the samples were taken out for wiping off their surface water using filter papers. Pore volume was obtained by the difference between core wet and dry weight, dividing water density.
The cores saturated with water were held in the core grippers and pressured with an annular pump at 3 Mpa to make the gas flow through the core section or not through the interspace between the cores and the core grippers. Generally, annular pressure with a value of 3 Mpa is always greater than import pressure. When annular pressure is lower than the required pressure, gas flows through the contact walls. After starting the ISCO pumps, constant pressure (P1) was set, and the gas was injected into the core grippers. The injection rate, the export rate of gas, and the displaced water or gas volume of the export were recorded. When the gas flow rate of the import was equal to that of the export, pressure was changed to P2.
4. Results
4.1. Natural Gas Reservoir Characteristics
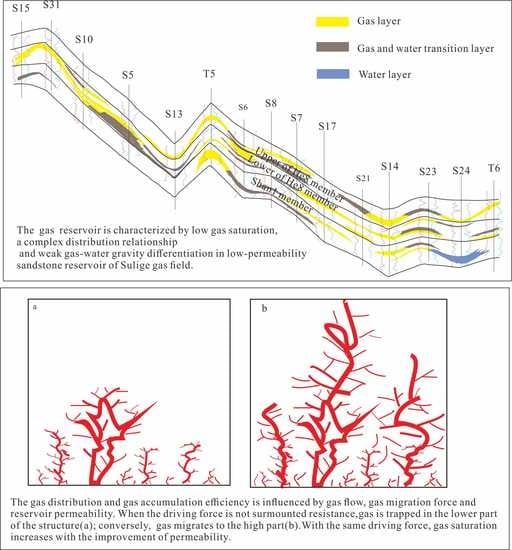
The Sulige gas field has typical characteristics of low porosity, low-permeability, low reservoir pressure, and low resource abundance. Reservoirs are extremely heterogeneous, and gas saturation is low. In addition, there is a complex gas–water distribution relationship, such as being full of gas in the entire reservoir, no unified gas–water interface, and gas–water inversion.
4.1.1. Porosity, Permeability, and Reservoir Pressure
Upper Paleozoic sandstone reservoirs are mainly defined by low porosity and permeability, and locally relatively high porosity and permeability in the Sulige gas field, Ordos basin. According to statistics from 654 wells, porosity was mainly 0.7% to 15.23%, with an average of 6.53%; permeability was mainly 0.01 × 10
−3 to 12.24 × 10
−3 μm
2, with an average of 0.37 × 10
−3 μm
2. There was good correlation between porosity and permeability. Permeability increased with an increase of porosity [
29,
30], which showed that permeability is mainly controlled by reservoir pores, but not by fractures or cleats. On the basis of mercury injection testing analysis, displacement pressure was found to be generally high, in the range 0.1–4.97 MPa; the maximal pore throat radius was 0.25 to 181 μm, mostly 0.25 to 1.5 μm, with an average of 14.14 µm; the median capillary pressure was 0.1096 to 197 MPa, mostly 3 to 50 MPa; the median pore throat radius was 0.03 to 2.24 µm, with an average of 0.4 µm; the pore throat was relatively smaller. The gas storage capability of low-permeability in Sulige is controlled by pore throats, especially minimal pore throats.
Via drill stem tests (DST) in 104 wells, the reservoir pressure data were measured in Sulige field. The results showed that underpressure and ultra-underpressure were the most significant. The reservoir pressure coefficient ranged from 0.67 to 0.93 in the Shihezi formation, which was lower than hydrostatic pressure [
10]. Reservoir pressure increases and pressure coefficient decreases with the increase of buried depth (
Figure 4). Previous research showed that underpressure is controlled by formation temperature reduction and hydrocarbon diffusion, which was caused by tectonic uplift.
4.1.2. Gas Saturation
Gas saturation was generally less than 70%, and ranged from 40% to 60%, mostly in the study area (
Figure 5). Gas saturation is obviously controlled by a reservoir’s physical properties. A reservoir with relatively high porosity and permeability has higher gas saturation. Only when average reservoir porosity is greater than 5% and average permeability is higher than 0.15 × 10
−3 μm
2 can gas saturation be more than 50% in the sand body. The lower porosity limit of an effective reservoir is 5%, and the lower permeability limit is 0.15 × 10
−3 μm
2 in the Sulige gas field (
Figure 6).
4.1.3. Gas–Water Distribution
According to analysis of the developed wells, the average thickness of a single gas layer was 4 m, and there were a few gas layers that were more than 10 m thick in the Sulige gas field. Because reservoir permeability is vertically heterogeneous, an ultralow-permeability sandstone body becomes interlayer, which results in the thickness of continuous gas layers not being great. The gravity differentiation between gas and water does not play a significant role in a single gas layer. Gas–water contact at the base and at the reservoir perimeters is not obvious.
In an Upper Paleozoic reservoir, there is not only gas, but also water. Gas is mainly distributed in relatively higher-permeability reservoirs. Horizontally, continuous gas column height is usually no more than 20 m because of a heterogeneous reservoir. From the north–south section, we can see that the gas reservoir distribution is discontinuous, gas–water gravity differentiation is not obvious, there is no bottom water and edge water, and there is no obvious transitional gas–water zone. In the north of the section, reservoir permeability is relatively good and not greatly variational, so gas–water distribution is mainly affected by structure. Though gas–water gravity differentiation is not obvious, gas saturation is higher in the shallow end of a gas reservoir than the deeper end. In the southern deep-structure parts of the section, gas–water distribution is complex. There appeared to be abnormal gas–water distribution; for example, water was above gas, and gas saturation was higher in the lower end of the reservoir than that in the upper end. Multireservoirs containing gas are vertically overlapped because of interlayers. As a whole, gas–water distribution has the following characteristics in the study area: (1) all reservoirs have gas, (2) there is no unified gas–water interface, and (3) gas is above water or water is above gas (
Figure 7).
4.2. Gas Migration and Accumulation Characteristics
According to gas migration and accumulation physical simulation experiments, the gas migration flow curve commonly has a concave upward shape in the study area (
Figure 8). The curve is made up of two parts: a nonlinear flow part with a lower flow rate, and a pseudolinear flow part with higher flow rate. Due to the difference of sandstone permeability, the position of the flow cure, the curvature of the nonlinear part, and the intercept of the linear part on the pressure gradient axis are dissimilar. When permeability increased, the flow curve inclined to the velocity axis; when permeability decreased, the flow curve inclined to the pressure gradient axis. In addition, the lower the permeability, the longer the nonlinear flow part, the smaller the curvature of the nonlinear part, and the greater the intercept of the linear part on the pressure gradient axis.
When fluid pressure is not enough to overcome resistance that depends on capillary force, the gas migration rate is zero (i.e., segment o–a of
Figure 9). Diffusive force is the main driving force of gas migration and accumulation. The gas migration direction is unsettled and scattered. With the increase of the fluid pressure difference on both ends of the core, the driving force increases. When the driving force can overcome minimal but not all resistance during the process of gas migration, gas migrates by the way of non-Darcy flow (i.e., segment a–c of
Figure 9). Point a is defined as the threshold pressure gradient that corresponds to minimal resistance [
31,
32,
33]. Point c corresponds to the maximal resistance of the gas migration path.
When gas enters the reservoirs and begins to migrate, there are many gas migration paths; thus, it is possible that there are many Points a. Gas migrates mainly along the path with relatively higher permeability, but not along all paths. After a period of time, gases migrate along the path with a greater pore throat where gases originally did not move (standstill) when the driving force on the main path might not overcome all resistance. The above process is repeated until fluid pressure overcomes the resistance of Point c, and the dominant path of gas migration is formed. During the process of gas migration along the main path, gases quickly move forward once gas–fluid pressure difference is big enough to overcome the resistance of the tiny pore throat. When the pore throats of a path front become tinier, which can make resistance greater, the driving force cannot overcome resistance, so gas migration stops until the accumulated fluid pressure difference is again greater than the resistance. Gas migration is a repeated migration-stop-migration-stop process [
34]. The migration shows non-Darcy flow with low speed [
32,
35]. When the fluid pressure difference is greater than Point c, gases migrate by way of Darcy flow. There are dominant paths of gas migration forming. The curve is linear.
It is different for gas accumulation with sandstone reservoirs of different permeability levels under the condition of driving force. There is a certain relationship between driving force (pressure gradient) and gas saturation when permeability is similar. Gas saturation increases with the increase of driving force. The growth process of gas saturation can be divided into three stages with the increase of pressure gradient (
Figure 10).
- (1)
The rapid growth stage: gas saturation linearly increases with increasing driving force. Under the same pressure gradient, the higher that permeability is, the greater gas saturation is. For example, on the condition of 0.25 MPa/cm of pressure gradient, the gas saturation of three cores, of which the permeability is 0.098 × 10⁻³, 0.429 × 10⁻³, and 1.78 × 10⁻³ µm2, can reach 14%, 34%, and 56%, respectively. That is to say, in this stage, the higher that permeability, the shorter the gas accumulation time and the higher the gas accumulation rate.
- (2)
The slow growth stage: with the unceasing increase of driving force, the increase rate of gas saturation becomes obviously slow, and the gas accumulation rate is reduced.
- (3)
The stable stage: gas saturation remains unchanged no matter how much the driving force increases in this stage. Final gas saturation increases with the increase of permeability. When permeability is lower than 0.15 × 10⁻³ µm2, gas saturation is less than 40%, which is noneffective gas accumulation. Only when permeability is higher than 0.15 × 10⁻³ µm2 is gas saturation more than 40%, and gas accumulation effective. Gas saturation contained in most cores ranged from 30% to 60%, which is similar to actual geological conditions.
5. Discussion
5.1. Gas Distribution Influenced by Gas Flow
When gas migrates in the sandstone reservoirs, it is a process of the nonwetting phase displacing the wetting phase. Capillary force, wetting lagged effect, adsorption, and viscous force are the main resistance of gas migration. Whether gas migrates or not and how it does so depends on the relationship between driving force and resistance. This has important effects on gas migration, whether a pore throat is narrow, and whether communication between pores is poor in low-permeability sandstone reservoirs [
36,
37,
38,
39]. The lower the permeability is, the greater the resistance is; the larger the threshold pressure gradient is, the longer the non-Darcy flow part is, and the stronger the gas retention in sandstone is.
Diffusive force, buoyancy, and fluid pressure difference are the main powers of gas migration. Diffusive force cannot be neglected during the process of gas migration. Diffusive force leads to gas migrating from the higher- to the lower-concentration side until there is equilibrium in concentration [
28]. As long as there is concentration difference, diffusion occurs for a long period of time, no matter how great the resistance is. Compared with abnormal pressure and buoyancy, diffusive force has low efficiency [
19].
Buoyancy may play a role, depending on the gas column height, during gas migration. When the gas column height is large enough to overcome the resistance caused by the capillary effect, buoyancy is the main driving force of gas migration. In low-permeability sandstone reservoirs, it is difficult for buoyancy to overcome resistance because of its small pore throat and big capillary force. According to the mercury injection data, the capillary force was 0.15–2.0 MPa, and mainly more than 0.2 MPa (
Figure 11). Gas density ranged from 0.55 to 0.70 kg/m
3, and the formation water density was about 1.18. Using the critical hydrocarbon column height formula put forward by Berg [
40], the critical gas column height was calculated. The results showed that the critical gas column height was mainly distributed from 40 to 200 m. In fact, the continuous gas column height is commonly less than 20 m in the Sulige gas field. It is difficult for large-scale gas migration in Sulige to only happen via buoyancy. The main driving force for gas migration is possibly fluid pressure difference.
Gas generation is continuous in coal and dark Carboniferous–Permian mudstone. Buried Carboniferous-Permian depth reached 3000 to 4000 m or more in the Low and Middle Jurassic. The hydrocarbon-source rock began to mature (
Ro,max > 0.5) with temperatures of 90 to 110 °C, and a good deal of wet gas and gas condensation was generated. From the Upper Jurassic to the Low Cretaceous, strata had continued subsidence and were buried to reach their maximal depth, more than 4000 m. The tectonic thermal event during the Yanshanian orogeny caused an abnormal paleogeothermal field. The temperature that acted on the Carboniferous–Permian reached 140 to 240 °C. The hydrocarbon-source rock is highly mature or excessively mature (
Ro,max > 1.3%). A large amount of dry gas was generated. Fluid volume in the pores increased, which led to an improvement in fluid pressure. The formations were superpressured. Pressure difference between source rock and reservoir reached 22 to 26 Mpa and became the main driving force of gas migration [
41,
42]. The Upper Paleozoic reservoir was in Phase A of late diagenesis in the Late Jurassic period. The original pores were significantly reduced at the end of the Triassic, of which porosity was only 3% to 11%, and reached 6% to 8.4% in the Early–Mid Jurassic [
43,
44,
45], which is close to today’s porosity. Reservoir densification was earlier than large-scale gas migration.
Gas entered the low-permeability reservoir under the action of source–reservoir pressure difference, and first accumulated in the pores near the source rock. Then, the formed migration paths had many branches. With the generation of much gas, the fluid pressure differences increased and drove gas to migrate upward. When pressure difference was not great enough to overcome maximal migration resistance, gas stopped migrating and was detained in the deep structure parts. Gas–water inversion distribution was formed. When the pressure difference could overcome capillary pressure, gas quickly got through the sandstone pores, migrated upward with linear flow, and accumulated in the structural trap. As we mentioned above, buoyancy in the Sulige gas field is generally less than capillary force, which resulted in unobvious gas–water gravity differentiation. There exists a threshold pressure gradient when gas migrates in low-permeability sandstone. The main way of gas migration is non-Darcy flow with low speed that aggravates gas retention. In such a fluid flow condition, it is difficult for the gas to migrate long-distance and generally short-distance; therefore, gas migration in Sulige gives priority to vertical migration and is laterally short. The formation of the gas reservoir is manly closed-source. The tectonic form is relatively complete, and it is higher in the north than south. There are conventional structural gas reservoirs in the norther high structure (i.e., segment S15-S5 of
Figure 7). Though gas–water gravity differentiation is not obvious, gas saturation is higher in the shallow end of a gas reservoir than the deeper end. Due to the existence of vertical compartments, a number of gas-containing layers are formed. In the southern deep-structure parts of the section((i.e., segment S6-T6 of
Figure 7) the natural gas is trapped in the lower part of the structure, because the due to the gradual deterioration of the lateral physical property, the buoyancy is not enough to cause the upward migration of natural gas, and, forming unconventional stagnant gas reservoirs, showing the abnormal gas-water distribution characteristics of the lower gas and the upper pressure difference was not great enough to overcome maximal migration resistance. There appeared to be abnormal gas–water distribution, for example, water was above gas, and gas saturation was higher in the lower end of the reservoir than that in the upper end.
5.2. Gas Accumulation Efficiency Influenced by Gas Migration Force and Reservoir Permeability
In Sulige, gas–water distribution is complex, gas saturation is low, and gas is mainly distributed in relatively higher-permeability reservoirs, As mentioned previously, gas–water distribution resulted from the retention effect caused by low-speed non-Darcy flow and threshold pressure gradient when gas migrates in low-permeability sandstone reservoirs. Permeability has an effect not only on gas–water distribution, but also on gas accumulation.
On the one hand, reservoir permeability affects reservoir gas distribution in low-permeability reservoirs. When gas and water move in low-permeability sandstone pores, the phase interface is bent, and capillary force is produced because of the different molecular forces between gas, water, and solid surfaces. When gas migrated in pores dominated by water, there is still water on the contact belt between gas bubbles and pore walls, and the gas–water bending surface formed. The curvature radius of the gas–water bending surface is different in different pore throats. When the pressure of the fluid column reached P, the bending surface is distorted because of the wetting lag action. There were advanced angle
θ1 and back angle
θ2,
θ1 >
θ >
θ2. When gas migrated in the different pores and pore throats, capillary pressure on both ends of the gas column were, respectively,
where
R >
r,
θ1 >
θ >
θ2, so
Pc2 >
Pc1. When gas moved to a pore with larger diameter, namely, from a pore with a smaller to a bigger curvature radius,
Pc2 was in accordance with the movement direction,
Pc1 was opposite the movement direction, the resultant force was directed to the pore with larger radius, and capillary pressure difference was the driving force. Capillary pressure difference, on the other hand, was resistance (
Figure 12).
In a low-permeability reservoir, when gas migrates from a lower-permeability reservoir to a reservoir with relatively higher permeability, the pore throat radius becomes bigger. Then, the capillary pressure difference drives gas migration to relatively higher-permeability areas, so a relatively higher-permeability area in a low-permeability reservoir is favorable for gas accumulation. The greater the differential between relatively higher- and lower-permeability belts, the greater the capillary pressure difference, and the better the hydrocarbon accumulation. When gas migrates to a relatively lower-permeability area, the capillary pressure difference is resistance that can hinder gas migration and accumulation.
On the other hand, permeability affects the degree of gas saturation. Gas saturation increases with the increase of gas migration and accumulation driving force, but gas saturation no longer changes, no matter how great the driving force is when gas saturation reaches a certain value. That is related to irreducible water saturation of low-permeability sandstone [
46]. When gas migrates and accumulates in reservoirs originally wet by water, it is impossible for gas to displace all water because of the effect of the capillary and membrane constraints. The remnant water is called irreducible water; the corresponding saturation is called irreducible water saturation. Previous research showed that irreducible water in a reservoir was obviously affected by the nature of the solid, and irreducible water saturation has a relationship with sandstone type, porosity, and pore structure, especially porosity and median pore throat radius [
47].
The porosity of low-permeability sandstone is generally less than 15%. Pore throat configuration is mainly made up of tiny pores and slender pore throats in the Upper Paleozoic sandstone reservoir of Sulige, so there is generally larger irreducible water saturation and relatively low gas saturation.
In the early stage of gas migration and accumulation, there existed reducible water in the reservoir, so gas could displace water and accumulate in reservoir with increasing fluid pressure difference and rapidly increasing gas saturation. As mobile water was gradually displaced, a few parts of irreducible water flowed with appropriate driving force, which resulted in gas saturation slowly growing. Finally, a great deal of irreducible water was kept in the reservoirs, and gas saturation stopped increasing, no matter how great the driving force of gas migration and accumulation was (
Figure 10). The gas saturation is generally less than 70%, and mainly ranged from 40% to 60% due to the characteristics of low porosity, low-permeability and high irreducible water saturation in Sulige gas field.
6. Conclusions
Gas–water distribution is complex in the Upper Paleozoic sandstone gas reservoirs of Sulige gas field, Ordos basin. There is no unified gas–water interface, and no obvious gas–water transition zone. There simultaneously exist gas, gas–water, and water layers in one gas production area. Gas saturation is relatively low and between 40% and 60%. Gas layers are mainly distributed in the relatively high-permeability belts of low-permeability reservoirs. This kind of complex natural gas accumulation characteristics is closely related to reservoir permeability. Upper Paleozoic gas reservoirs have typical gas accumulation with low-permeability and low porosity. Average porosity is 6.53%, and average-permeability is 0.37 × 10⁻³ μm2. Displacement pressure of the reservoir was great, and the pore was small, which has direct impact on natural gas migration and accumulation.
Gas migration flow curves were commonly made up of a non-Darcy flow part with lower speed, and a Darcy flow part with higher speed in study area. There was a threshold pressure gradient. When permeability was lower, non-Darcy flow is more obvious. The source–reservoir fluid pressure differences generated in the Early Cretaceous were the main driving force for gas migration and accumulation. Under fluid pressure differences, gas entered the low-permeability reservoir. When the fluid pressure difference was less than the capillary pressure, gas stopped migrating and was retained in the deep-structure position, which led to gas–water distribution being inversed. When the driving force could overcome resistance, gas rapidly migrated up and accumulated in the appropriate traps. Because buoyancy was generally less than capillary force, gas–water gravity differentiation was not obvious. In such a fluid flow condition, gas is difficult to migrate for long; therefore, gas migration in the Sulige gas field gave priority to vertical migration.
The high irreducible water saturation of low-permeability sandstone had an effect on gas accumulation in the Sulige gas field, which led to low gas saturation (generally less than 60%)—no matter how great the gas migration driving force is. Only when permeability was greater than 0.15 ×10⁻³ µm2 could gas saturation be greater than 50%.
The relatively higher-permeability belts in low-permeability reservoirs are favorable for gas accumulation. The pore radius is larger, and the pore throat is thicker in higher- than in lower-permeability sandstone. There is capillary pressure difference between large and small pore radii. When gas migrates from a higher- to a lower-permeability reservoir, the capillary pressure difference is directly related to relatively higher-permeability belts, which is the gas migration driving force.


