Article

Latin Hypercube Sampling Method for Location Selection of Multi-Infeed HVDC System Terminal

1
College of Electrical and Information Engineering, Changsha University of Science and Technology, Changsha 410004, China
2
State Grid Hunan Electric Power Company Limited Economic & Technical Research Institute, Changsha 410004, China
3
College of Electrical and Information Engineering, Hunan University, Changsha 410082, China
*
Author to whom correspondence should be addressed.
Energies 2020, 13(7), 1646; https://doi.org/10.3390/en13071646
Submission received: 26 February 2020 / Revised: 24 March 2020 / Accepted: 26 March 2020 / Published: 2 April 2020
(This article belongs to the Special Issue Modern Power System Dynamics, Stability and Control)

Abstract

:
Owing to the stochastic states of power systems with large-scale renewable generation, the impact of high-voltage direct current (HVDC) systems on the stability of the power system should be examined in a probabilistic manner. A probabilistic small signal stability assessment methodology to select the best locations for multi-infeed high-voltage direct current systems in alternating current (AC) grids is proposed in this paper. The Latin hypercube sampling-based Monte Carlo simulation approach is taken to generate the stochastic operation scenarios of power systems with the consideration of several stochastic factors, i.e., load demand and power generation. The damping ratio of the critical oscillation modes and the controllability of power injection to oscillation modes are analyzed by the probabilistic small signal stability. A probabilistic index is proposed to select the best locations of high-voltage direct current systems for improving the damping of the oscillation modes. The proposed methodology is applied to an IEEE 39 bus system considering the stochastic load demand and power generation. The results of probabilistic small signal stability assessment and a time-domain simulation show that the installation of a high-voltage direct current system on the selected locations can effectively improve the system damping.

Graphical Abstract

1. Introduction

With the progress of power systems, especially the extension of large-scale interconnected power systems, the inter-area oscillation issue is becoming a major problem. The weak connection between subsystems may cause oscillation issues of the interconnected power system, particularly during the initial period of the interconnected power system. High-voltage direct current (HVDC) transmission systems are a promising method to enhance the connection of the interconnected power systems. The integration of HVDC systems makes the structure of the receiving-side power systems more complex. Moreover, the large-scale renewable generation can be integrated by HVDC systems, which increases the uncertainties of the system operation states. Thus, the location of HVDC, especially multi-infeed HVDC systems, on the system security and stability should be examined carefully [1,2].
Different methods have been proposed to investigate the best placement of HVDC converters. Most of the methods focus on the optimal power flow with the integration of HVDC power systems. In [3], an optimization algorithm is proposed to identify the HVDC line placement for the relief of congestion of transmission lines and saving the operational cost of the whole system. The trade-off between the minimization of operational cost and the controllability of the power flow is discussed in [4]. A comprehensive algorithm based on the flexibility matrix is proposed to determine the location of HVDC converters for balancing the cost and flexibility. In [5], the N-1 criterion is considered in the location selection of HVDC systems in meshed power systems to reduce the congestion. The problem is transferred to a mixed integer linear programming optimization problem and an adaptive approach is employed to improve the flexibility of the proposed method in large-scale power systems. With the penetration of renewable energy in power systems, the uncertainty of the system operational point is increased, which should be taken into account in the placement of HVDC. In [6], a double stage stochastic optimal algorithm is proposed to deal with uncertainties of load demand and power generation in a HVDC placement problem. The proposed method can find the best HVDC locations for minimizing the load of transmission lines without requiring many parameters. In [7,8], the multi-infeed short-circuit ratio (MISCR) defined by International Council on Large Electric systems (CIGRE) is used to identify the appropriate location of HVDC systems to improve the security of hybrid alternating current/direct current (AC/DC) power systems. However, the aforementioned papers did not consider the impact of HVDC locations on system stability, e.g., the oscillation issues.
Small signal stability analysis (SSSA) is a promising method to investigate the system stability. The conventional SSSA is based on the linearized model and the eigenvalue analysis method of the system is performed at a certain operating point, which belongs to deterministic stability analysis. To examine the stability of a system under different operating conditions, a great number of deterministic states need to be analyzed [9]. The main problem of the deterministic method is that it cannot objectively reflect the inherent uncertainty nature of the system’s network structure, power-generation mode, load level and element parameters. Therefore, it is difficult to comprehensively and accurately evaluate the overall system stability [10].
In 1978, Burchett applied the probability method to power system probabilistic small signal stability analysis (PSSSA) for the first time and analyzed the influence of uncertainty of system parameters following normal distribution on the stability of power systems in the case of small disturbance [11]. PSSSA refers to considering the uncertainty of input random variables, conducting SSSA on the power system, and using the probabilistic analysis method to obtain the probabilistic characteristics of the eigenvalues of the electromechanical mode. A quasi-Monte Carlo-based PSSSA method to evaluate the dynamic performance of electric vehicles and energy conversion systems is presented in [12]. A PSSSA method based on Monte Carlo (MC) approach for iterative assessment is proposed in [13] and the PSSSA considers the uncertainties of the operational states by modal analysis of small signal stability. Cumulative probability density function of damping ratios of oscillatory modes (OMs) is used as the evaluation index.
MC simulation is a statistical test method of parameter estimation when the sample size is large. MC has been widely used in power systems such as reliability assessment, and the number of tests has nothing to do with the scale of the system. MC is used to produce a great deal of random computational scenarios in accordance with the distribution density of the random sources [14]. Recent literature has used MC simulation for SSSA of power systems with small sets of random input variables [13,15]. Latin hypercube sampling (LHS) was first proposed by McKay et al. [16] in 1979. It is an efficient stratified sampling technique and it can obtain an accurate result with a much smaller sample size than simple random sampling (SRS) [17].
Owing to the multiple stochastic factors of interconnected power systems, e.g., load demand and power generation, the damping ratio of the OMs may vary with the change of operating states. The Latin hypercube sampling-based Monte Carlo simulation (LHS-MCS) can be used to identify the critical OMs and the locations for the DC system terminal. This paper proposes a PSSSA methodology to evaluate the best location for multi-infeed HVDC systems. The LHS-MCS approach is adopted to generate the stochastic operation scenarios of power systems with the consideration of several stochastic factors, i.e., load demand and power generation. The damping ratio of the critical OMs and the controllability of power injection to OMs are analyzed by the probabilistic small signal stability. A probabilistic index is proposed to select the best locations of HVDC systems for improving the damping of the OMs. The proposed methodology is tested on an IEEE 39 bus system by selecting the stochastic load demand and power generation. The results of PSSSA and the time-domain simulation show that the installation of the HVDC system on the selected locations can effectively improve the system damping.
The organization of this paper is as follows. Section 2 describes the theoretical background of uncertainty analysis, MC simulation, and the LHS method. Section 3 presents the proposed methodology and discusses the main issues associated with the conditions for application of LHS method in PSSSA and the calculation of probabilistic indices for selecting the best locations of multi-infeed HVDC systems. In Section 4, the selection results of the multi-infeed HVDC systems obtained from a New England 39 bus system are shown. In Section 5, comparisons and discussions with the results of other papers are given. Finally, Section 6 concludes the paper.

2. Theoretical Background

An HVDC system is a promising technique for renewable energy integration. With the increasing penetration of renewable energy integrated by HVDC systems, the operational point of whole power systems is time varying. The stability of hybrid AC/DC power systems could be influenced by the uncertainty originating from the load demand and power generation. In the planning stage of an HVDC system, the influence of HVDC station locations on the system stability must be investigated in a probabilistic way. To analyse the probabilistic stability of hybrid AC/DC power systems and evaluate the candidate locations of HVDC stations, the Monte Carlo method is employed to obtain the random operational scenarios and Latin Hypercube sampling method is used to improve the calculation efficiency.

2.1. Uncertainty Analysis Method

The general physical process of a system can be represented by establishing one physical model. This physical model can usually use an abstract function to represent input and output, and there is a certain mapping relationship, the function is described as:
p = h(q)
where the vector h is a set of functions describing the behavior of the model, such as the dynamic behavior of power system; q = [q1, q2,…]T is a vector of input variables; and p = [p1, p2,…]T is a vector of output variables.
From the perspective of probability theory, uncertainty analysis includes determination of the probability density function (PDF) of the output variable p generated by the function h and the PDFs defining the probability space of the input variable q. In addition, the PDF of the output variable p can be represented as a cumulative probability density function (CPDF). Both of the functions summarize the uncertainty of output variables, and yet CPDF provides more illustrative abstracts in sample-based studies. CPDF is formally defined by integration [13]
prob ( p i P ) = 1 + φ [ h ( q ) ] PDF ( q ) d q
where prob ( p i P ) is the probability that an output pi under P will happen, PDF(q) is the PDF of input variables, the differential dq is the integration domain, and:
φ [ h ( q ) ] = { 1   if   h ( q ) > P   0   if   h ( q ) P  
In fact, the integral (2) is obtained by some approximate procedure. Although there are some new methods have been proposed in other literature to Equation (2), the effectiveness of MC simulation in uncertainty evaluation has been proved in many fields [18,19].

2.2. Monte Carlo Simulation

MC simulation aims at estimating the probability of an event by a lot of experiments. The basic thought is firstly to establish a probabilistic model for the problem. The next step is to calculate the statistical characteristics of the problem through a large number of sampling experiments. The final step is to get all kinds of estimators to find the approximate answer.
The application of MC in uncertainty analysis is justified by two statistical theories: (1) the Law of Large Numbers, and (2) the Central Limit Theorem.
Let X1, X2, …Xk be a sequence of independent and identically distributed random variables with expectation E(Xk) = μ (k = 1, 2, …n). The arithmetic mean of n variables is calculated by:
X ¯ = 1 n k = 1 n X k
For any small value ε > 0, the Law of Large Numbers states that:
lim n P ( | X ¯ μ | ε ) = 0
Equation (4) indicates that the sampling average of Xk approaches converge in probability towards the expected value μ when n is large enough.
The distribution of the sample average can be described by the Central Limit Theorem. Assume that the variance of Xk is σ2 (0 < σ2 < ∞). For any real number x, the distribution function Fn(x) of sample average is calculated by:
lim n F n ( x ) = lim n P ( X ¯ μ σ / n x ) = x 1 2 π e t 2 2 d t = ϕ ( x )
where ϕ ( x ) is the standard normal distribution. When n is large enough, the average of the samples is similar to the normal distribution whose expectation is μ and the variance is σ 2 .

2.3. Latin Hypercube Sampling

LHS is an effective probabilistic sampling method which can be used to generate the necessary scenarios for PSSSA. X1, X2, …, XM is the M input random variables. Each random variable obeys a certain probability distribution:
Y m = F m ( X m ) .
where Ym is the probability of Xm and is scaled from 0 to 1, and Fm is the probability cumulative function of Xm. The cumulative curve is divided into N equal intervals and only one sampling value should be selected randomly in each interval, which is illustrated in Figure 1.
Then the nth sample value of the mth random variable xmn is calculated by the inverse function of Fm:
x m n = F m 1 ( n a N )
where a is an internal variable which meets the 0–1 distribution. The sample values of Xm can be written in a column vector as [xm1 xm2xmN]T. All the sample values of input variables construct a N*M sampling matrix. Then each column of the sampling matrix should be shuffled randomly, and each row constitute a random scenario [20].
LHS can effectively improve the computation efficiency of MC as the sampling number are reduced significantly without the loss of accuracy.

3. Proposed Method

3.1. Probabilistic Small Signal Stability Analysis

PSSSA can evaluate the dynamic performance of power systems considering uncertainty operation states. The stochastic operation scenario of power systems are generated firstly, and then the SSSA is used for each of the random scenarios. The probabilistic dynamic characteristics of power systems can be acquired by the probability statistics method, such as distribution of eigenvalues, expectation and variance of damping ratio and oscillation frequency, etc.
The linearized model and the random variables of power systems are the bases of PSSSA. The state matrix A of large-scale complex power systems is obtained by DIgSILENT/PowerFactory, and the input matrix B and output matrix C is obtained by a numerical calculation method introduced in [21].
Several stochastic variables can affect the operation states of power systems, which leads to different distributions of eigenvalues. Random scenarios are composed of different combinations of stochastic variables. In this paper, the following random variables are considered: (1) the output power of synchronous generators; (2) the load demand. Both stochastic variables obey the normal distribution. Then the oscillation characteristics of power systems are analyzed by the statistical method and the location which has the best controllable performance will be distinguished.

3.2. Modal Analysis

The dynamic behavior of one power system is often represented by a series of non-linear ordinary differential equations [22]:
x ˙ i = f i ( x 1 , x 2 , , x n ; u 1 , u 2 , u r ; t ) , i = 1 , 2 , , n
where x is the state variables; xi is a element of the state vector; ui is the system input variables, which are external signals that can influence the behavior of the system; x ˙ is the derivative of the state variable with respect to time; n is the system order, r is the number of inputs to the system; and t is time. Equation (9) can be rewritten as follows:
x ˙ = f ( x , u , t )
where x = [x1, x2, …xn]T is the state vector; u = [u1, u2, …ur]T is the input vector; and f = [f1, f2, …fn]T are the vectors of nonlinear functions which defines the states. If the derivative of the state variable is not an explicit function of time, the system is autonomous [18]. At this point, Equation (10) can be simplified as:
x ˙ = f ( x , u )
Output variables are the ones which can be directly measured in power systems. They can be described by functions of state and input variables:
y = g ( x , u )
where m is the number of the output variables; y = [y1, y2, …ym]T is the vector of output variables; and g = [g1, g2, …gm]T is the vector of non-linear functions which define the outputs.
In small signal analysis, a linear technique can give useful information for the intrinsic dynamic characteristics of power systems. The linearized model of Equations (11) and (12) is [23]:
Δ x ˙ = A Δ x + B Δ u
Δ y = C Δ x + D Δ u
where A is an n*n state matrix; B is an n*r input matrix; C is an m*n output matrix; D is a feedforward matrix. The oscillation modes can be identified by the eigenvalues of state matrix A [24]. Lyapunov’s first law indicates that if all eigenvalues have negative real parts, the system is asymptotically stable at equilibrium point.
The real eigenvalue λi = αi corresponds to a non-oscillating mode. Negative real eigenvalues (αi < 0) indicate a decay mode. The larger the amplitude, the faster the decay. Positive eigenvalues (αi > 0) indicate non-periodic instable modes. The complex eigenvalues appear as conjugation pairs λi = αi + jβi, and each pair corresponding to one OM. The real part is related to the damping ratio ς i , which is defined as [25]:
ς i = α i α i 2 + ω i 2
The negative real part means damped oscillation, and the positive real part means instable OM [24]. The decay rate of the oscillation amplitude is determined by the damping ratio ς i . The time constant of amplitude decay is 1/|αi|. Because ς i embodies the changes of the real and imaginary parts of the eigenvalues, it is considered a more appropriate measurement of the degree of the oscillation damping than α i which only considers the changes of the real parts. The mode corresponding to each critical eigenvalue which satisfies the requirements can represent different types of oscillation. The imaginary part βi is related to the oscillation frequency of the OMs.

3.3. The Index of Best Buses Selection

After performing modal analysis for all the random scenarios, the oscillation characteristics of OMs can be obtained for further analysis. The probabilistic critical OMs (PCOM) should be identified first. PCOM is defined as the OMs whose probability of being poorly damped exceeds 50%:
S p c o m = { i | P ( 0 ζ i 0.05 ) > 50 %   ,   i = 1 N o m }
where Spcom represents the set of PCOMs, Nom is the number of OMs, P(·) means probability, which can be calculated by:
P ( 0 ζ i 0.05 ) = 1 N m = 1 N R i m R i m = { 1 , ζ i m > 0.05 0 , ζ i m < 0.05
where Rim represents the damping state of ith OM in mth scenario.
Then the probabilistic controllability indices of all the potential buses can be calculated. The controllability index reflects the influence of input variables on OMs. Since the main aim of the AC/DC interconnection system systems is power transmission, the element of input vector u is the injection power at different buses. The controllability index is defined as:
C I o b s = | v o s B b s |
where CIob is the magnitude of the products of vo and Bb, vo represents the oth left eigenvector, and Bb is the bth column of input matrix B. Superscript s represents the s-th operation scenario. CIob evaluates the controllability of the power injected at bus b for oth mode. CIo evaluates the controllability of the power injected at all buses for oth mode. CI is updated as [26]:
C I o b s = C I o b s / max C I o s
where max CIos is the maximum CIob out of all locations on the s-th operation scenario.
Then average value μob and variance σ o b 2 can be calculated by:
μ o b = 1 M m = 1 M C o b m σ o b 2 = 1 M m = 1 M ( C o b m μ o b ) 2
The best locations can be selected as the ones which has the highest μob and σ o b 2 < σ max 2 .

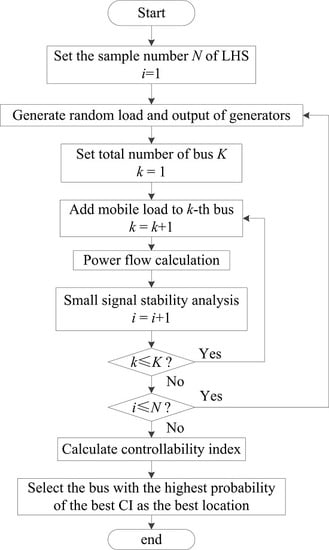
3.4. The Process of Probabilistic Small Signal Stability Analysis (PSSSA) and Location Selection

The flow chart of proposed method is shown in Figure 2. The detailed processes are as follows:
(1)
Set the total sample number N;
(2)
Generate random load and generator’s output by the LHS method;
(3)
The DC system is equivalent to a −100 MW load. The −100 MW load is regarded as a mobile load. Put the mobile load and a breaker to one bus in once simulation;
(4)
Calculate the power flow and perform modal analysis. Get the matrices A, B and C from DIgSILENT/PowerFactory;
(5)
Repeat steps 3 and 4 on each bus under the same load level;
(6)
Repeat steps 2–4 until N is satisfied;
(7)
Select the critical oscillation modes by analysing the damping ratio and system’s frequency under different modes. Calculate the controllability index of all buses on critical OMs;
(8)
Calculate the controllability index matrix and select the bus with the maximum probability of maximal controllability index value as the best DC terminal.

4. Case Study

The proposed method is applied in the IEEE 39-bus system. The result of modal analysis is obtained by the Modal Analysis Package of DIGSILENT/PowerFactory. The random load of the system is assumed to follow the normal distribution. The expected value and the variance of loads are Pl0,i and 0.1Pl0,i. The output of generator changes according to the load level; 1000 random operating scenarios are generated by the LHS method.
For the test system, there are 9 poorly damped low frequency oscillation (LFO) modes. The probability of these modes is shown in Table 1. A box plot of their damping ratio is shown in Figure 3.
According to Table 1, only OM 6 is considered to be the probabilistic critical OM. Other OMs whose damping ratio is most likely lower than 0.1 can be included in Spcom. Thus, Spcom = {OM 3, OM 4, OM 5, OM 6, OM 7, OM 8}. The mean values of the mode controllability for Spcom are shown in Table 2.
It can be observed from Table 2 that the top three buses are bus39, bus1 and bus9 which are sorted by the mean value of controllability index and the probability of 6 modes. The variance of these three buses is not the maximum among all buses. Thus, the multi-infeed HVDC system is considered to be connected to the bus39, bus1 and bus9. The box plots of controllability index results from modal analysis on critical modes are shown in Figure 4. A total of 39 buses were observed.
From Figure 4, the box plot area of bus39, bus1 and bus9 is smaller than other buses, which indicates that the controllability index distribution of the three buses is relatively concentrated. The value of these three buses’ controllability index are closer to 1 than other buses. It can be seen the result of box plots and mean value table are same. Thus, Bus39, bus1 and bus9 are the selected location.
To demonstrate the damping performance of the HVDC system, a three-phase fault is caused on the transmission line 14–15 of the 39-bus system at t = 1 s and lasts for 0.1 s. The simulation results are shown in Figure 5. Case 1: one HVDC system connects to bus39; Case 2: two HVDC systems connect to bus39 and bus1; Case 3: three HVDC systems connect to bus39, bus1 and bus39.
It can be observed from Figure 5 that the HVDC system has the effective damping performance. When there is no HVDC to be connected, the oscillations last for long time. When bus39 connects with one HVDC system, the oscillations time decreases significantly. When the candidate three buses all connect with HVDC systems, it takes less time to return to the equilibrium point. The dynamic response of the rotor angular velocity can be shown by Figure 6.
Figure 6 shows that the system connected with HVDC system can have better damping effect than there is no HVDC to be connected. When the three buses all connect with HVDC systems, the system has the best damping effect.

5. Discussion

By contrast with the previous location selection method of HVDC systems, the proposed method mainly focusses on the impact of the locations on system stability. In [5,6], the best locations of HVDC links in 39-bus systems are identified as {bus3, bus22, bus35} and {bus8, bus20, bus27}, respectively. To compare the system dynamic responses with different HVDC locations, three cases are set: (1) Case A: the locations selected by this paper {bus1, bus9, bus39}; (2) Case B: the locations found by [5], i.e., {bus3, bus22, bus35}; (3) Case C: the locations found by [6], i.e., {bus8, bus20, bus27}. A three-phase fault is applied on the transmission line L14–15 at t = 1 s and lasts for 0.1 s. The system dynamics responses are shown in Figure 7. Since the power flow with different HVDC locations is different, only the power deviation of the transmission lines after the disturbance are shown. It can be observed that the locations identified by this paper, i.e., Case A, has the best damping performance. The locations in [5,6] has little influence on the power oscillations as the aim of these locations are cost reduction and power flow controllability.
The grid losses are summarized in Table 3. One can observe that the grid losses with the HVDC locations identified in [5,6] are lower than with the locations selected in this paper. Although the grid losses are increased, the stability of the hybrid AC/DC power system is improved.

6. Conclusions

In this paper, a probabilistic small signal stability assessment methodology based on the Latin hypercube sampling-based Monte Carlo simulation approach has been proposed. The heavy computation burden of the traditional MC method is significantly decreased by the LHS technique. The influence of potential locations of HVDC systems on the system stability is studied in a probabilistic way. The probabilistic critical oscillatory modes are identified and the candidates of the potential locations of multi-infeed HVDC systems can be distinguished by the probabilistic controllability index to improve the system damping performance. This method can be used for the initial selection of the scheme of arbitrary locations of the HVDC station in the planning stage. The effectiveness of the selected candidate locations is validated by the non-linear time-domain simulations in DIgSILENT/PowerFactory. Compared with other methods, the locations identified by the proposed method can effectively improve the stability of the hybrid AC/DC power system. The results show that the system damping to the probabilistic critical modes are enhanced and the power oscillations on the transmission lines are suppressed effectively. However, the grid losses are slightly magnified. Thus, in our future work, both the economic factors and the stability factors will be considered in the HVDC placement tasks.

Author Contributions

Conceptualization, X.L. and Y.L. (Yunfeng Li); methodology, Y.L. (Yong Li) and Y.C.; software, W.W. and L.L.; validation, L.L. and W.W.; formal analysis, X.L. and Y.L. (Yunfeng Li); investigation, Y.L. (Yong Li); resources, W.W.; data curation, L.L.; writing—original draft preparation, L.L.; writing—review and editing, L.L. and W.W.; visualization, L.L. and W.W.; supervision, Y.L. (Yong Li); project administration, Y.L. (Yunfeng Li); funding acquisition, Y.L. (Yunfeng Li). All authors have read and agreed to the published version of the manuscript.

Funding

This research was funded by Science and Technology Project of State Grid Hunan Electric Power Limited Company, grant number 5216A218000B.

Conflicts of Interest

The authors declare no conflict of interest.

Nomenclature

HVDCHigh Voltage Direct Current
PSSSAProbabilistic Small Signal Stability Assessment
LHS-MCSLatin Hypercube Sampling-based Monte Carlo Simulation
OMOscillation Mode
SSSASmall Signal Stability Analysis
MCMonte Carlo
LHSLatin Hypercube Sampling
SRSSimple Random Sampling
PDFProbability Density Function
CPDFCumulative Probability Density Function
PCOMProbabilistic Critical Oscillation Mode
DCDirect Current
ACAlternating Current

References

  1. Aik, D.L.H.; Andersson, G. Power stability analysis of multi-infeed HVDC systems. IEEE Trans. Power Deliv. 1998, 13, 923–931. [Google Scholar] [CrossRef]
  2. Guo, X.J.; Ma, S.Y.; Bu, G.Q.; Tang, Y. Survey on coordinated control of multi-infeed DC systems. Autom. Electr. Power Syst. 2009, 33, 9–15. [Google Scholar]
  3. Chatzivasileiadis, S.; Krause, T.; Andersson, G. HVDC line placement for maximizing social welfare—An analytical approach. In Proceedings of the 2013 IEEE Grenoble Conference, Grenoble, France, 16–20 June 2013; pp. 1–6. [Google Scholar]
  4. Bucher, M.A.; Wiget, R.; Perez, G.H.; Andersson, G. Optimal placement of multi-terminal HVDC interconnections for increased operational flexibility. In Proceedings of the 2014 5th IEEE PES Innovative Smart Grid Technologies, Istanbul, Turkey, 12–15 October 2014; pp. 1–6. [Google Scholar]
  5. Franken, M.; Barrios, H.; Schirief, A.B.; Puffer, R. Identification of suitable locations for HVDC links within meshed AC networks. In Proceedings of the 2019 IEEE PES Innovative Smart Grid Technologies Europe(ISGT-Europe), Bucharest, Romania, 29 September–2 October 2019; pp. 1–5. [Google Scholar]
  6. Giuntoli, M.; Schmitt, S.; Biagini, V.; Subasic, M.; Gutermuth, G.; Krontiris, A. Placement of HVDC links for reduction of network congestions. In Proceedings of the 2019 AEIT HVDC International Conference, Florence, Italy, 9–10 May 2019; pp. 1–6. [Google Scholar]
  7. Guo, X.J.; Guo, J.B.; Ma, S.Y.; Wang, C.S.; Zhang, Y.T. A method for multi DC terminal location selection based on multi-infeed short circuit ratio. Proc. CSEE 2013, 33, 36–42. [Google Scholar]
  8. Zhou, Q.Y.; Liu, Y.T.; Tang, Y. A method to select terminal locations in multi-infeed HVDC power transmission system considering weights of HVDC transmission lines. Power Syst. Technol. 2013, 37, 3336–3341. [Google Scholar]
  9. Xue, Y.S.; Liu, Q.; Dong, Z.Y.; Ledwich, G.; Yuan, Y. A review of non-deterministic analysis for power system transient stability. Autom. Electr. Power Syst. 2007, 31, 1–6. [Google Scholar]
  10. Liu, S.; Liu, P.X.; Wang, X. Stochastic small-signal stability analysis of grid-connected photovoltaic systems. IEEE Trans. Ind. Electron. 2016, 63, 1027–1038. [Google Scholar] [CrossRef]
  11. Burchett, R.C.; Heydt, G. Probabilistic methods for power system dynamic stability studies. IEEE Trans. Power Appar. Syst. 1978, 97, 695–702. [Google Scholar] [CrossRef]
  12. Huang, H.Z.; Chung, C.Y.; Chan, K.W.; Chen, H.Y. Quasi-Monte Carlo based probabilistic small signal stability analysis for power systems with plug-in electric vehicle and windpower integration. IEEE Trans. Power Syst. 2013, 28, 3335–3343. [Google Scholar] [CrossRef]
  13. Rueda, J.L.; Colome, D.G.; Erlich, I. Assessment and enhancement of small signal stability considering uncertainties. IEEE Trans. Power Syst. 2009, 24, 198–207. [Google Scholar] [CrossRef]
  14. Bu, S.Q.; Du, W.; Wang, H.F.; Chen, Z.; Xiao, L.Y.; Li, H.F. Probabilistic analysis of small-signal stability of large-scale power systems as affected by penetration of wind generation. IEEE Trans. Power Syst. 2012, 27, 762–770. [Google Scholar] [CrossRef]
  15. Xu, Z.; Dong, Z.Y.; Zhang, P. Probabilistic small signal analysis using Monte Carlo simulation. In Proceedings of the IEEE Power Engineering Society General Meeting, San Francisco, CA, USA, 16 June 2005. [Google Scholar]
  16. McKay, M.D.; Conover, W.J.; Beckman, R.J. A comparison of three methods for selecting values of input variables in the analysis of output from a computer code. Technometrics. 1979, 21, 55–61. [Google Scholar]
  17. Cai, D.F.; Shi, D.Y.; Chen, J.F. Probabilistic load flow computation using Copula and Latin hypercube sampling. IET Gener. Transm. Distrib. 2014, 8, 1539–1549. [Google Scholar] [CrossRef]
  18. Helton, J.C.; Davis, F.J. Latin hypercube sampling and the propagation of uncertainty in analyses of complex systems. Reliab. Eng. Syst. Saf. 2003, 81, 23–69. [Google Scholar] [CrossRef] [Green Version]
  19. Da Silva, A.M.L.; Ribeiro, S.M.P.; Arienti, V.L.; Allan, R.N.; Do Coutto Filho, M.B. Probabilistic load flow techniques applied to power system expansion planning. IEEE Trans. Power Syst. 1990, 5, 1047–1053. [Google Scholar] [CrossRef]
  20. Yu, H.; Chung, C.Y.; Wong, K.P.; Lee, H.W.; Zhang, J.H. Probabilistic load flow evaluation with hybrid latin hypercube sampling and cholesky decomposition. IEEE Trans. Power Syst. 2009, 24, 661–667. [Google Scholar] [CrossRef]
  21. Silva-Saravia, H.; Wang, Y.; Pulgar-Painemal, H. Determining wide-area signals and locations of regulating devices to damp inter-area oscillations through eigenvalue sensitivity analysis using DIgSILENT programming language. In Advanced Smart Grid Functionalities Based on PowerFactory; Green Energy and Technology; Springer: Cham, Switzerland, 2018; pp. 153–179. [Google Scholar]
  22. Kundur, P. Small signal stability. In Power System Stability and Control; McGraw-Hill: New York, NY, USA, 1994; pp. 465–471. [Google Scholar]
  23. Wang, W.Y.; Li, Y.; Cao, Y.J.; Ulf, H.; Christian, R. Adaptive droop control of VSC-MTDC system for frequency support and power sharing. IEEE Trans. Power Syst. 2018, 33, 1264–1274. [Google Scholar] [CrossRef]
  24. Dong, Z.Y.; Pang, C.K.; Zhang, P. Power system sensitivity analysis for probabilistic small signal stability assessment in a deregulated environment. Int. J. Control Autom. Syst. 2005, 3, 355–362. [Google Scholar]
  25. Wang, K.W.; Chung, C.Y.; Tse, C.T.; Tsang, K.M. Improved probabilistic method for power system dynamic stability studies. Proc. Inst. Elect. Eng. Gen. Transm. Distrib. 2000, 147, 37–43. [Google Scholar] [CrossRef]
  26. Silva-Saravia, H.; Pulgar-Painemal, H.; Mauricio, J. Flywheel energy storage model, control and location for improving stability: The Chilean case. IEEE Trans. Power Syst. 2017, 32, 3111–3119. [Google Scholar] [CrossRef]
Figure 1. Sampling process of Latin hypercube sampling (LHS).
Energies 13 01646 g001
Figure 2. Flow chart of proposed method.
Energies 13 01646 g002
Figure 3. Box plot of damping ratio of LFO modes.
Energies 13 01646 g003
Figure 4. Box plot of controllability index of LFO modes. (a) OM3; (b) OM4; (c) OM5; (d) OM6; (e) OM7; (f) OM8.
Energies 13 01646 g004
Figure 5. The power oscillations on transmission lines. (a) Line 01–39; (b) Line 02–25; (c) Line 13–14; (d) Line 16–19.
Energies 13 01646 g005
Figure 6. The deviation and the derivative of ω. (a) No high-voltage direct current (HVDC); (b) Case 1; (c) Case 2; (d) Case 3.
Energies 13 01646 g006
Figure 7. The transmission line power deviation with different HVDC locations.
Energies 13 01646 g007
Table 1. The damping ratio and the probability of LFO modes.
ModeOriginal System DataProbability
Frequency (Hz)Damping Ratioζ < 0.05ζ < 0.1
Mode 11.450.089099.80%
Mode 21.4230.078099.50%
Mode 31.4110.0830100%
Mode 41.1960.0620100%
Mode 51.190.0770.20%100%
Mode 61.1140.04199.80%100%
Mode 71.0530.0580100%
Mode 80.9790.0680100%
Mode 90.6390.078078.60%
Table 2. Mean value of controllability indices of buses to different oscillatory modes (OMs).
BusOM
345678
10.9630.9800.9810.9790.9840.984
20.904 0.9500.9510.9440.9590.957
30.911 0.9270.9300.9560.9390.952
90.980 0.9720.9600.9910.9720.980
100.945 0.9110.8630.9780.9200.939
110.9450.9140.8690.9770.9200.940
190.918 0.8560.9240.9750.9040.968
200.9240.8300.9190.9740.8940.970
210.8690.8710.9160.9710.9120.962
290.9280.9560.9650.9560.9120.879
300.9070.9590.9560.9060.9770.960
310.9700.9080.8160.9840.8680.894
370.825 0.9700.9710.9540.971 0.960
380.941 0.9690.9760.9580.9020.851
391.000 1.0001.0001.0001.0001.000
Table 3. Grid losses with different HVDC locations.
CaseLocationGrid Losses
Without HVDCNone43.71 MW
Abus1, bus9, bus3948.82 MW
Bbus3, bus22, bus3543.69 MW
Cbus8, bus20, bus2747.21 MW

