Relative Contributions of Clouds and Aerosols to Surface Erythemal UV and Global Horizontal Irradiance in Korea


Abstract
:1. Introduction
2. Data and Methods
2.1. Data
2.1.1. Irradiance Data
2.1.2. Attenuating Factors
2.2. Methods
2.2.1. Clearness Index
2.2.2. Radiative Amplification Factor (RAF) for Ozone
2.2.3. Multiple Linear Regression Analysis
3. Results
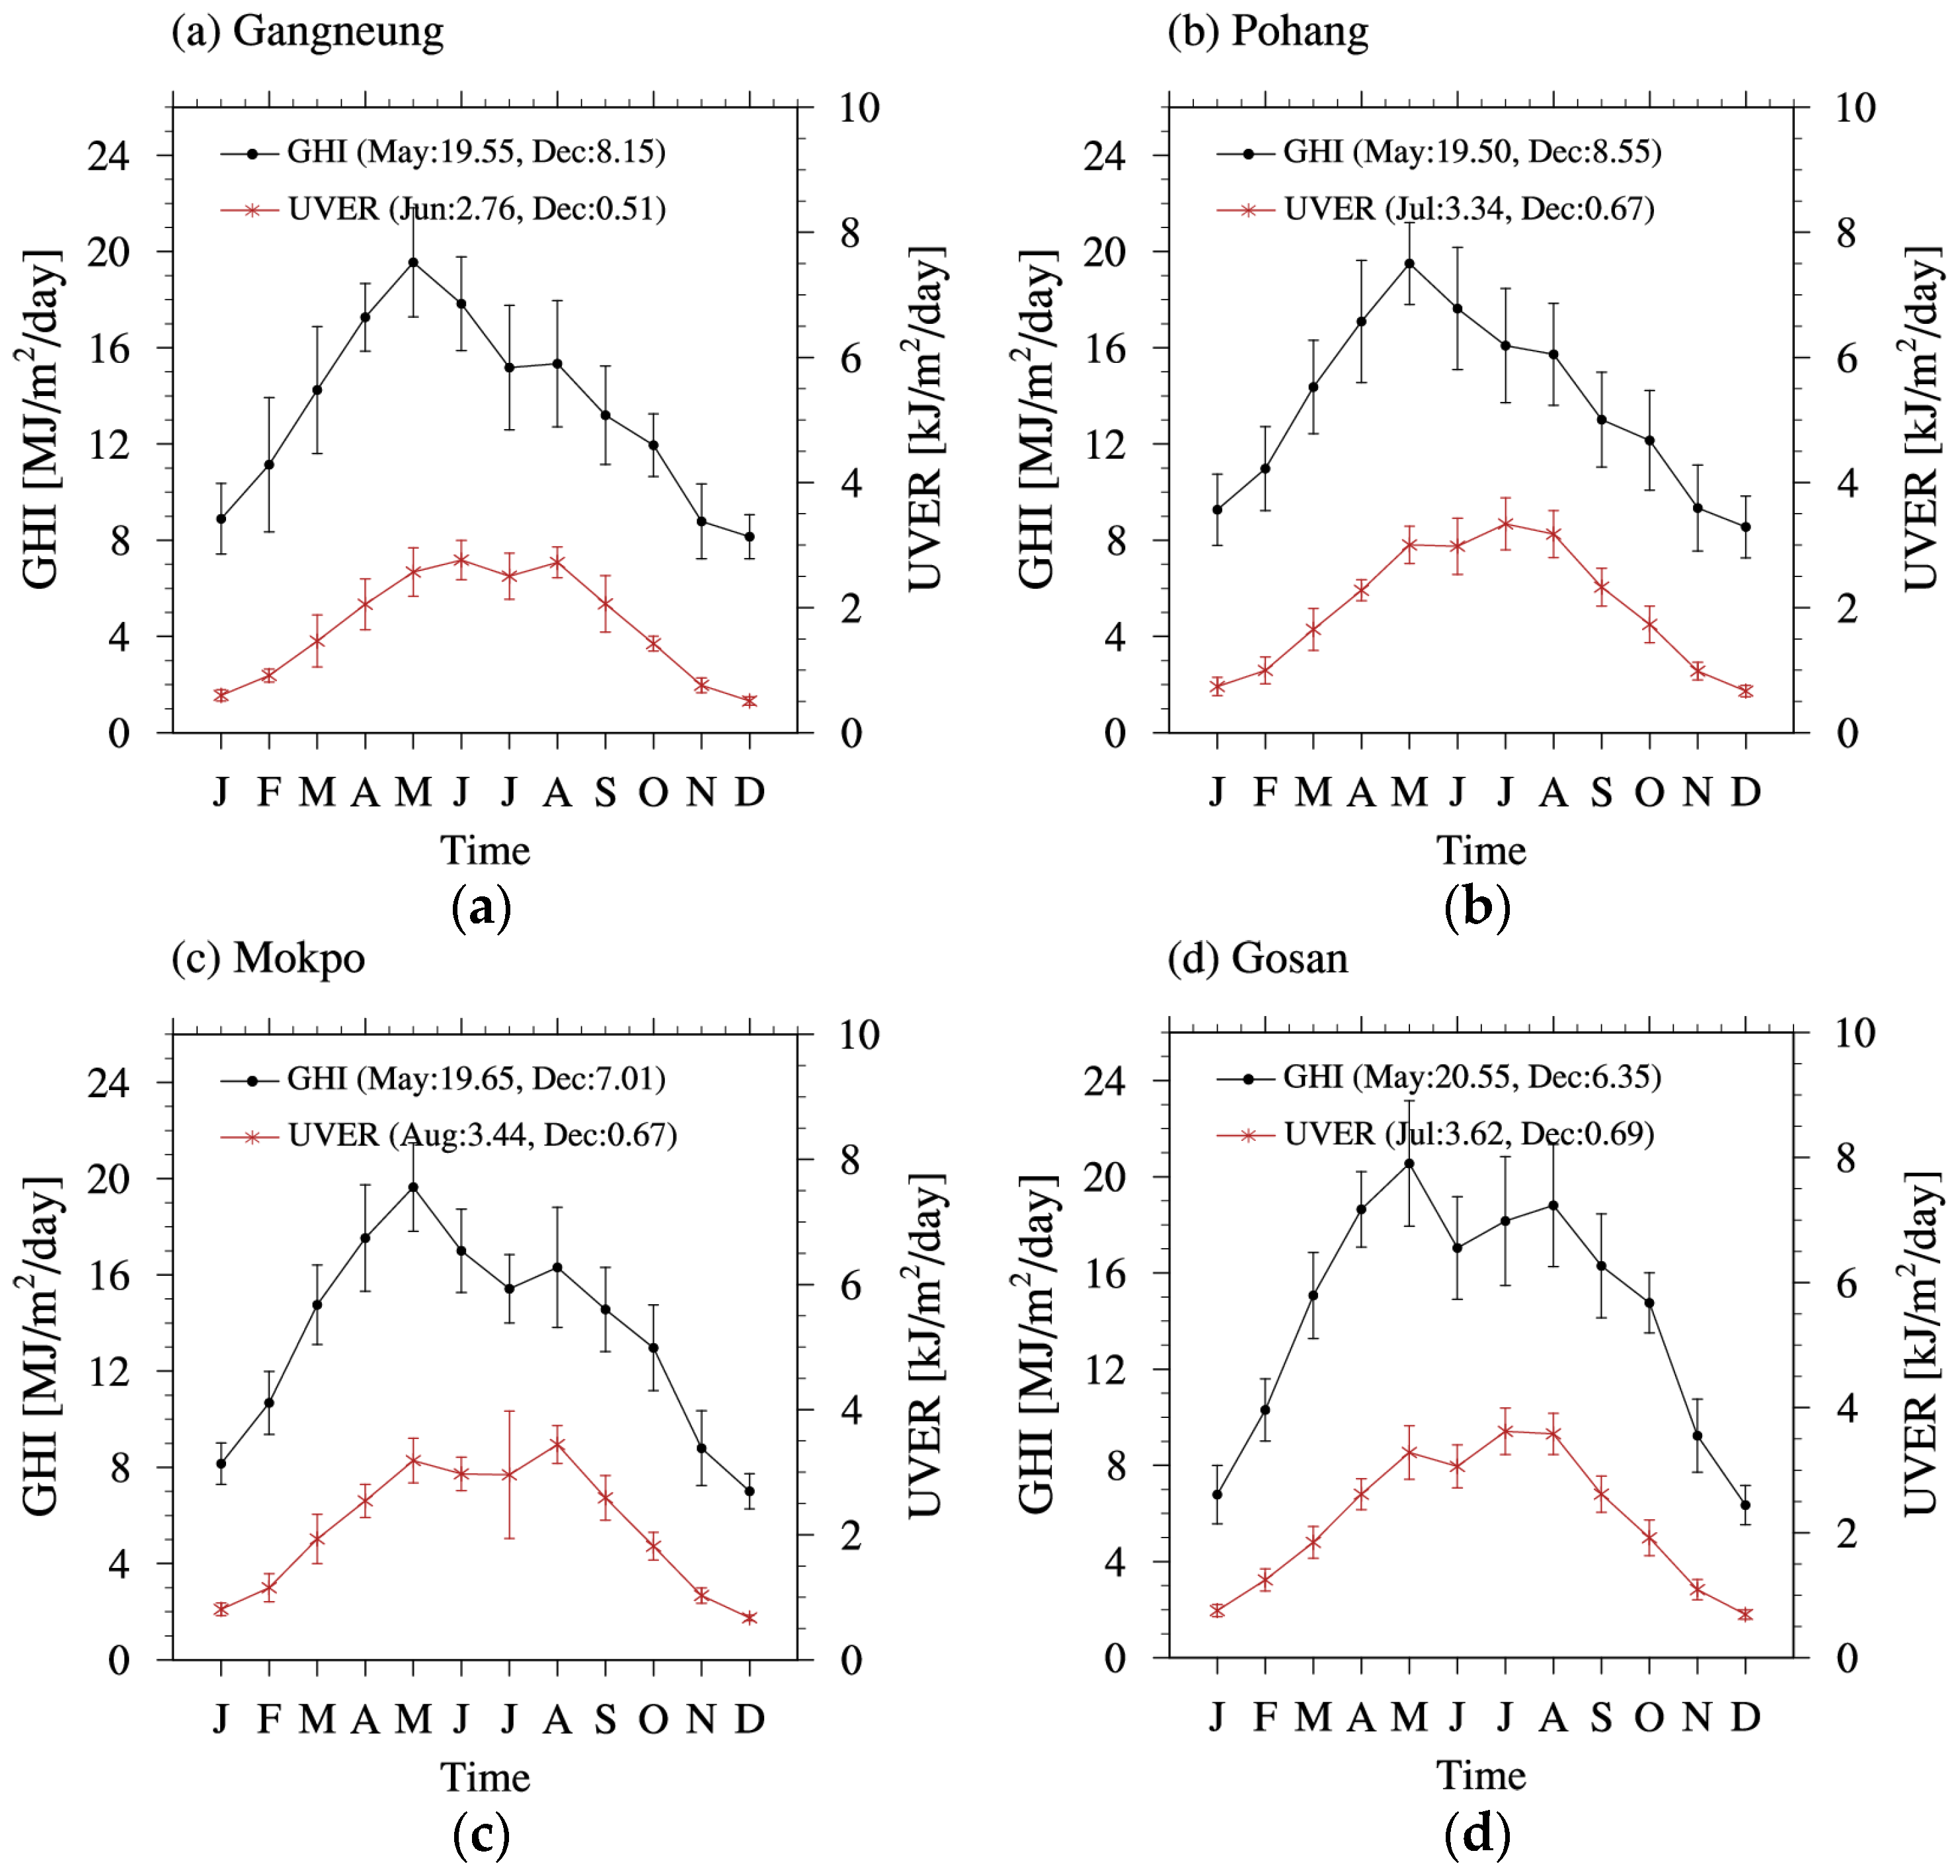
3.1. GHI and UVER Transmittance Differences
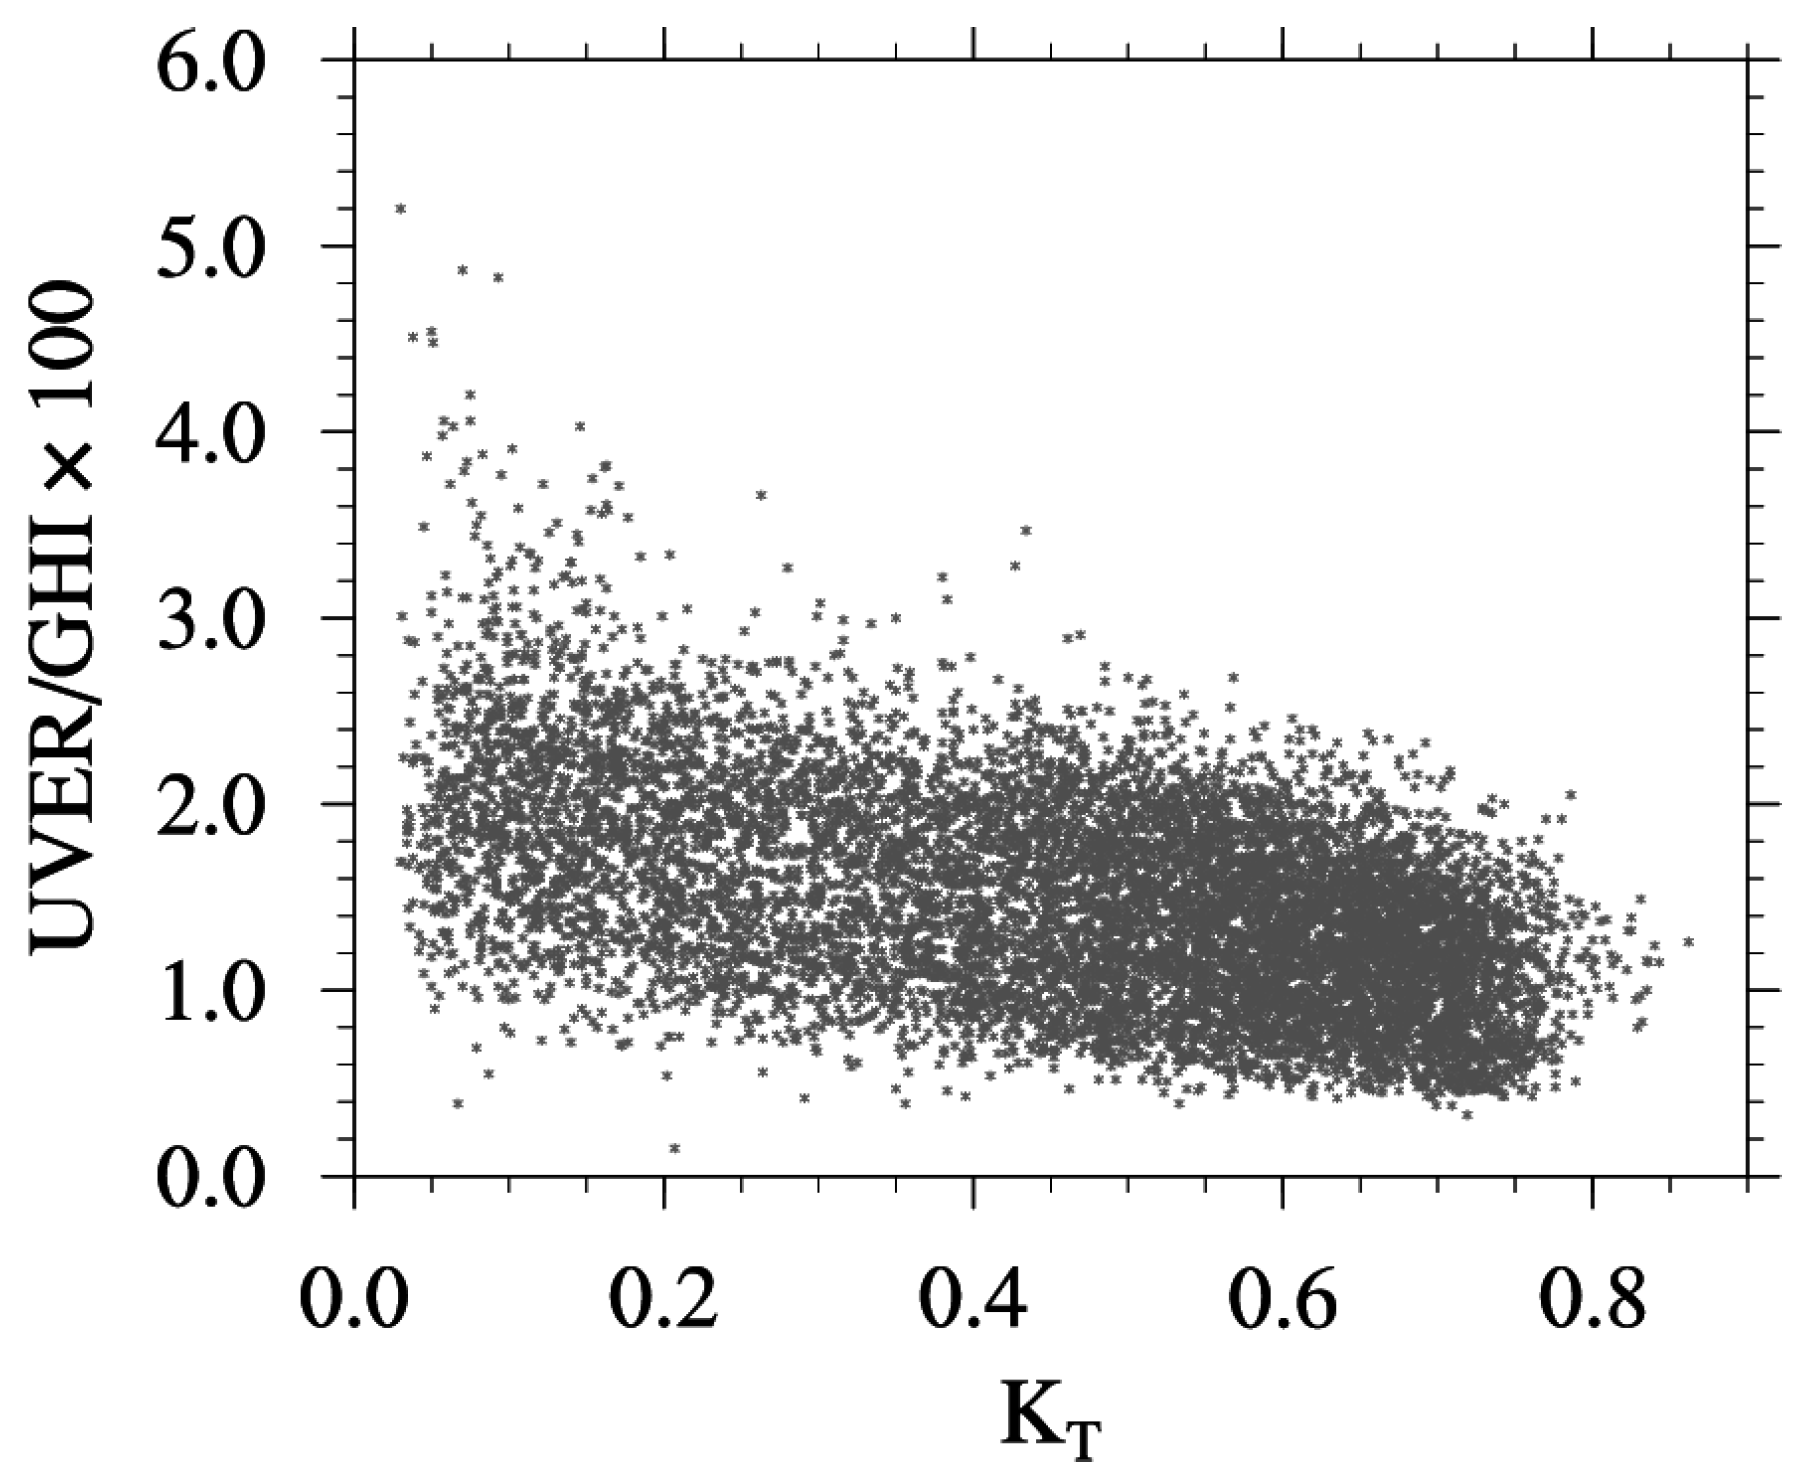
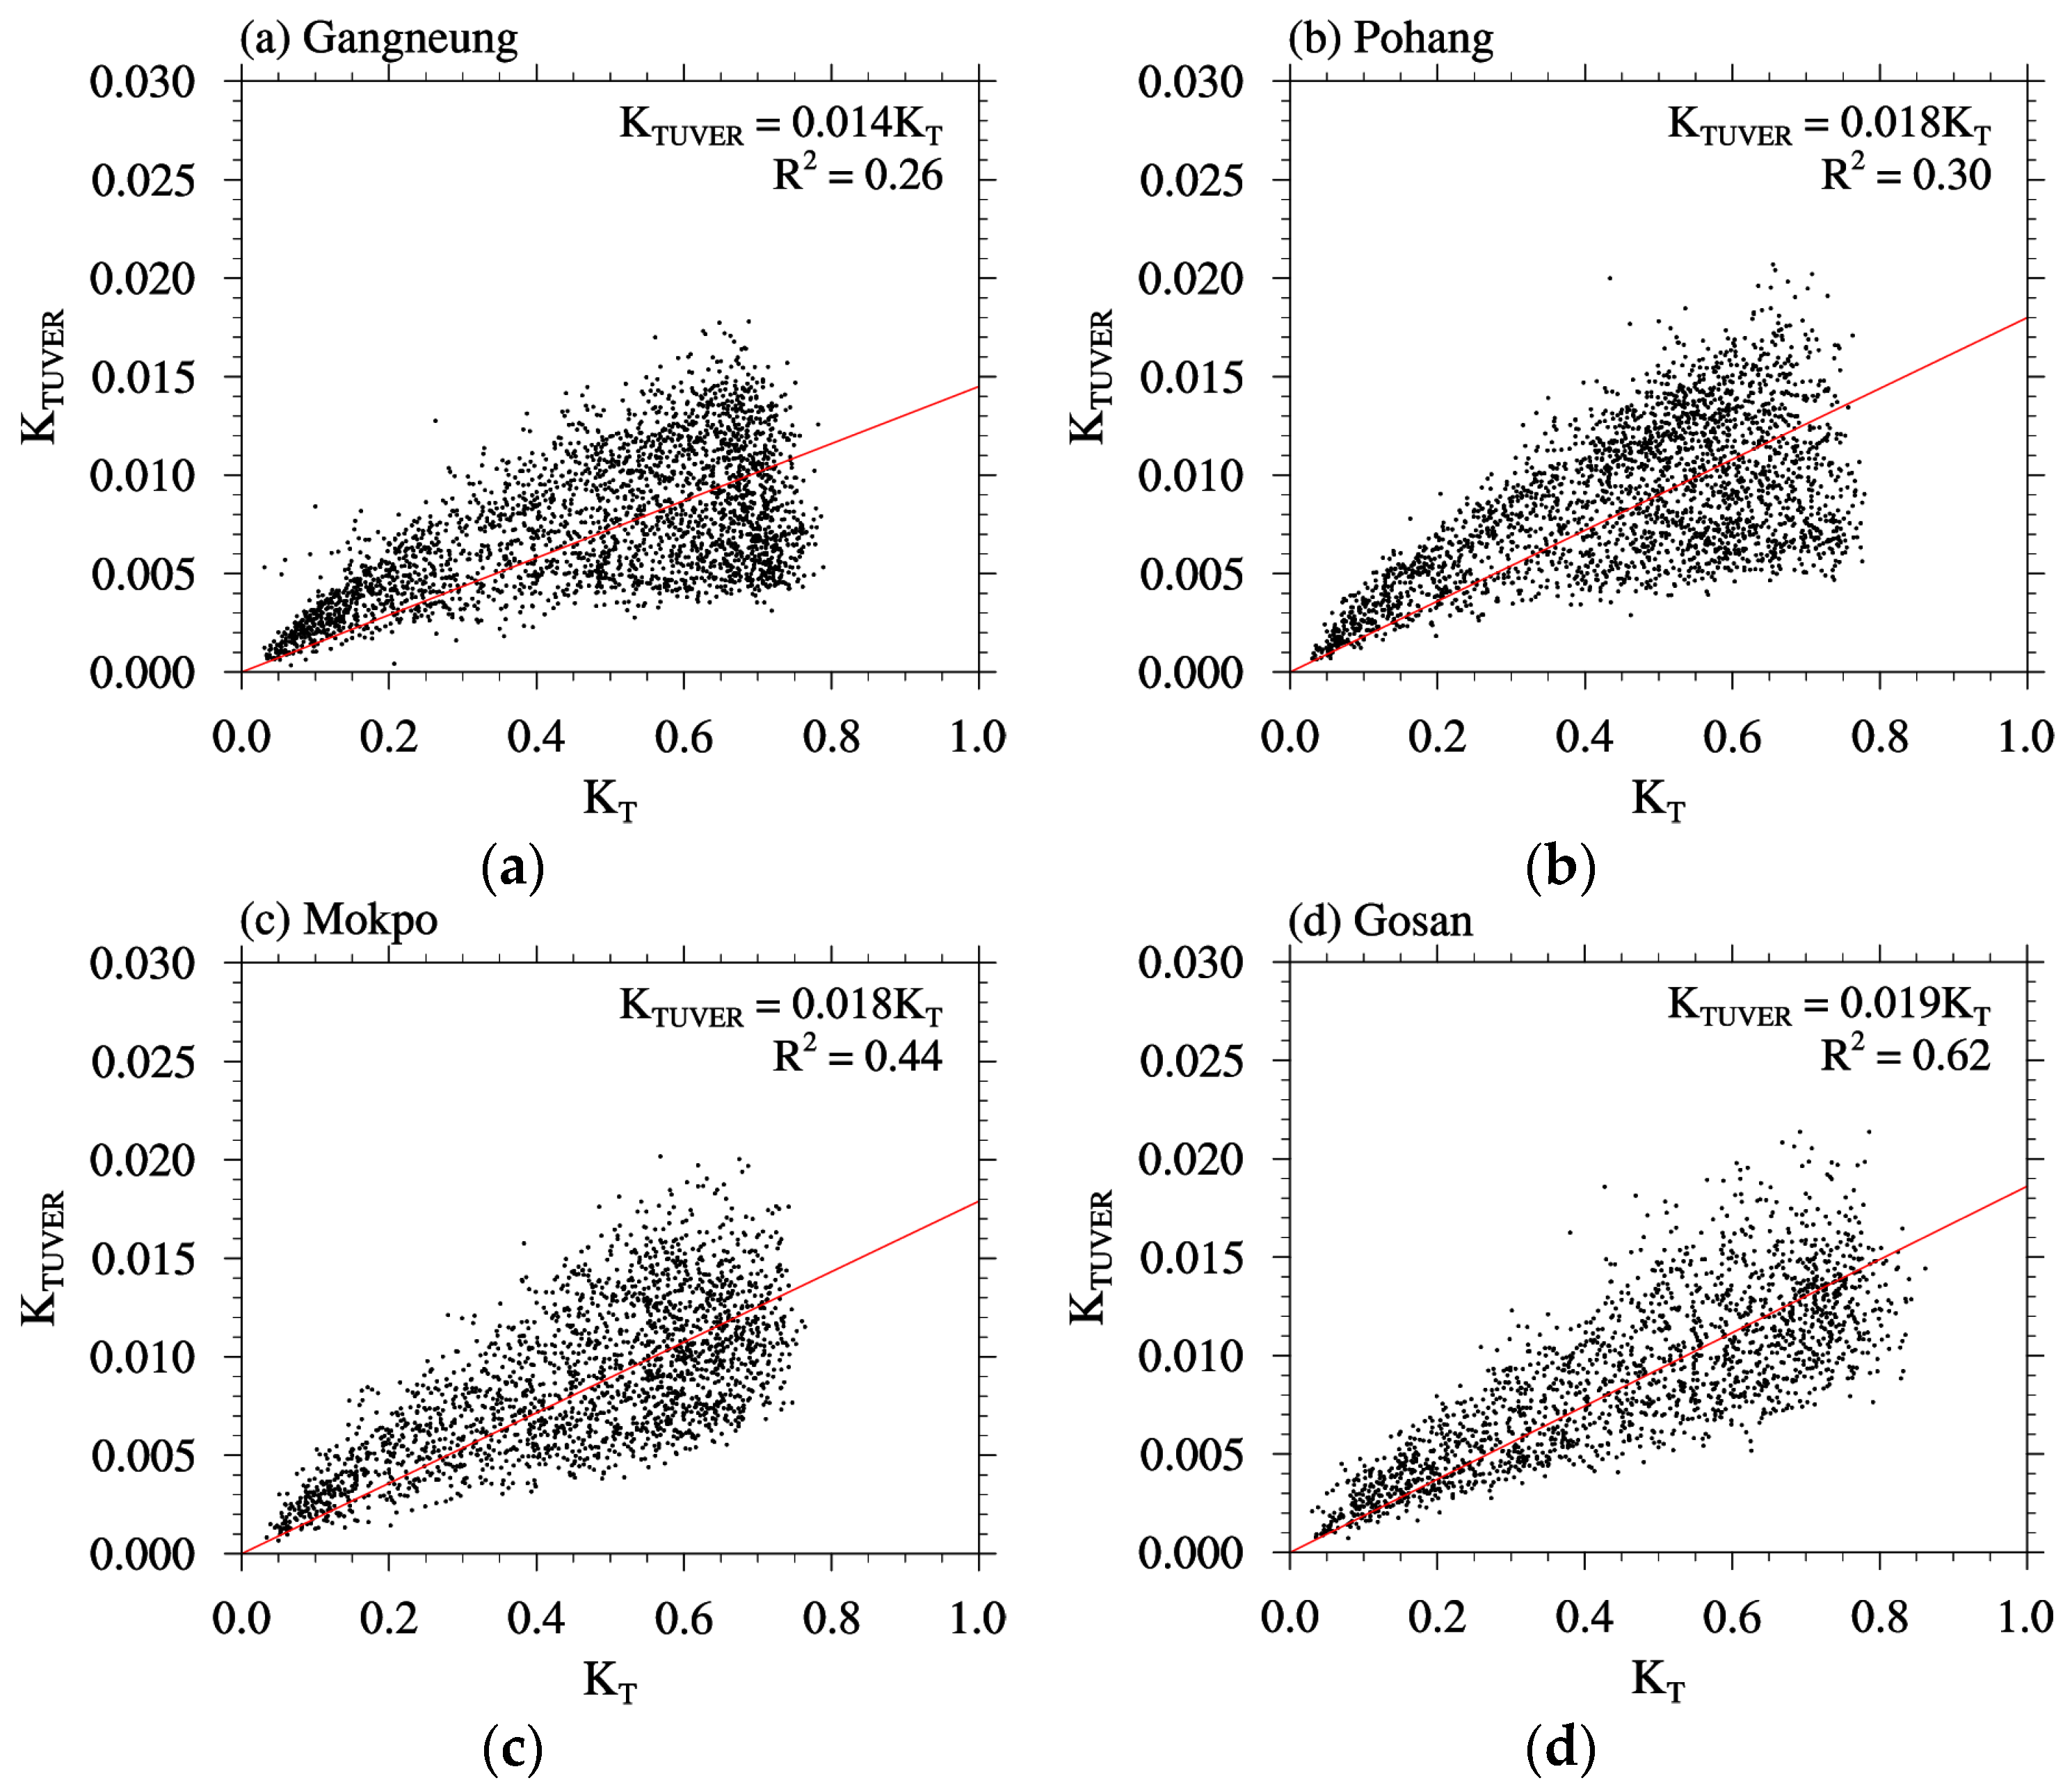
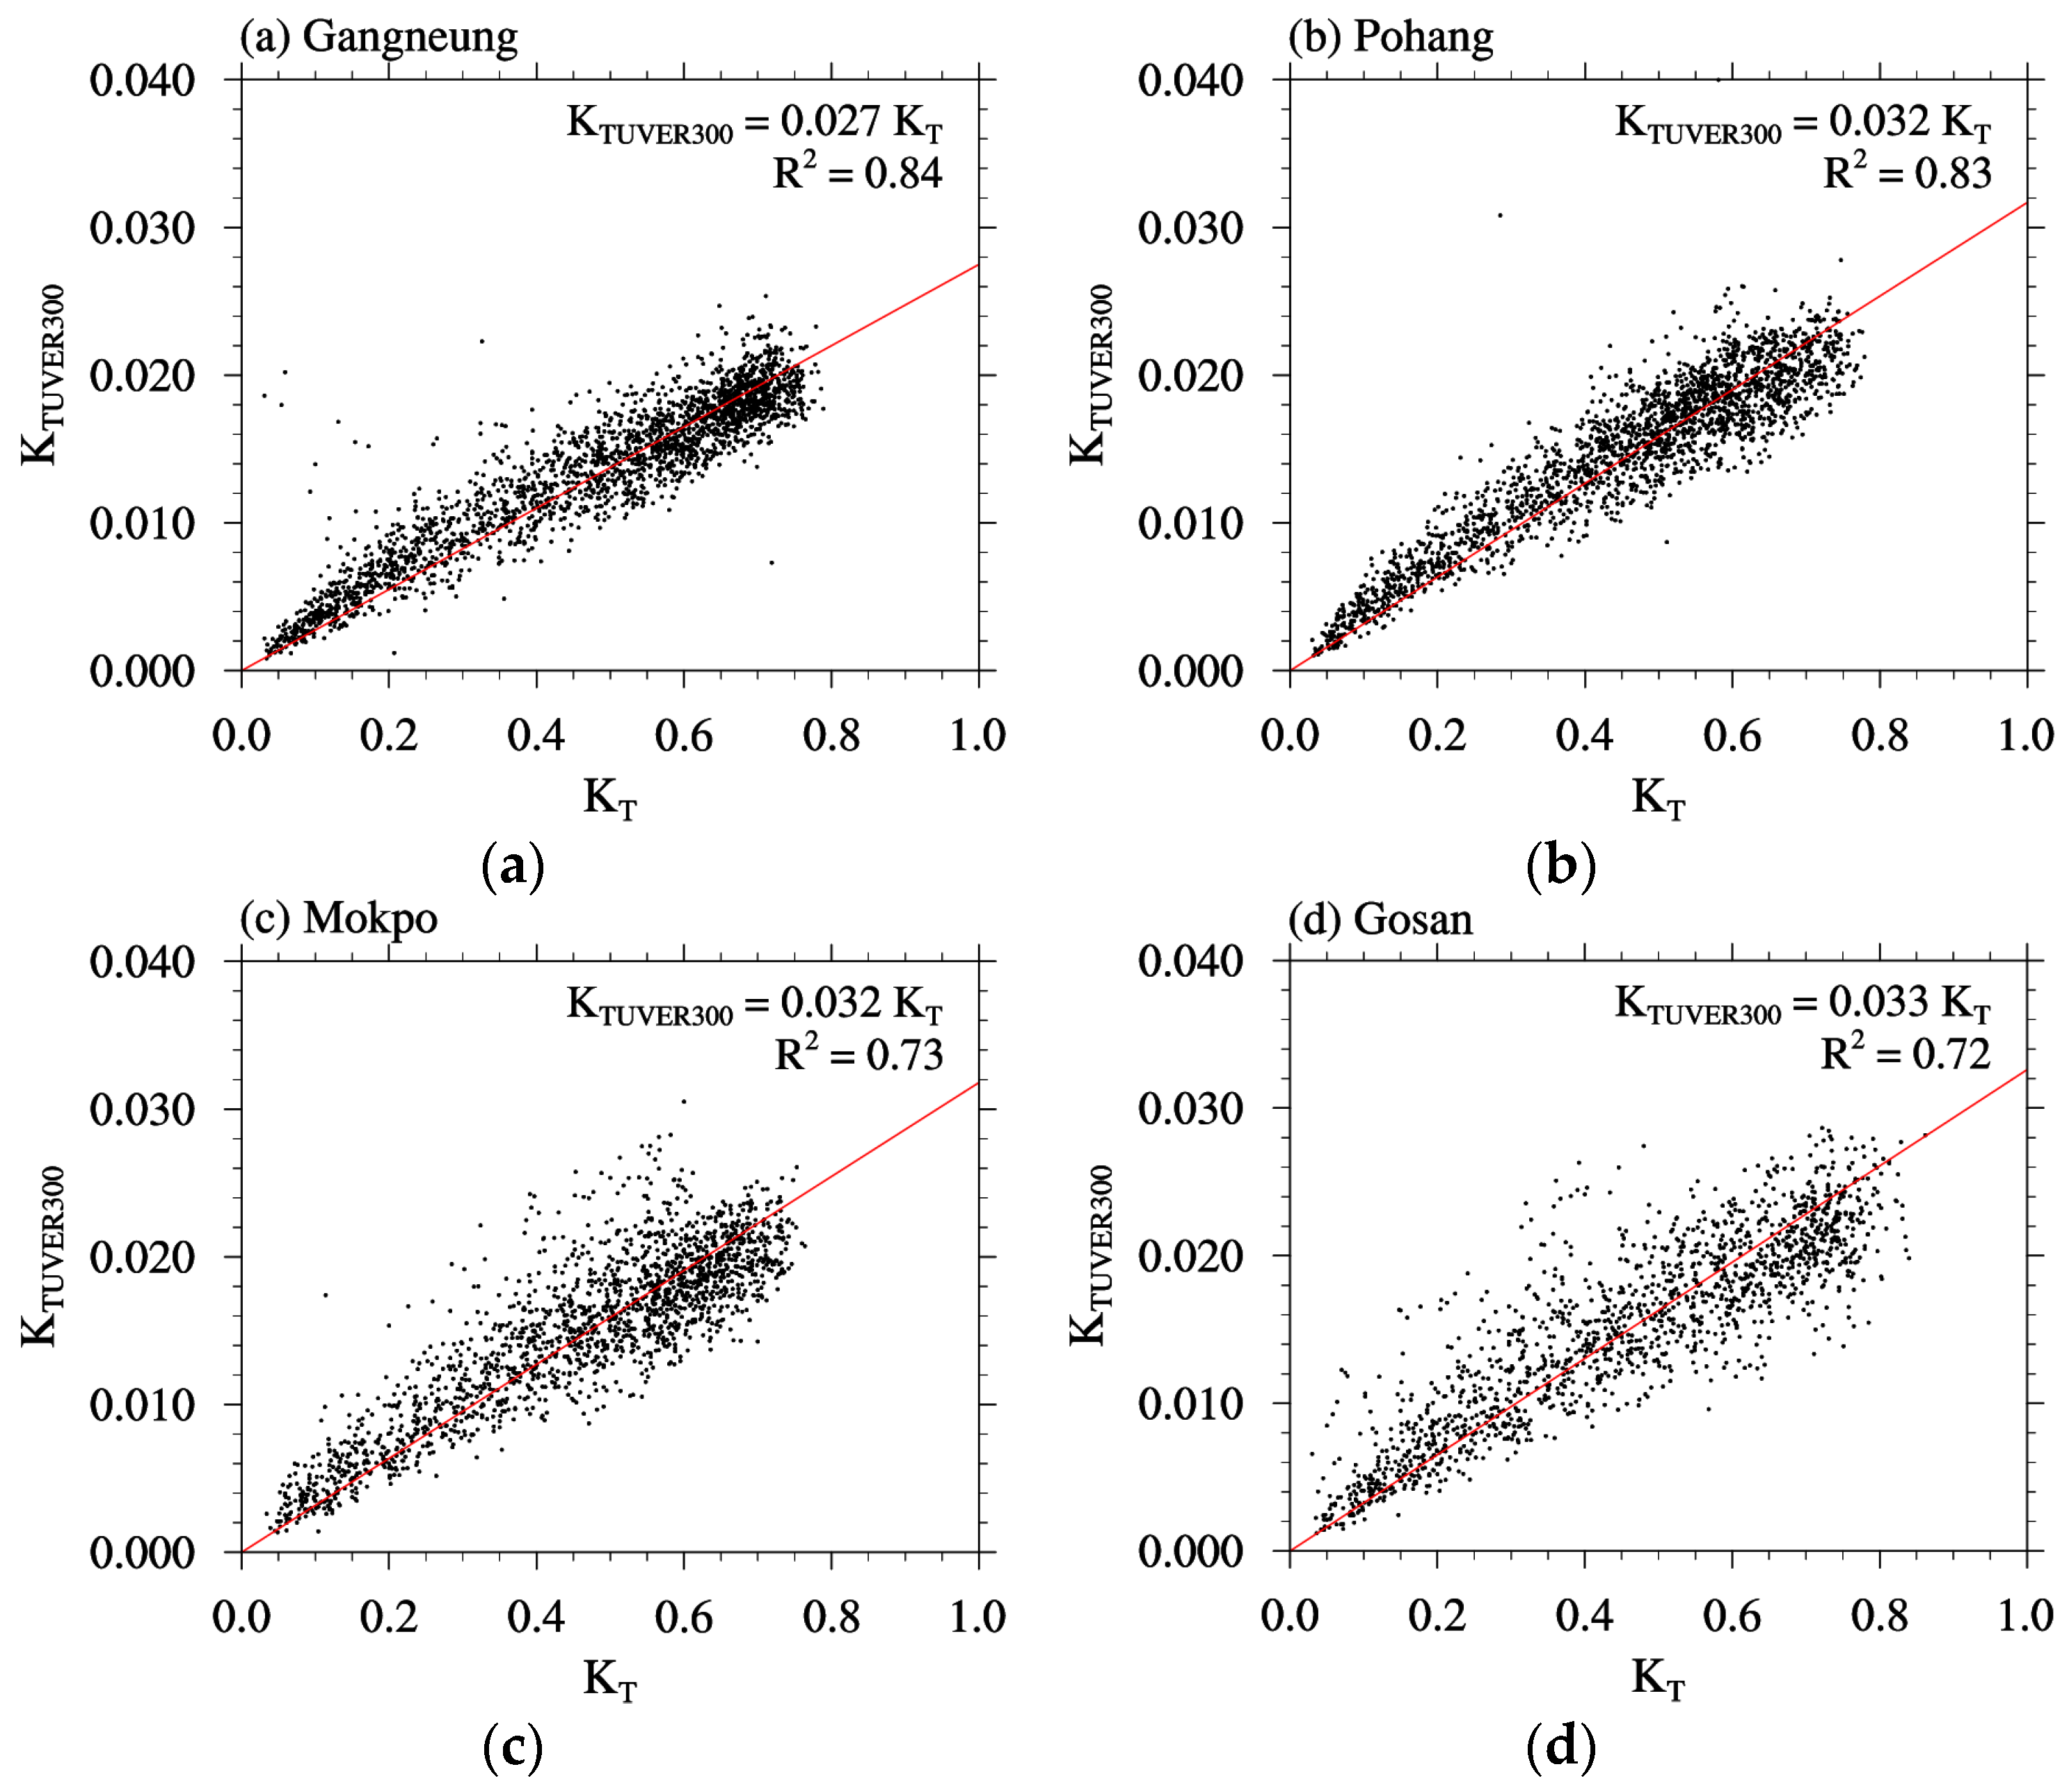
3.2. Comparison of Two Clearness Indices
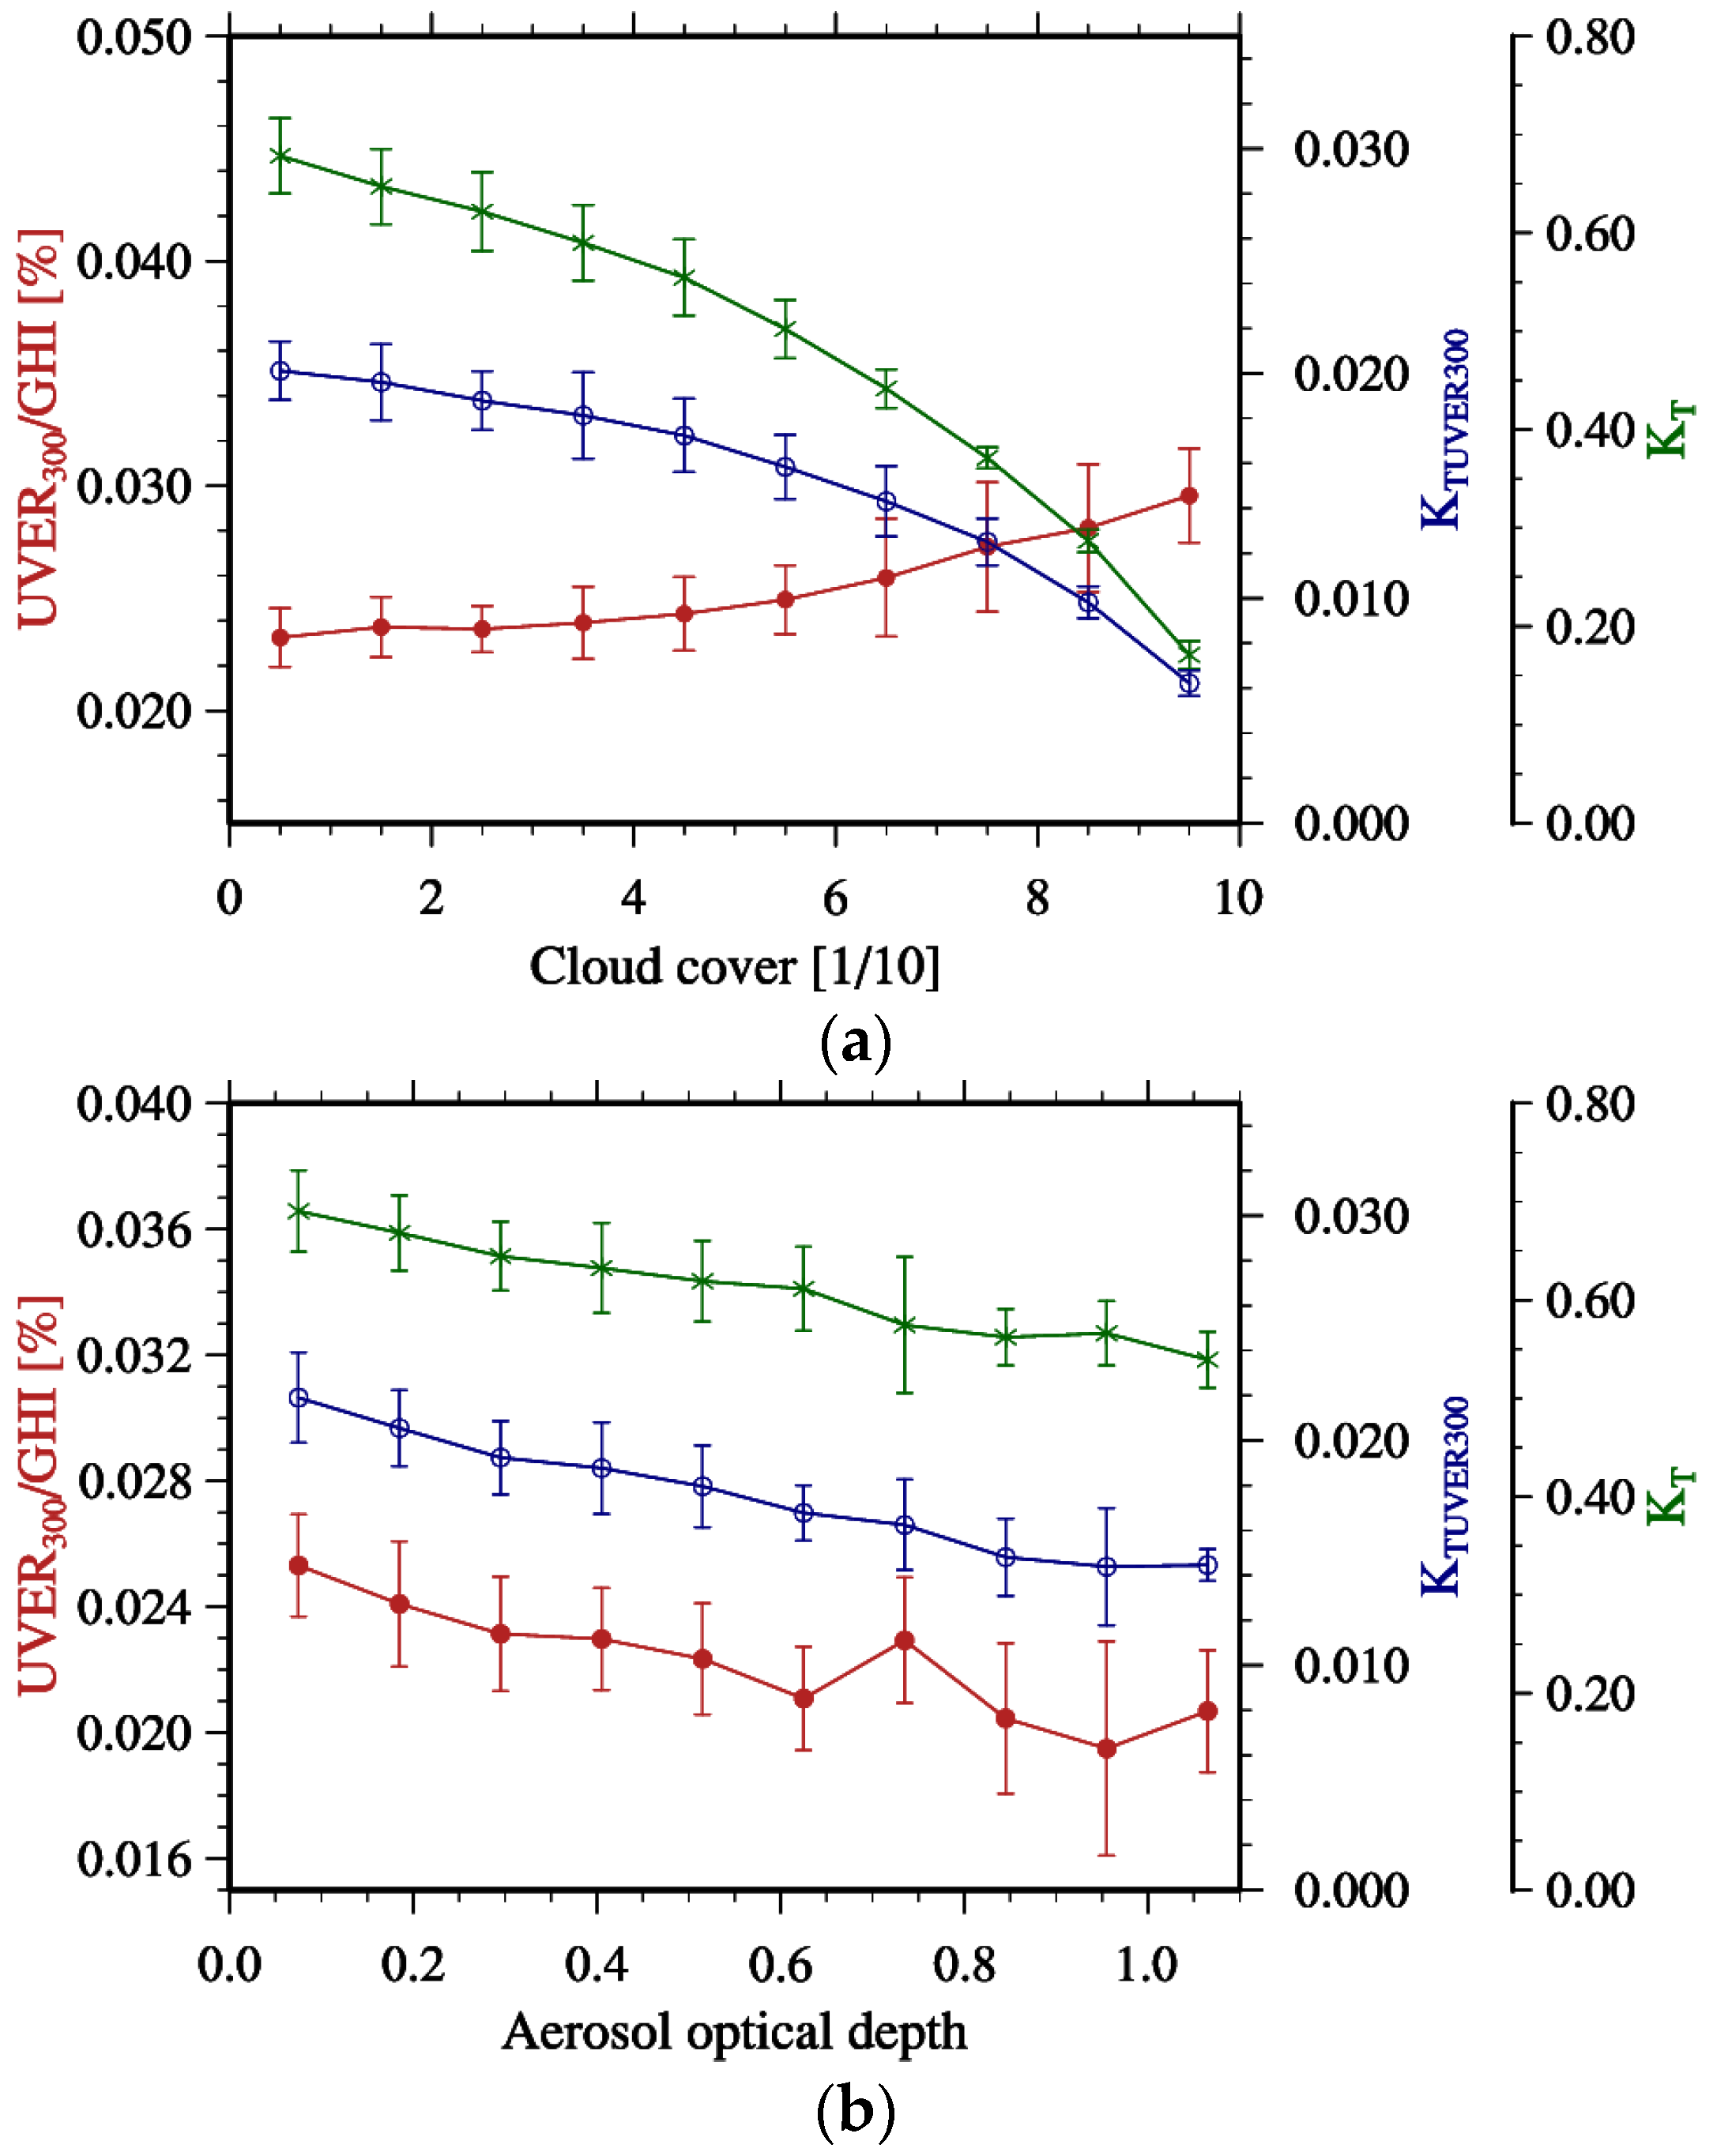
3.3. Differing Effects of Clouds and Aerosols on GHI and UVER
3.4. Analysis of Individual Contributions of Attenuating Factors Using MLR
4. Summary and Discussion
Author Contributions
Funding
Conflicts of Interest
References
- Iqbal, M. An Introduction to Solar Radiation; Academic Press: Toronto, ON, Canada, 1983. [Google Scholar]
- McKinlay, A.; Diffey, B.L. A reference action spectrum for ultraviolet erythema in human skin. CIE J. 1987, 6, 17–22. [Google Scholar]
- McKenzie, R.L.; Matthews, W.A.; Johnston, P.V. The relationship between erythemal UV and ozone, derived from spectral irradiance measurements. Geophys. Res. Lett. 1991, 18, 2269–2272. [Google Scholar] [CrossRef]
- Foyo-Moreno, I.; Alados, I.; Olmo, F.J.; Alados-Arboledas, L. The influence of cloudiness on UV global irradiance (295–385 nm). Agric. For. Meteorol. 2003, 120, 101–111. [Google Scholar] [CrossRef]
- Murillo, W.; Cañada, J.; Pedrós, G. Correlation between global ultraviolet (290–385nm) and global irradiation in Valencia and Cordoba (Spain). Renew. Energ. 2003, 28, 409–418. [Google Scholar] [CrossRef]
- Wang, L.; Gong, W.; Li, J.; Ma, Y.; Hu, B. Empirical studies of cloud effects on ultraviolet radiation in Central China: UV radiation in central China. Int. J. Climatol. 2014, 34, 2218–2228. [Google Scholar] [CrossRef]
- Gandía, S.; Utrillas, M.P.; Gómez-Amo, J.L.; Esteve, A.R.; Estellés, V.; Pedrós, R.; Núñez, J.A.; Martínez Lozano, J.A. Relationship between UVB and broadband solar radiation in Spain: UVB and broadband solar radiation in Spain. Int. J. Climatol. 2015, 35, 1761–1771. [Google Scholar] [CrossRef]
- Adam, M.E.-N. Determination of daily total ultraviolet-B in a subtropical region (Upper Egypt): An empirical approach. Atmos. Res. 2015, 153, 1–9. [Google Scholar] [CrossRef]
- Antón, M.; Serrano, A.; Cancillo, M.L.; García, J.A. An empirical model to estimate ultraviolet erythemal transmissivity. Ann. Geophys. 2009, 27, 1387–1398. [Google Scholar] [CrossRef] [Green Version]
- Buntoung, S.; Janjai, S.; Nunez, M.; Choosri, P.; Pratummasoot, N.; Chiwpreecha, K. Sensitivity of erythemal UV/global irradiance ratios to atmospheric parameters: Application for estimating erythemal radiation at four sites in Thailand. Atmos. Res. 2014, 149, 24–34. [Google Scholar] [CrossRef]
- Gurrea, G.; Blanca-Giménez, V.; Pérez, V.; Serrano, M.-A.; Moreno, J.-C. Statistical Study and Prediction of Variability of Erythemal Ultraviolet Irradiance Solar Values in Valencia, Spain. Asia Pac. J. Atmos. Sci. 2018, 54, 599–610. [Google Scholar] [CrossRef]
- Antón, M.; Serrano, A.; Cancillo, M.L.; García, J.A. Relationship between erythemal irradiance and total solar irradiance in southwestern Spain. J. Geophys. Res. 2008, 113, D14. [Google Scholar] [CrossRef] [Green Version]
- Adam, M.E.-N. Atmospheric modulations of the ratio of UVB to broadband solar radiation: Effect of ozone, water vapour, and aerosols at Qena, Egypt. Int. J. Climatol. 2014, 34, 2477–2488. [Google Scholar] [CrossRef]
- Kylling, A.; Albold, A.; Seckmeyer, G. Transmittance of a cloud is wavelength-dependent in the UV-range: Physical interpretation. Geophys. Res. Lett. 1997, 24, 397–400. [Google Scholar] [CrossRef] [Green Version]
- Frederick, J.E.; Erlick, C. The attenuation of sunlight by high-latitude clouds: Spectral dependence and its physical mechanisms. J. Atmos. Sci. 1997, 54, 2813–2819. [Google Scholar] [CrossRef]
- Erlick, C.; Frederick, J.E.; Saxena, V.K.; Wenny, B.N. Atmospheric transmission in the ultraviolet and visible: Aerosols in cloudy atmospheres. J. Geophys. Res. 1998, 103, 31541–31555. [Google Scholar] [CrossRef]
- Bartlett, J.S.; Ciotti, Á.M.; Davis, R.F.; Cullen, J.J. The spectral effects of clouds on solar irradiance. J. Geophys. Res. Ocean. 1998, 103, 31017–31031. [Google Scholar] [CrossRef]
- Lindfors, A.; Arola, A. On the wavelength-dependent attenuation of UV radiation by clouds. Geophys. Res. Lett. 2008, 35, 253. [Google Scholar] [CrossRef]
- Erlick, C.; Frederick, J.E. Effects of aerosols on the wavelength dependence of atmospheric transmission in the ultraviolet and visible: 2. Continental and urban aerosols in clear skies. J. Geophys. Res. Atmos. 1998, 103, 23275–23285. [Google Scholar] [CrossRef]
- Kirchstetter, T.W.; Novakov, T.; Hobbs, P.V. Evidence that the spectral dependence of light absorption by aerosols is affected by organic carbon: Spectral light absorption by aerosols. J. Geophys. Res. Atmos. 2004, 109, D21. [Google Scholar] [CrossRef] [Green Version]
- Lee, H.; Kim, W.; Lee, Y.G.; Koo, J.-H.; Jung, Y.; Park, S.S.; Cho, H.-K.; Kim, J. Broadband dependence of atmospheric transmissions in the UV and total solar radiation. Tellus B Chem. Phys. Meteorol. 2019, 71, 1503513. [Google Scholar] [CrossRef]
- Lee, H.; Kim, W.; Lee, Y.G.; Kim, J.; Cho, H.K. Atmospheric transmission of ultraviolet and total solar radiation by clouds, aerosols, and ozone in Seoul, Korea: A comparison of semi-empirical model predictions with observations. Asia Pac. J. Atmos. Sci. 2019, 55, 165–175. [Google Scholar] [CrossRef]
- Jung, Y.; Lee, H.; Kim, J.; Cho, Y.; Kim, J.; Lee, Y. Spatiotemporal characteristics in the clearness index derived from global solar radiation observations in Korea. Atmosphere 2016, 7, 55. [Google Scholar] [CrossRef] [Green Version]
- Solar Light. UV-Biometer User’s Manual; Solar Light Co.: Glenside, PA, USA, 1993. [Google Scholar]
- Cañada, J.; Esteve, A.R.; Marín, M.J.; Utrillas, M.P.; Tena, F.; Martínez-Lozano, J.A. Study of erythemal, UV (A + B) and global solar radiation in Valencia (Spain). Int. J. Climatol. 2008, 28, 693–702. [Google Scholar] [CrossRef]
- El-Nouby Adam, M. Effect of the atmosphere on UVB radiation reaching the Earth’s surface: Dependence on solar zenith angle. Atmos. Ocean. Sci. Lett. 2011, 4, 139–145. [Google Scholar] [CrossRef]
- Madronich, S. UV radiation in the natural and perturbed atmosphere. In UV-B Radiation and Ozone Depletion: Effects on Humans, Animals, Plants, Microorganisms, and Materials; Tevini, M., Ed.; Lewis Publishers: Boca Raton, FL, USA, 1993; pp. 17–69. [Google Scholar]
- Serrano, A.; Antón, M.; Cancillo, M.L.; García, J.A. Proposal of a new erythemal UV radiation amplification factor. Atmos. Chem. Phys. Discuss. 2008, 8, 1089–1111. [Google Scholar] [CrossRef]
- Overall, J.E. Applied Multivariate Analysis; McGraw-Hill: New York, NY, USA, 1972. [Google Scholar]
- Foyo-Moreno, I.; Vida, J.; Alados-Arboledas, L. Ground based ultraviolet (290–385 nm) and broadband solar radiation measurements in south-eastern Spain. Int. J. Climatol. 1998, 18, 1389–1400. [Google Scholar] [CrossRef] [Green Version]
- Martinez-Lozano, J.A.; Tena, F.; Utrillas, M.P. Ratio of UV to global broad band irradiation in Valencia, Spain. Int. J. Climatol. 1999, 19, 903–911. [Google Scholar] [CrossRef]
- Sabziparvar, A.A. Estimation of clear-sky effective erythema radiation from broadband solar radiation (300–3000 nm) data in an arid climate. Int. J. Climatol. 2009, 29, 2027–2032. [Google Scholar] [CrossRef]
- Kim, Y.-A.; Choi, W. A study on the monthly characteristics of solar UV radiation in Gosan, Jeju. Atmosphere 2017, 27, 291–300, (In Korean with English abstract). [Google Scholar]
- Cui, X.; Gu, S.; Zhao, X.; Wu, J.; Kato, T.; Tang, Y. Diurnal and seasonal variations of UV radiation on the northern edge of the Qinghai–Tibetan Plateau. Agric. For. Meteorol. 2008, 148, 144–151. [Google Scholar] [CrossRef]
- Cañada, J.; Pedrós, G.; López, A.; Boscá, J.V. Influences of the clearness index for the whole spectrum and of the relative optical air mass on UV solar irradiance for two locations in the Mediterranean area, Valencia and Cordoba. J. Geophys. Res. Atmos. 2000, 105, 4759–4766. [Google Scholar] [CrossRef]
- Ogunjobi, K.O.; Kim, Y.J. Ultraviolet (0.280–0.400 μm) and broadband solar hourly radiation at Kwangju, South Korea: Analysis of their correlation with aerosol optical depth and clearness index. Atmos. Res. 2004, 71, 193–214. [Google Scholar] [CrossRef]
- Santos, J.B.; Villán, D.M.; Castrillo, A.D.M. Analysis and cloudiness influence on UV total irradiation. Int. J. Climatol. 2011, 31, 451–460. [Google Scholar] [CrossRef]
- Wang, L.; Gong, W.; Lin, A.; Hu, B. Measurements and cloudiness influence on UV radiation in Central China: Cloud effect on UV in central China. Int. J. Climatol. 2014, 34, 3417–3425. [Google Scholar] [CrossRef]
- Gong, W.; Zhang, M.; Wang, L.; Hu, B.; Ma, Y. Measurement and estimation of ultraviolet radiation in Pearl River Delta, China. J. Atmos. Sol. Terr. Phys. 2015, 123, 63–70. [Google Scholar] [CrossRef]
- Park, S.S.; Kim, J.; Cho, N.; Lee, Y.G.; Cho, H.K. The variations of stratospheric ozone over the Korean Peninsula. 1985–2009. Atmosphere 2011, 21, 349–359, (In Korean with English abstract). [Google Scholar]
- de Miguel, A.; Mateos, D.; Bilbao, J.; Román, R. Sensitivity analysis of ratio between ultraviolet and total shortwave solar radiation to cloudiness, ozone, aerosols and precipitable water. Atmos. Res. 2011, 102, 136–144. [Google Scholar] [CrossRef]
- Barnard, W.F.; Saxena, V.K.; Wenny, B.N.; DeLuisi, J.J. Daily surface UV exposure and its relationship to surface pollutant measurements. J. Air Waste Manag. 2003, 53, 237–245. [Google Scholar] [CrossRef] [Green Version]
- Kaskaoutis, D.G.; Kambezidis, H.D. Investigation into the wavelength dependence of the aerosol optical depth in the Athens area. Q. J. R. Meteorol. Soc. 2006, 132, 2217–2234. [Google Scholar] [CrossRef]
- Badarinath, K.V.S.; Kharol, S.K.; Kaskaoutis, D.G.; Kambezidis, H.D. Influence of atmospheric aerosols on solar spectral irradiance in an urban area. J. Atmos. Sol. Terr. Phys. 2007, 69, 589–599. [Google Scholar] [CrossRef]
- Lee, S.; Hong, J.; Cho, Y.; Choi, M.; Kim, J.; Park, S.S.; Ahn, J.-Y.; Kim, S.-K.; Moon, K.-J.; Eck, T.F.; et al. Characteristics of Classified Aerosol Types in South Korea during the MAPS-Seoul Campaign. Aerosol. Air Qual. Res. 2018, 18, 2195–2206. [Google Scholar] [CrossRef] [Green Version]


| Site | Latitude/Longitude | CC | AOD | TOC | SCD |
|---|---|---|---|---|---|
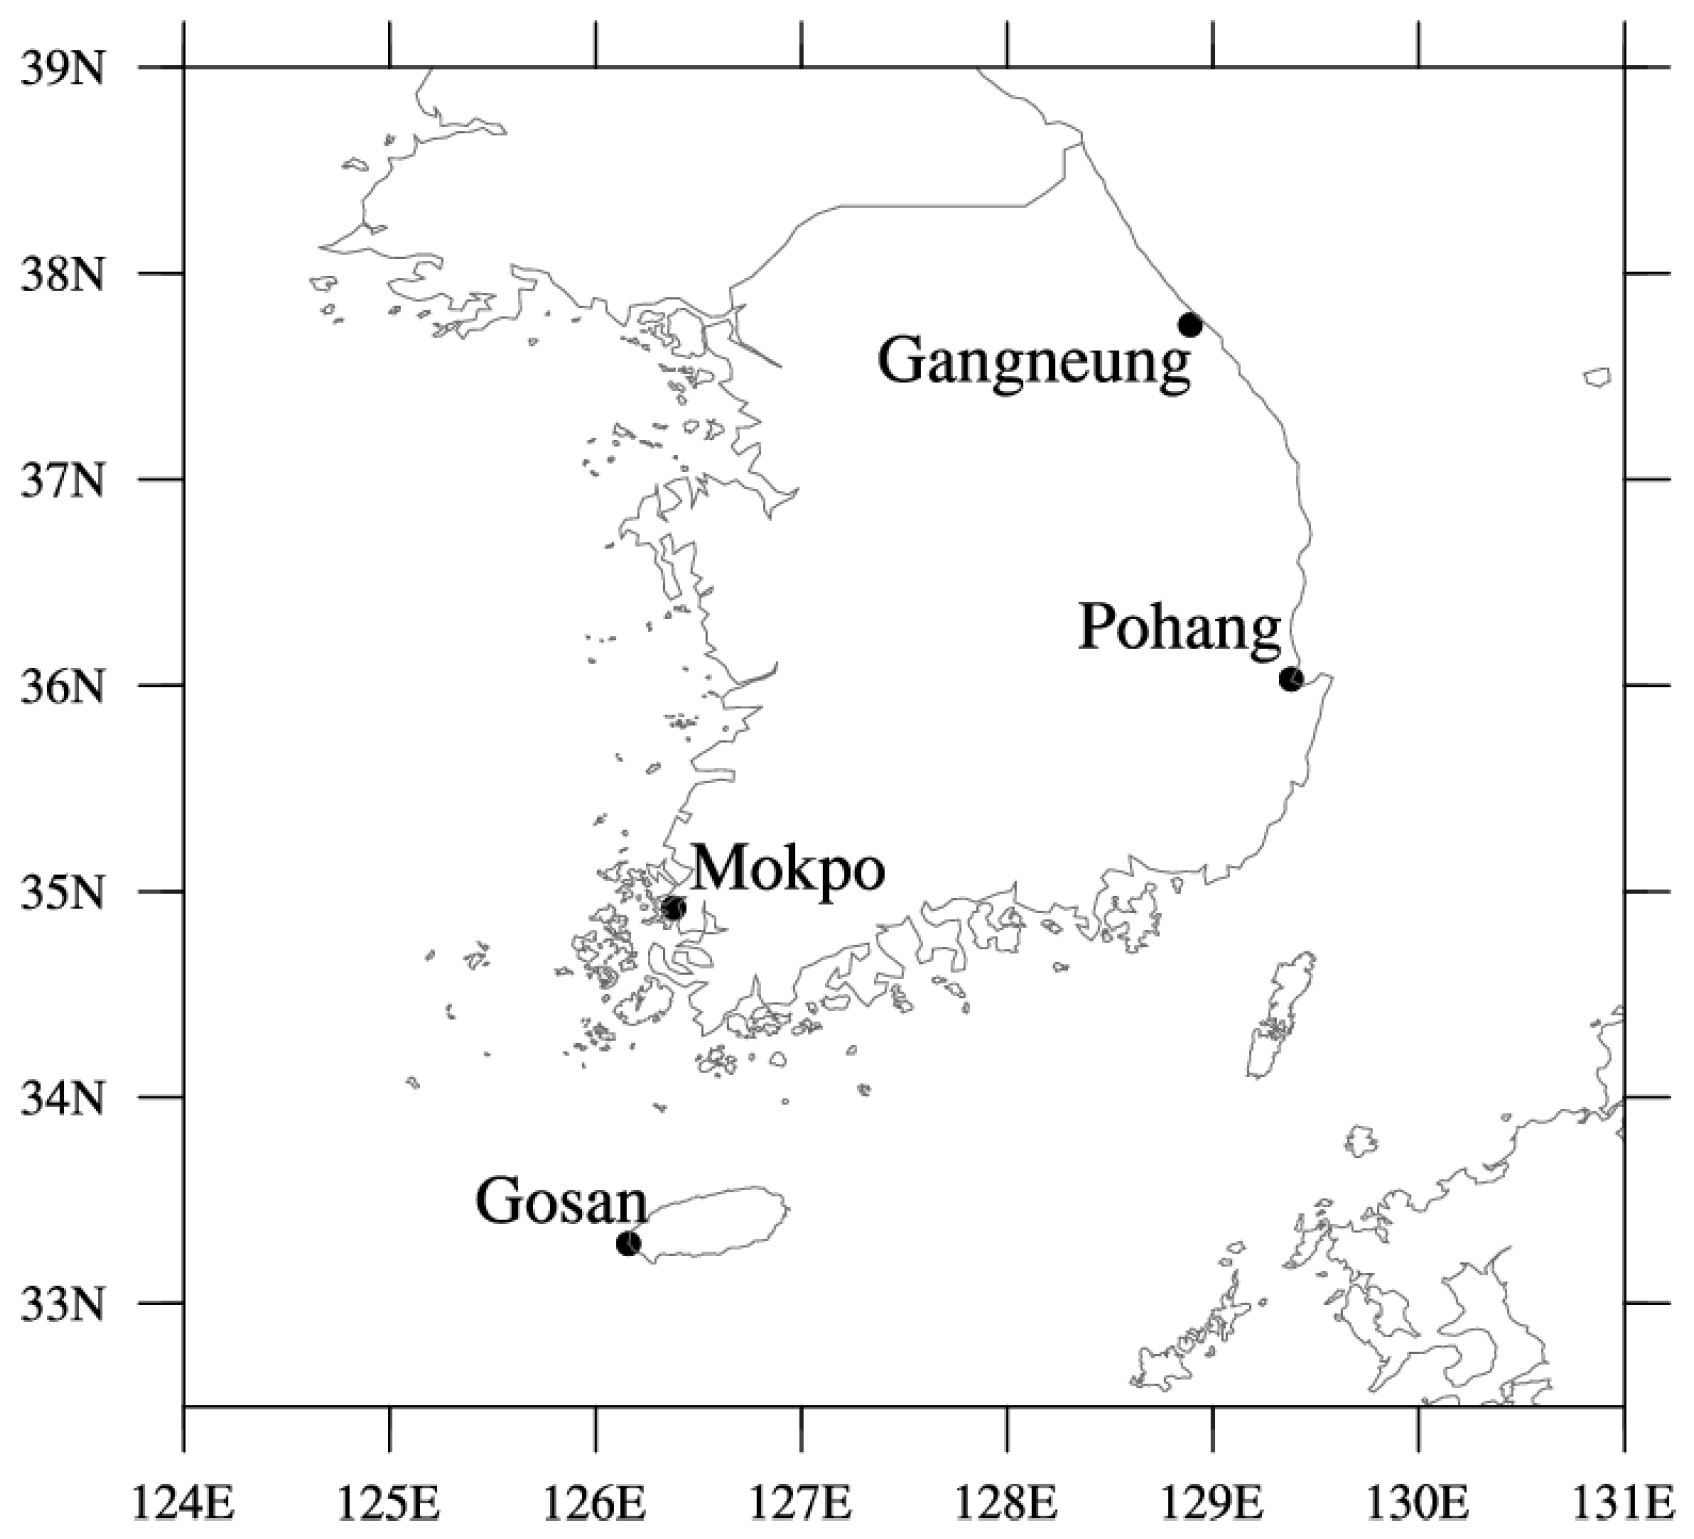
| Gangneung | 37°45′ N, 128°53′ E | 5.08 (±0.3) | 0.26 (±0.03) | 325 (±6.4) | 474 (±9.6) |
| Pohang | 36°01′ N, 129°23′ E | 4.90 (±0.2) | 0.33 (±0.03) | 319 (±6.2) | 452 (±9.0) |
| Mokpo | 34°49′ N, 126°22′ E | 5.43 (±0.2) | 0.39 (±0.04) | 306 (±5.8) | 418 (±8.3) |
| Gosan | 33°17′ N, 126°10′ E | 6.12 (±0.2) | 0.38 (±0.03) | 300 (±5.5) | 399 (±7.7) |
| Site | CC | AOD | SCD | |
|---|---|---|---|---|
| Gangneung | −0.85 | −0.34 | ||
| Pohang | −0.84 | −0.28 | ||
| Mokpo | −0.84 | −0.25 | ||
| Gosan | −0.84 | −0.33 | ||
| AVERAGE | −0.84 | −0.30 | ||
| Gangneung | −0.37 | −0.20 | −0.44 | |
| Pohang | −0.36 | −0.16 | −0.47 | |
| Mokpo | −0.53 | −0.21 | −0.50 | |
| Gosan | −0.59 | −0.34 | −0.48 | |
| AVERAGE | −0.46 | −0.23 | −0.47 | |
| Gangneung | −0.83 | −0.42 | ||
| Pohang | −0.81 | −0.36 | ||
| Mokpo | −0.77 | −0.38 | ||
| Gosan | −0.79 | −0.46 | ||
| AVERAGE | −0.80 | −0.41 |
| Site | CC | AOD | SCD | ||
|---|---|---|---|---|---|
| Gangneung | 0.72 | 70.5 | 1.2 | ||
| Pohang | 0.71 | 69.9 | 1.1 | ||
| Mokpo | 0.71 | 68.9 | 1.8 | ||
| Gosan | 0.71 | 67.7 | 3.5 | ||
| AVERAGE | 0.71 | 69.2 | 1.9 | ||
| Gangneung | 0.62 | 25.1 | 2.6 | 34.2 | |
| Pohang | 0.62. | 23.5 | 2.1 | 36.5 | |
| Mokpo | 0.65 | 30.8 | 3.9 | 30.4 | |
| Gosan | 0.68 | 33.3 | 8.1 | 27.0 | |
| AVERAGE | 0.65 | 28.2 | 4.2 | 32.0 | |
| Gangneung | 0.71 | 64.8 | 5.7 | ||
| Pohang | 0.68 | 62.6 | 5.8 | ||
| Mokpo | 0.65 | 55.7 | 8.9 | ||
| Gosan | 0.68 | 56.3 | 11.5 | ||
| AVERAGE | 0.68 | 59.8 | 8.0 |
© 2020 by the authors. Licensee MDPI, Basel, Switzerland. This article is an open access article distributed under the terms and conditions of the Creative Commons Attribution (CC BY) license (http://creativecommons.org/licenses/by/4.0/).
Share and Cite
Kim, J.; Lee, Y.G.; Koo, J.-H.; Lee, H. Relative Contributions of Clouds and Aerosols to Surface Erythemal UV and Global Horizontal Irradiance in Korea. Energies 2020, 13, 1504. https://doi.org/10.3390/en13061504
Kim J, Lee YG, Koo J-H, Lee H. Relative Contributions of Clouds and Aerosols to Surface Erythemal UV and Global Horizontal Irradiance in Korea. Energies. 2020; 13(6):1504. https://doi.org/10.3390/en13061504
Chicago/Turabian StyleKim, Jaemin, Yun Gon Lee, Ja-Ho Koo, and Hanlim Lee. 2020. "Relative Contributions of Clouds and Aerosols to Surface Erythemal UV and Global Horizontal Irradiance in Korea" Energies 13, no. 6: 1504. https://doi.org/10.3390/en13061504