Article

Effect of Axial In-Situ Stress in Deep Tunnel Analysis Considering Strain Softening and Dilatancy

1
School of Energy & Mining Engineering, China University of Mining and Technology (Beijing), Beijing 100083, China
2
Mining and Designing Branch, China Coal Research Institute, Beijing 100013, China
3
Coal Mining and Designing Department, Tiandi Science and Technology Co., Ltd., Beijing 100013, China
4
Key Laboratory of In-situ Property-improving Mining of Ministry of Education, Taiyuan University of Technology, Taiyuan 030024, China
5
State Key Laboratory of Coal Mining and Clean Utilization, China Coal Research Institute, Beijing 100013, China
*
Authors to whom correspondence should be addressed.
Energies 2020, 13(6), 1502; https://doi.org/10.3390/en13061502
Submission received: 17 February 2020 / Revised: 19 March 2020 / Accepted: 20 March 2020 / Published: 22 March 2020
(This article belongs to the Section H: Geo-Energy)

Abstract

:
In many previous tunnel analyses, the axial in-situ stress was ignored. In this work, its effect on the deformation and failure of the surrounding rock of a deep tunnel was revealed, considering the objective strain softening and dilatancy behavior of the surrounding rock. Analysis based on the incremental plastic flow theory was conducted, and C++ was used to write a constitutive model for numerical simulation to verify and further analyze this effect. Then, the results were validated by the field monitoring data of a coal mine gateway. Results show that the effect of the axial in-situ stress σa0 is more significant when strain softening is considered, compared with the results of a perfectly elastoplastic model. When the axial stress σa is σ1 or σ3 at the initial yield, an increase or decrease in σa0 intensifies the deformation and failure of the surrounding rock. When σa is σ2 at the initial yield, 3D plastic flow partly controlled by σa may occur, and an increase in σa0 intensifies the deformation and failure of the surrounding rock. The effect of σa0 will be amplified by considering dilatancy. Considering both strain softening and dilatancy, when σa0 is close to the tangential in-situ stress σt0 or significantly greater than σt0 (1.5 times), σa will be σ2 or σ1 at the initial yield, and then 3D plastic flow will occur. In the deformation prediction and support design of a deep tunnel, σa0 should not be ignored, and the strain softening and dilatancy behavior of the surrounding rock should be accurately considered.

1. Introduction

Mineral resources are an important source of energy, and their development is shifting to deeper areas [1,2,3], increasing the depths of the tunnels excavated for the exploitation of mineral resources. Statistically, deep tunnels account for approximately 30% of the tunnels constructed each year, and 70% of these tunnels will need to be repaired owing to large deformations of the surrounding rock masses under high in-situ stress conditions, which greatly increases costs [4]. It is therefore important to correctly evaluate the effect of in-situ stress on a deep tunnel to more accurately predict tunnel deformation and better support design.
A deep tunnel problem is often simplified to a plane strain problem, and the tangential stress σt and radial stress σr are considered to be the maximum principal stress σ1 and minimum principal stress σ3, respectively, while the axial stress σa is assumed to be the intermediate principal stress σ2. In many previous analyses [5,6,7], the effect of σa was not considered, and the axial in-situ stress σa0, the initial value of σa, was ignored. However, Lu, A.-Z. et al. [8] pointed out that when σa0 exceeds a certain critical value, it has an effect on the calculation results, and they then defined the problem as a quasi-plane strain problem. Wang, S. et al. [9] considered that the greater the strength drop of the surrounding rock or the greater the difference between σa0 and the uniform in-plane in-situ stress, the more significant the effect of σa0 will be. Guan, K. et al. [10] pointed out that σa0 will cause axial plastic flow, leading to an increase in the deformation of the surrounding rock. However, the abovementioned studies focused on only circular tunnels and either ignored or incompletely considered the post-peak mechanical behavior of the rock masses.
Extensive laboratory tests and field observations [11,12,13,14,15] show that a strain softening model can better describe the post-peak mechanical behavior of most rock masses than perfectly elastoplastic and elasto-brittle-plastic models can. Dilatancy is closely associated with the deformation and failure of a rock mass [16,17,18]. Many rock mechanical tests [19,20,21] show that a rock mass exhibits significant dilatancy in the post-peak stage and that the dilation angle strongly depends on the confining stress and plastic shear strain, decreasing nonlinearly with an increase in the confining stress or plastic shear strain. The surrounding rock of a deep tunnel has a large post-peak zone under high in-situ stress conditions [22,23], and strain softening and dilatancy, as the two main characteristics of the post-peak mechanical behavior of a rock mass, show a significant synergistic effect [24]; thus, they should both be accurately considered in a deep tunnel analysis [25].
To reveal the effect of the axial in-situ stress on the deformation and failure of the surrounding rock of a deep tunnel, this paper considers the strain softening and dilatancy of the surrounding rock and analyzes a more common rectangular tunnel [17] based on the incremental plastic flow theory under perfectly elastoplastic, considering only dilatancy, considering only strain softening and considering both strain softening and dilatancy, for a total of four conditions. Then, a numerical simulation is conducted to verify and further analyze the effect: a constitutive model considering nonlinear strain softening and two-parameter dilation angle is written in C++, and this constitutive model is combined with the dynamic relaxation method in FLAC3D to analyze the effect of the axial in-situ stress on the surface displacement and the plastic zone depth of a deep rectangular tunnel under the abovementioned four conditions. Finally, the results of the theoretical analysis and numerical simulation are verified by the field monitoring data.
Mineral resources, such as coal and petroleum, occur in the earth’s crust, so the in-situ stress has an important impact on their exploitation [26,27]. In this work, the effect of the axial in-situ stress on a deep tunnel excavated for the exploitation of mineral resources is evaluated, and a novel constitutive model is developed to accurately predict the deformation and failure of the tunnel surrounding rock, which can improve the rationality of the preliminary design of a deep tunnel, reduce the repair rate, thus reduce cost and improve production efficiency.

2. Theoretical Analysis

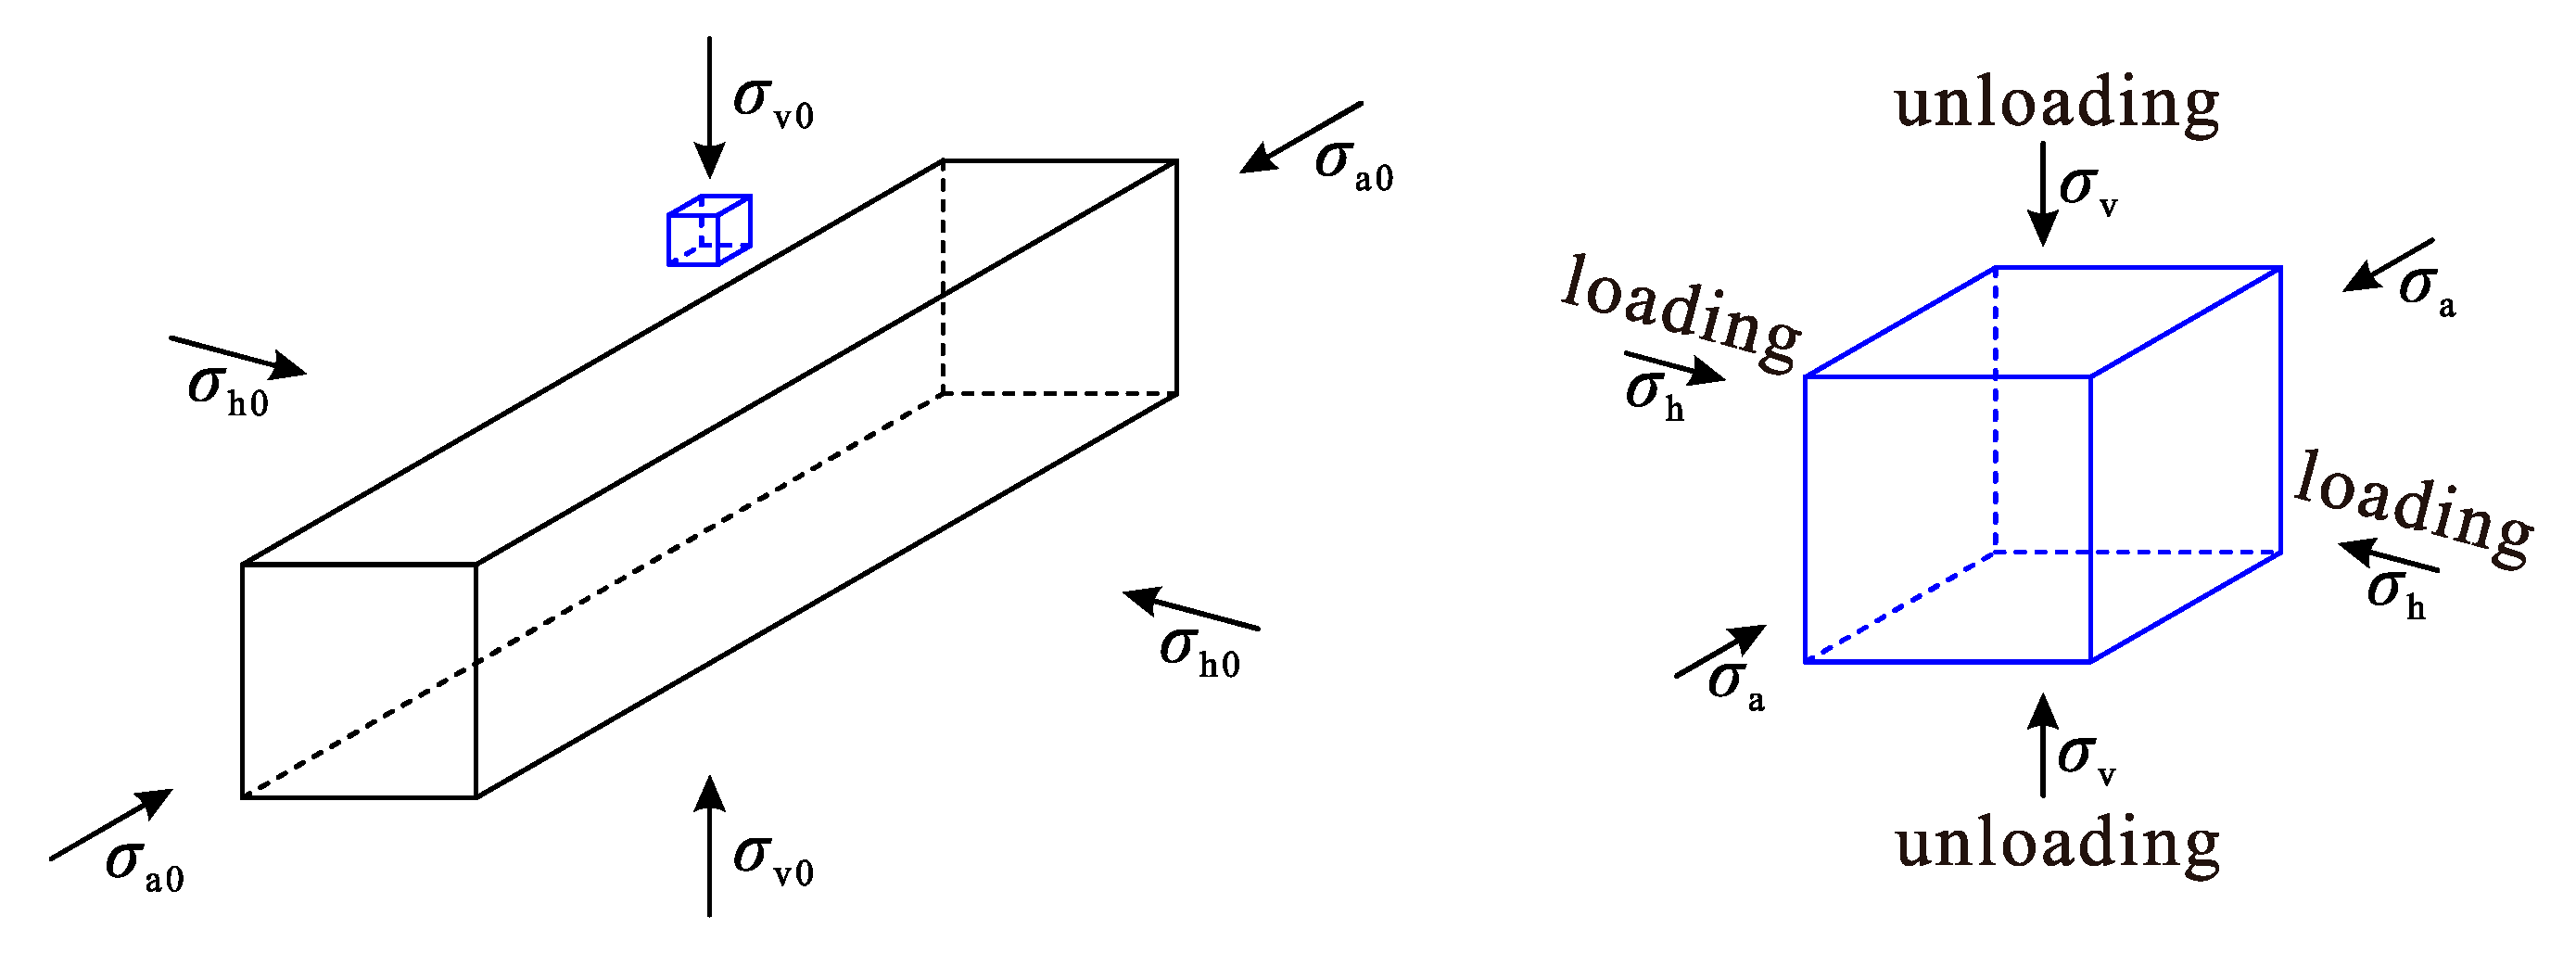
2.1. Description of the Problem

To exclude other influencing factors, this paper studies a rectangular tunnel excavated in a homogeneous mudstone, and the axial in-situ stress σa0, vertical in-situ stress σv0 and lateral in-situ stress σh0 are the principal stresses before excavation, as shown in Figure 1. For a rectangular tunnel, the displacement and the plastic zone depth at the middle of the roof are generally larger, and because of symmetry, the axial stress σa, vertical stress σv and lateral stress σh at these positions are always the principal stresses during the equilibrium process after the excavation. Therefore, in this section, a microunit at the middle of the roof is taken as an example for analysis. Then, σh is the tangential stress σt, which is loading during the equilibrium process, and σv is the radial stress σr, which is unloading during the equilibrium process.
Because the failure mode of the surrounding rock in a deep tunnel is mainly shear failure caused by radial unloading, and tensile failure occurs in only the shallow part of the surrounding rock, this section discusses only shear failure (tensile failure is considered in the numerical simulation below). The M-C yield criterion f, which is widely used in engineering [28,29], and the nonassociated plastic flow rule are used for the analysis (compression and contraction are considered positive herein).
f = σ 1 σ 3 N φ 2 c N φ = 0
g = σ 1 σ 3 N ψ Δ ε i p = λ g σ i , i = 1 , 2 , 3
where Δ ε 1 p , Δ ε 2 p and Δ ε 3 p are the maximum, intermediate and minimum plastic principal strain increments, respectively, c is the cohesion, ψ is the dilation angle, Nα = (1 + sin(α))/(1 − sin(α)) is a transformation function, g is a plastic potential function, and λ is a constant that can be determined based on the consistency condition.

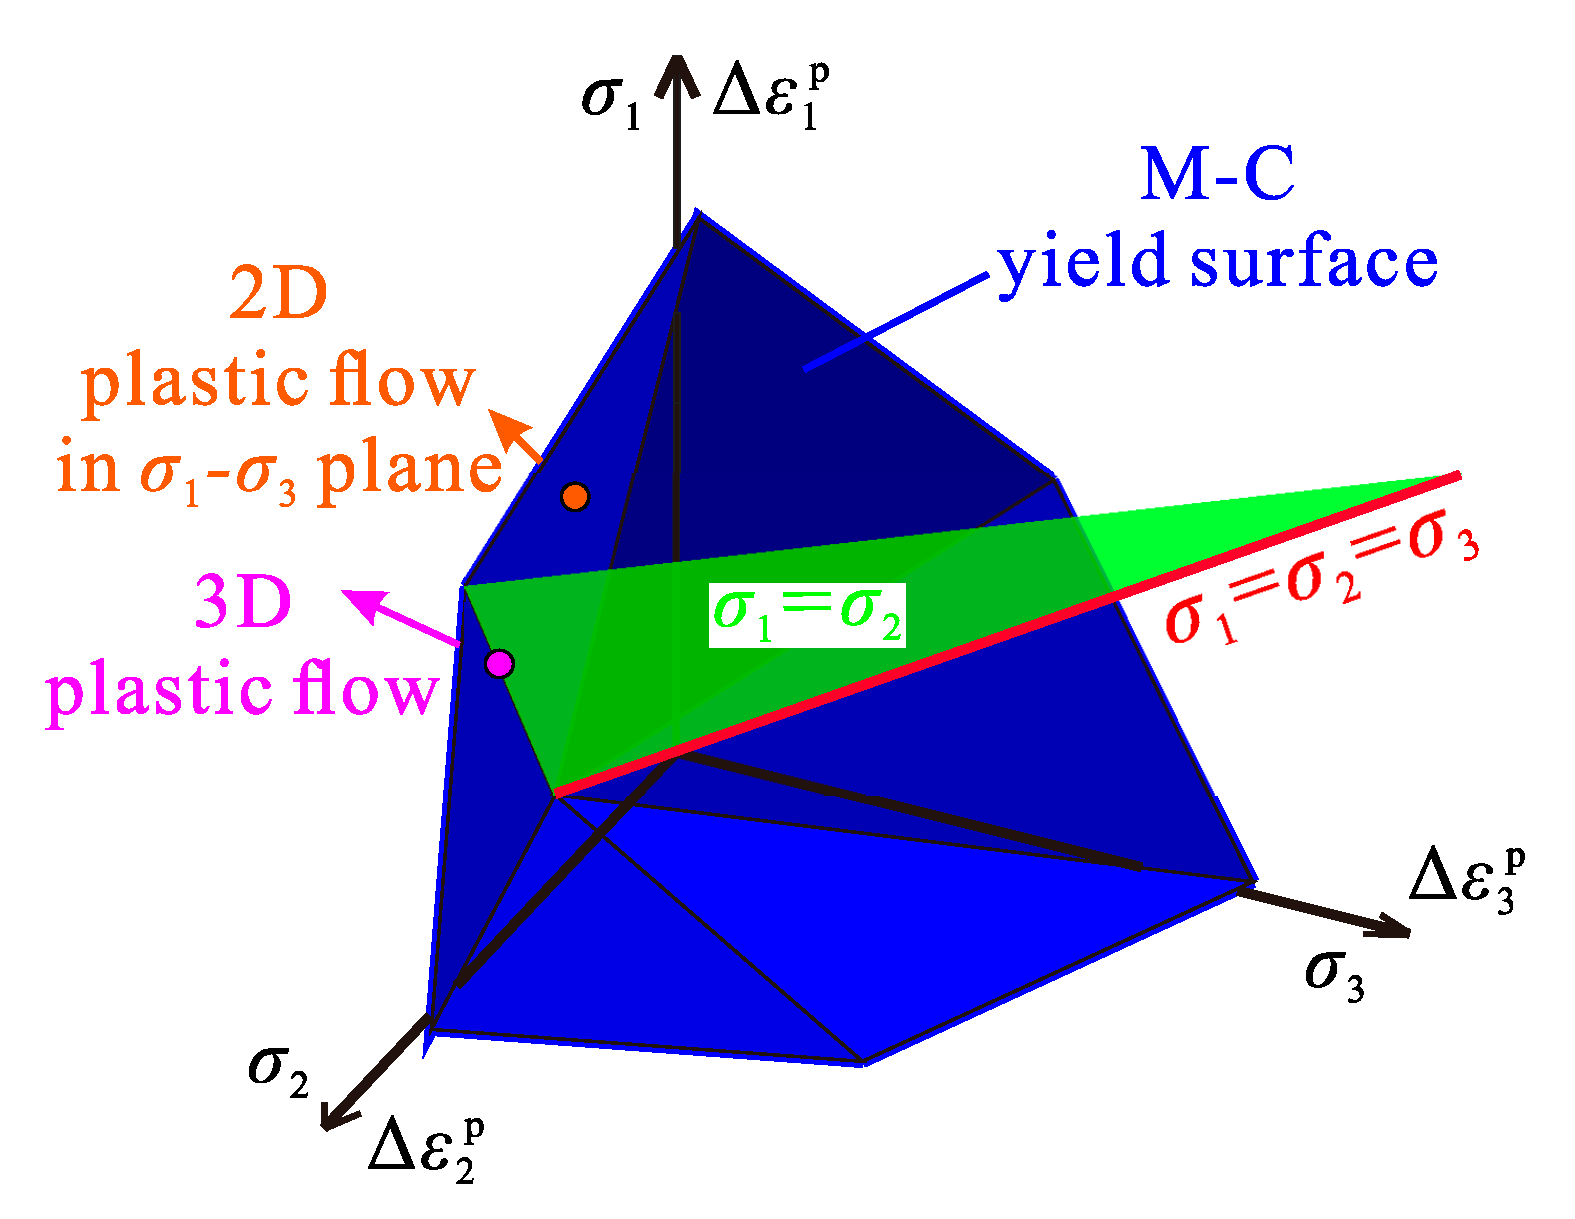
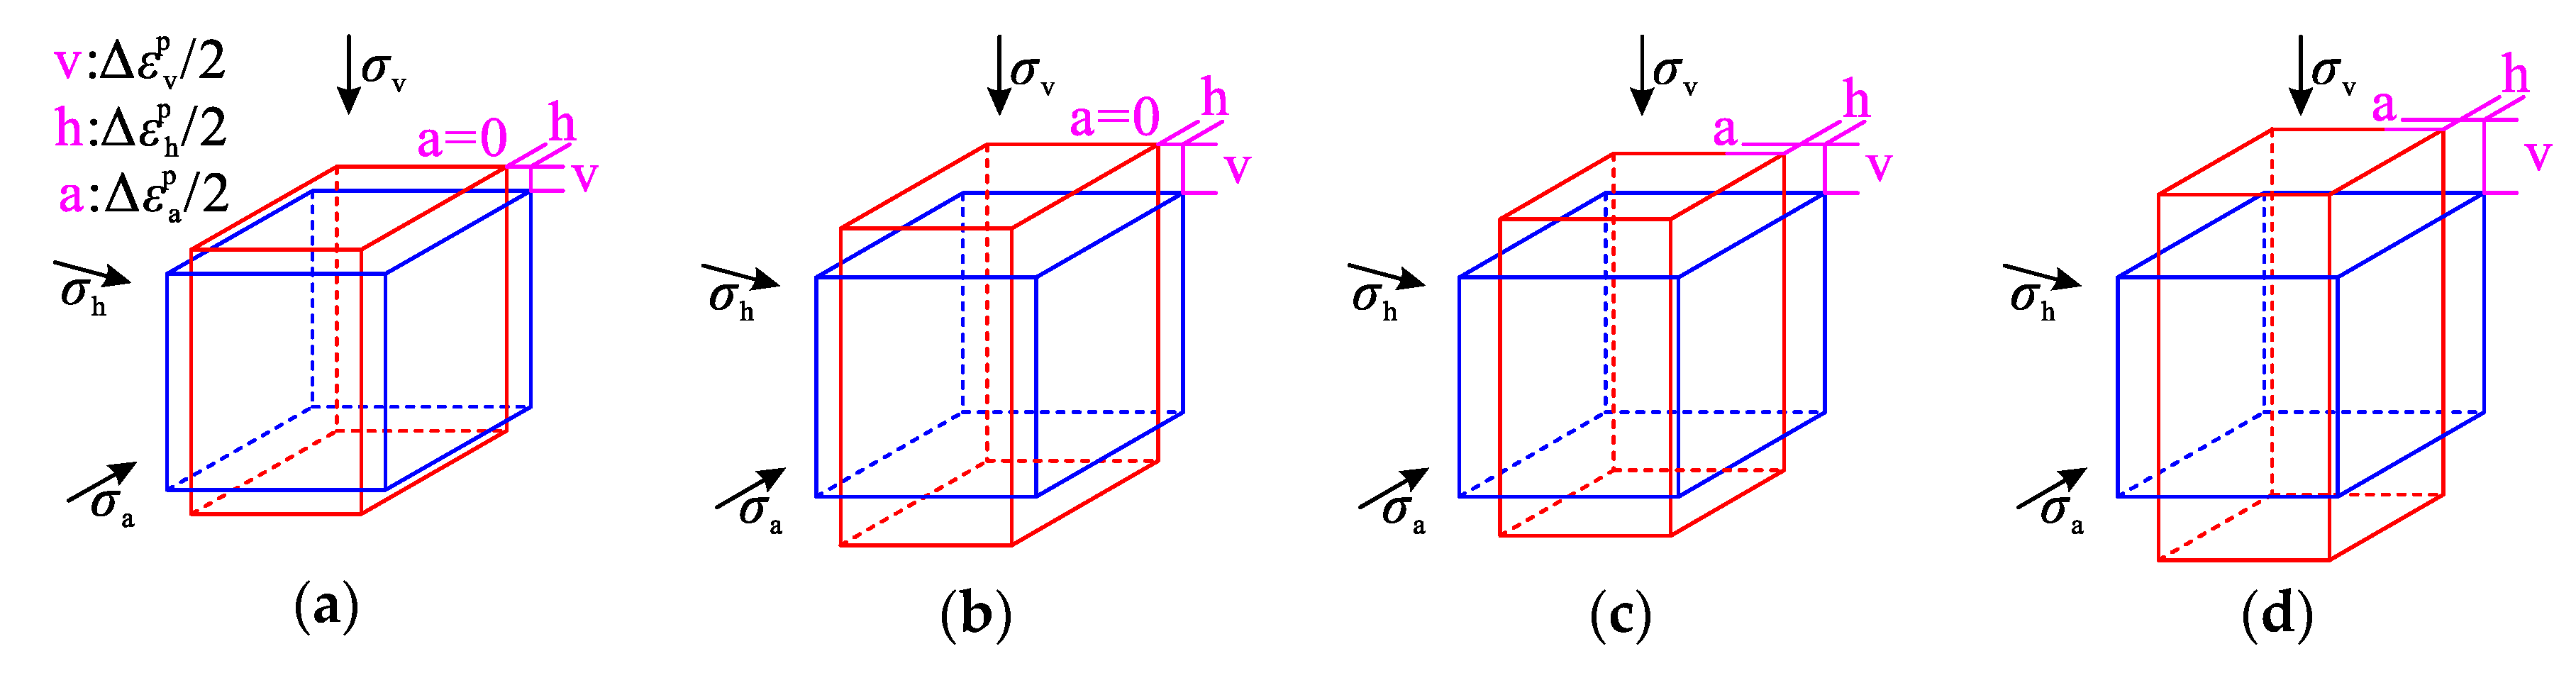
2.2. When σa is σ1 or σ3 at the Initial Yield

In the case of a large difference between σa0 and the in-plane in-situ stress, σa will be σ1 or σ3 at the initial yield of the surrounding rock [8,9]. According to Equations (1) and (2), σa will control the failure of the surrounding rock and change the directions of the plastic flow (the axial plastic principal strain increment Δ ε a p becomes Δ ε 1 p or Δ ε 3 p ).
Strain softening leads to degradation of the surrounding rock and contraction of the yield surface, which amplifies the effect of σa0. In a strain softening model, the strength parameters are usually defined as functions of the plastic shear strain γp, but the definitions of γp are not standardized. γp is commonly defined as the difference between the maximum plastic principal strain ε 1 p and minimum plastic principal strain ε 3 p [30], and its incremental form Δγp is usually used in calculations:
Δ γ p = Δ ε 1 p Δ ε 3 p
According to Equations (2) and (3), Δγp can be written as:
Δ γ p = ( 1 + N ψ ) λ
When considering dilatancy, Nψ > 1, inducing an increase in Δγp. This accelerates the strain softening, thus further amplifying the effect of σa0.

2.3. When σa Is σ2 at the Initial Yield

As shown in Figure 2, if the strain softening is not considered, σa0 will neither affect the failure nor the plastic flow of the surrounding rock (according to Equation (2), the whole post-peak process is represented by 2D plastic flow controlled by σh (σ1) and σv (σ3), as shown in Figure 3); thus, σa0 will not affect the calculation results.
When considering strain softening, σh (σ1) rapidly decreases in the post-peak stage, and its curve may intersect with the curve of σa, causing σa = σh > σv (σ1 = σ2 > σ3), which will lead to a 3D plastic flow along an edge of the yield surface [31], as shown in Figure 3. The closer σa is to σh at the initial yield, the more likely this phenomenon will occur, the earlier it will occur, and the longer it will last. Substituting σa, σh and σv into Equations (1) and (2), the M-C yield criterion f and the nonassociated plastic flow rule become:
f 1 = σ a σ v N φ 2 c N φ = 0 f 2 = σ h σ v N φ 2 c N φ = 0
g 1 = σ a σ v N ψ g 2 = σ h σ v N ψ Δ ε j p = λ 1 g 1 σ j + λ 2 g 2 σ j , j = a , h , v
where f1 and g1 are the yield criterion and plastic potential function of the σaσv plane, f2 and g2 are the yield criterion and plastic potential function of the σhσv plane, λ1 and λ2 are the constants corresponding to f1 and g1 and f2 and g2, respectively, and can be determined based on the consistency condition.
According to Equations (5) and (6), when considering strain softening, σa will affect the calculation results. This is further discussed by analyzing the vertical, lateral and axial plastic principal strain increments Δ ε v p , Δ ε h p and Δ ε a p of the microunit at the middle of the roof, and the dilatancy is also considered, as shown in Figure 4.
According to Figure 4, under the condition that σa is σ2 at the initial yield of the surrounding rock, whether consider the strain softening or dilatancy induces the plastic principal strain increments different. The vertical plastic principal strain ε v p is the main component of the roof subsidence (the plastic deformation is a main component of the deformation of the surrounding rock of a deep tunnel), and its increment Δ ε v p is analyzed below. In addition, the sign represents only contraction or extension, so the absolute values are taken for the following analysis.
For the perfectly elastoplastic model, the whole post-peak process is represented by 2D plastic flow controlled by σh and σv. In this case, ψ = 0, Nψ = 1, and the following can be derived from Equation (2):
| Δ ε a p | = 0 | Δ ε v p | = | Δ ε h p | = λ
According to Equation (7), σa has no effect on the results.
When considering only dilatancy, the whole post-peak process is represented by 2D plastic flow controlled by σh and σv. In this case, ψ > 0, Nψ > 1, and the following can be derived from Equation (2):
| Δ ε a p | = 0 | Δ ε v p | = λ N ψ > | Δ ε h p | = λ
A comparison of Equations (8) and (7) shows that Δ ε v p increases when considering dilatancy. Additionally, σa still has no effect on the results.
When considering only strain softening, the whole post-peak process is represented by 3D plastic flow controlled by σa, σh and σv. In this case, ψ = 0, Nψ = 1, and the following can be derived from Equation (6):
| Δ ε v p | = | Δ ε a p | + | Δ ε h p | = λ 1 + λ 2
According to Equation (9), Δ ε v p increases when considering σa.
When considering both strain softening and dilatancy, the whole post-peak process is represented by 3D plastic flow controlled by σa, σh and σv. In this case, ψ > 0, Nψ > 1, and the following can be derived from Equation (6):
| Δ ε v p | = ( | Δ ε a p | + | Δ ε h p | ) N ψ = ( λ 1 + λ 2 ) N ψ
A comparison of Equations (10) and (9) shows that Δ ε v p further increases when considering σa.
In addition, when considering both strain softening and dilatancy, the following can be derived from Equations (4) and (6):
Δ γ p = ( 1 + N ψ ) ( λ 1 + λ 2 )
Equation (11) indicates that considering σa will increase Δγp and accelerate the strain softening process.
In summary, if σa is σ1 or σ3 at the initial yield of the surrounding rock, σa will control the failure of the surrounding rock and change the directions of the plastic flow, and the effect of σa will be amplified by considering strain softening. If σa is σ2, without considering strain softening, σa has no effect on the results; when considering strain softening, 3D plastic flow may occur, and considering σa will increase the deformation of the surrounding rock and accelerate the strain softening process. The effect of σa will be further amplified by considering dilatancy.
However, the above analysis discusses only the plastic principal strain increments of the microunit at the middle of the roof and does not indicate under what conditions σa will become σ1, σ2 or σ3 at the initial yield and under what conditions 3D plastic flow will occur. Additionally, the variations in c and ψ are not considered. A numerical simulation is adopted below to verify the theoretical analysis results and further analyze.

3. Numerical Simulation

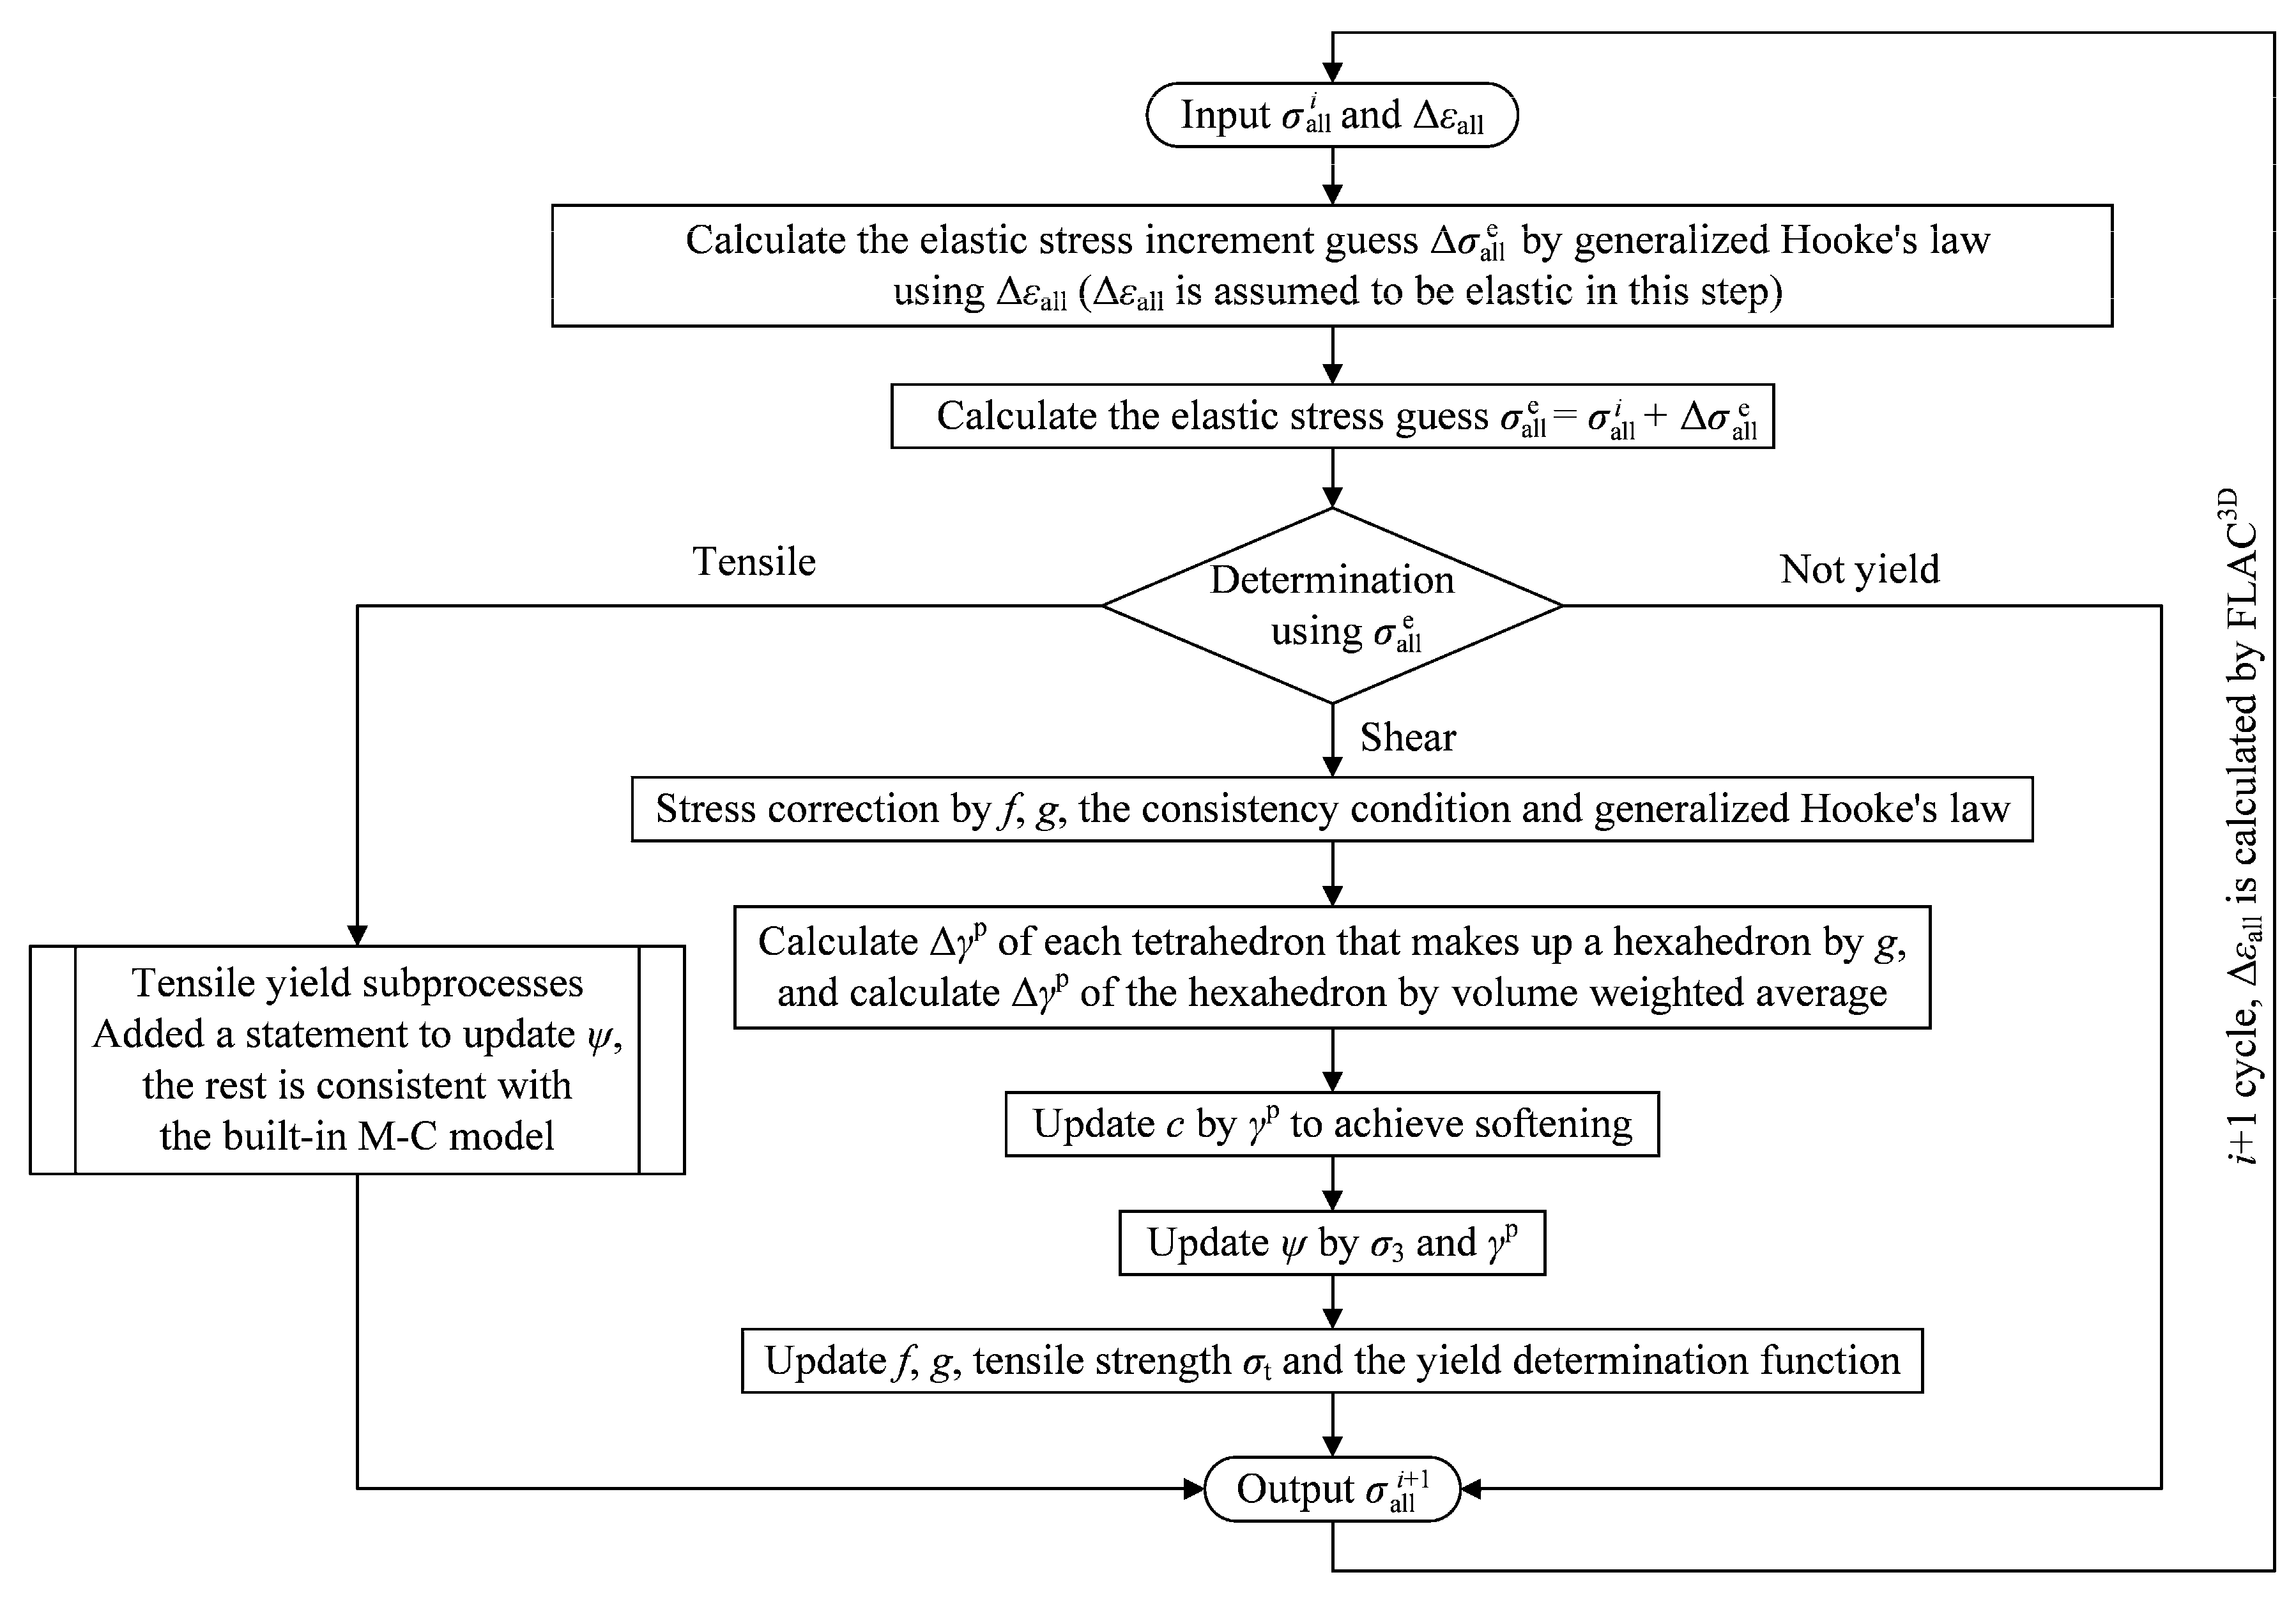
3.1. Constitutive Model Development

FLAC3D includes a built-in strain softening model [32], but the effect of the confining stress on the dilation angle cannot be considered. The softening parameter is defined as the square root of the second invariant of the plastic deviatoric strain instead of the plastic shear strain. Material parameters can be defined by only piecewise linear functions of the softening parameter. Therefore, a new constitutive model is developed herein with C++ to accurately consider the strain softening and dilatancy of the surrounding rock.
There have been many strain softening models and dilation angle models presented in previous studies, but few have presented both strain softening and dilation models at the same time. Based on the triaxial test data of many sedimentary rocks, Pourhosseini and Shabanimashcool [30] presented two such models at the same time and pointed out that during the strain softening process, only the cohesion c degrades, whereas the friction angle φ remains constant.
c = c 0 ( 1 tanh ( 100 γ p ) tanh ( 10 ) + 0.001 ) A
ψ = ψ 0 ( 1 tanh ( 100 γ p ) tanh ( 10 ) + 0.001 ) B ψ 0 = C ln ( φ σ c σ 3 + 0.1 ) D
where c0 and ψ0 are the peak cohesion and dilation angle, respectively, σc is the uniaxial compressive strength, and a, b, A, and B are fitting parameters that depend on the rock type (A = 0.340, B = 0.125, C = 6.794, and D = 15.308 for mudstone [30]).
According to the variations in the parameters in Equations (12) and (13), combined with the M-C yield criterion and the nonassociated plastic flow rule, a constitutive model considering both strain softening and dilatancy is developed. Its function is to calculate all the stress components σ all i + 1 of the i+1 cycle using all the stress components σ all i and all the strain increments Δεall of the i cycle and update the related material parameters, the M-C yield criterion and the plastic potential function. The main calculation steps are shown in Figure 5. Firstly, calculate the elastic stress increment guess Δ σ all e (assume that Δεall is elastic, so it is called guess) by generalized Hooke’s law using Δεall. Secondly, calculate the elastic stress guess σ all e as the sum of σ all i and Δ σ all e . Finally, determine whether the material is yield using σ all e . If the material is yield, σ all i + 1 will be output after stress correction. If the material is not yield, σ all i + 1 will be output directly. The cohesion c is updated by the plastic shear stain γp to achieve strain softening, then the yield criterion f is updated, which will affect the yield determination and stress correction. The strain softening and dilatancy switches can both be closed (corresponding to the perfectly elastoplastic model, identical to the built-in M-C model), both be opened, or be opened any one of them. The method described by Itasca Inc. [32] is used to verify the constitutive model, and the variations in c and ψ are accurately consistent with Equations (12) and (13).

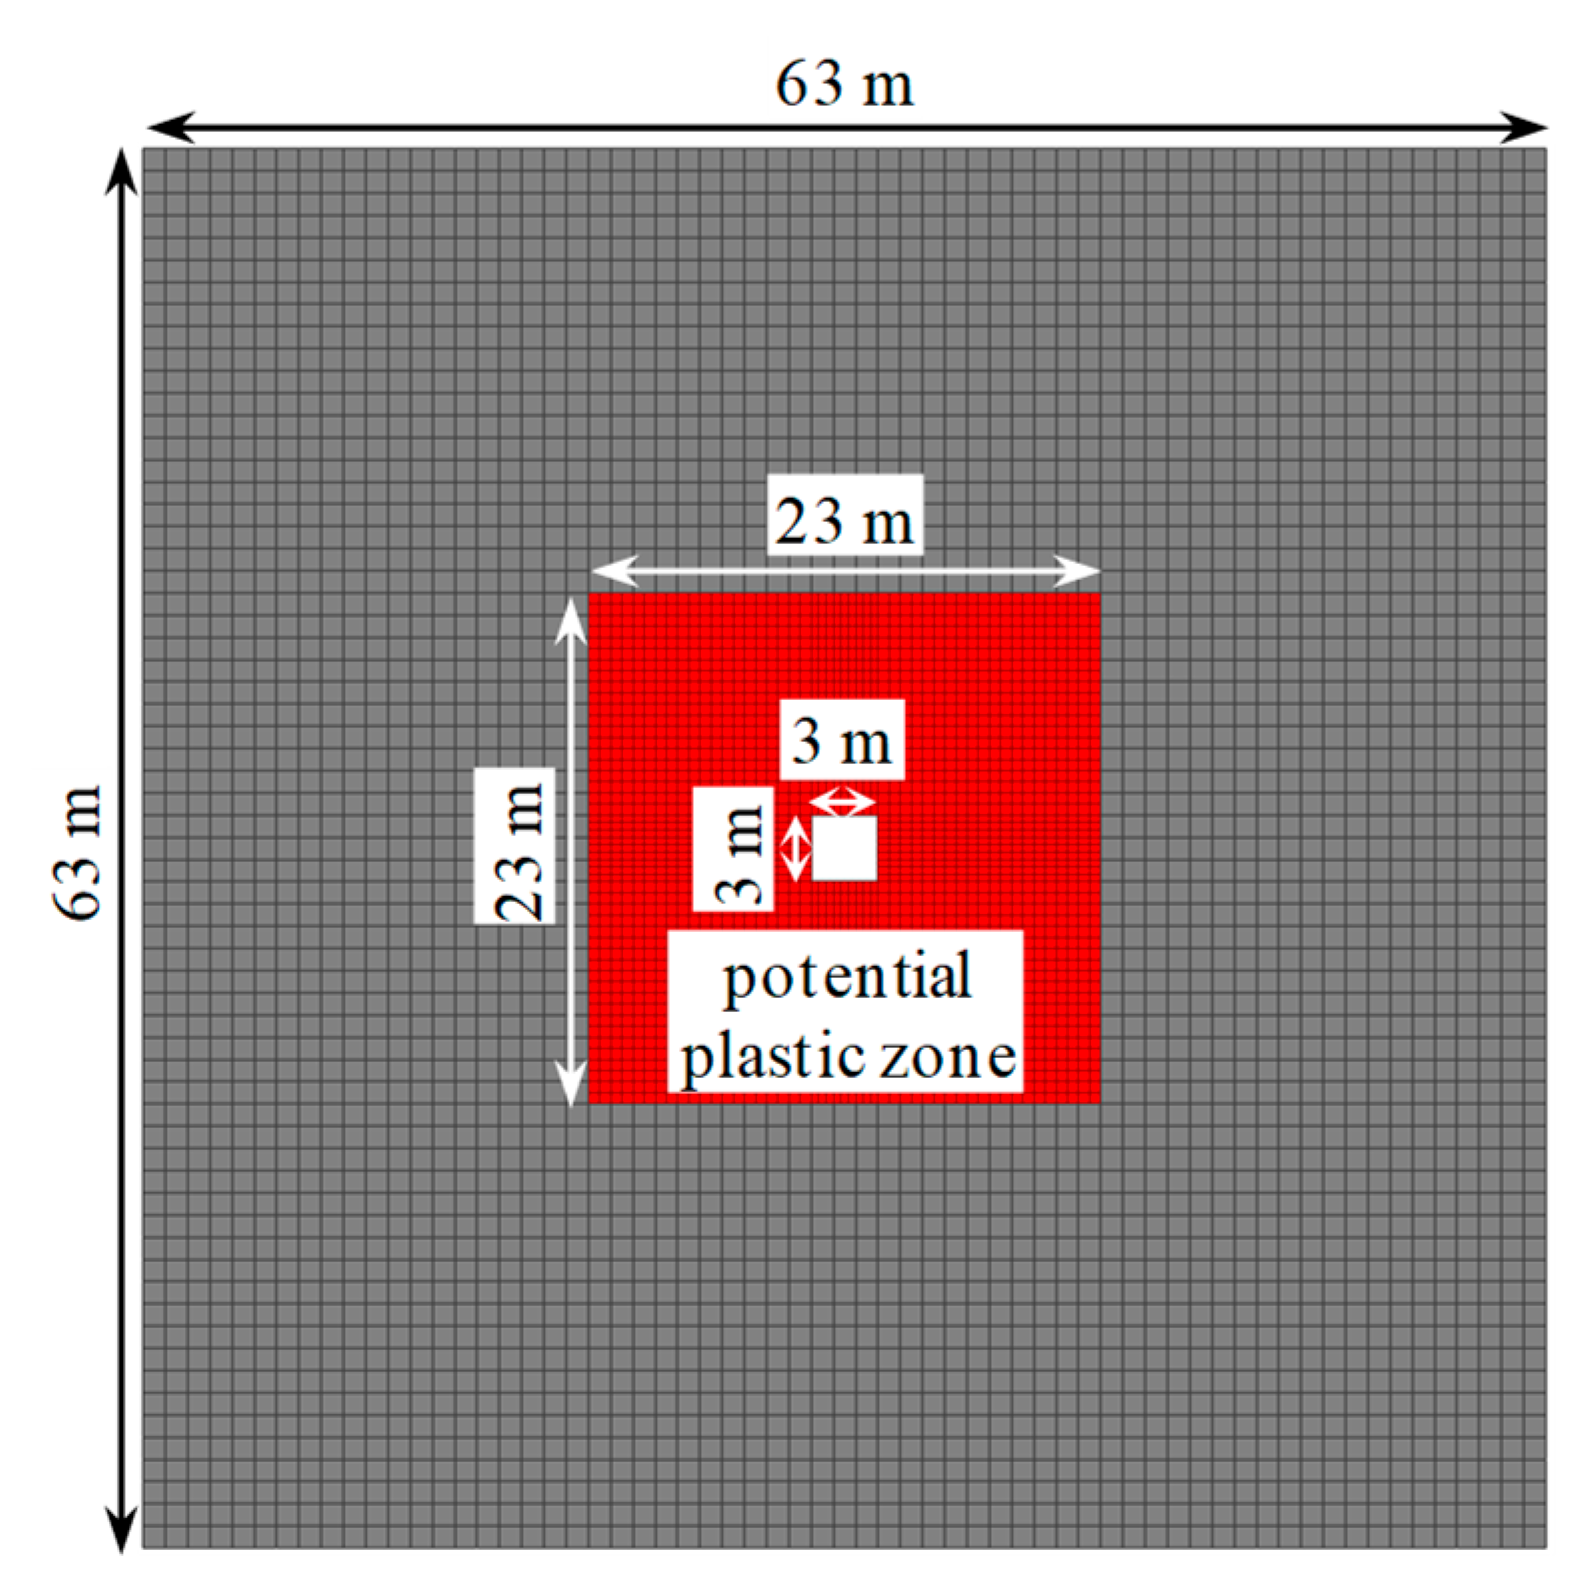
3.2. Numerical Model and Schemes

To exclude other influencing factors and considering that the vertical in-situ stress is stable and that the horizontal in-situ stress does not vary considerably [27], the following schemes are adopted: the excavation depth is set to 1000 m (σv0 = 25 MPa), and the surrounding rock is a homogeneous mudstone, with c0 = 6.37 MPa and φ = 25° (σc = 20 MPa). The perfectly elastoplastic model, considering only dilatancy, considering only strain softening and considering both strain softening and dilatancy are the four investigated conditions, σh0/σv0 = 0.50, 0.75, 1.00, 1.25 and 1.50 are the five investigated lateral in-situ stress ratios, and σa0/σv0 = 0.5, 0.75, 1.00, 1.25 and 1.50 are the five investigated axial in-situ stress ratios, for a total of 100 schemes. The Initial command [32] is used to generate the in-situ stress. The compressive stress is negative in the model, but for the convenience of analysis, the compressive stress is positive herein. As shown in Figure 6, the cross-section of the rectangular tunnel is set to 3 m × 3 m (a common cross-section in coal mines [1]), the model thickness is set to 5 m (although it is a planar problem, the axial plastic flow can be simulated more precisely in this way), the model boundaries are 30 m away from the excavation boundaries (10 times the tunnel dimension to reduce the error caused by the artificial boundaries), and all the model boundaries are fixed in the normal directions (if the artificial boundaries are far enough, the results of displacement boundary conditions and stress boundary conditions are almost the same, and the former is selected herein). The model has a total of 41,210 grids and 49,172 nodes, and nearly uniform mesh generation is adopted in the potential plastic zone to reduce the influence caused by the strain localization problem [33]. When the current maximum unbalanced force in the model is less than 10-5 times (recommended ratio in the manual [32]) the maximum unbalanced force just after the excavation, the model is considered to be in equilibrium. Because the deformation and failure mechanism of the roof, floor and two sidewalls of a deep tunnel are similar, the roof as taken as an example to analyze the effect of σa0.

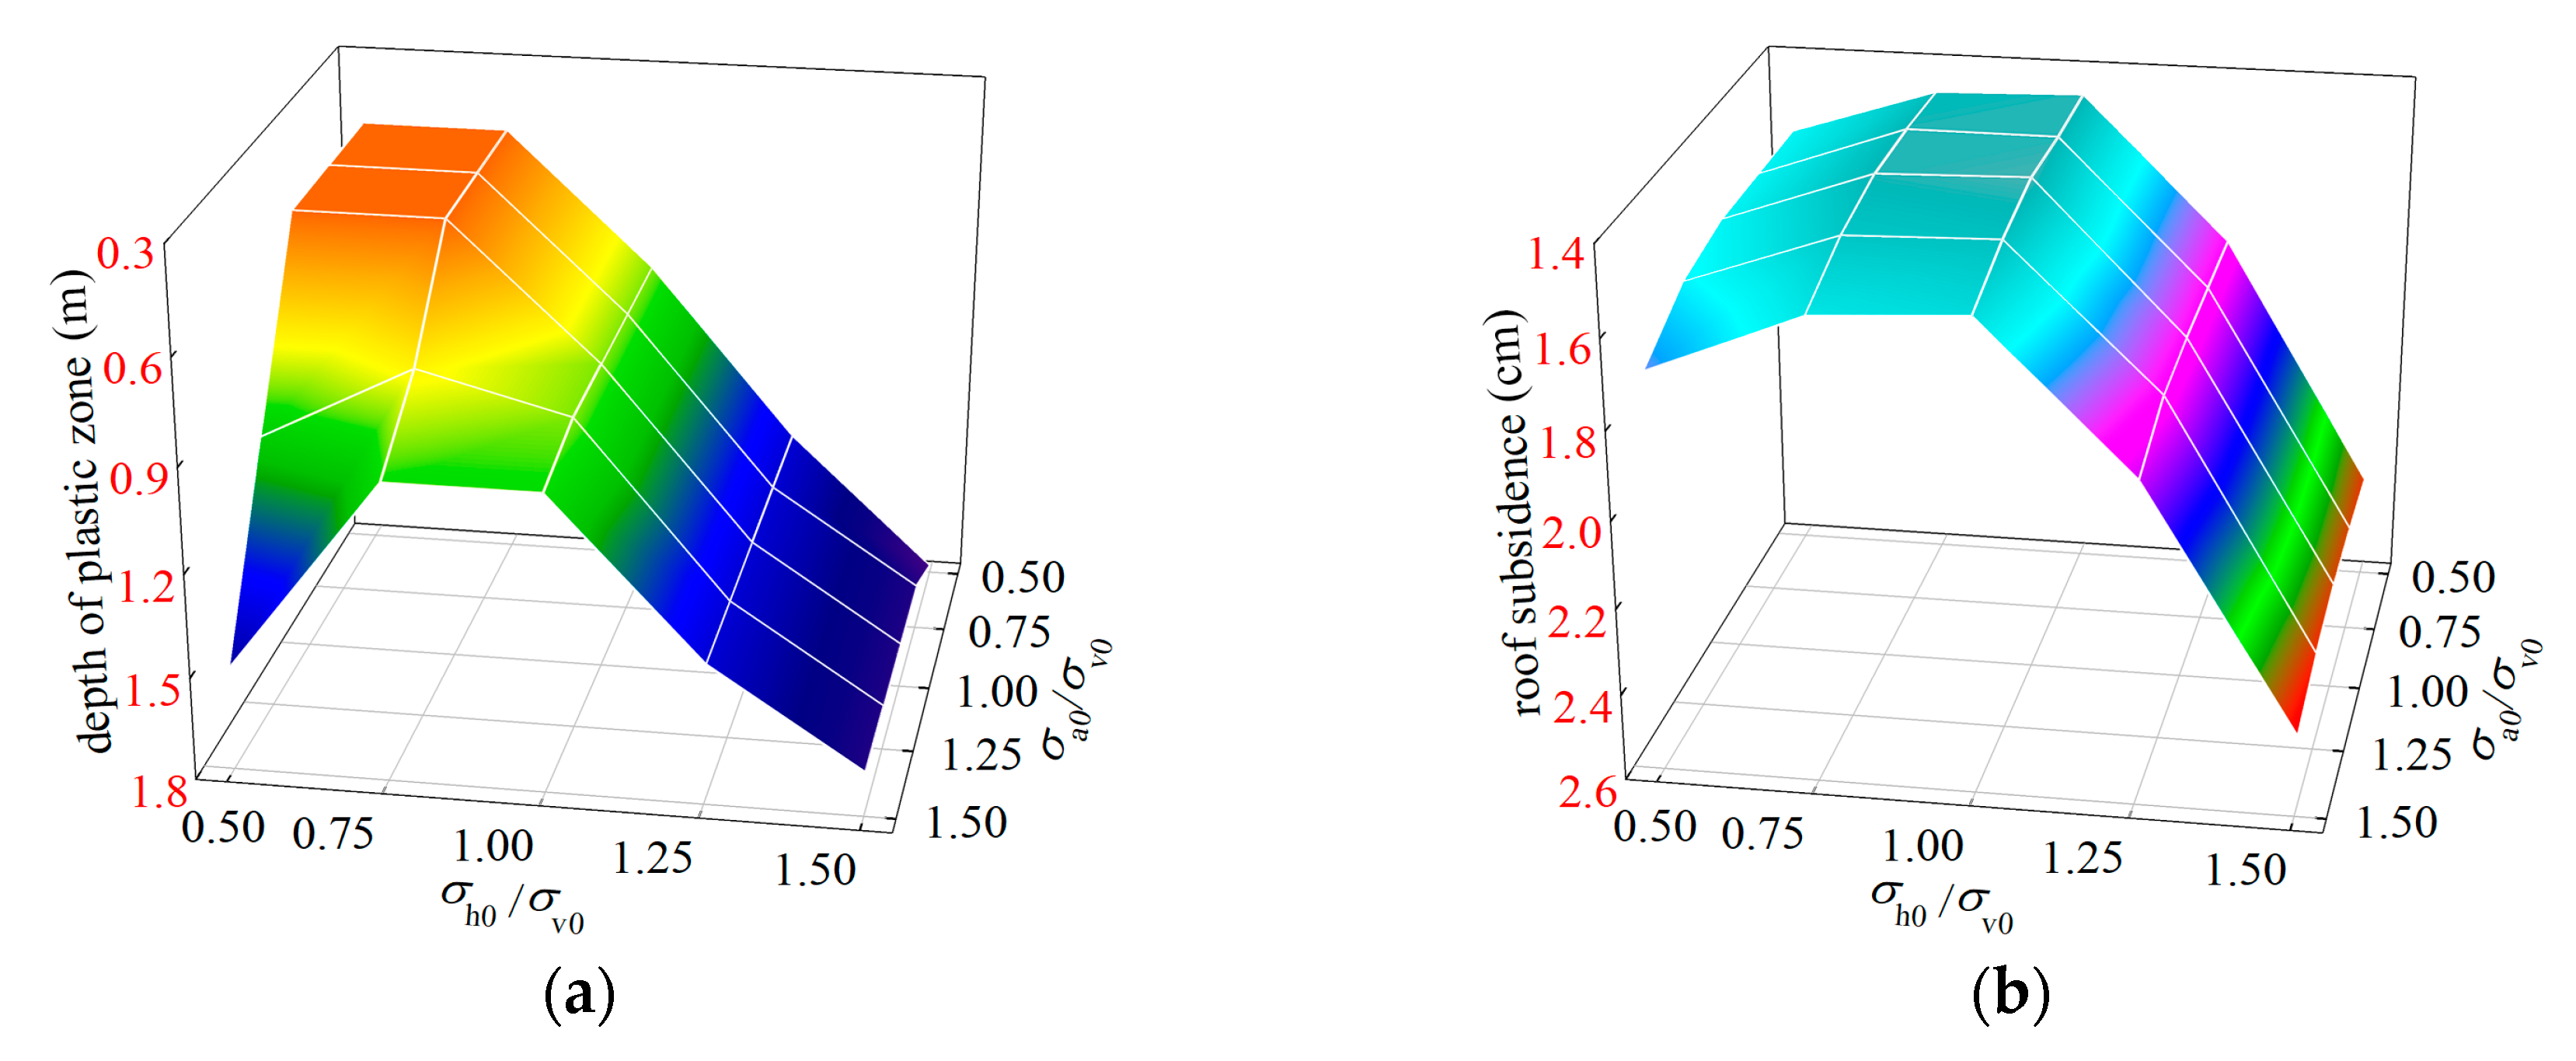
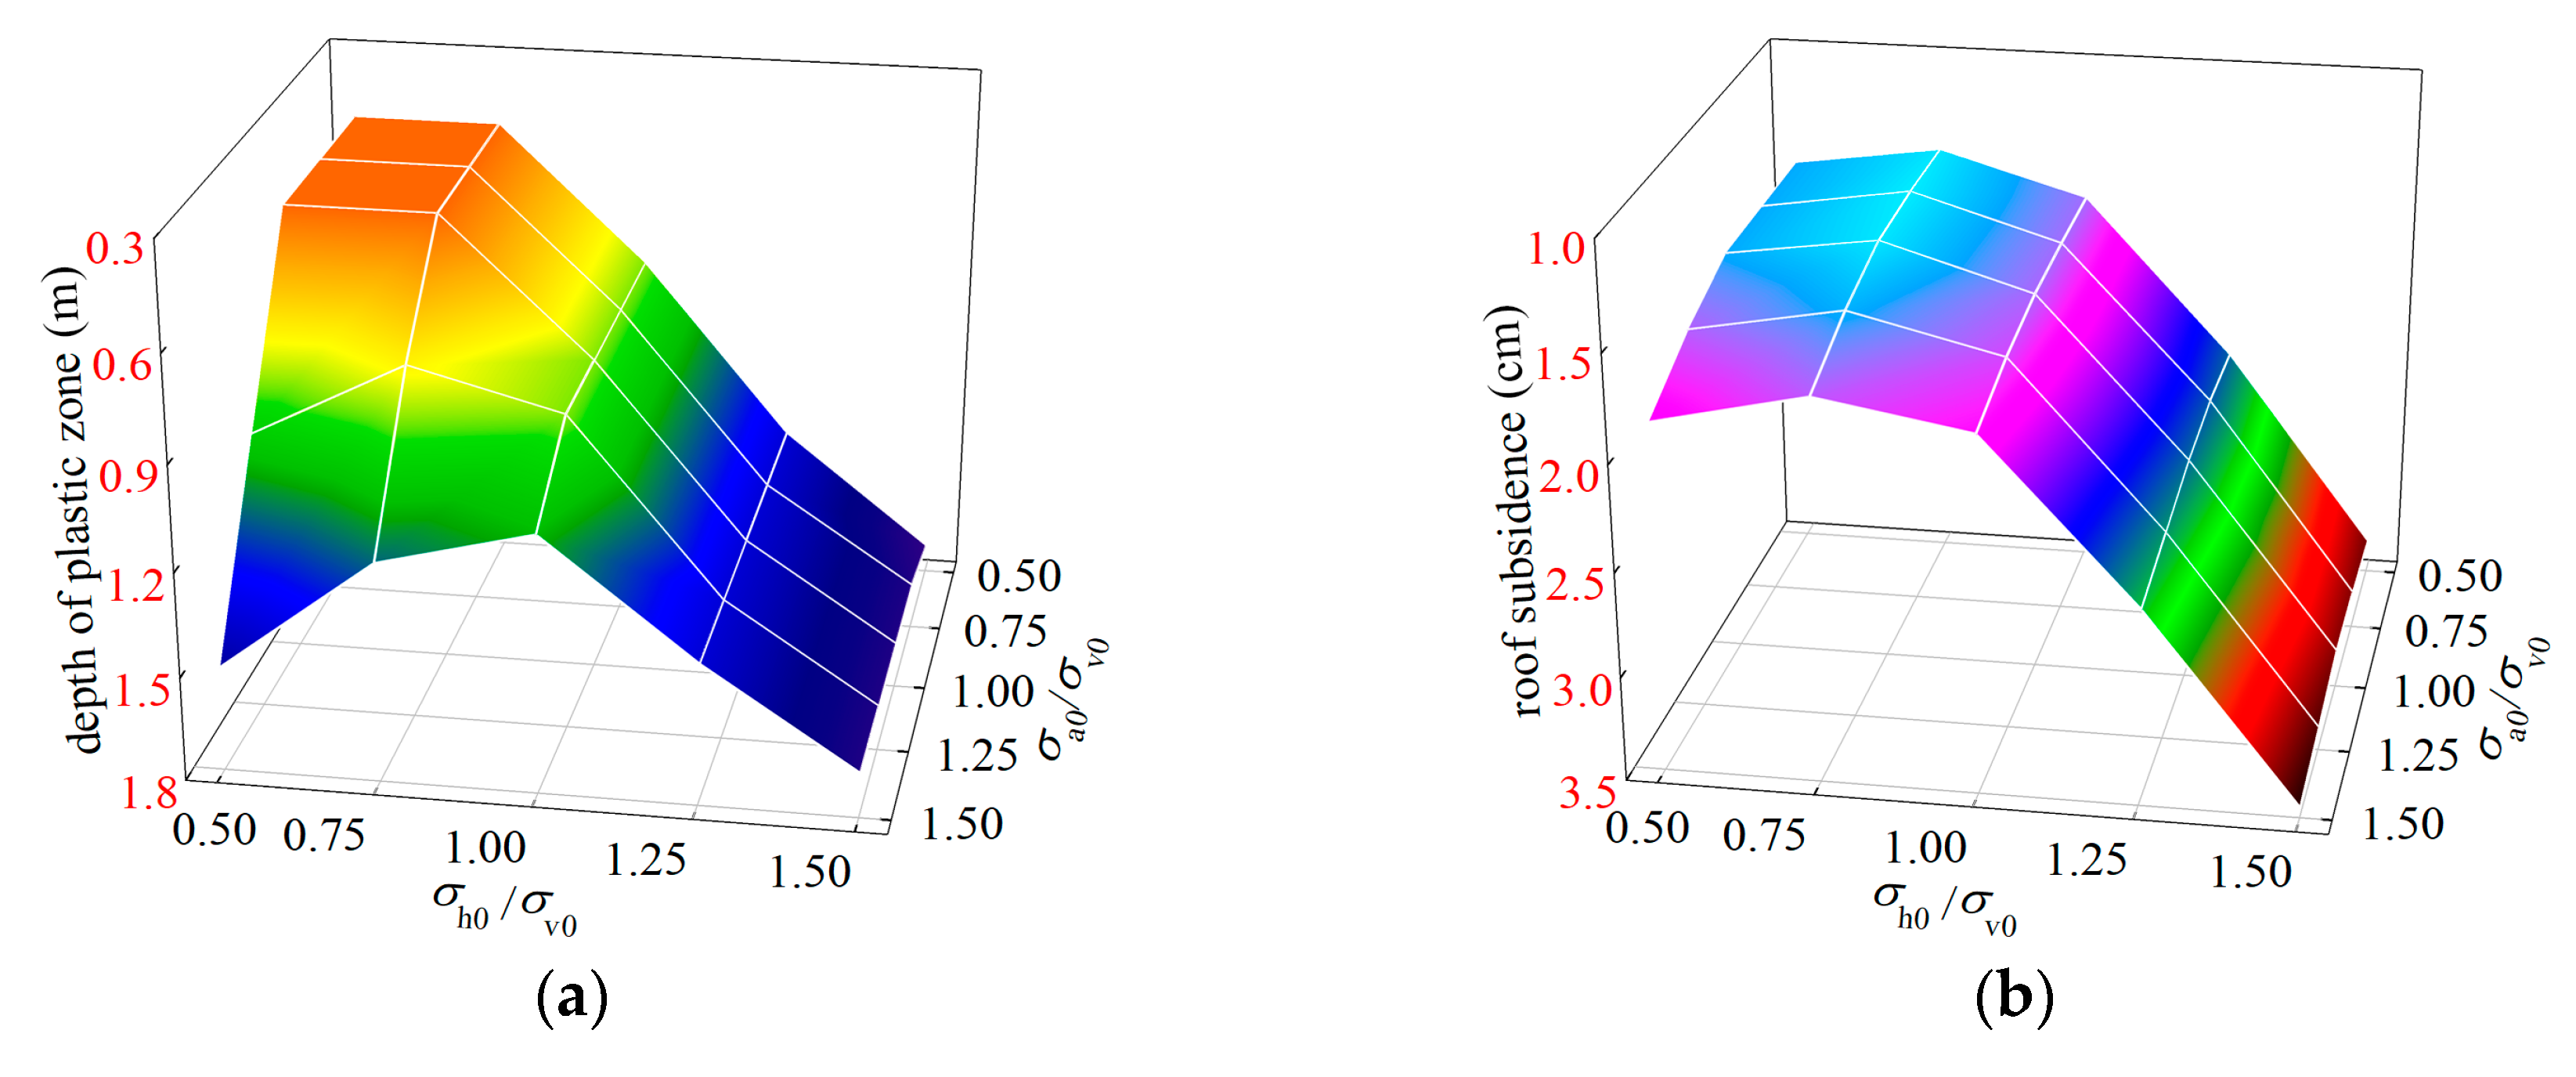
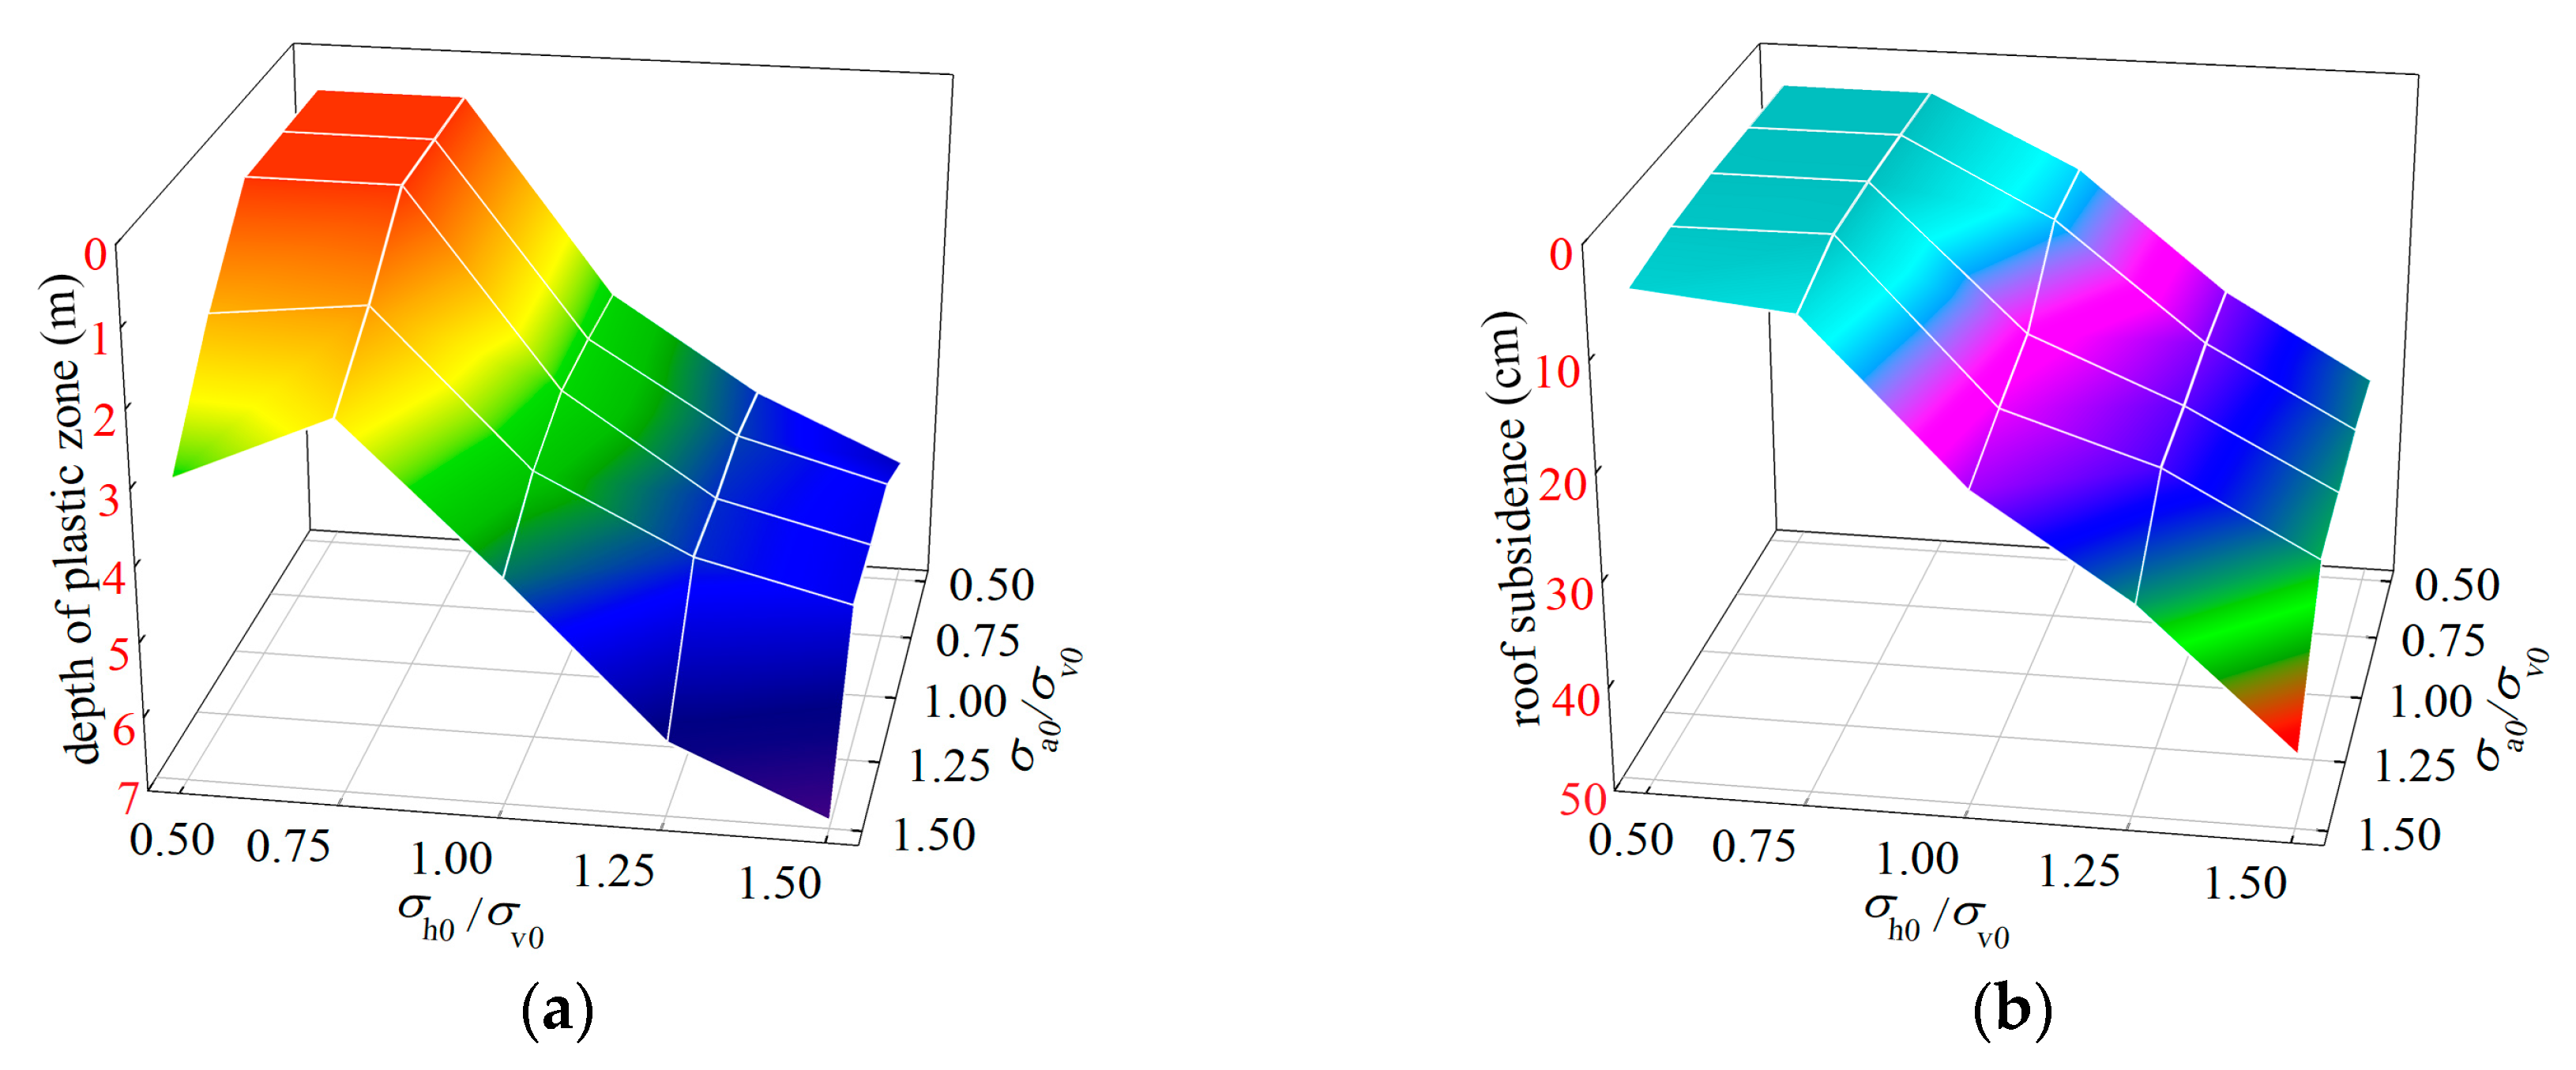
3.3. Analysis of the Roof Subsidence and Plastic Zone Depth

The precision of the maximum plastic zone depth is restricted by the mesh size, so this index is not adopted, and the following statistical method is used to characterize the plastic zone depth to improve the precision: the maximum depth d of the plastic zone of the roof and the corresponding grid number nd are recorded; the roof width w and the corresponding grid number nw are recorded; the total number n of plastic zone grids within the d × w area is counted; the plastic zone depth is calculated from d(n/ndnw). The roof subsidence is directly read in FLAC3D. The results are shown in Figure 7, Figure 8, Figure 9 and Figure 10.
For the perfectly elastoplastic model, when σh0/σv0 ≤ 0.75 and σa0/σv0 > 1.00, the plastic zone depth increases rapidly with an increase in σa0, indicating that σa is σ1 at the initial yield and controls the failure of the surrounding rock; when σh0/σv0 = 1.50 and σa0/σv0 < 1.00, a decrease in σa0 slightly increases the plastic zone depth, indicating that σa is σ3 at the initial yield and also controls the failure, which is consistent with the conclusion of Section 2.2. An increase in σa0 slightly increases the roof subsidence only when σh0/σv0 = 0.5 and σa0/σv0 > 1.00; the other schemes have little effect. In addition, the plastic zone depths are shallow, and the maximum plastic zone depth is only 1.78 m; the roof subsidence results are very small, and the maximum roof subsidence is only 2.41 cm, which is inconsistent with the observed severe failure and large deformation of the surrounding rock of deep tunnels [2,34].
When considering only dilatancy, the variations in the plastic zone depth and roof subsidence are similar to those of the perfectly elastoplastic model, but the effect of σa0 on the roof subsidence is more obvious, which is consistent with the conclusions of Section 2.2, Figure 4b and Equation (8). In addition, the plastic zone depths exhibit little change compared with that of the perfectly elastoplastic model, with a maximum of 1.72 m; the roof subsidence results increase compared with that of the perfectly elastoplastic model, but the results are still very small, with a maximum of 3.45 cm.
When considering only strain softening, except for the magnitude of values, the variation in the plastic zone depth is similar to that under the above two conditions. The effect of σa0 on roof subsidence is more significant than that under the above two conditions. When σh0/σv0 ≥ 1.00, an increase in σa0 significantly increases the roof subsidence, which is caused by the 3D plastic flow partly controlled by σa, consistent with the conclusions of Section 2.2, Figure 4c and Equation (9). In addition, the plastic zone depth and roof subsidence results increase significantly compared with those under the above two conditions, with maxima of 5.28 m and 16.92 cm, respectively.
When considering both strain softening and dilatancy, except for the magnitude of values, the variation in the plastic zone depth is similar to those under the above three conditions. The effect of σa0 on roof subsidence is more significant than that considering only strain softening. When σh0/σv0 ≥ 1.00, an increase in σa0 significantly increases the roof subsidence, and the larger σh0/σv0 and σa0/σv0 are, the more significant the effect, which is consistent with the conclusions of Section 2.2, Figure 4d and Equation (10). In addition, the plastic zone depth and roof subsidence results further increase compared with those considering only strain softening, with maxima of 6.89 m and 42.91 cm, respectively, which is more consistent with reality [2,34].

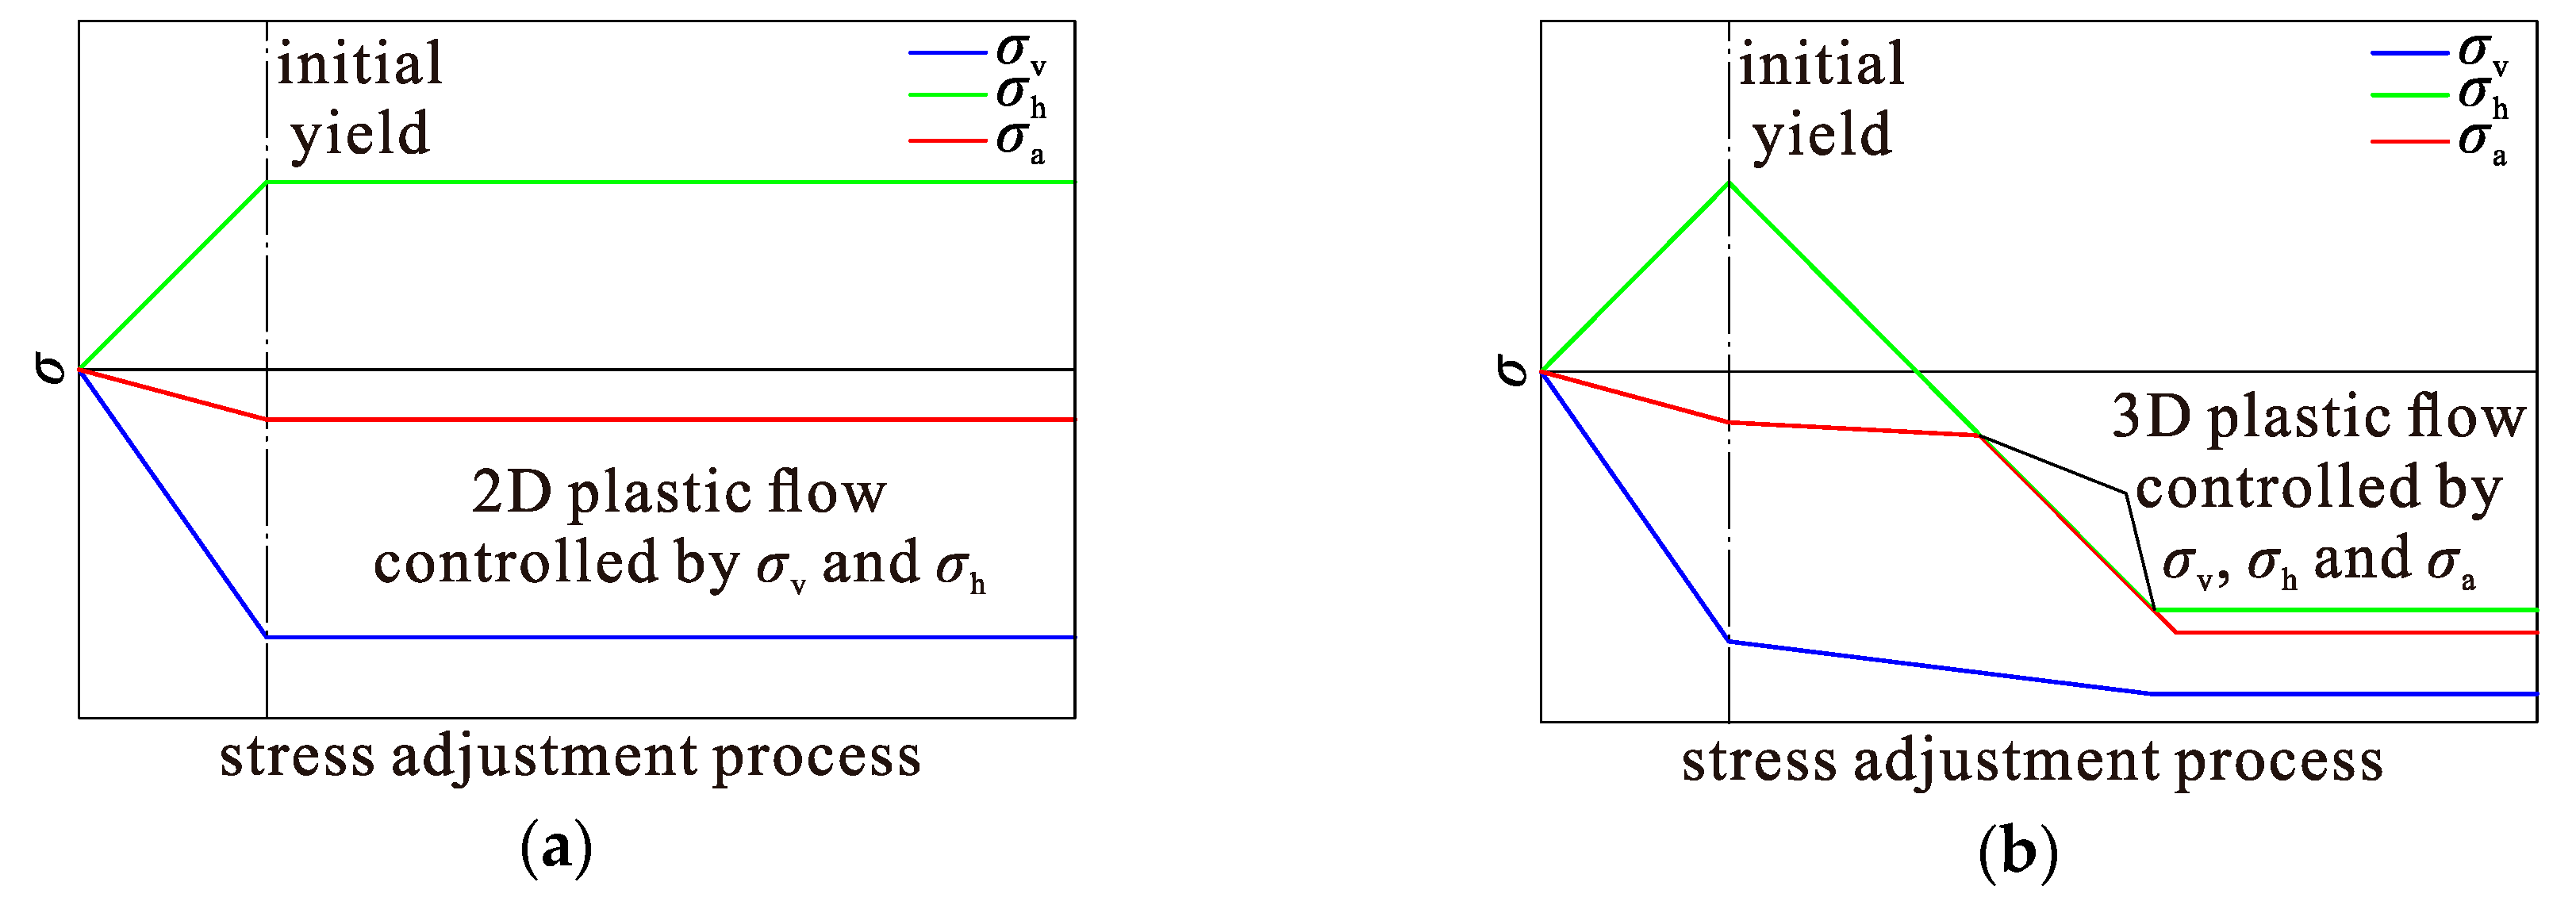
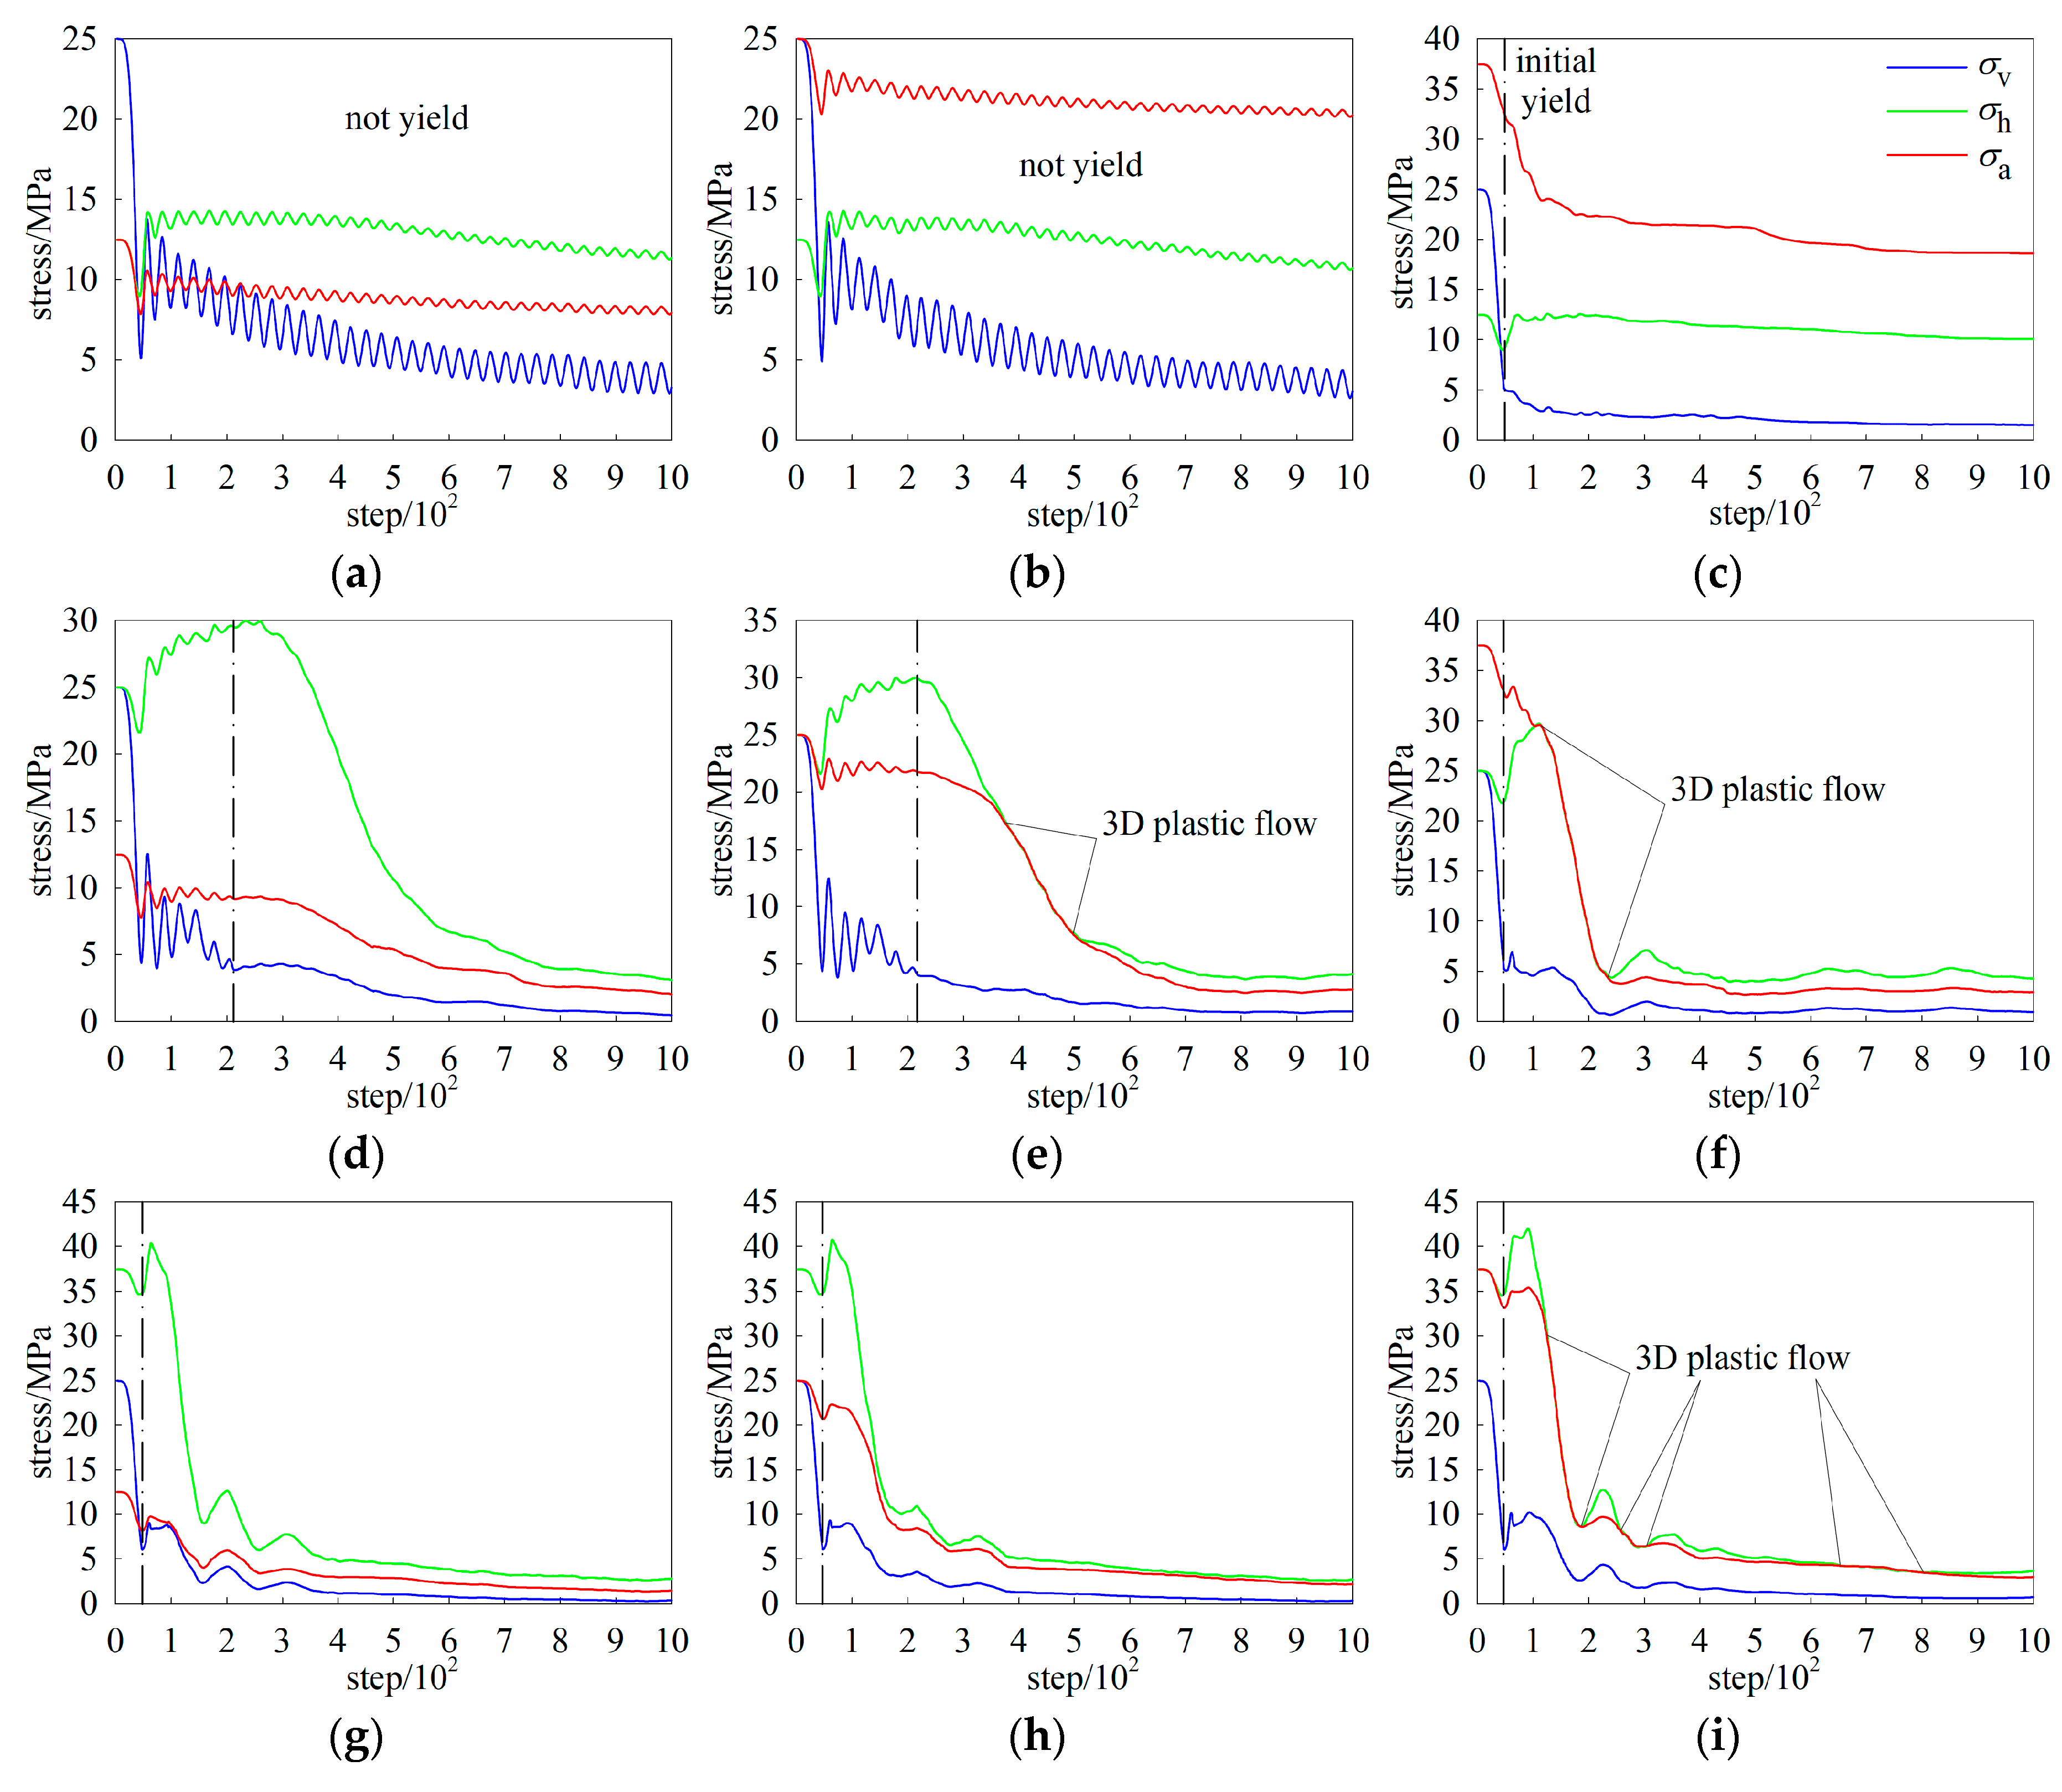
3.4. Analysis of the Stress Adjustment Process

To prove the existence of 3D plastic flow and analyze the conditions under which it occurs, considering the objective post-peak behavior of the surrounding rock, namely, its strain softening and dilatancy, the stress adjustment process is analyzed via numerical simulation. The principal stresses at the middle of the roof with a depth of 1.25 m (where the radial strain is large) are monitored. For the nine schemes where σh0/σv0 = 0.50, 1.00 and 1.50 and σa0/σv0 = 0.50, 1.00 and 1.50, the monitoring results are shown in Figure 11. Since the criterion of model equilibrium is that the maximum unbalanced force is less than a specific ratio, the calculation steps are different when each scheme reaches equilibrium (the nine schemes take 3191–5201 steps to reach equilibrium). The first 1000 steps during which the principal stresses vary dramatically are selected for analysis. FLAC3D adopts the dynamic relaxation method [32]. Nodes of a model move under the action of the unbalanced force and are damped in proportion to the magnitude of the unbalanced force, which dissipates the excess energy and tends to equilibrate the model. In the elastic stage, the nodes oscillate under the action of the unbalanced force and damping, which leads to the drastic variations of the strain components of zones of the model, and then leads to the large wavy patterns of the stress curves of the zones. In the plastic stage, the stresses of the zones are controlled by the yield criterion, resulting in the stress curves wave only slightly. If the zone at the measuring point does not yield, as shown in Figure 11a,b, the zone is in the elastic stage during the whole simulation process, thus the stress curves of the zone wave significantly. The built-in Fish keyword is adopted to monitor the plastic state of the measuring point. The stress curves are used to identify the plastic flow regime. If σa = σh > σv, 3D plastic flow occurs, otherwise 2D plastic flow occurs.
At the middle of the roof, σv is σr, and σh is σt. According to Figure 11, σa is generally not σ3 at the initial yield of the surrounding rock. When σa0 is much lower than σh0, σa is always σ2 in the yield stage, and σa0 has little effect on the results. When σa0 is close to σh0, according to Figure 11e,i, σa is σ2 at the initial yield, but σa = σh > σv (σ1 = σ2 > σ3) later, resulting in 3D plastic flow, and combining this finding with Figure 10b, it can be seen that the roof subsidence suddenly increases. When σa0 is significantly greater than σh0 (1.5 times), according to Figure 11f, σa is σ1 at the initial yield, but σa = σh > σv later, resulting in 3D plastic flow, and combining this finding with Figure 10b, it can be seen that the roof subsidence further increases. When σa0 is much larger than σh0 (three times), σa is always σ1 in the yield stage, 3D plastic flow no longer occurs, and the roof subsidence remains small; however, according to the field monitoring data of the in-situ stresses and the surrounding rock displacements of many deep tunnels [27,34], such an in-situ stress state rarely exists in deep areas.

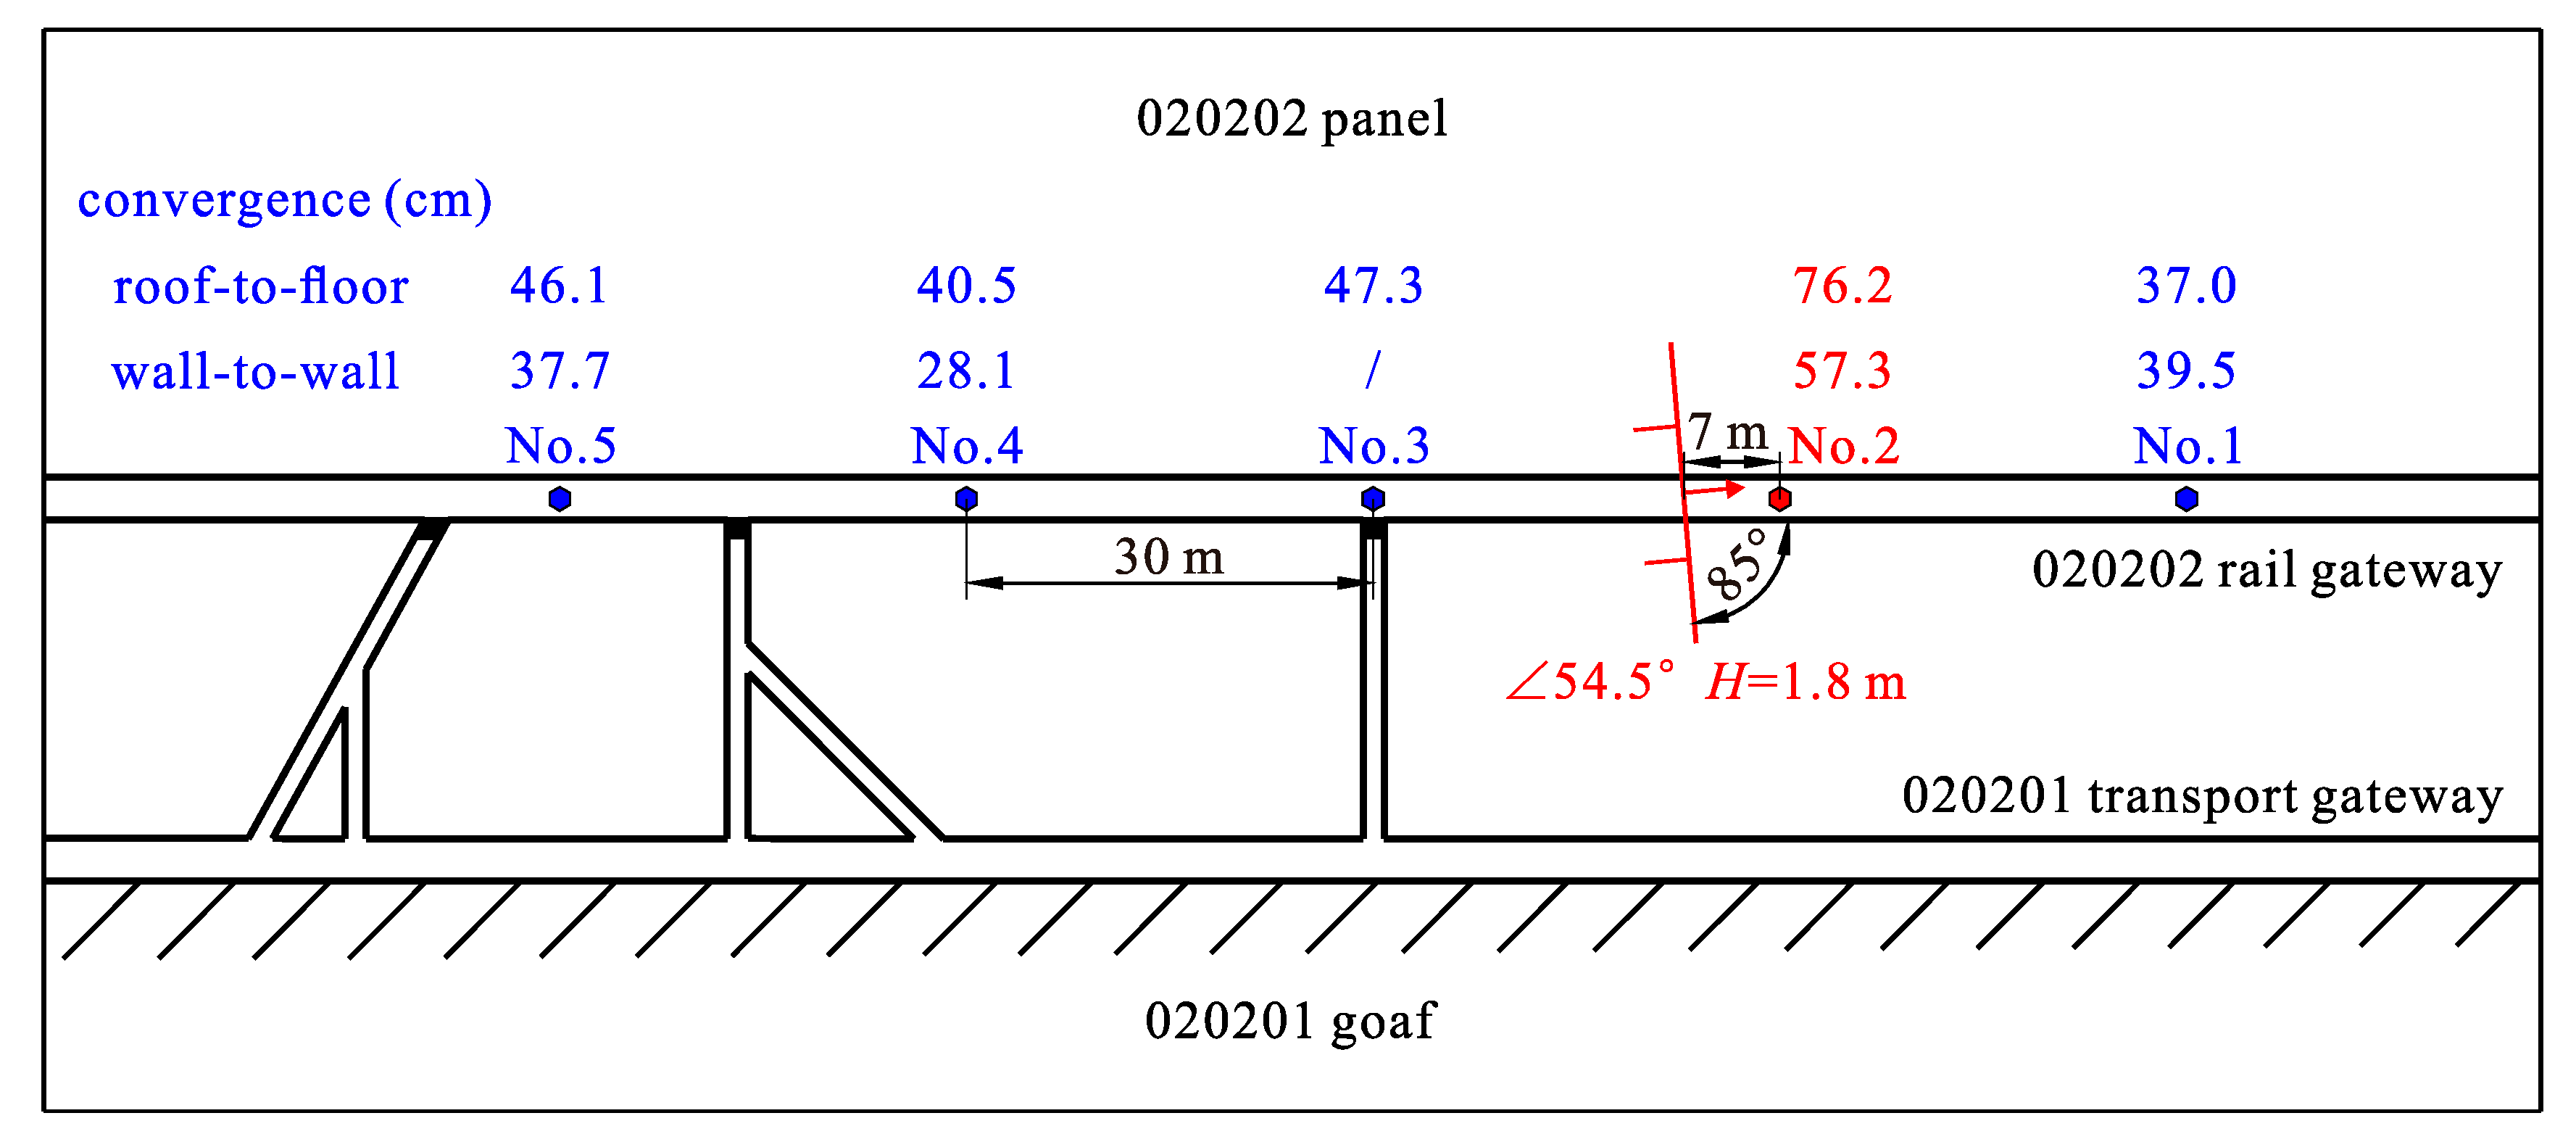
4. Verification via Field Monitoring Data

To exclude other influencing factors, the effect of σa0 on the deep tunnel is analyzed under the ideal conditions described above. It is difficult to find the same conditions in reality, but can choose a deep tunnel nearly perpendicularly cross a reverse fault, and by comparing the displacements of the surrounding rock in the higher axial in-situ stress zone near the reverse fault (the axial in-situ stress increases and is higher than the tangential in-situ stress near a reverse fault [35]) with those in the normal zone far from the reverse fault, the results discussed above can be verified. The excavation depth of the 020202 rail gateway of the Qingyun coal mine in Shanxi Province, China, is 780 m, the roof is a medium-grained sandstone, the floor is a sandy mudstone, and the sidewall is a coal seam. The gateway is supported by a rock bolting system with a width of 4.5 m and a height of 4.3 m and nearly perpendicularly crosses a reverse fault with a dip angle of 54.5° and a throw of 1.8 m. To avoid the influence of the fracture zone of the reverse fault, the no. 2 measuring station was located 7 m from the reverse fault, and the no. 1 and no. 3–5 measuring stations were arranged far away from the reverse fault at intervals of 30 m. The displacements of the gateway were monitored, and the displacements 60 d after excavation are shown in Figure 12.
According to Figure 12, at the no. 2 measuring station in the higher axial in-situ stress zone, the roof-to-floor convergence is 76.2 cm, and the wall-to-wall convergence is 57.3 cm, significantly larger than those of 37.0–47.3 cm and 28.1–39.5 cm in the normal zone, respectively. In addition, when the excavation of the gateway reached the location of the no. 2 measuring station, no abnormality was found in the surrounding rock, but the failure of the surrounding rock at the no. 2 measuring station was significantly more severe than that at the no. 1 and no. 3–5 measuring stations 60 d after excavation. This observation verifies the results above, namely, considering the objective strain softening and dilatancy, when σa0 is close to or greater than σt0, an increase in σa0 will increase the deformation and failure of the surrounding rock of a deep tunnel. Therefore, the effect of σa0 and the strain softening and dilatancy of the surrounding rock should be considered in the deformation prediction and support design of a deep tunnel.

5. Conclusions

In this study, based on the incremental plastic flow theory, theoretical analysis and numerical simulation are adopted to analyze the effect of the axial in-situ stress σa0 on the deformation and failure of the surrounding rock of a deep tunnel considering strain softening and dilatancy, and the results are verified via field monitoring data. The following conclusions are obtained:
For the perfectly elastoplastic model, only when the axial stress σa is σ1 or σ3 at the initial yield of the surrounding rock, an increase or decrease in σa0 intensifies the failure of the surrounding rock; otherwise, σa0 has little effect on the results. When considering only dilatancy, the effect of σa0 is similar to that of the perfectly elastoplastic model. When considering only strain softening, compared with the two conditions above, the effect of σa0 is more significant when σa is σ1 or σ3 at the initial yield, and 3D plastic flow partly controlled by σa may occur when σa is σ2 at the initial yield, which leads to σa0 also having a significant effect, such that an increase in σa0 intensifies the deformation and failure of the surrounding rock. When considering both strain softening and dilatancy, the effect of σa0 is more significant than that when considering only strain softening.
When considering both strain softening and dilatancy, σa is generally not σ3 at the initial yield. When σa0 is much lower than the tangential in-situ stress σt0, σa is always σ2 in the yield stage, and σa0 has little effect on the results. When σa0 is close to σt0, σa is σ2 at the initial yield, but σ1 = σ2 > σ3 later, resulting in 3D plastic flow along an edge of the yield surface, and an increase in σa0 intensifies the deformation and failure of the surrounding rock. When σa0 is significantly greater than σt0 (1.5 times), σa is σ1 at the initial yield, but 3D plastic flow also occurs later, and the deformation and failure of the surrounding rock will be further intensified when σa0 increases.
A deep tunnel is significantly affected by the in-situ stress, and a large post-peak zone forms in the surrounding rock. In the deformation prediction and support design of a deep tunnel, the axial in-situ stress should not be ignored, and the post-peak behavior of the surrounding rock should be accurately considered.

Author Contributions

Conceptualization, K.Y.; methodology, K.Y., Z.L.; software, K.Y., Z.L.; validation, Z.L.; formal analysis, J.Z.; investigation, K.Y., S.D.; resources, J.Z.; data curation, K.Y.; writing—original draft preparation, K.Y.; writing—review and editing, Z.L.; visualization, K.Y.; supervision, Z.L.; project administration, Z.L., J.Z.; funding acquisition, Z.L., J.Z. All authors have read and agreed to the published version of the manuscript.

Funding

This research was funded by National Natural Science Foundation of China, grant numbers 51574174 and 51974319, National Key Research and Development Program of China, grant number 2017YFC0603003.

Acknowledgments

The authors would like to acknowledge anonymous reviewers for their valuable comments.

Conflicts of Interest

The authors declare no conflict of interest.

References

  1. Kang, H.; Wu, Y.; Gao, F.; Lin, J.; Jiang, P. Fracture characteristics in rock bolts in underground coal mine roadways. Int. J. Rock Mech. Min. Sci. 2013, 62, 105–112. [Google Scholar] [CrossRef]
  2. Wang, M.; Zhang, N.; Li, J.; Ma, L.; Fan, P. Computational method of large deformation and its application in deep mining tunnel. Tunn. Undergr. Space Technol. 2015, 50, 47–53. [Google Scholar] [CrossRef]
  3. Tao, M.; Hong, Z.; Peng, K.; Sun, P.; Cao, M.; Du, K. Evaluation of Excavation-Damaged Zone around Underground Tunnels by Theoretical Calculation and Field Test Methods. Energies 2019, 12, 1682. [Google Scholar] [CrossRef] [Green Version]
  4. Yang, S.-Q.; Chen, M.; Jing, H.-W.; Chen, K.-F.; Meng, B. A case study on large deformation failure mechanism of deep soft rock roadway in Xin’An coal mine, China. Eng. Geol. 2017, 217, 89–101. [Google Scholar] [CrossRef]
  5. Zhang, Q.; Zhang, C.; Jiang, B.; Li, N.; Wang, Y. Elastoplastic Coupling Solution of Circular Openings in Strain-Softening Rock Mass Considering Pressure-Dependent Effect. Int. J. Geomech. 2018, 18. [Google Scholar] [CrossRef]
  6. Cui, L.; Zheng, J.-J.; Dong, Y.-K.; Zhang, B.; Wang, A. Prediction of critical strains and critical support pressures for circular tunnel excavated in strain-softening rock mass. Eng. Geol. 2017, 224, 43–61. [Google Scholar] [CrossRef]
  7. Song, L.; Li, H.-Z.; Chan, C.L.; Low, B.K. Reliability analysis of underground excavation in elastic-strain-softening rock mass. Tunn. Undergr. Space Technol. 2016, 60, 66–79. [Google Scholar] [CrossRef]
  8. Lu, A.-Z.; Xu, G.-S.; Sun, F.; Sun, W.-Q. Elasto-plastic analysis of a circular tunnel including the effect of the axial in situ stress. Int. J. Rock Mech. Min. Sci. 2010, 47, 50–59. [Google Scholar] [CrossRef]
  9. Wang, S.; Wu, Z.; Guo, M.; Ge, X. Theoretical solutions of a circular tunnel with the influence of axial in situ stress in elastic-brittle-plastic rock. Tunn. Undergr. Space Technol. 2012, 30, 155–168. [Google Scholar] [CrossRef]
  10. Guan, K.; Zhu, W.; Wei, J.; Liu, X.; Niu, L.; Wang, X. A finite strain numerical procedure for a circular tunnel in strain-softening rock mass with large deformation. Int. J. Rock Mech. Min. Sci. 2018, 112, 266–280. [Google Scholar] [CrossRef]
  11. Alejano, L.R.; Alonso, E. Considerations of the dilatancy angle in rocks and rock masses. Int. J. Rock Mech. Min. Sci. 2005, 42, 481–507. [Google Scholar] [CrossRef]
  12. Cai, M.; Kaiser, P.K.; Tasaka, Y.; Minami, M. Determination of residual strength parameters of jointed rock masses using the GSI system. Int. J. Rock Mech. Min. Sci. 2007, 44, 247–265. [Google Scholar] [CrossRef]
  13. Cai, M.; Kaiser, P.K.; Uno, H.; Tasaka, Y.; Minami, M. Estimation of rock mass deformation modulus and strength of jointed hard rock masses using the GSI system. Int. J. Rock Mech. Min. Sci. 2004, 41, 3–19. [Google Scholar] [CrossRef]
  14. Hoek, E.; Brown, E.T. Practical estimates of rock mass strength. Int. J. Rock Mech. Min. Sci. 1997, 34, 1165–1186. [Google Scholar] [CrossRef]
  15. Hoek, E.; Diederichs, M.S. Empirical estimation of rock mass modulus. Int. J. Rock Mech. Min. Sci. 2006, 43, 203–215. [Google Scholar] [CrossRef]
  16. Zhao, X.G.; Cai, M.F.; Cai, M. Considerations of rock dilation on modeling failure and deformation of hard rocks: A case study of the mine-by test tunnel in Canada. J. Rock Mech. Geotech. Eng. 2010, 2, 338–349. [Google Scholar]
  17. Zhao, X.G.; Cai, M. Influence of plastic shear strain and confinement-dependent rock dilation on rock failure and displacement near an excavation boundary. Int. J. Rock Mech. Min. Sci. 2010, 47, 723–738. [Google Scholar] [CrossRef]
  18. Meng, Q.; Chen, Y.; Zhang, M.; Han, L.; Pu, H.; Liu, J. On the Kaiser Effect of Rock under Cyclic Loading and Unloading Conditions: Insights from Acoustic Emission Monitoring. Energies 2019, 12, 3255. [Google Scholar] [CrossRef] [Green Version]
  19. Arzua, J.; Alejano, L.R. Dilation in granite during servo-controlled triaxial strength tests. Int. J. Rock Mech. Min. Sci. 2013, 61, 43–56. [Google Scholar] [CrossRef]
  20. Arzua, J.; Alejano, L.R.; Walton, G. Strength and dilation of jointed granite specimens in servo-controlled triaxial tests. Int. J. Rock Mech. Min. Sci. 2014, 69, 93–104. [Google Scholar] [CrossRef]
  21. Pérez-Rey, I.; Alejano, L.R.; Alonso, E.; Arzúa, J.; Araújo, M. An Assessment of the Post-peak Strain Behavior of Laboratory Intact Rock Specimens Based on Different Dilation Models. Procedia Eng. 2017, 191, 394–401. [Google Scholar] [CrossRef]
  22. Lin, P.; Liu, H.; Zhou, W. Experimental study on failure behaviour of deep tunnels under high in-situ stresses. Tunn. Undergr. Space Technol. 2015, 46, 28–45. [Google Scholar] [CrossRef]
  23. Paterson, M.S.; Olgaard, D.L. Rock deformation tests to large shear strains in torsion. J. Struct. Geol. 2000, 22, 1341–1358. [Google Scholar] [CrossRef]
  24. Yi, K.; Kang, H.; Ju, W.; Liu, Y.; Lu, Z. Synergistic effect of strain softening and dilatancy in deep tunnel analysis. Tunn. Undergr. Space Technol. 2020, 97, 103280. [Google Scholar] [CrossRef]
  25. Wang, F.; Qian, D. Difference solution for a circular tunnel excavated in strain-softening rock mass considering decayed confinement. Tunn. Undergr. Space Technol. 2018, 82, 66–81. [Google Scholar] [CrossRef]
  26. Ghanbarian, B.; Lake, L.W.; Sahimi, M. Insights into rock typing: A Critical Study. SPE J. 2019, 24, 230–242. [Google Scholar] [CrossRef]
  27. Kang, H.; Yi, B.; Gao, F.; Lu, H. Database and characteristics of underground in-situ stress distribution in Chinese coal mines. J. China Coal Soc. 2019, 44, 23–33. [Google Scholar]
  28. Cai, W.; Dou, L.; Ju, Y.; Cao, W.; Yuan, S.; Si, G. A plastic strain-based damage model for heterogeneous coal using cohesion and dilation angle. Int. J. Rock Mech. Min. Sci. 2018, 110, 151–160. [Google Scholar] [CrossRef]
  29. Zou, J.-F.; He, Z. Numerical approach for strain-softening rock with axial stress. Proc. Inst. Civ. Eng. Geotec. 2016, 169, 276–290. [Google Scholar] [CrossRef]
  30. Pourhosseini, O.; Shabanimashcool, M. Development of an elasto-plastic constitutive model for intact rocks. Int. J. Rock Mech. Min. Sci. 2014, 66, 1–12. [Google Scholar] [CrossRef]
  31. Vermeer, P.A. Non-Associated Plasticity for Soils, Concrete and Rock. In Physics of Dry Granular Media; Herrmann, H.J., Hovi, J.P., Luding, S., Eds.; Springer: Dordrecht, The Netherlands, 1998; pp. 163–196. [Google Scholar]
  32. Itasca Inc. FLAC3D: Fast Lagrangian Analysis of Continua in 3 Dimension. Version 5.01; Itasca Inc.: Minneapolis, MN, USA, 2012. [Google Scholar]
  33. Walton, G.; Diederichs, M.S.; Alejano, L.R.; Arzúa, J. Verification of a laboratory-based dilation model for in situ conditions using continuum models. J. Rock Mech. Geotech. Eng. 2014, 6, 522–534. [Google Scholar] [CrossRef] [Green Version]
  34. Kang, H.; Fan, M.; Gao, F.; Zhang, H. Deformation and support of rock roadway at depth more than 1000 meters. Chin. J. Rock Mech. Eng. 2015, 34, 2227–2241. [Google Scholar]
  35. Lu, Y.; Cheng, Y.; Ge, Z.; Cheng, L.; Zuo, S.; Zhong, J. Determination of Fracture Initiation Locations during Cross-Measure Drilling for Hydraulic Fracturing of Coal Seams. Energies 2016, 9, 358. [Google Scholar] [CrossRef] [Green Version]
Figure 1. A rectangular tunnel and the in-situ stresses.
Energies 13 01502 g001
Figure 2. Stress adjustment and plastic flow of a microunit at the middle of the tunnel roof: (a) perfectly elastoplastic model and (b) considering strain softening.
Energies 13 01502 g002
Figure 3. 2D plastic flow and 3D plastic flow.
Energies 13 01502 g003
Figure 4. Plastic principal strain increments of the microunit at the middle of the tunnel roof: (a) perfectly elastoplastic model, (b) considering only dilatancy, (c) considering only strain softening, and (d) considering both strain softening and dilatancy.
Energies 13 01502 g004
Figure 5. Main calculation steps of the constitutive model.
Energies 13 01502 g005
Figure 6. Model size and mesh.
Energies 13 01502 g006
Figure 7. Results of the perfectly elastoplastic model: (a) roof plastic zone depth and (b) roof subsidence.
Energies 13 01502 g007
Figure 8. Results considering only dilatancy: (a) roof plastic zone depth, and (b) roof subsidence.
Energies 13 01502 g008
Figure 9. Results considering only strain softening: (a) roof plastic zone depth and (b) roof subsidence.
Energies 13 01502 g009
Figure 10. Results considering both strain softening and dilatancy: (a) roof plastic zone depth and (b) roof subsidence.
Energies 13 01502 g010
Figure 11. Monitoring results of the principal stresses: (a) σh0/σv0 = 0.50, σa0/σv0 = 0.50, (b) σh0/σv0 = 0.50, σa0/σv0 = 1.00, (c) σh0/σv0 = 0.50, σa0/σv0 = 1.50, (d) σh0/σv0 = 1.00, σa0/σv0 = 0.50, (e) σh0/σv0 = 1.00, σa0/σv0 = 1.00, (f) σh0/σv0 = 1.00, σa0/σv0 = 1.50, (g) σh0/σv0 = 1.50, σa0/σv0 = 0.50, (h) σh0/σv0 = 1.50, σa0/σv0 = 1.00, and (i) σh0/σv0 = 1.50, σa0/σv0=1.50.
Energies 13 01502 g011
Figure 12. Displacements of the 020202 rail gateway 60 d after excavation.
Energies 13 01502 g012

