1. Introduction
The modern aerospace industry is facing challenges in terms of improving emissions, fuel economy, and also cost. The US National Aeronautics and Space Administration (NASA) has laid out ambitious goals for NO
x emissions and fuel consumption for the next three generations of subsonic aircraft, namely N + 1, N + 2, and N + 3 [
1,
2]. These goals are given in
Table 1. The more electric aircraft (MEA) architecture is the state-of-the-art technology that was developed to address those challenges. The reduction of the total full consumption is about 3% [
3]. However, such performance is far behind the targets. The essential reason is that, in one typical large commercial aircraft such as Boeing 777, 95% of jet fuel is used for generating propulsion thrust [
4]. Hence, a radical propulsion system design is required to meet the abovementioned goals.
The so-called turboelectric distributed propulsion (TeDP) concept, which is now intensely investigated by research agents and companies such as NASA and Airbus [
1,
5], is considered as the key to meeting those goals. Under this concept, electric generators driven by gas turbine engines supply electrical power to multiple electric fans, which are distributed across the airframe to provide propulsion [
2]. The major benefit of this concept is that the separation of gas turbine engines and propulsion fans enables both components to be designed in their optimal points and operated at optimum speeds. It is anticipated that, with the application of this technology coordinated with advanced body design, the fuel consumption can be reduced by 70%.
Under the TeDP concept, the total power capacity of the electrical system onboard expands to the megawatt (MW) level. Such high power raises lots of challenges to electrical system designs. Weight is the most critical design factor for all aerospace components, which is usually evaluated with a specific power (unit: kW/kg). It was reported that 1 kg saving will save roughly 1700 t of fuel and 5400 t of CO
2 per year for all air traffic and decrease system costs by US
$1000 [
6]. Compared to traditional aircraft propulsion systems, TeDP systems require additional high-power generators, distribution cables, and motor drive systems. All these components should achieve extremely high specific power, before TeDP systems can show its significant benefits. The research summarized in [
7] showed that the traditional voltage standard of ±270 V for MEA is no longer suitable for this power rating and a higher voltage rating is preferred. In addition, the total weight of the overall electrical system can be optimized [
8].
The power electronic converters are the key to enabling components in a TeDP architecture. They realize the power conversion between AC and DC powers. The designs of power electronic converters are quite essential in aerospace electric power systems. For motor drive systems onboard, power electronic parts include two converters: one rectifier and one inverter.
In a traditional MEA architecture, a rectifier usually is realized by a passive equipment called autotransformer rectifier unit (ATRU). Schematics of typical ATRUs can be found in [
9,
10]. They essentially consist of multiwinding autotransformers plus diode rectifiers. Although ATRUs are proved to be practical in MEA architectures, its power density is rather low because of heavy autotransformers. According to the survey of some commercial products, the specific power of an ATRU is around 1.6–3.3 kW/kg, depending on the power rating [
11,
12]. In an industrial motor drive system, active front end (AFE) rectifiers are used to achieve a better-quality AC input. By eliminating the use of autotransformers, the total weight of AFE rectifiers can be potentially lower than that of ATRUs. Furthermore, AFE rectifiers can bring potential energy-back capability and recover kinetic energy in some aerospace applications such as E-taxiing [
13,
14]. Therefore, evaluation and comparison should be carried out between an AFE-rectifier-based power converter and a converter with an ATRU rectifier to show which solution is better for TeDP architectures.
On the other side, two-level (2L) converters are the classic and also the only commercial solution for motor controllers in aerospace, before the TeDP concept emerged. The major reason is that, due to low DC link voltages, 2L converters are sufficient to realize high conversion efficiency. However, following the increase of the DC link voltage rating, 2L converters are no longer suitable for TeDP applications because of their low efficiency and low power density. The comparison in [
15] showed that multilevel converters can achieve better efficiency and better power density in higher-power applications. Research activities related to topologies with three-level (3L) [
16,
17], five-level (5L) [
18], and even higher-voltage-level [
19] output were investigated. However, these researches did not compare different multilevel converter topologies with different voltage levels to show which topology is more favorable in certain applications. In addition, they did not investigate back-to-back configurations, which has more flexibility in selecting topologies on both rectifier and inverter stages. As a result, comparative work could be done to find the optimal solution based on a certain specification for aerospace applications. With the specification, an optimal design is also worth being investigated to show potential improvements that can be made compared to conventional designs.
In this paper, comparisons are made between different multilevel converter topologies. Based on the comparison results in terms of potential power density and power loss, a high-power-density power converter design for aerospace TeDP applications is demonstrated, which is named as the asymmetrical back-to-back converter topology. It utilizes a 5L converter in a rectifier stage and a 3L converter in an inverter stage. A compact triple-surface-mounted heatsink structure is designed to realize high density and manufacturable thermal management. This paper is organized as follows. In
Section 2, the specification of a motor drive system for comparison and design is given and analyzed. In
Section 3 and
Section 4, the topology evaluation and selection as well as the design for thermal solutions are demonstrated. In
Section 5, the design is verified by electrical and thermal testing, where the results of the testing are shown. A final evaluation and comparison session are given in
Section 6.
Section 7 concludes the paper.
2. Introduction of the System Specification
A high-power-rating motor drive system for aerospace applications was assumed in this paper. The specification of the drive system is defined in
Table 2. The power demand of the motor was 60 kW. Although in current MEA power systems, a 230-V AC grid is the only choice of power supply for high-power converters. However, in the near future, a 460-V AC grid becomes possible, which makes the DC link voltage up to ±400 V. With the help of this high-voltage DC link, 460-V AC motors can be selected to lower AC cable loss and decrease both cable and motor weights. According to the specification, the nominal AC currents on both the rectifier side and the motor side, the modulation index M, and the power factor were calculated, which is also shown in
Table 2. Because that a 200% overloading capability was required by the motor side, 300-A IGBT modules were selected for converters on both sides. The switching frequency was set to be 15 kHz, which is a common selection in converter design for an aerospace motor drive.
All these specifications present several challenges for the to-be-designed power electronic converter, which are listed as follows:
High power density and high efficiency: The power electronic converters are the main heavy part of the drive system. Evaluation and comparison should be carried out to show which topology is better in terms of the power modules’ size and weight. The efficiency is also important, since it also affects the size of the thermal system. On the other hand, the high temperature created by high-power losses affects the reliability of the converters.
Density of the cooling system: the additional weights of tubes and liquids make the liquid-cooling system not attractive in aerospace. Air-cooling might be the only choice. Therefore, a compact heatsink design is required to minimize the total weight of the cooling system.
Filter consideration: The weight and size of a large AC inductor on the grid side also need to be considered. In order to solve this problem, multilevel converters with higher voltage levels are preferred. The trade-off between voltage levels, filters’ sizes and weights, and total power losses require to be made.
3. Evaluation of the High-Power-Density Converter Topology
The first step to develop a high-power density converter was to select the optimal converter topology combination for a back-to-back converter. It should potentially have the highest efficiency and power density while minimizing the size and weight of the AC-side filter. In this section, a comparison between different topologies, especially different multilevel converter topologies, was made. Power losses, modules’ total sizes and weights, as well as filters’ sizes and weights, were considered.
3.1. Topology Selection Consideration
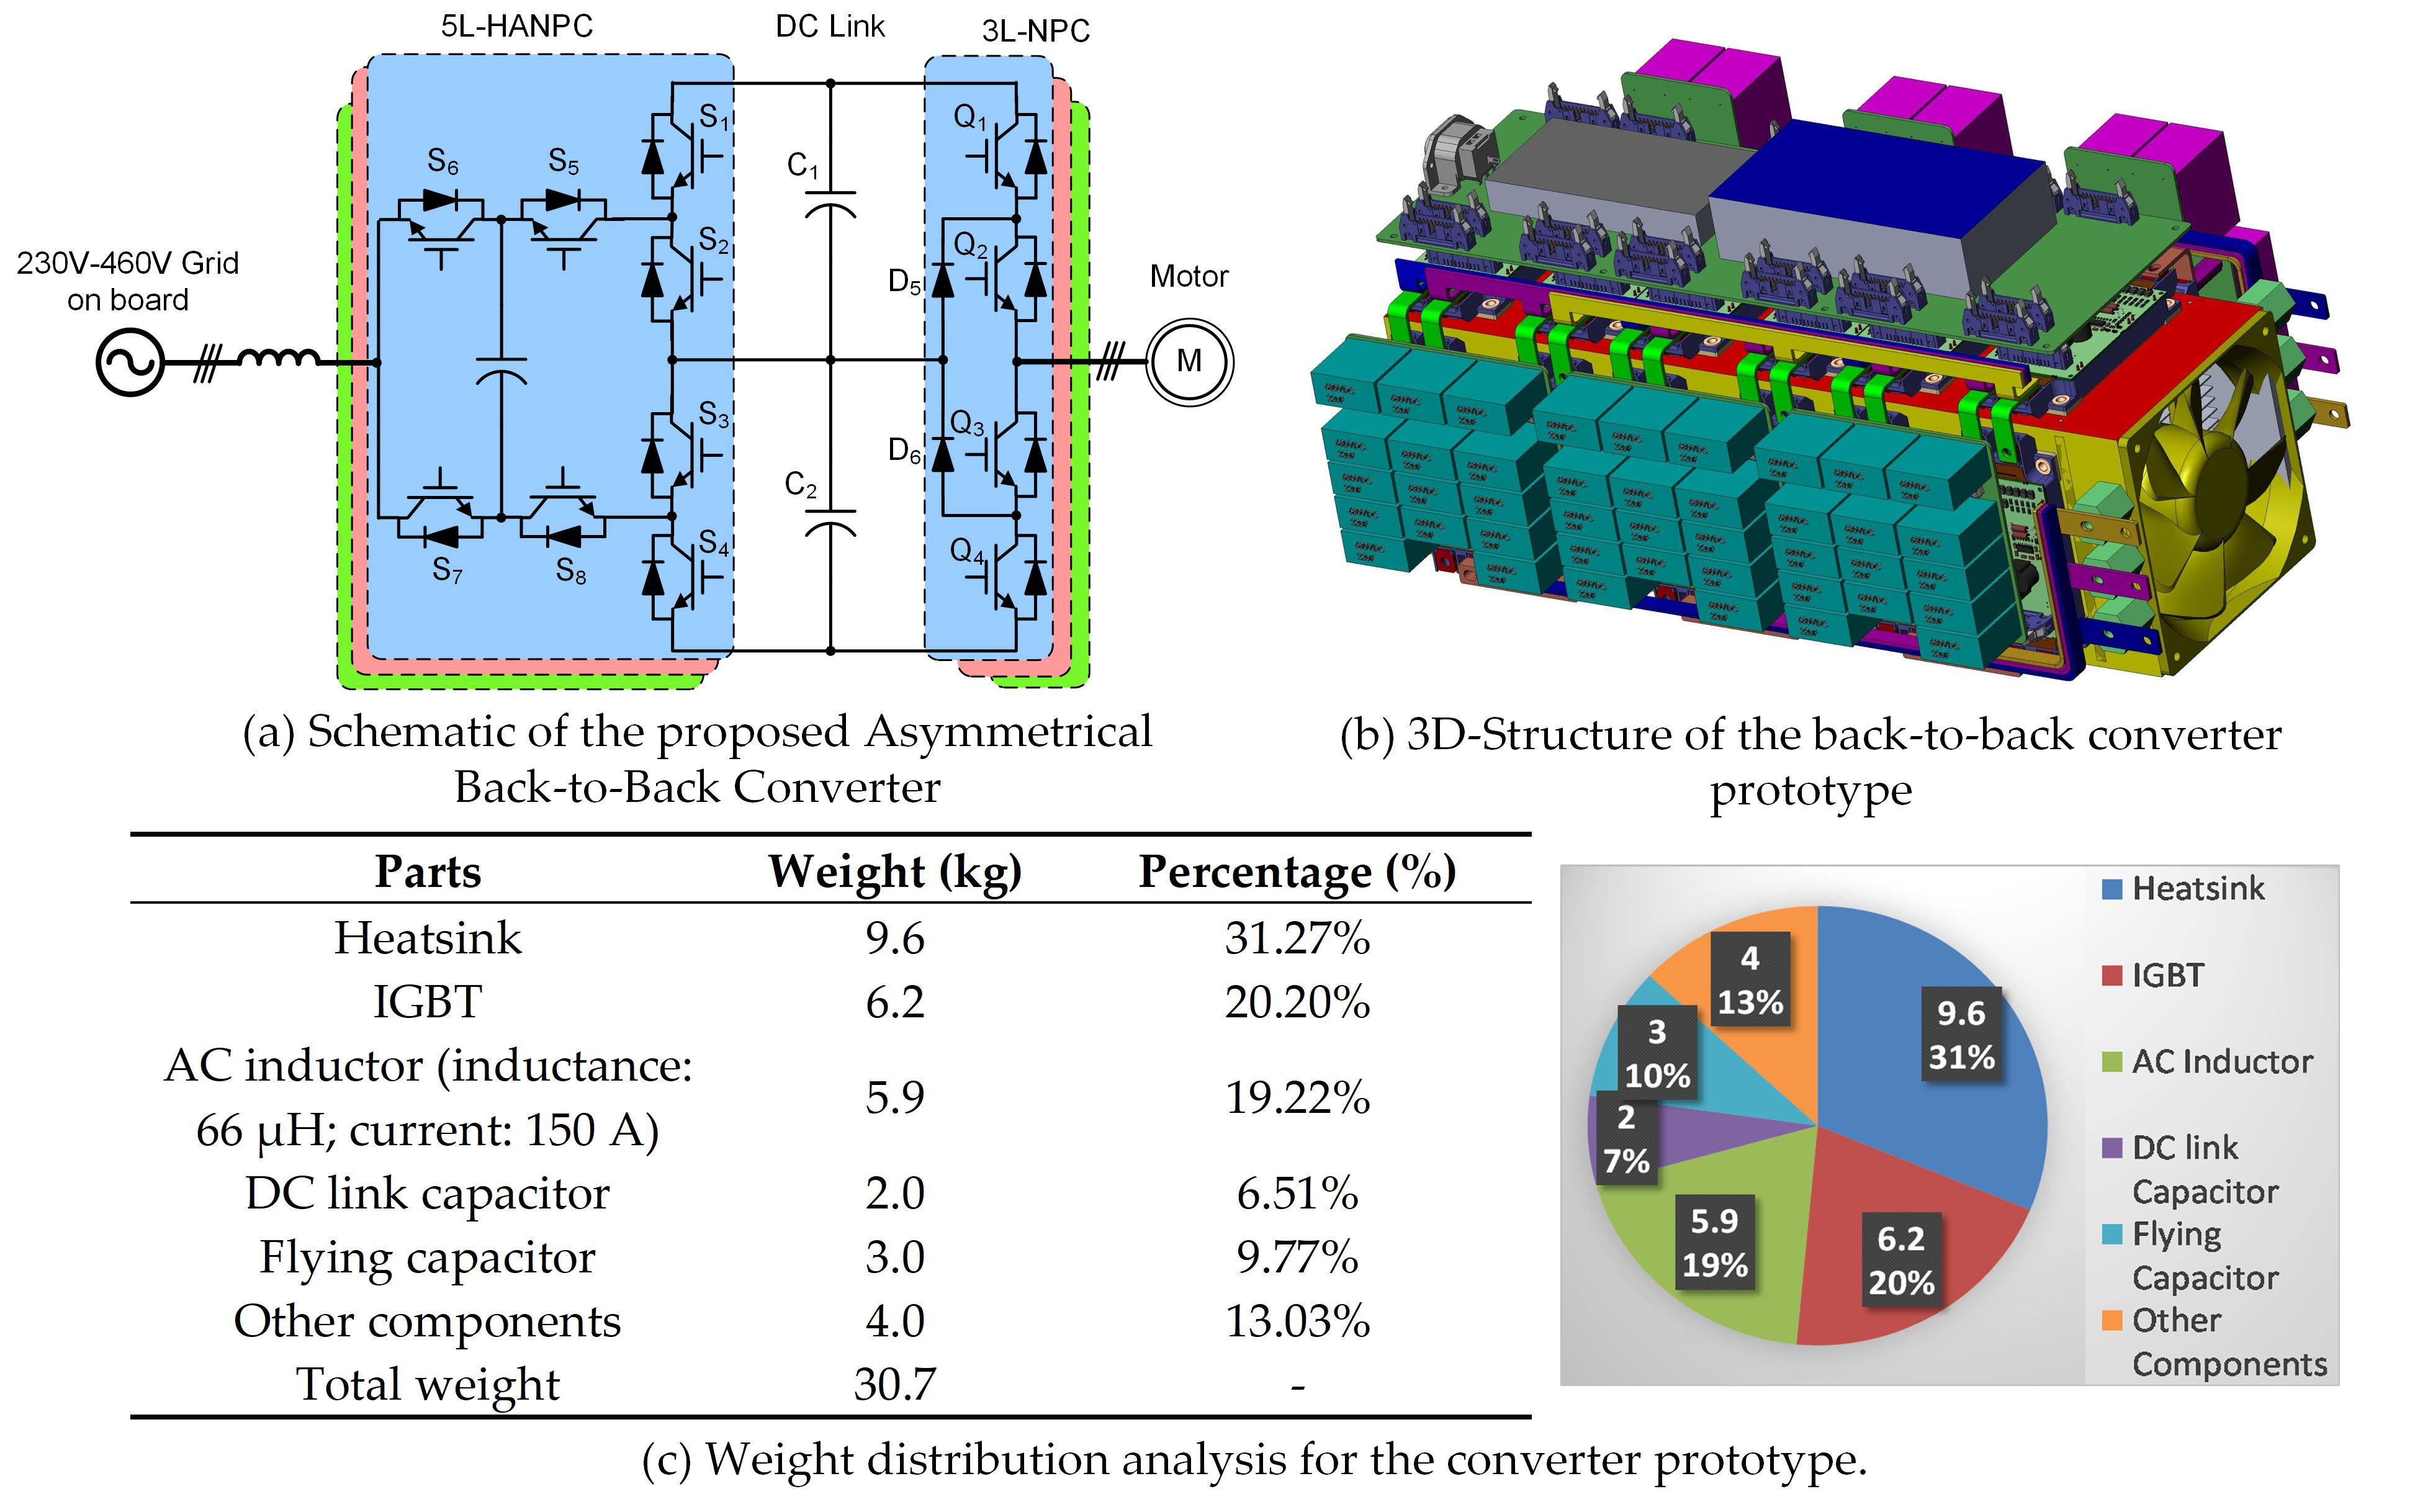
Based on the specifications, several converter topologies, including multilevel converter topologies that are common in industrial drive applications, were selected as the candidate topologies for both the rectifier and the inverter. They were the two-level voltage-source converter (2L-VSC), the two-level H-bridge voltage-source converter (2L-HB), the three-level neutral-point-clamped converter (3L-NPC), the three-level T-type converter (3L-T
2C), and the five-level hybrid active neutral-point-clamped converter (5L-HANPC). Their schematics are given in
Figure 1. Industrial drive systems based on these topologies are all mature, and products can be found such as Converteam VDM5000 (2L-VSC), Converteam MV7000 (3L-NPC), and ABB ACS 2000 (5L-HANPC) [
20]. All these topologies have the same advantage, which is that only one DC source is required for a three-phase circuit. Therefore, a back-to-back configuration at the AFE stage could be built. On the contrary, widely used medium-voltage drive topologies such as cascaded H-bridge converters require multiple isolated DC sources that use zigzag transformers to create. This will significantly increase the system total weight. Another 3L solution is the three-level flying capacitor converter (3L-FC). However, compared to the 3L-NPC, it requires additional flying capacitors, which shows no benefit in terms of total weight. The reason why we considered the 5L-HANPC is that the 5L-HANPC is the only commercially available 5L converter with a single DC source. In addition, with the 5L operation, the filter size may be smaller, and the power loss may potentially be lower.
3.2. Device Selection Consideration
After the candidate topologies were determined, IGBT modules were then selected for each topology. In order to guarantee a reliable margin in an aerospace application, a 2/3 voltage derating fact was applied to IGBT modules. It meant that the standard of selection for a ±400 V DC system in aerospace is the same as for a ±600 V DC system in an industrial drive. In other words, this system can also operate under ±600 V DCs, if insulation can be guaranteed. Based on this criterion, the voltage rating of IGBTs in each topology is marked and shown in
Figure 1.
Commercially available IGBT modules were considered. In order to guarantee a fair comparison, several types of IGBT modules from the same manufacturer were selected (Infineon in this paper). The results of the selection are given in
Table 3. According to
Table 3, with the increase of voltage level, the total number of modules to form one three-phase circuit increased. Twelve modules were required to form one three-phase 5L-HANPC circuit, which had the maximum number among all topologies. The total weight of these modules and the minimum heatsink surface area were calculated according to the number of required modules. These two results were quite important for power density evaluation. It is because all these IGBT modules accounted for a large portion of the total weight. On the other hand, the minimum heatsink surface area represented the rectangular baseplate area of all the IGBT modules added together. Although for most converter designs the heatsink surface area is much larger than this minimum area, a well-designed heatsink makes these two numbers similar. Under this condition, the heatsink weight is decided not only by the power loss, but also by how many modules are installed. Based on the comparison given in
Table 3, without considering the power loss, the 2L-VSC would be the most suitable topology, since it had the smallest minimum heatsink area as well as the lowest total module weight. On the other hand, the 3L converter was a moderate solution, which showed a similar performance.
3.3. Power Loss Comparison
As discussed before, the power loss performance is more critical in designing high-power-density converter systems. In order to evaluate the loss performance for each topology under different load conditions, the power loss on each device was calculated individually. The conduction loss and the switching loss were separately calculated.
A generalized equation to calculate an average conduction loss of an IGBT and a diode in one AC cycle was given by:
where
vce(
θ) represents the on-state voltage drop on the IGBT,
ice(
θ) represents the instantaneous current going through the IGBT when it is turned on, and
dcon(
θ) indicates the duty cycle of the device. For diodes,
vf(
θ) and
if(
θ) are used in Equation (1). The voltage drops, instantaneous current, and duty cycle are all variables related to the phase angle
θ in one AC cycle. Furthermore, the on-state voltage drop characteristic can be modeled as a constant equivalent voltage source
V0 for both IGBTs and diodes in zero-current-condition series connected with an on-state resistor
r0. Equation (1) can be rewritten as:
The switching loss was calculated under the assumption that the relationships between the switching loss and the on-state current and off-state voltage were linear. From the datasheet, the turn-on energy loss
Eon and the turn-off energy loss
Eoff of an IGBT and the reverse recovery energy loss
Erec of a diode under rated test conditions can be found. Then, by integrating the total energy loss within one output period and then multiplying it with the output frequency, Equation (3) was obtained as:
where the switching energy loss coefficient
Ek represents
Eon +
Eoff for the IGBT or
Erec for the diode,
Itest and
Utest are the rated test conditions noted on the datasheet, and
Ssw(
θ) indicates whether the IGBT or diode has the switching loss or not at a certain phase angle
θ in one AC cycle. All topologies were evaluated in both the rated rectifier mode and inverter mode. The results in the inverter mode with the rated conditions are given in
Figure 2. According to the results, the 2L-VSC showed a much higher total loss than the other multilevel topologies, because that the 1700 V IGBT module had a poor switching loss performance, which was identified by analyzing the datasheet of devices and the loss distribution. On the other hand, half of IGBT modules in the 3L-T
2C were 1700 V-type, and thus the total loss was also too high. Among all the topologies, 5L-HANPC had the lowest switching loss and the lowest total loss. The extremely low switching loss is not only because that the voltage step decreased to 1/4 of the DC link voltage, but also because the 650 V IGBT modules in the 5L-HANPC were the only devices under high-frequency switching after applying a commonly used low-loss modulation scheme. The results in the rectifier mode under the rated conditions are given in
Figure 3. It can be found that the tendency kept the same and the 5L-HANPC was the one with the best performance.
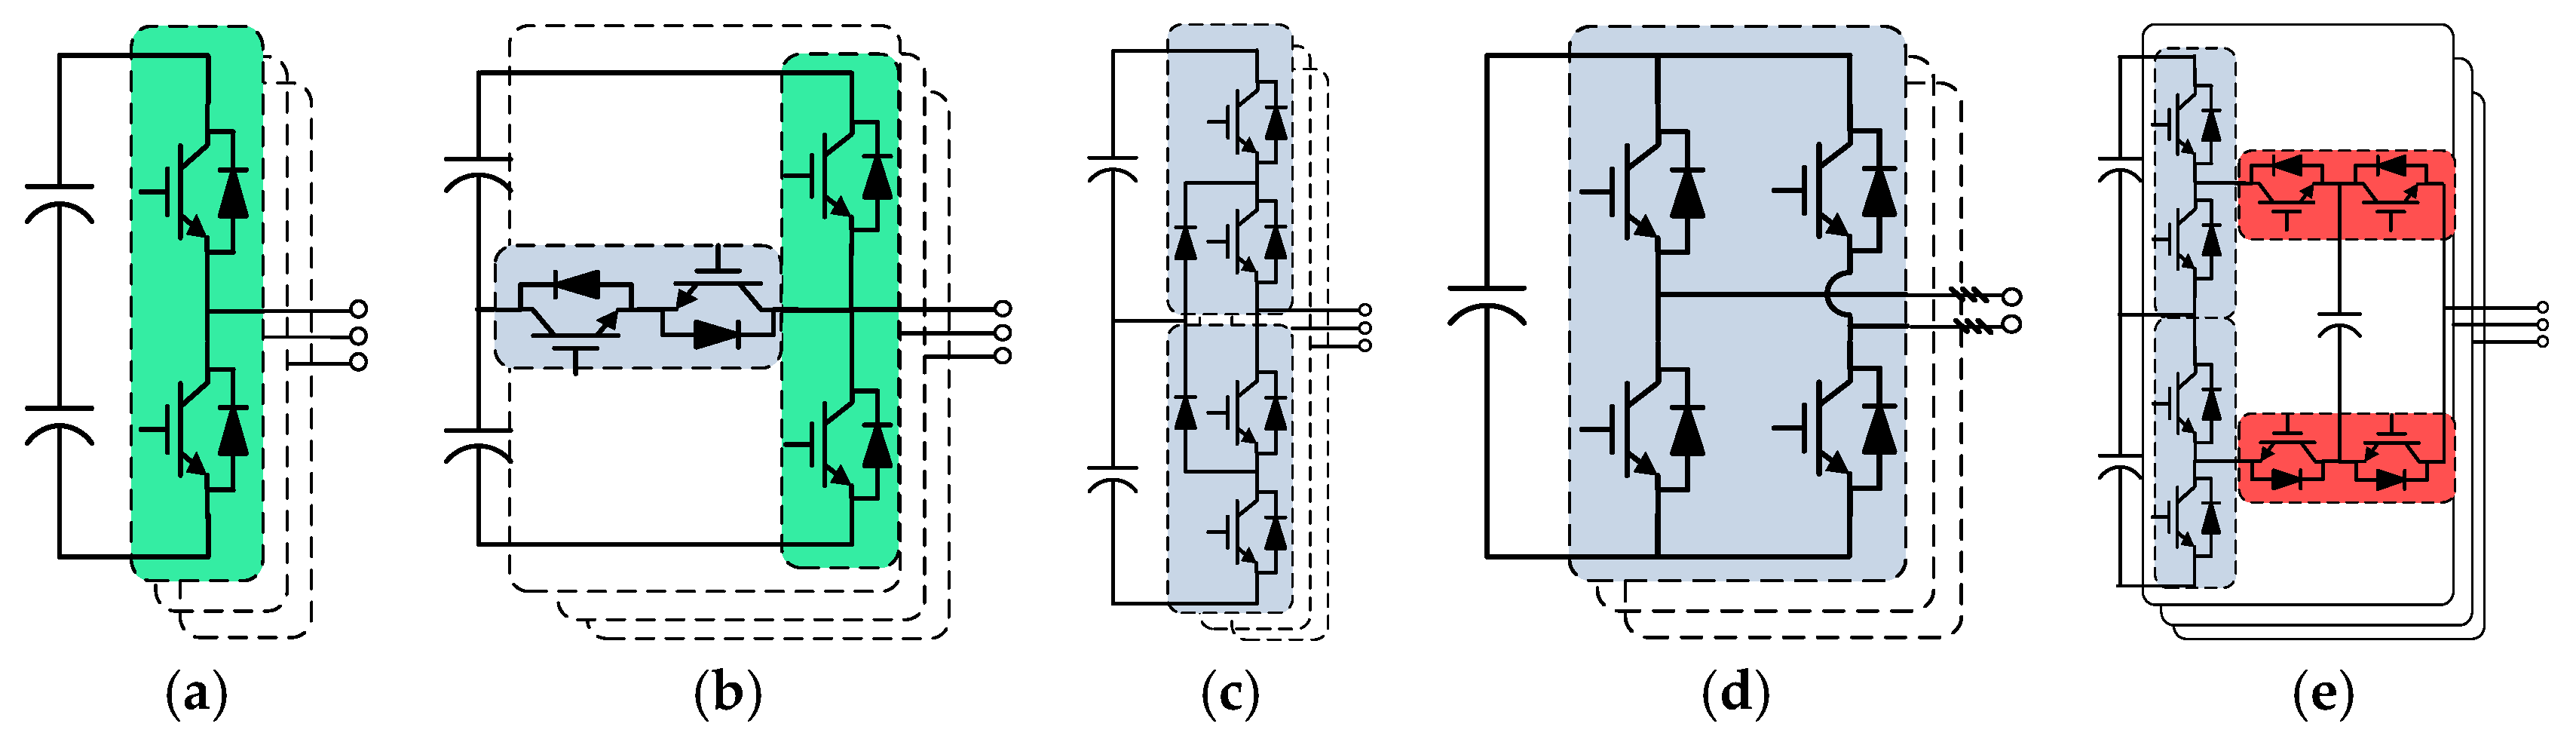
Another comparison was made by fixing the modulation index and power factor in the rated conditions while varying the switching frequency or output current. The results in the inverter mode and the rectifier mode are shown in
Figure 4 and
Figure 5, respectively, and showed that changing output currents did not affect the tendency since the loss was almost proportional to the output current for all topologies. However, after the switching frequency was decreased to be lower than 7 kHz, the power losses of the 3L-NPC and the 2L-FB became lower than that of the 5L-HANPC. It is because, under low switching frequencies, the conduction loss dominated the total loss and the 5L-HANPC had the highest conduction loss.
By summarizing the results of the loss comparison, a clear tendency can be discovered. The 2L-VSC was unacceptable because of huge power losses. At the selected operational frequency of 15 kHz, its total loss was 2–3 times higher than those of the other multilevel converter solutions. On the other hand, compared to the 3L-NPC, 2L-FB, and 5L-HANPC, the 3L-T
2C showed no advantages. Its total power loss was 75% higher than those of the 5L-HANPC and 27% higher than those of the 3L-FB and the 2L-FB under the inverter-mode operation. Considering that it also showed no benefit in module weight and total area comparisons according to
Table 3, it will not be considered in further evaluation. The 5L-HANPC should be the first choice considering the loss performance, because its total loss was reduced by 30% compared to that of our second choice the 3L-NPC.
3.4. Summary of the Comparison
According to the loss comparison results, the 5L-HANPC was the first choice. Another advantage is that the 5L-HANPC may decrease the volume and weight of an AC inductor, which is necessary for rectifiers. However, according to the comparison in
Table 3, more IGBTs were required to install, which in turn increased the surface area of the heatsink and required additional flying capacitors in the 5L-HANPC. On the other hand, by considering both the number of modules and the total loss, we found that the 3L-NPC and the 2L-FB could also be the favorable choices. However, the 2L-FB must connect to motors with three separated stator windings, and thus a specially designed motor was required. As a result, the 3L-NPC could be the best choice, especially for the inverter stage, where no AC-side inductor was required.
Based on the previous discussion, some possible back-to-back converter configurations were discussed. A very interesting fact is that the rectifier stage and the inverter stage did not have to apply converters with the same voltage level. It is because on the rectifier stage, increasing the voltage level can decrease the volume and weight of an AC inductor. On the contrary, no AC-side inductor was required on the inverter stage. Decreasing the voltage level can minimize the number of IGBT modules. Here come three potential solutions as well as one traditional solution used for comparison:
- 1)
Traditional solution: an ATRU and a 2L-VSC;
- 2)
An ATRU and a 3L-NPC;
- 3)
A 3L-NPC and a 3L-NPC;
- 4)
A 5L-HANPC and a 3L-NPC.
Among the three potential solutions, the 3L-NPC should be the only choice for inverter-stage circuits, since it had the highest power density, where no AC inductor was required. For the rectifier stage, a 5L-HANPC, a 3L-NPC, and a mature ATRU circuit are all possible choices. An asymmetrical back-to-back converter topology was proposed and given in
Section 4. It aims to optimize the system’s total weight on both the rectifier stage and the inverter stage. However, the loss calculation cannot tell which one is better, and only prototype design can clearly show the final winner.
4. Design of a High-Power-Density Converter Prototype
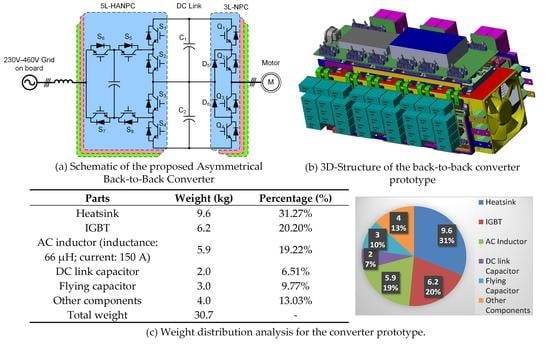
In our research, a 5L-HANPC and 3L-NPC (5L-3L) asymmetrical voltage-level multilevel back-to-back converter prototype was built to evaluate the power density of the power converter. The schematic of this prototype is demonstrated in
Figure 6. The specification of the prototype, and the selection results of all main components are given in
Table 4. The design of the volume of the passive components followed the criterion, which is for selecting the minimum volume while satisfying requirements of voltage ripples or current ripples.
From the selection results, it can be found that, compared to the DC link capacitor, the flying capacitor required a much larger capacitance. It is because that each flying capacitor was connected in a single phase. A large AC current went through each capacitor directly. Film-type capacitors were applied to both the DC link capacitor and the flying capacitor because of their high reliability, especially because of their open-circuit failure mode. The three-phase AC inductor was designed to have an electrical inductance of 66 μH and a rated input current of 150 A. The inductance was small compared to the traditional voltage source inverter (VSI) design, because the rectifier stage used a 5L converter.
The design of a heatsink for the air-cooling system is one of the most challenging parts of the prototype design. According to
Table 3, there were 18 IGBT modules; the 3L-NPC was composed of six IGBT modules, and the 5L-HANPC was composed of the other 12 modules. Each converter had a different loss performance. Furthermore, each IGBT module had its own loss. This led to different temperature increases if we used a common heatsink design, where all IGBT modules are mounted on one surface and have an almost identical thermal resistance from the junction to the ambient. On the contrary, an ideal converter thermal system design is to let all IGBTs have the same temperature rise, and thus, the converter can make full use of the cooling system capacity.
In order to design a heatsink structure that can fully exploit the capability of the cooling system, the loss distributions among all IGBT modules under the rated conditions were calculated. The results are given in
Table 5. The numbers of modules and switches are kept the same as what are illustrated in
Figure 6. It can be found that the high-frequency switches of IGBTs S
5–S
8 in the 5L-HANPC and those of IGBTs in the 3L-NPC had higher power losses. The low-frequency switches of IGBTs S
1–S
4 in the 5L-HANPC had lower power losses. Based on this loss distribution, an innovative heatsink structure was investigated. IGBT modules with higher power loss were placed on the two side surfaces. The IGBT modules with less power loss were placed on the top surface. All fins of the heatsink were arranged to be parallel with the top surface, and thus the two side surfaces could have a better convection area. It is named as triple-surface-mounted heatsink structure, as shown in
Figure 7.
The thermal performance of the proposed heatsink structure was verified by the finite element analysis (FEA). Two important questions were answered: (1) How large were the optimized areas of the side and the top surfaces? (2) Did the temperature rises on each IGBT module become even?
Figure 8 shows the FEA results of the heatsink version I, where the IGBT modules were placed side by side on three surfaces and the width of one surface was equal to the length of one IGBT module. According to the results, the average temperature rises on the heatsink surface did not exceed the upper limit. It meant that heat dissipation capability was strong enough even if the heatsink surface area was just equal to the total bottom side area of the IGBT modules. However, the hottest part was the top surface area near the outlet of the cooling air flow. The temperature difference between the top surface and the side surface was higher than 15 °C. It meant that the top surface area without any fin was hard to dissipate the power loss even if the IGBT modules on the top surface had much less loss.
An improved heatsink version II is demonstrated in
Figure 9. A thick plate was soldered to the center of the top surface. In this way, part of thermal flow conducted from the top surface to the center plate and was brought out by the airflow. In addition, the bottom side surface, which had a minimum effect on cooling, was removed to further save the total weight. According to the FEA results for version II, the temperature rise on each surface became almost even.
The final structure design and the picture of this back-to-back prototype are demonstrated in
Figure 10. The switches of IGBTs S
5–S
8 in the 5L-HANPC and those of IGBTs in the 3L-NPC were placed on the two side surfaces of the heatsink version II. The switches of IGBTs S
1–S
4 in the 5L-HANPC were placed on the top surface. The IGBT modules were connected by a copper bar. On the top of the IGBT modules at the two side surfaces, the DC link capacitors and the flying capacitors were fixed by using aluminum stand-offs. The top area was the total surface area of the PCBs for gating, sampling, display, and auxiliary power supply. This structure not only fully made use of the space, but also saved a large amount of weight by decreasing the size of the heatsink and the length of the connecting copper bar compared to structures, where all IGBTs are placed on one surface.
Table 6 shows the weight distribution of the prototype. The heatsink, IGBT modules, and the AC inductor (not shown in the converter structure) were the main heavy parts. It should be noticed that the flying capacitors with their PCBs used by the 5L-HANPC also contributed to 9.77% of the total weight. This somehow affected the benefit of the 5L-HANPC applied to aerospace.
5. Verification of the High-Power-Density Converter Design
After the 5L-3L back-to-back converter prototype was assembled, it was tested under different load conditions to verify two important questions. One was whether the loss estimation was correct or not. Correct loss estimation demonstrated correct topology selection. The other was whether the proposed cooling system structure could dissipate the power loss generated by the converter operation or not.
In order to test the power loss of the converter, each side of the converter was tested in the inverter mode, where the DC link voltage was connected to an 800 V DC source and the AC output was connected to a purely inductive load. The test set is given in
Figure 11. The DC-side efficiency was tested by using a power analyzer Norma D 5000 (Fluke, Everett, WA, USA). By using this method, each side of the converter was powered to full-load conditions, while the DC source only provided a small amount of power, which was equal to the power losses on both converters and inductive loads. During the test, by varying the modulation indices
M of both sides of the converter, the output current was changed from zero to its maximum point. Then, the total power losses were recorded. The power losses of the inductive loads were estimated with the models described in [
21,
22]. By deducting the power losses on inductive loads, the power losses on converters were finally derived.
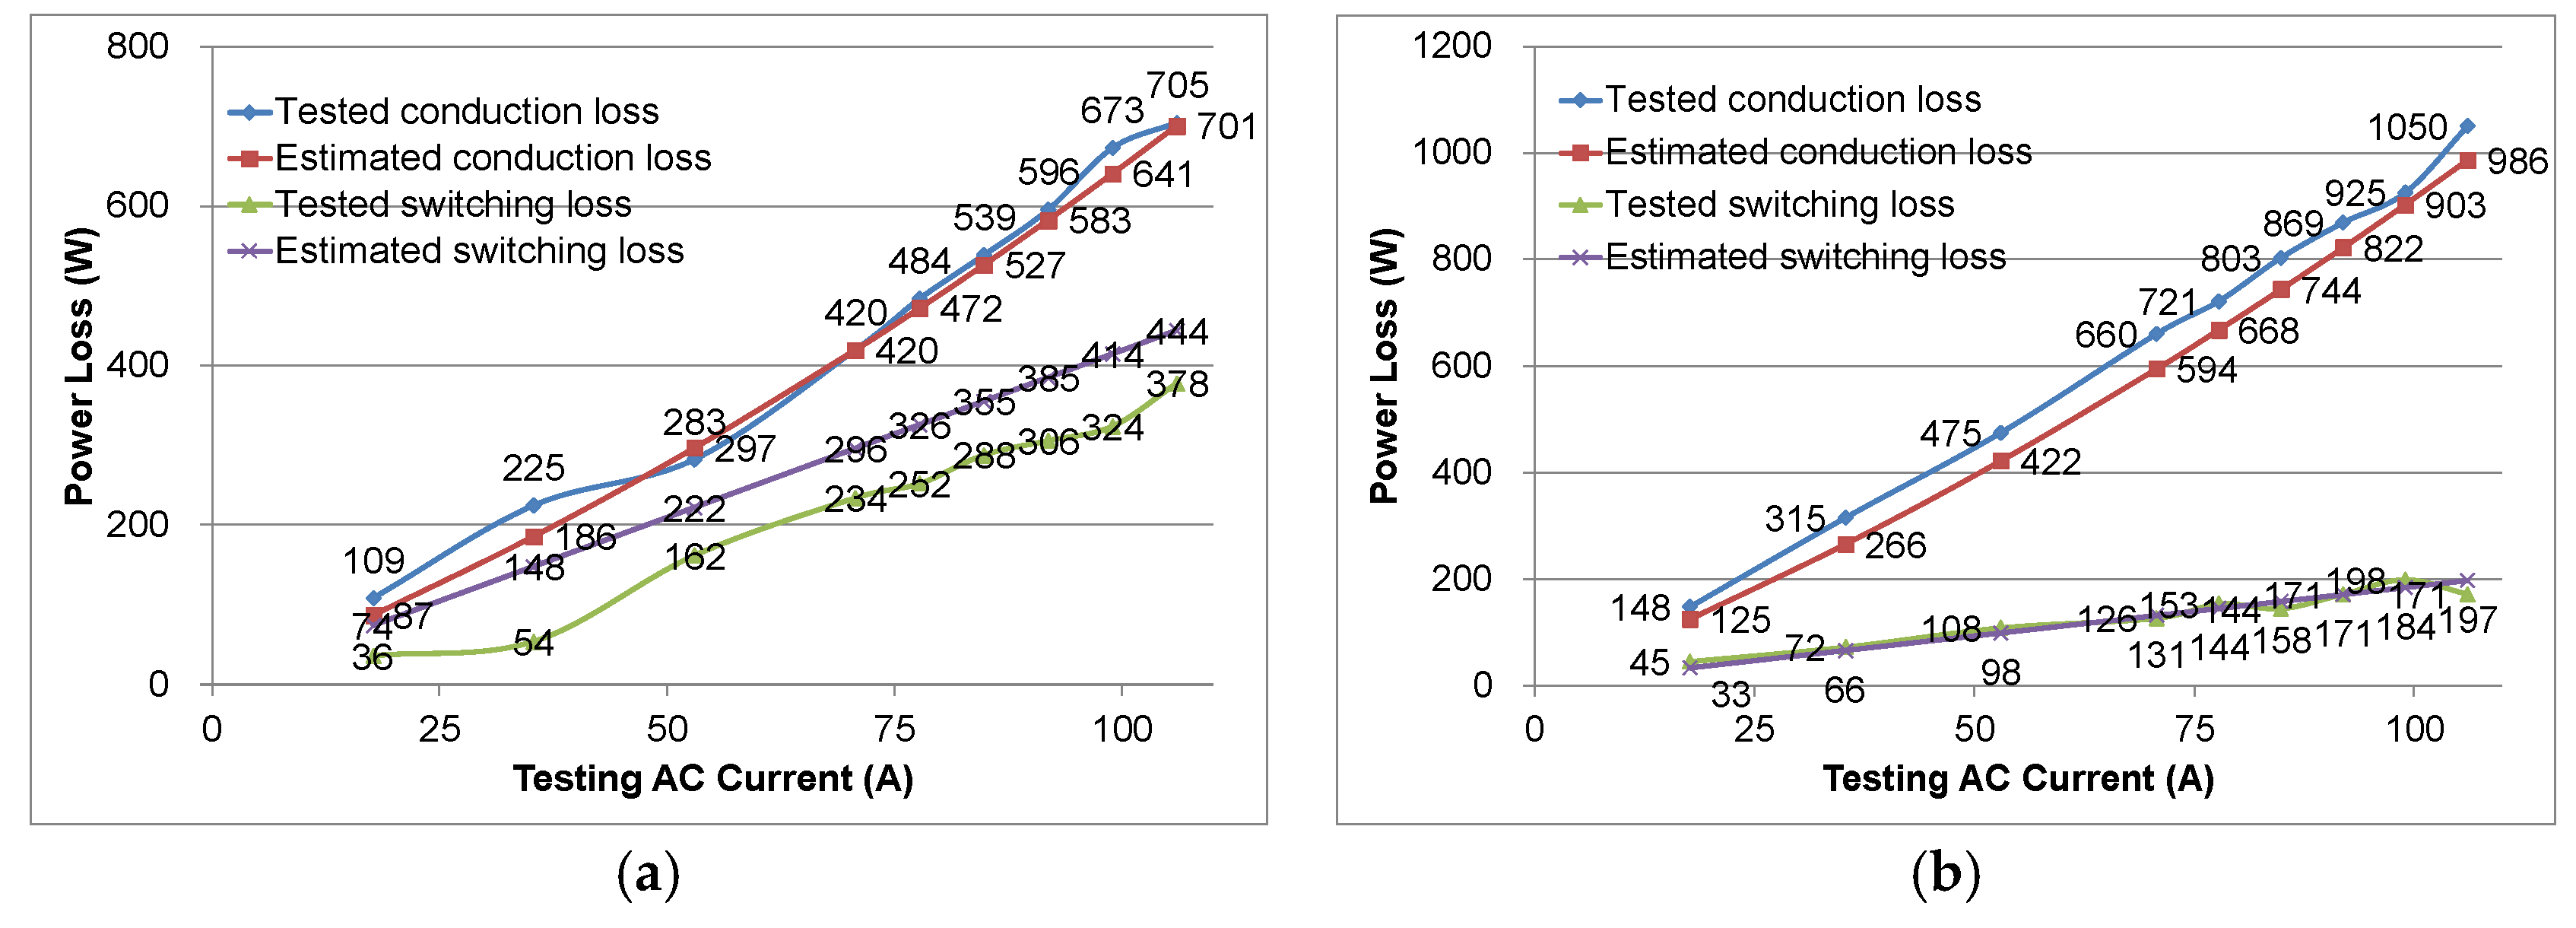
Figure 12a shows tested losses and estimated losses for the 3L-NPC under different load conditions. The results showed that the estimation of the conduction loss was quite precise within the whole-load condition. The estimation of the switching loss showed a slightly larger error than that of the conduction loss. Nevertheless, the accuracy was accepted for topology evaluation.
Figure 12b shows tested losses and estimated losses for the 5L-HANPC under different load conditions. The results also showed that the estimation of the power loss was correct.
The thermal system performance was verified by investigating the temperature rise on each negative temperature coefficient (NTC) sensor embedded in IGBT modules. There were totally 18 NTC resistors belonging to 18 IGBT modules. The ambient temperature
Ta for testing was 20 °C, and the air flow was 120 cubic feet per minute (CFM). The converter was tested under full-load conditions:
Vdc = ±400 V;
Iac = 100 A. The data received from the NTC temperature sensor are plotted in
Figure 13. From the results, it can be found that the distributions of the temperature were similar in all three surfaces. On the other hand, the 3L-NPC modules had the highest temperature rise. This is because the power loss per each module in the 3L-NPC was still larger than the power loss per module in the 5L-HANPC.
6. Evaluation and Comparison
With the developed 5L-3L back-to-back converter prototype, not only the power density and the efficiency performance of this prototype could be measured, but the other two possible solutions, which were the ATRU/3L-NPC and the 3L-3L back-to-back converter, could also be evaluated by estimating the weight of each main parts and also estimating the power losses according to the calculation derived in
Section 3.
Based on the similar commercially available products on the market, the weight of a 60 kW ATRU was aggressively estimated at 20 kg, which is given in
Table 7. On the other hand, the AC-input inductor used in the 3L-3L back-to-back converter should be larger than the inductor used in the 5L-3L back-to-back converter prototype. According to the calculation, an inductor with an electrical inductance of 100 μH and an AC current of 150 A was adopted. The weight of this inductor was also estimated and is given in
Table 7.
Besides the magnetic components, the weights of the other parts were also estimated. If the 5L-HANPC was replaced with the 3L-NPC on the rectifier part, the weight differences would mainly come from the elimination of six IGBT modules and flying capacitors and from the increased size of the AC Inductor. The weight distribution of each part for the 3L-3L back-to-back converter is shown in column IV of
Table 8. If the 5L-HANPC was replaced with the 60 kW ATRU, the heatsink weight could be decreased by half since only the inverter part required the heatsink, and also the heat dissipation roughly decreased by half. All 5L IGBT modules and flying capacitors were eliminated. The weights of other components, including the auxiliary supply, copper bars, and control PCBs, was estimated to decrease 1 kg. By adding the weight of the ATRU, the total weight of the ATRU-3L converter is shown in column II of
Table 8.
Since according to our testing results the calculation of the power losses matched the tested power losses very well, the calculation was proved to be quite accurate. The estimation of the power losses for each converter also followed the results derived in
Figure 4 and
Figure 5. The power losses of the ATRU were not directly calculated. From the product brochure [
12], the maximum efficiency was 98%.
The final comparisons in terms of total weight, power density, and expected efficiency are given in
Table 8. In order to clearly show the benefit of the proposed solutions, the weight performance of the traditional ATRU-2L-VSC solution is also given in Column I of
Table 8. The weight of a commercially available 50 kW 2L-VSC inverter product for aerospace with liquid cooling was found to be 21.8 kg. Thus, the total weight of the ATRU-2L-VSC system was 41.8 kg. It should be noticed that the ATRU used in the comparison was also only designed for the liquid-cooling system, which actually is not fully available in this application area. An air-cooled ATRU should have an even heavier weight.
The comparative results showed that the 3L-3L back-to-back converter was a better solution in terms of power density among the three potential solutions. The reasons are as following: Firstly, the heavy ARTU was replaced by the power converter, while at the same time a good balance between the number of active components and the volume of reactive components was found. The highest power density achieved was 2.79 kVA/kg, if we chose the apparent power rating of the machine (80 kVA) as the base power. The power density of the proposed 5L-3L back-to-back converter was 2.61 kVA/kg. It was also quite high, which was 30% higher than that of the traditional solution ATRU-2L converter. By considering the power efficiency, the proposed 5L-3L back-to-back converter showed a better performance compared to the 3L-3L back-to-back converter. The efficiency at the rated power of the back-to-back system, including the rectifier and inverter stages, was 95.8%. This is because of the highly efficient 5L converter. Furthermore, power density improvement can be made for this asymmetrical-voltage-level topology. Since the switching losses of the 5L rectifier stage were pretty low, if the higher switching frequency was selected, it could use smaller flying capacitors and smaller AC side filters, which would in turn decrease the total weight of the system.
7. Conclusions
According to our work, it can be concluded that the power density of a converter for a high-power-rating motor drive system in aerospace can be improved by replacing an ATRU with the power converter. By properly designing the heatsink structure, the multisurface cooling system can achieve considerably low weight and small size. Eventually, the heatsink size and weight were limited by the number and area of IGBT modules, if the converter topology had high efficiency. By evaluating the prototype performance, the finally achieved power density of the 5L-3L back-to-back converter prototype was 2.61 kVA/kg, which was 30% higher than that of the traditional solution. The efficiency could be up to 95.8%. The expected power density of the 3L-3L back-to-back converter prototype was 2.79 kVA/kg.
In the high-power motor drive system for aerospace applications, a multilevel-converter-based system showed advantages including fewer power losses and higher power density compared to transformer-based systems. In fact, in other applications with the TeDP architecture, multilevel converters can also provide advanced solutions with similar benefits. More importantly, multilevel-converter-based solutions can provide more flexibility. For example, a multilevel-converter-based rectifier provides a DC mid-point, which can potentially connect to the ground point in aircraft. Properly designing a modulation scheme can alleviate common-mode problems. In addition, when the motor speed is low, a converter-based rectifier can lower the DC bus voltage to minimize the switching loss of the system. With all these benefits, it is believed that in the near future, multilevel-converter-based rectifier–inverter power units will realize their wide applications in TeDP architectures.

 ,
, 


