1. Introduction
Wave energy is a promising source of renewable energy available worldwide. At present, research and development of efficient, reliable, and sustainable wave energy converters (WECs) are in progress [
1,
2,
3]. The oscillating water column (OWC) technology equipped with an air turbine is one of the most promising and possibly the most reliable and fastest thriving technologies in the wave energy harvesting sector [
3,
4]. Nevertheless, to gain economic optimization to enter the energy market and make a significant contribution, these converters must be large enough with many converters deployed as an array [
5]. To further improve economic feasibility, these arrays can be integrated with power management systems (PMSs) with the aim of enhancing energy harvesting and the quality of electrical power delivered to the grid. The WEC array configurations and PMSs are not new to the renewable energy sector [
6,
7,
8]. Nevertheless, the feasibility of a PMS applied to an array of vented OWC wave energy converter systems is yet to be reported. This paper expands the research in [
9], which is based on a grid integrated single/isolated fixed vented oscillating water column (VOWC) with supercapacitor and Li-ion battery hybrid energy storage system (HESS). This paper reports on array configurations for VOWCs.
The OWC principle is based on passing oscillating air through an air turbine fixed in a partially submerged chamber due to oscillating motion of the water column inside it [
1]. A generator coupled to the air turbine converts the mechanical energy of the air turbine to electrical energy. The VOWC is a variation on the standard OWC format to vent the OWC chamber on positive pressure to make the air flow through the turbine unidirectionally. The pneumatic conversion efficiency has been shown at model scale to be equivalent to or better than the standard bi-directional configuration [
10].
This study is vital, since the array of VOWC technology is adaptable for existing ocean structures or future developments such as breakwaters. Placing multiple VOWCs in a breakwater may affect the pressure profiles of each VOWC and thus significantly change the energy capture. Therefore, the array layout should be designed in a way to gain the benefit of these interactions. Moreover, spacing between the VOWC devices should be tuned to the local peak wavelength as explained in [
11,
12]. Since the research in OWC array configuration is still at an early stage, information regarding optimal OWC array configurations or the efficiency reductions/fluctuations of OWC array devices is limited. Therefore, this model does not include hydrodynamic interactions of VOWCs. Instead, it concentrates on (1) a single PMS for grid integration of an isolated VOWC, (2) a nearshore detached breakwater (VOWCDBW), and (3) two different array configurations of VOWCs with a shared hybrid energy storage system as shown in
Figure 1.
This paper investigates one of the worst-case scenarios in terms of energy management by assuming that both the VOWCs in the VOWCDBW experience the same pressure profile. Four case studies were carried out to identify and compare the output of VOWC array configurations with regard to electrical power generation and smoothing as shown in
Figure 1.
The four cases studied in this paper are: (1) single VOWC, (2) two VOWCs in a detached breakwater structure, (3) an array of three isolated VOWCs, and (4) an array of three VOWCDBWs. For this study, two of the VOWCs in the VOWCDBW system are used with thrice the width of the model spacing to minimise the effects of interaction [
13]. A VOWCDBW that can be built into a coastal protection structure can considerably increase the average power compared to an isolated VOWC but has minimal effect on power smoothing compared to an array.
An array of VOWCs can be designed effectively to smooth the electrical power output taking advantage of the temporal–spatial distribution of the wave energy. For an array layout, researchers have proposed different patterns such as rectangular, semicircular, triangular, etc. Nonetheless, the pattern is given less importance compared to the distribution of surge separation distance [
11,
12,
13,
14,
15]. Therefore, three isolated VOWCs and three VOWCDBCs placed in a hypotenuse of a right triangle as shown in
Figure 1c,d were selected to improve the power smoothing. The configuration of five times the width of the VOWC for the spacing between two VOWCs was also considered as recommended in [
12].
This study proposes to combine VOWCDBW with an array configuration to get the advantage of complimentary dynamic features of both types of arrays that make provisions for enhancing energy capture and the smoothing effect simultaneously. The schematic layouts of the isolated VOWC, VOWCDBW, VOWC array, and VOWCDBW array are shown in
Figure 1. The schematic diagram of the electrical power conversion system is illustrated in
Figure 2. The schematic diagram of the single VOWC WEC, which corresponds to the configuration in
Figure 1a, is shown in
Figure 2a. The electrical connection of two WECs in the VOWCDBW configuration in
Figure 1b is shown in
Figure 2b. Electrical connections of the other two array configurations also follow the same trend where all the rectifier outputs are connected to the same DC-link. The electrical connection of the hybrid array of VOWCs in the VOWCDBW configuration in
Figure 1d is shown in
Figure 2c.
The paper is organised as follows.
Section 2 outlines the power management strategy, which is derived from [
9].
Section 3 explains the system design of VOWC arrays. Simulation results and discussion of the implications of the results are given in
Section 4. Conclusions derived from the discussion are presented in
Section 5.
2. Power Management System
The same PMS proposed by the authors in [
9] was used in all four of the case studies without any changes. This approach was taken to confirm the validity of this PMS in any configuration of VOWC–grid integration. The PMS is expressed as [
9]
where
is the grid power,
is the VOWC generated power, and
and
are supercapacitor and battery power, respectively.
is the percentage difference of generated and grid power (P
s-P
g), which is transferred to the supercapacitor. The initial grid power reference is represented by
. SOC
sc is the state of charge of the supercapacitor. The state of charge of the battery is signified by SOC
bat.
,
,
, and
are scaling factors, which are 1, 1, 2 × 10
4 and 10
5, respectively.
is the primary source of power used by the PMS. Pbat is used only if is unable to maintain the committed power output to the grid. When there is surplus power, the total amount of excess power is transferred to the supercapacitor if the supercapacitor’s state of charge (SOC) is lower than its upper threshold (75%). Once it reaches its upper threshold, part of the charging power is diverted to the battery to prevent overcharging of the supercapacitor. Conversely, when there is a deficit of power, the entire power deficit is taken from the supercapacitor until the supercapacitor reaches its lower threshold (55%). Once it reaches its lower threshold, part of the power deficit is taken from the battery to prevent over-discharging of the supercapacitor. This minimises the usage of Li-ion battery storage. The proposed PMS aims to control the supercapacitor and battery SOCs to remain within their upper and lower thresholds (45–85%) to avoid overcharging/over-discharging to improve their lifetime. Rate of change of SOC of the Li-ion battery and its SOC deviation from 65% are used to adjust the grid power reference to maintain the battery SOC within the normal working range.
3. System Design and Modelling
As mentioned in the introduction, this study investigates isolated arrays of VOWCs and a VOWCDBW. In the VOWC, the pneumatic energy is only converted during a half wave cycle (inhalation). Therefore, the power pulse experienced is approximately twice as intense as the pulse experienced in a bi-directional air turbine configuration. These array systems are designed in such a way that both types of arrays enhance energy capture and power smoothing simultaneously. The pressure head of the VOWC chambers for the simulation is taken from the lab scale experiments done in [
16]. Assumptions made in this study are listed below.
- ○
Each of the VOWC device lengths is tuned to the local peak wavelength/wave period (in this case 13 s). A phase shift of 120° is introduced to the chamber pressure profiles of the VOWC/VOWCDBW arrays shown in
Figure 1c,d;
- ○
In array configurations, the VOWCs/VOWCDBWs are placed in a hypotenuse of a right triangle as shown in
Figure 1, where the base is the coastline. This type of geometry is used to improve the quality of the power extracted by the combined air turbines, which will allow reducing the energy storage capacity;
- ○
VOWC/VOWCDBWs are placed in a manner such that multiple device arrangements do not affect the efficiency of each device.
The parameters given in
Table 1 were used to model each case study in MATLAB/Simulink to gain the simulation results discussed in the next section. The details of modelling the VOWC air turbine, turbine-generator, grid, energy storage systems (ESSs), and DC-to-DC bidirectional converters can be found in [
17,
18]. The PMS is modelled using the rules presented in [
9]. The simulation was carried out for 1200 s. To observe the effect of the VOWC configuration on the power output and the supercapacitor sizing, the supercapacitor energy storage (SCES) SOC limits were set to vary between 45% to 85%.
4. Simulation Results and Discussion
The grid integrated VOWC, VOWCDBW, and array configurations with their respective air turbines and PMSs were modelled in MATLAB/Simulink, using the parameters that are given in
Table 1. The simulation results are shown in
Figure 3,
Figure 4,
Figure 5,
Figure 6 and
Figure 7, which are used to evaluate the proposed configurations and efficiency of those layouts in four different scenarios: case 1: isolated VOWC, case 2: two VOWC devices in the VOWCDBW with three times spacing, case 3: an array of three individual VOWCs, case 4: an array of three VOWCDBWs.
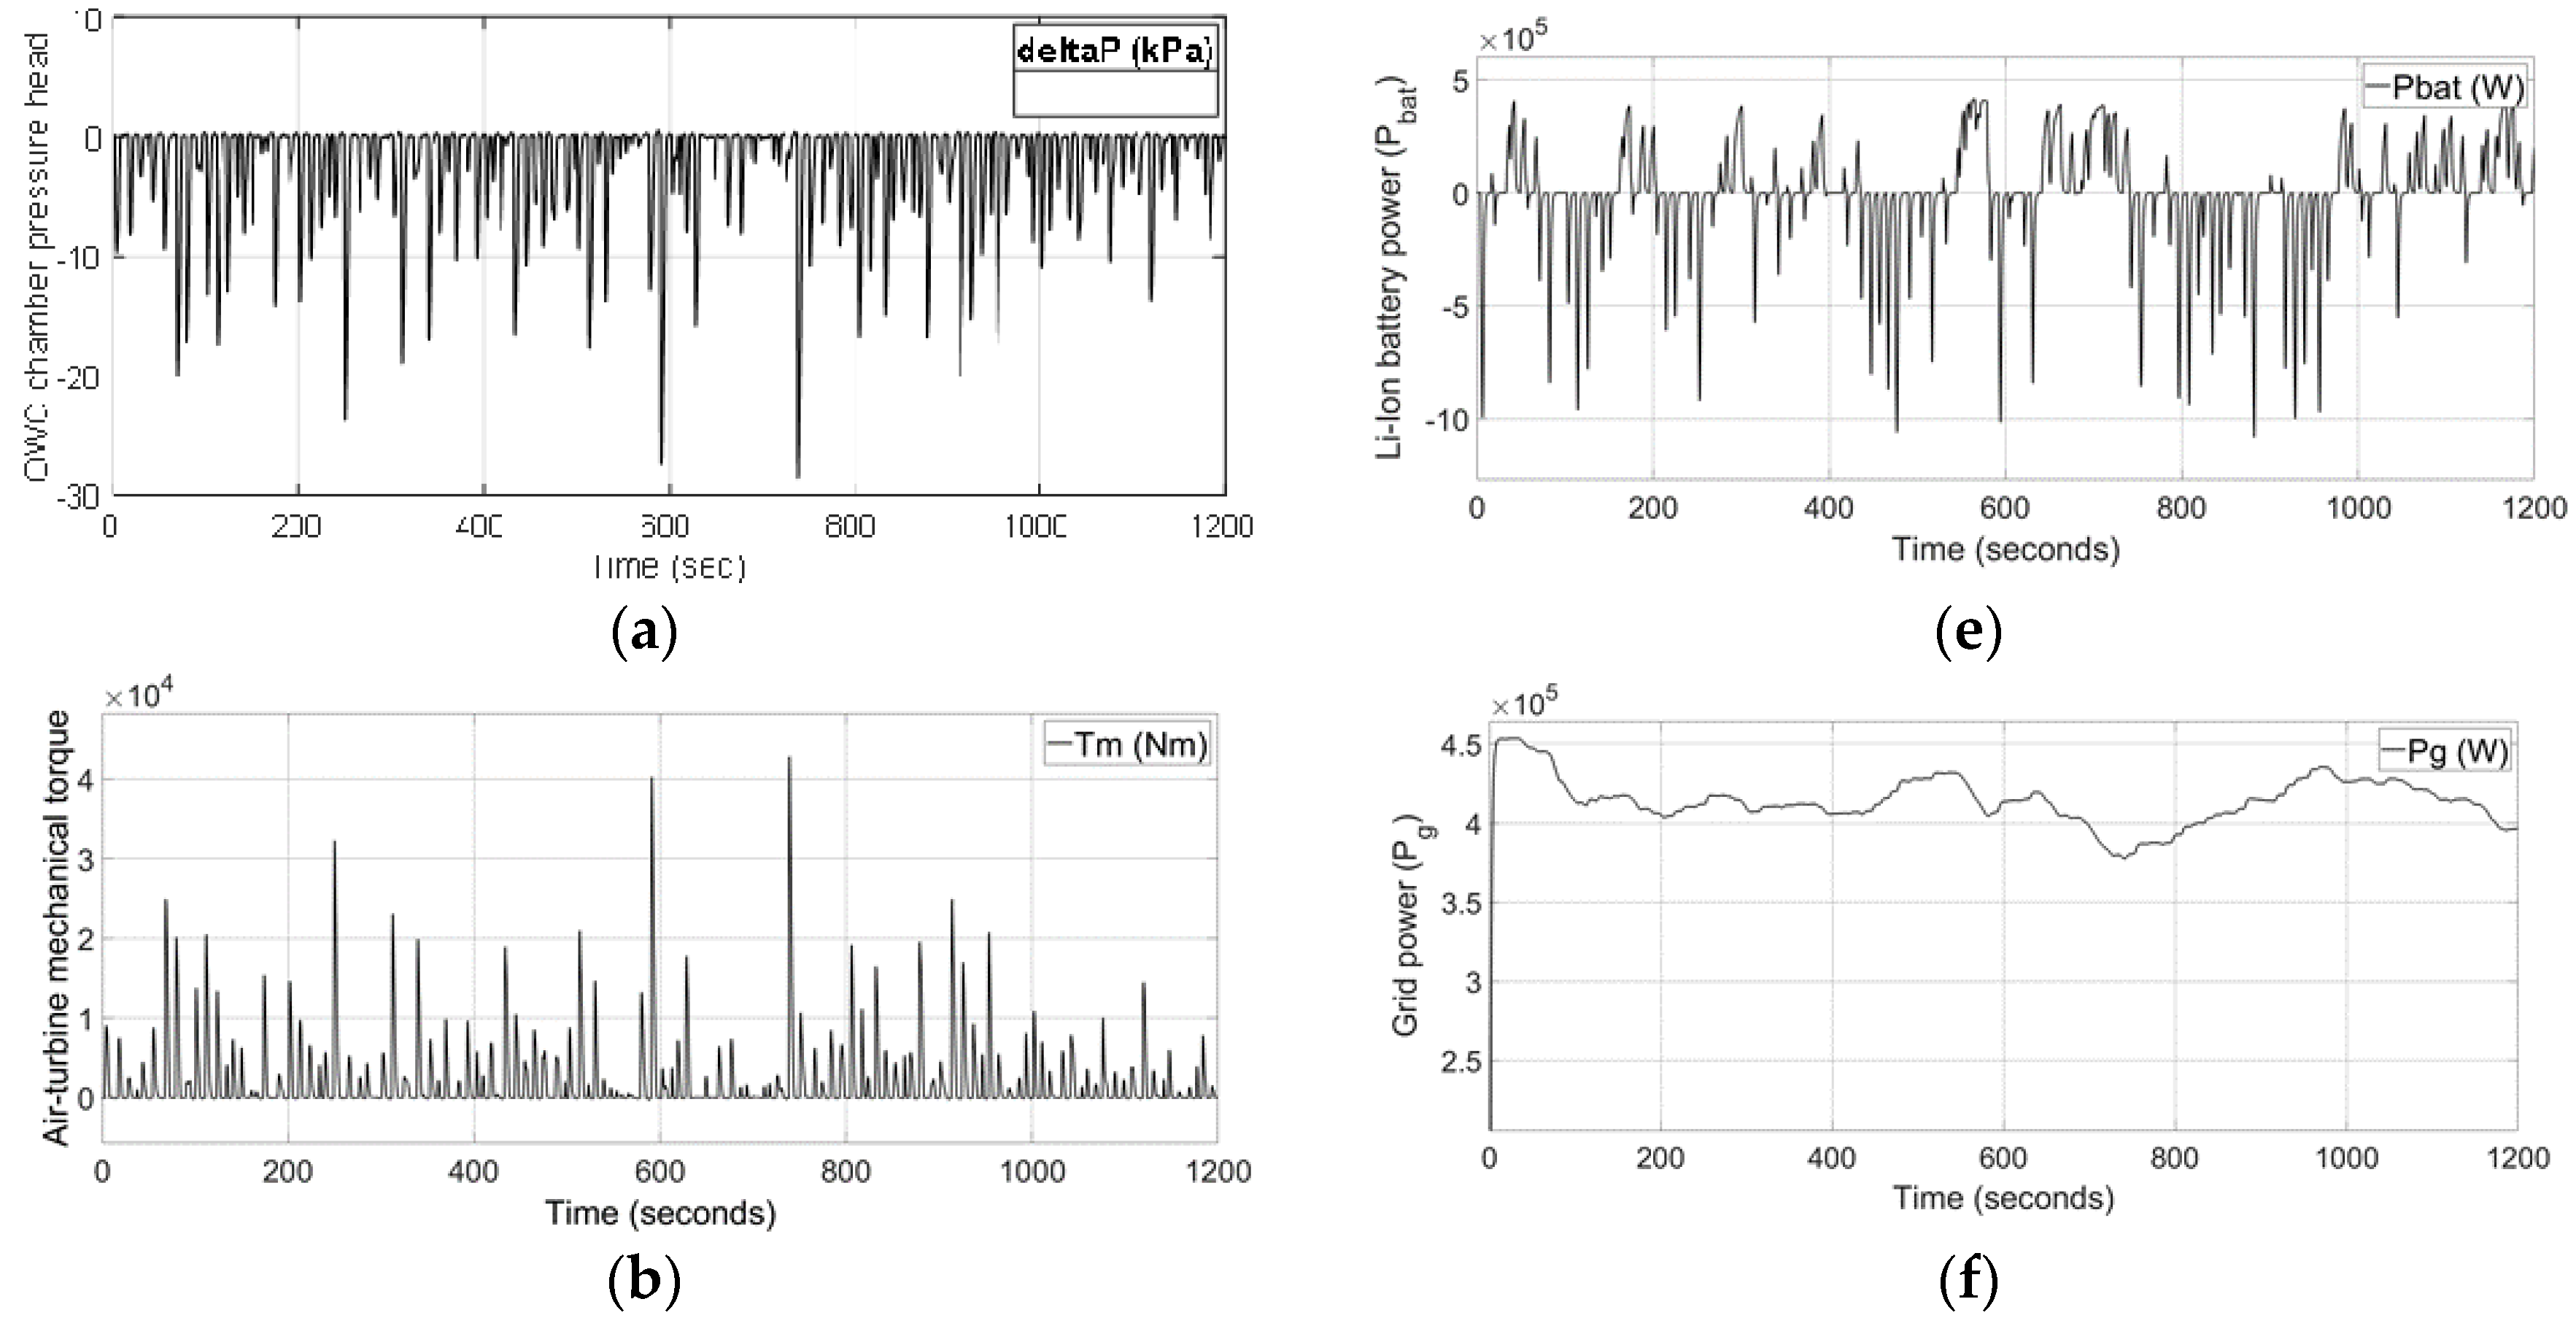
4.1. First Case Study: Isolated Single VOWC
In the first case study, an isolated VOWC was designed as in [
9]. The pressure head of the VOWC chamber is shown in
Figure 3a.
Figure 3b shows the air-turbine mechanical torque. The turbine-generator rotor angular speed is illustrated by
Figure 3c. This was maintained between 20 and 157 rad/s throughout the simulation as predesigned. This variable rotational speed control approach enables the turbine to respond efficiently to a wider range of sea states and widen the response of the turbine to varying power levels of the waves [
9]. Operating the air-turbine speed at variable speed also helps to reduce the supercapacitor size [
9].
Figure 3d, illustrates the turbine-generator power output, grid power supply, and the supercapacitor power. The Li-ion battery power is shown in
Figure 3e. The supply power to the grid is maintained closer to the reference with the 19.8 F supercapacitor. The power output is gradually varied between 380 to 453 kW, from start to the end, for 1200 s. This power fluctuation is considered acceptable by the Australian Energy Market [
19]. The enlarged grid power output and the rate of change of the Li-ion battery SOC% are shown in
Figure 3f,g, respectively. The output power reference is adjusted by the PMS throughout the simulation, maintaining the battery SOC% in desirable limits based on the deviation of the Li-ion battery SOC 65% and the rate of change of SOC. The DC-link voltage is regulated close to its reference within 9% deviation as shown in
Figure 3h.
Figure 3i, depicts the SOCs of the supercapacitor and Li-ion battery, which illustrate the energy transfer according to the PMS.
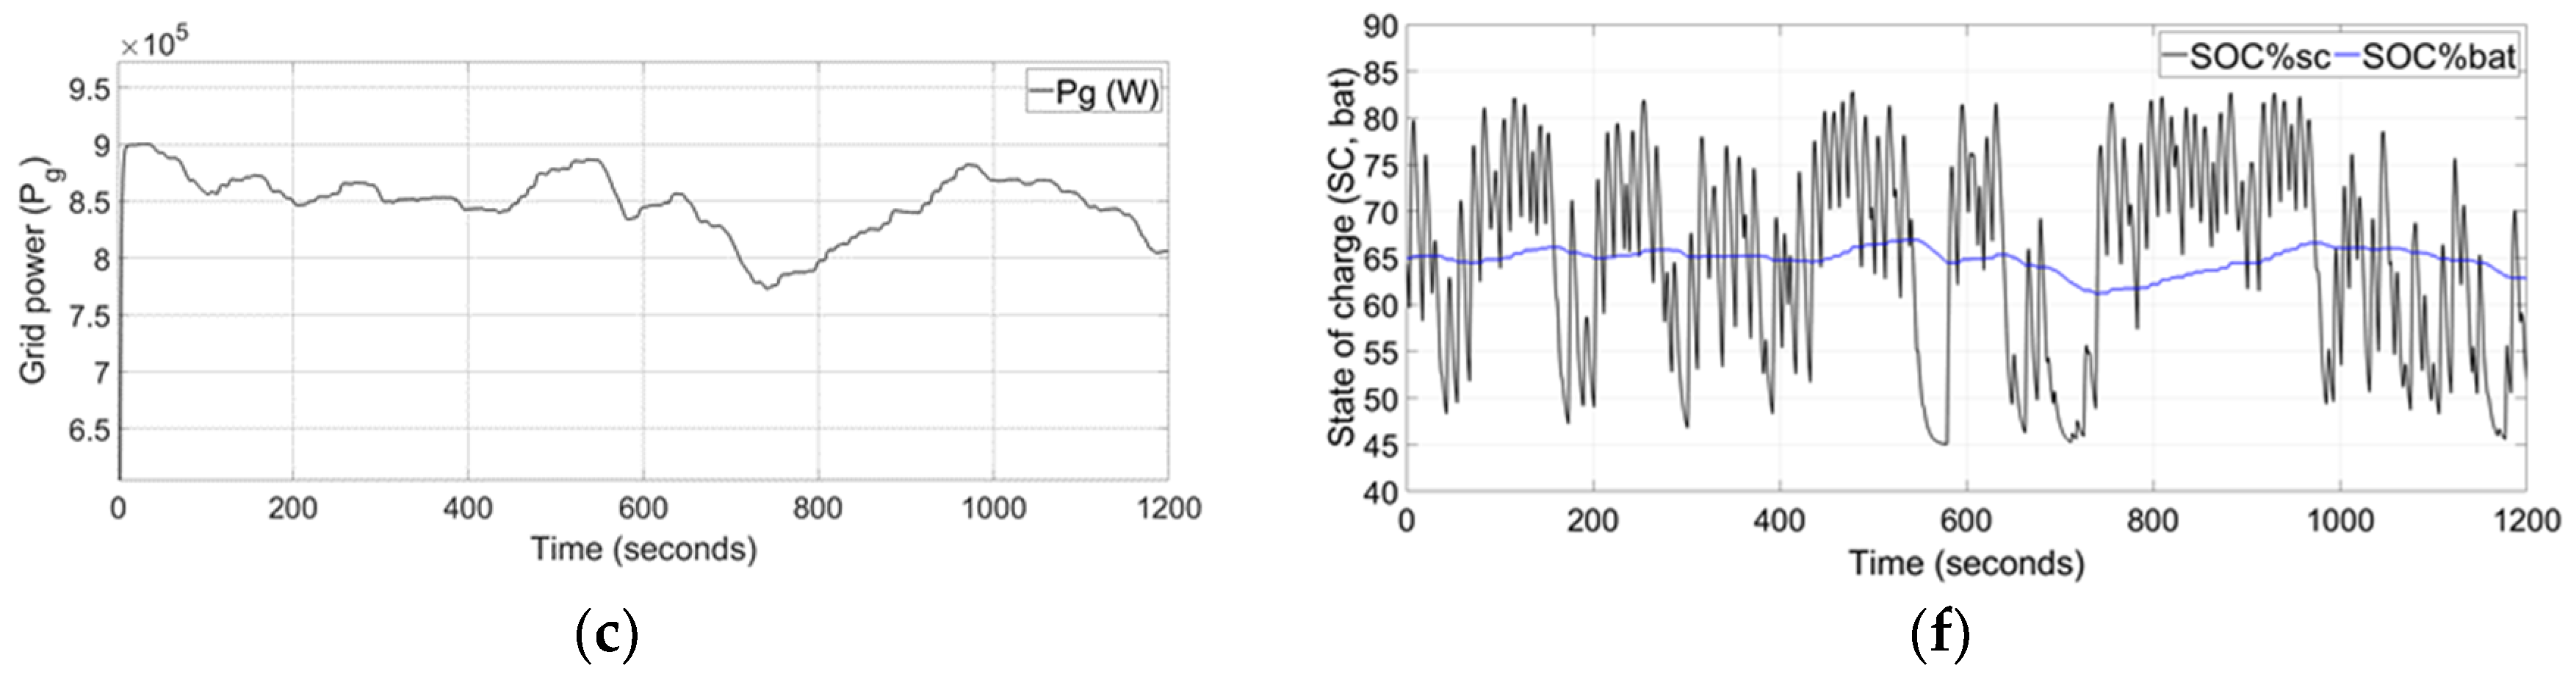
4.2. Second Case Study: VOWCDBW
The second case study was designed for VOWCDBW with two detached VOWCs in a breakwater. Both VOWCs’ air-turbine torque and rotor angular speed represent similar characteristics because both are built into the same breakwater that experiences relatively the same differential air pressure that controls the air-flow through the turbines.
The simulation results of turbine-generator power output, grid power supply, and supercapacitor power are illustrated in
Figure 4a.
Figure 4b depicts the Li-ion battery power.
Figure 4c,d shows the enlarged version of grid power and Li-ion battery SOC%, respectively. The power is supplied to the grid following the reference, 900 kW with 39.6 F supercapacitor compared to case study 1. The power output is gradually varied between 700 to 900 kW, from start to the end, 1200 s. The DC-link voltage is regulated close to its reference within a 14% deviation as shown in
Figure 4e.
Figure 4f shows the SOCs of the supercapacitor and Li-ion battery.
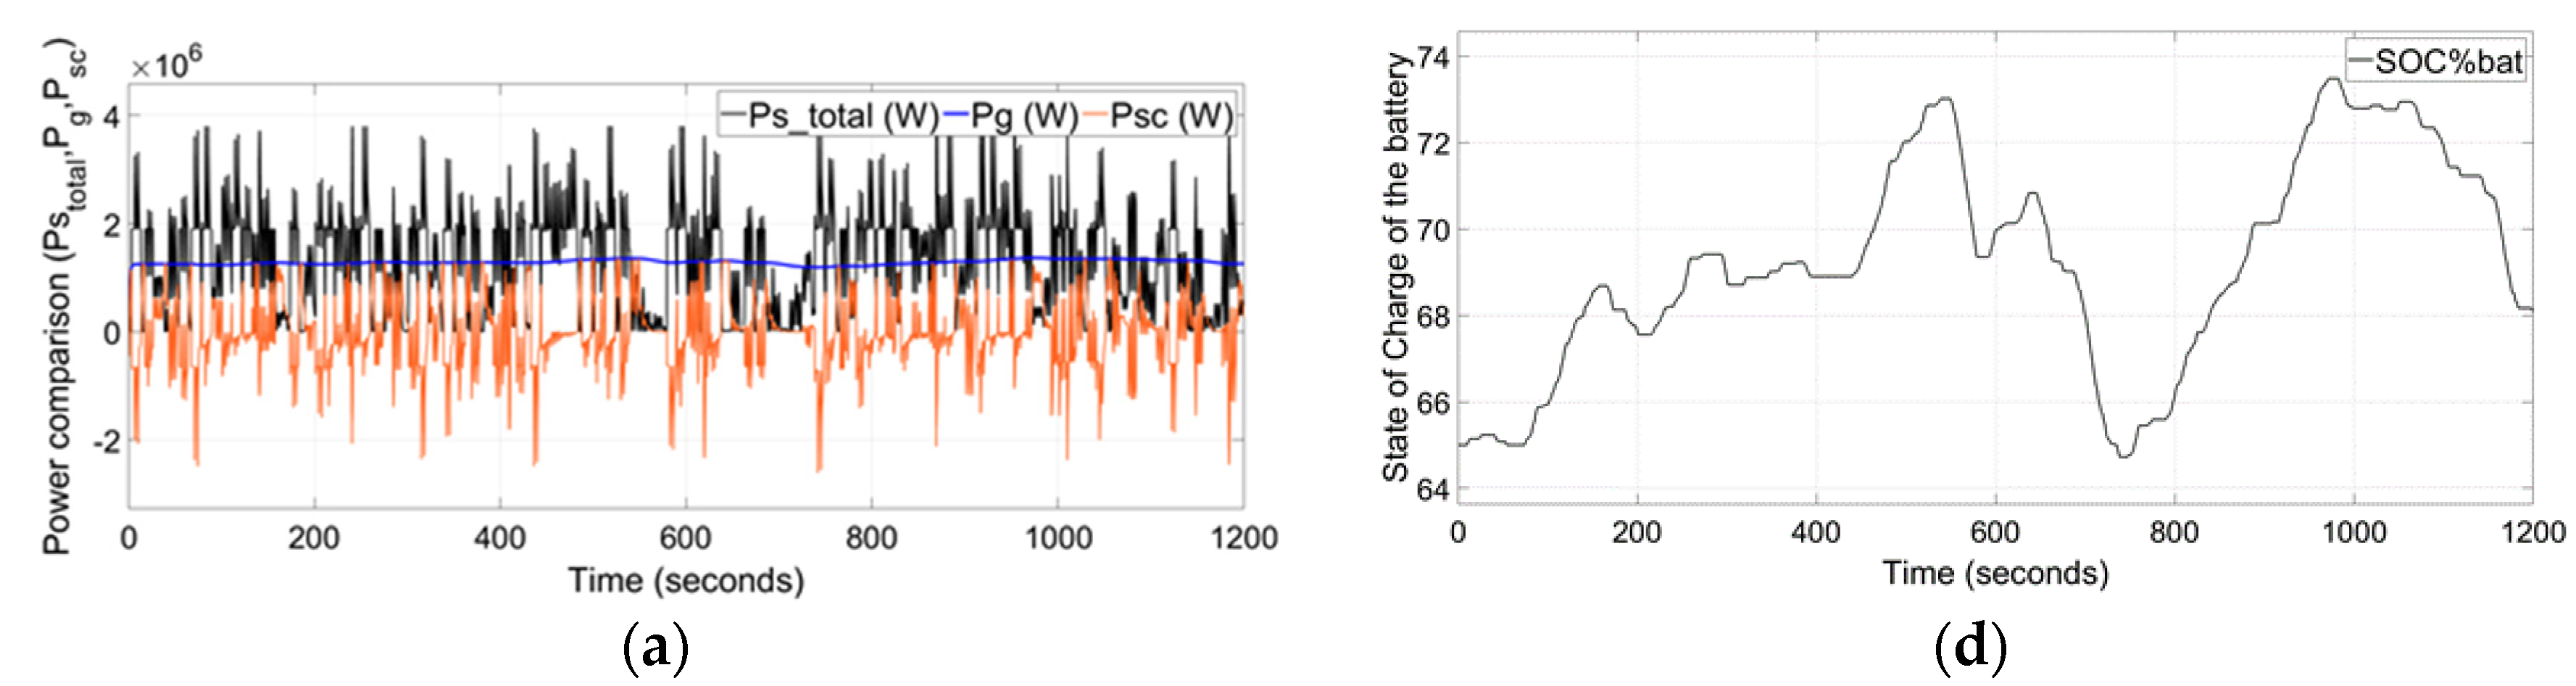
4.3. Third Case Study: Array of VOWC
The third case study was designed for an array of three isolated VOWCs.
The pressure heads of the VOWC chamber #1, #3, and #5 are shown in
Figure 5a. The same pressure head that occurs in #1 occurs in #3 after 3.25 s and in #5 after 6.5 s. due to the configuration of the array.
Figure 5b depicts the VOWC #1, #3, and #5 air-turbine torques.
Figure 5c depicts the VOWC #1, #3, and #5 turbine-generator rotor angular speeds. The controllers have maintained the angular speeds of all the air turbines within the set range.
Figure 6a, shows the output power of the turbine-generator, supply power to the grid, and supercapacitor. The Li-ion battery power is illustrated in
Figure 3b.
Figure 6c,d depict the enlarged version of grid power and Li-ion battery SOC%. The supply power to the grid is maintained with a 39.6 F supercapacitor. The power output is gradually varied between 1250 to 1370 kW, from start to the end, 1200 s. The DC-link voltage is controlled close to its reference within 14% deviation as shown in
Figure 6e.
Figure 6f depicts the SOCs of the supercapacitor and Li-ion battery.
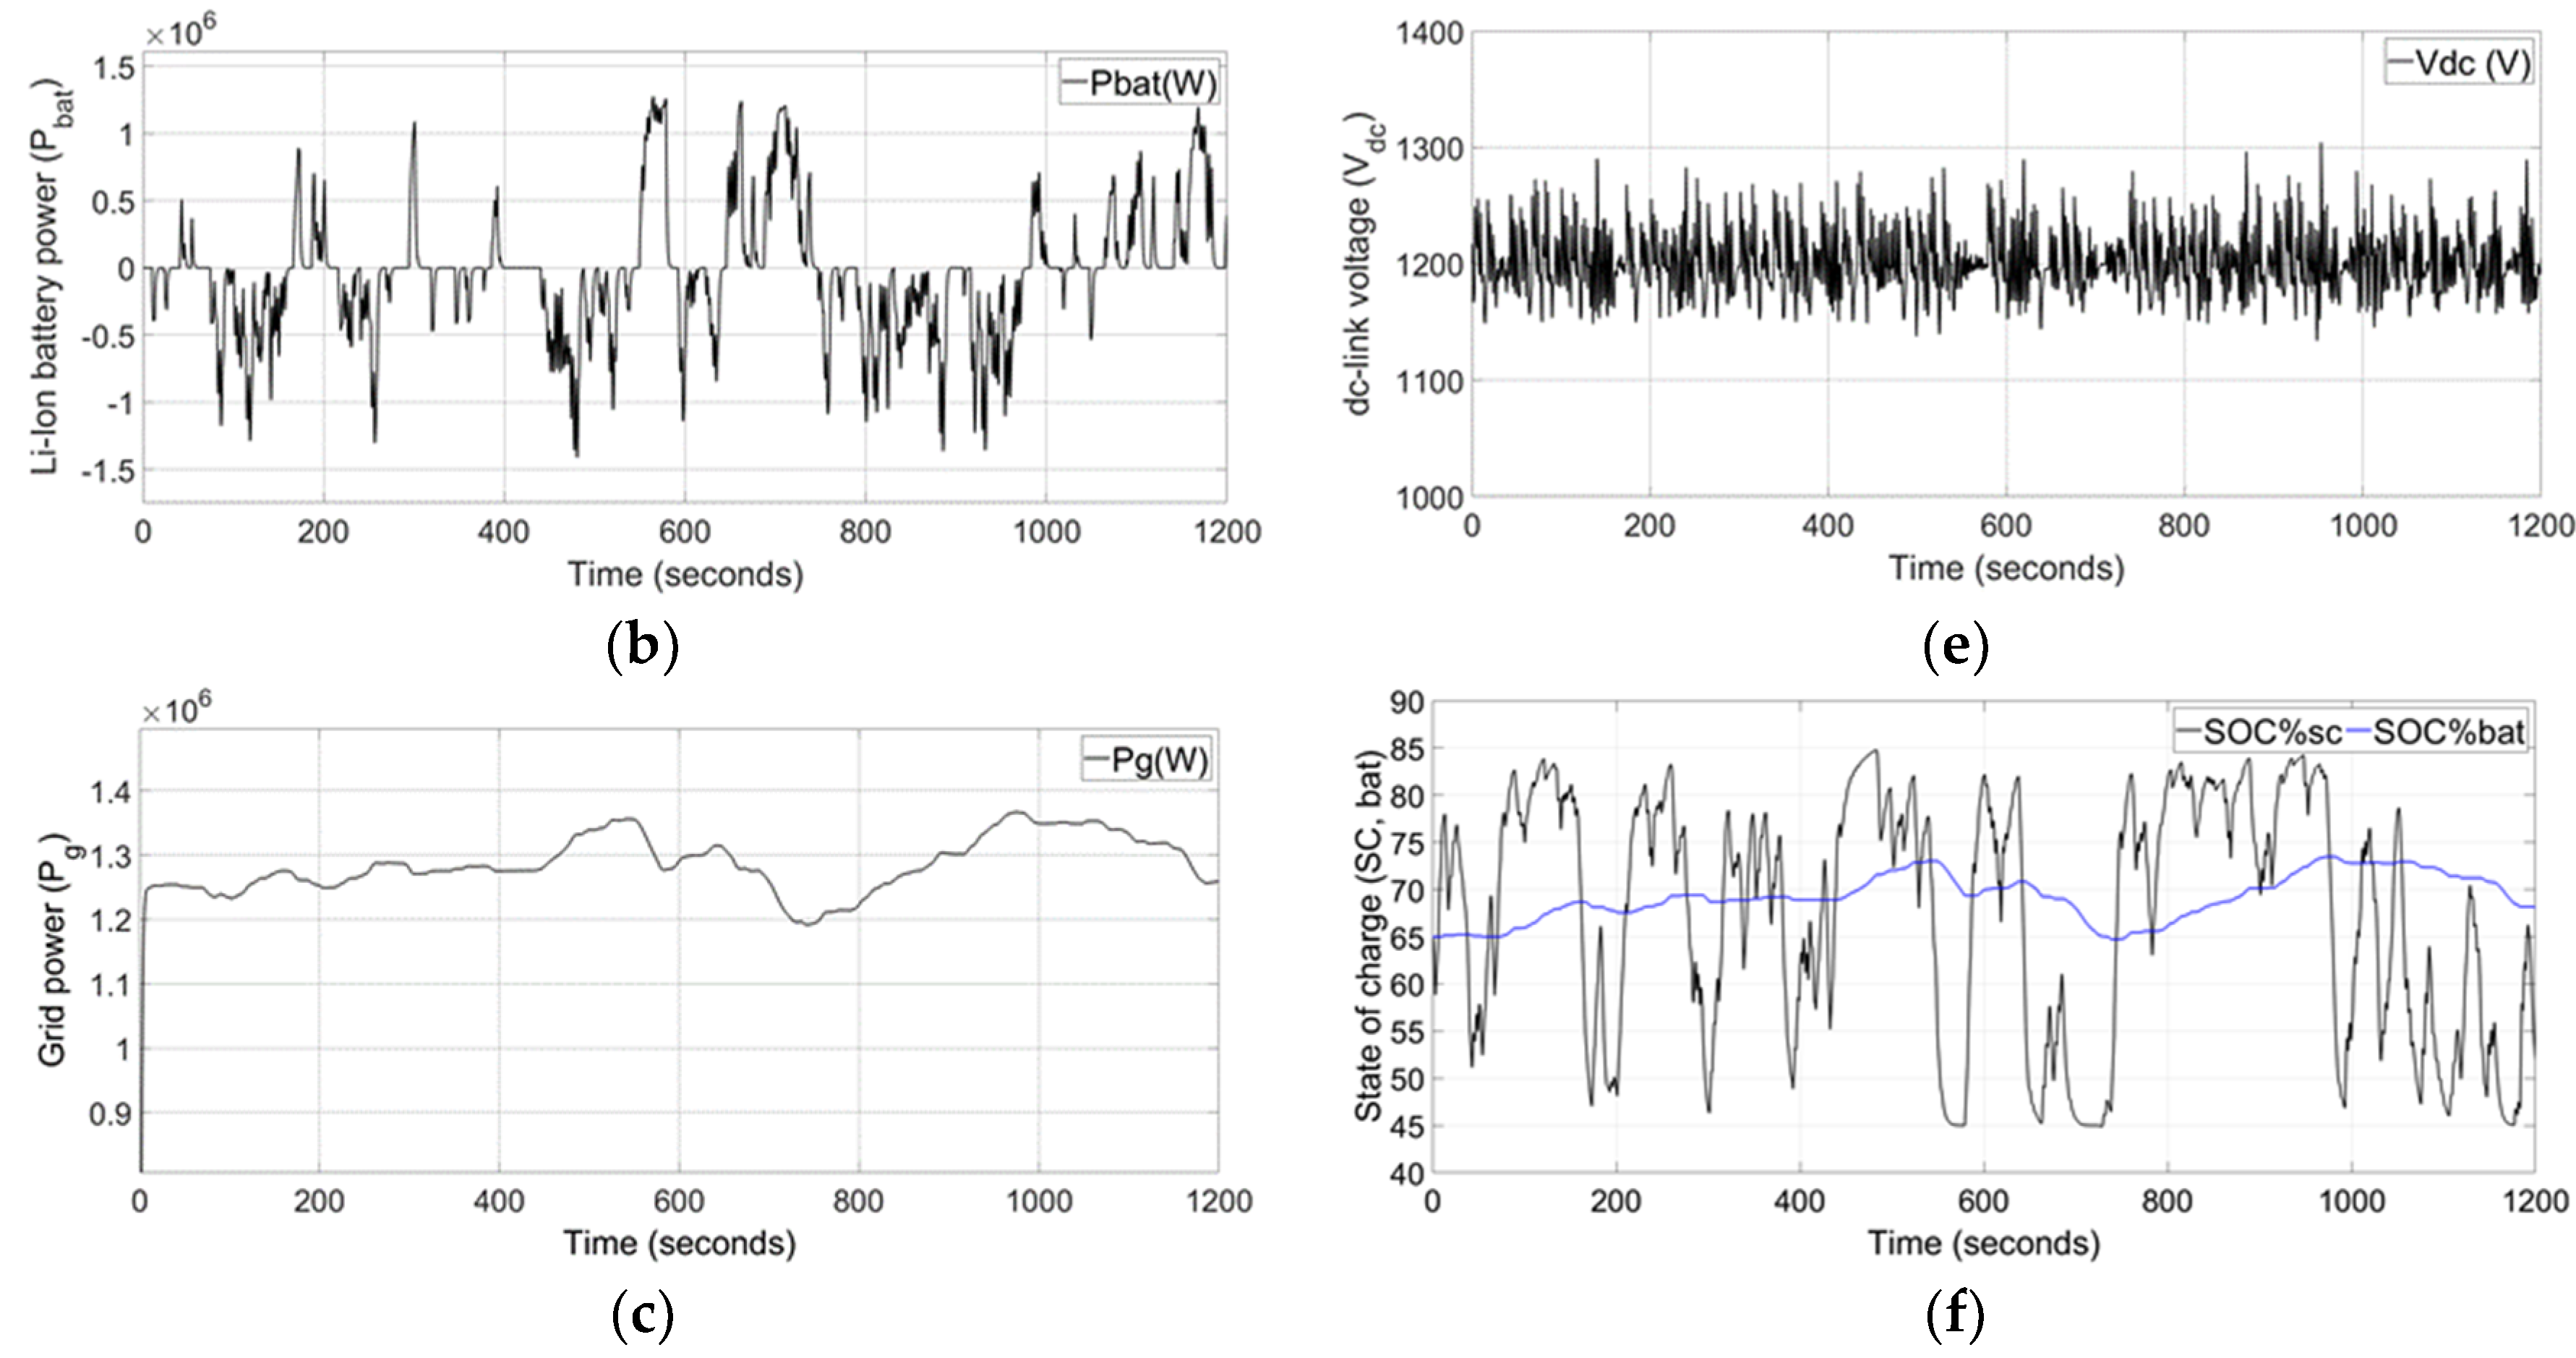
4.4. Fourth Case Study: Array of VOWCDBW
The fourth case study was designed for an array of VOWCDBWs with two detached VOWCs in each breakwater. As in the third case study, the pressure heads of VOWCs in the VOWCDBW #1, #2, and #3 experience the same pressure head that occurs in VOWC #1 and #2, in VOWC #3 and #4 after 3.25 s, and in VOWC #5 and #6 after 6.5 s due to the configuration of the array.
The simulation results of powers, turbine-generator output power, supply power to the grid, and supercapacitor power are illustrated in
Figure 7a.
Figure 7b depicts the Li-ion battery power.
Figure 7c,d shows the enlarged version of grid power and Li-ion battery SOC%, respectively. The supply power to the grid is maintained with a 39.6 F supercapacitor. The power output is gradually varied between 2300 to 2717 kW, from start to the end, for 1200 s. The DC-link voltage is regulated close to its reference within 14% deviation as shown in
Figure 7e. The SOCs of the supercapacitor and Li-ion battery are depicted in
Figure 7f.
Table 2 summarises the results of the study and reveals that placing two VOWCs in the detached breakwater almost doubled the average generated power. Nevertheless, this approach increased the required SCES capacity. VOWCs in array configurations with correct layout effectively smoothed the generated power taking advantage of temporal and spatial distribution of waves. This approach not only increased the average generated power by the product of the number of devices but also allowed use of the same ESS capacity as a single detached breakwater with reduced power deviations. Although results are for VWOCs, they are still applicable to a standard OWC configuration.
5. Conclusions
The paper presents four case studies of individual and array configurations of grid connected VOWC wave energy converters with battery/supercapacitor hybrid energy storage systems. Simulation results are used to determine the effect of different configurations on power quality and energy storage sizing. Results of the study reveal that placing two VOWCs in the detached breakwater doubles the average generated power with the cost of increased SCES capacity. In contrast, VOWCs in array configurations have effectively smoothed the generated power, reducing the required capacity of the energy storage system. This approach contributes towards cost reductions to compete with other renewable energy technologies. Moreover, this study is adaptable into existing ocean structures or future developments such as breakwaters.
This study can be considered as a preliminary study, which compares effects on grid power and ESS sizing when the VOWCs are placed in different array configurations. Although the results obtained from software simulation are promising for air-turbine aerodynamic efficiency, generator efficiency, efficiency of power electronics, and efficiency reductions/fluctuations of VOWC array devices should be analysed to determine the best configuration.


