Article

Experimental, Numerical and Application Analysis of Hydrokinetic Turbine Performance with Fixed Rotating Blades

1
Department of Mechanical Engineering, Faculty of Engineering, Giresun University, 28200 Giresun, Turkey
2
Department of Electrical and Electronics Engineering, Faculty of Engineering, Giresun University, 28200 Giresun, Turkey
*
Author to whom correspondence should be addressed.
Energies 2020, 13(3), 766; https://doi.org/10.3390/en13030766
Submission received: 5 January 2020 / Revised: 6 February 2020 / Accepted: 7 February 2020 / Published: 9 February 2020
(This article belongs to the Section B: Energy and Environment)

Abstract

:
In this study, a hydrokinetic turbine is designed for the high-altitude regions where local electricity network lines are difficult to reach. If there was a stream flow around, electricity production could be possible and necessary because of environmental reasons. The performance of the hydrokinetic turbine was investigated experimentally and numerically. The numerical analyses of the turbine system were performed via MATLAB/Simulink version R2014a. Except power-based performance characteristics, efficiency of the system in terms of installation and necessary investment costs were also investigated. It is calculated that the system to be established on a river with a water flow rate of 30 m3/h will meet the investment cost in approximately 8 years.

Graphical Abstract

1. Introduction

A total of 85% of the world’s energy is supplied from fossil fuels containing anthropogenic GHG gases with a portion of 56% [1]. Fossil fuels, which cause pollution and climate change, are not easily available in all geographical areas of the world. Especially in high altitude regions, renewable energy resources become more efficient. There are varieties of renewable energy conversion systems such as: solar power, wind, and hydrokinetic conversion systems [2,3,4].
Hydrokinetic turbines have very similar design and theoretical background to wind and hydrodynamic conversions such that all of those systems offer clean energy with a low environmental effect [5,6]. Most of the recent studies were intend to increase the efficiency of hydrokinetic machines in terms of power coefficient and hydro dynamical properties by avoiding system losses [7,8].
Since water has a significantly higher density than air, hydrokinetic energy conversion systems can provide same energy in a smaller rotor sweeping area compared to wind energy conversion systems. However, both systems showed the Betz value as 59.3% for the maximum theoretical conversion efficiency [9,10].
Hydrokinetic turbines were mainly classified as vertical, cross-flow, venture, and horizontal turbines where vertical turbines defined as the turbines those have lift or drag type blades on its rotational axis of rotor which was vertical to the water surface [10,11]. Besides, these blades can be produced and mounted by different ways such that types of vertical turbines come existence; Savonius, H-Type, Darrieus, Helical turbine. Savonius turbines have good initiation characteristics with simple constructional features [9]. Detailed assessment of various turbine systems along with their classification and qualitative comparison can be found in the study of Khan et al. [11]
Hydrokinetic turbines are especially used in pumping systems or battery charging in remote locations. Marine and river currents at high altitude have a reliable hydrokinetic energy potential where high quality production with smooth materials for water channels may increase the efficiency of that potential [12]. Besides smooth surface diffusers may have a positive contribution on the power efficiency of Savonius type hydrokinetic turbines. Also, there may be some disadvantages of using vertical Savonius type hydrokinetic turbines. Most effective disadvantage is the blockage effect of water current contacting with two blades at the same time. These effect can be eliminate by using fixed rotating blades [12].
Countries like Turkey and Brazil those have important hydrokinetic energy potential, encourage investigations about generating electricity from water flows at high altitudes [3,13,14]. Share of the electricity generated by using the hydraulic power in total electricity generation is still less than 20% in Turkey [13,14,15]. From this point of view, laboratory scaled electromechanically alternatives of hydrokinetic turbines were tested experimentally in order to increase the electric generation efficiency [10,16]. It is the average height of 1132 m in Turkey, represents the hosting hydrokinetic potential. In the recent period, the settlement in these high-altitude lands and plateaus has been increasing [17,18,19]. It is a high cost operation to take electricity from the central system to those sparse settlement, which is made in a large and remote area to the cities. In some such areas, the consumption made on the electricity line meets the cost of the line in decades. Hydrokinetic power may offer an ecology friendly sustainable solution for this problem.
In many research and development projects, whether academic or industrial, empirical studies may provide clear data about the results. However, numerical studies were an important method of analysis that provides a more thorough analysis of the process stages and information for experimental studies with approximate results [20].
These numerical analyzes were carried out to examine the process stages or to evaluate the process products [21,22]. Being a simple integer considered matrix operator, allowing vectorized operations and offering graphical output interactions MATLAB simulation becomes a useful tool for turbine analysis. Likewise, a wind turbine analysis or a vortex analysis can be easily done by MATLAB Simulink [23,24]. On the other hand, numerical investigations those are called computational fluid dynamics can be carried out by finite element method. Comparing by the finite element method, MATLAB/Simulink can analyze the performance parameters of the model easily. Commercial software can perform analysis to study the performance parameters of turbines in a various engineering aspect although they raise the cost of the study [25].
When the costs of the system are continued to be considered, it is predicted that the costs of classical type energy production systems will increase. Therefore, renewable resources, which are expected to decrease in c/kWh cost in the long term, come to the forefront [13].
In this study, a hydrokinetic turbine with fixed rotating blades developed in aim to offer a sustainable and ecological solution proposal that can meet the increased electricity consumption in high altitude regions has been investigated electrically, mechanically, and economically. The electrical potential and efficiency of the vertical hydrokinetic turbine which generate electricity under the river currents in high altitude areas, were studied by modeling environmental conditions at the laboratory. In order to increase the efficiency of the vertical hydrokinetic turbine, fixed rotating blades was used in its design. The flow rate, rotating speed, generator power, and electrical potential data obtained from Savonius type hydrokinetic turbine were processed with MATLAB/Simulink and the competence of a living environment was investigated. In the sense of the results obtained, the use of a clean, renewable, and continuous alternative energy source for high altitude regions was examined by taking into account the efficiency of the system and the initial investment cost.

2. Materials and Methods

Experimental setup has been established in the first stage of this study. MATLAB/Simulink analysis were performed to check the data obtained from experiments. At the final stage the application possibility of this system was investigated in the name of power production cost.
The whole experimental set up consists of a vertical axis hydrokinetic turbine with fixed rotating blades, speed increasing mechanism, DC generator, rectifier, battery bank and inverter. The data was transferred to the computer via sensors and data transfer card. The principle view of whole system is given in Figure 1 [5].
Hydrokinetic turbine is the mechanism that converts the kinetic energy of water into motion energy on a rotor. The rotor was coupled with a DC generator which is the electrical part that converts the motion of the turbine rotor to electric energy. Water flow and electricity generation will be continuous. However, electricity consumption will be variable according to time. Therefore, the electric energy produced from the system must be stored. Battery bank is used for storage. As a result of the information obtained from the literature and preliminary calculations, it is accepted that the 12 V 1200 Ah capacity battery group will be suitable. The inverter converts the DC current produced by the batteries to 220 V 50 Hz AC current required in the houses. Although three phase generators are cheaper and more efficient than DC generators because of the unstable flow regime of water supply DC system used with the accumulators.
Figure 1 shows the main block diagram details of electric and data transfer setup for experiments. The data obtained from this system will be used in MATLAB/Simulink analysis. The data transfer card is a 37 Pin NI PCI 6221 (National Instrument, Austin, TX, USA) that can plug on to the mother board of the PC and can transfer the data through MATLAB/Simulink.

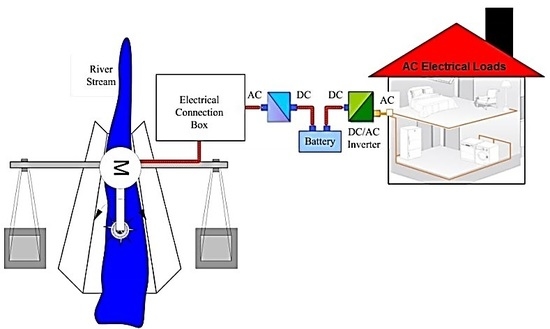
2.1. Experimental Setup

In order to model environmental situation, an experimental setup was established in the laboratory. The river current was created by two electric water pumps. The pumps were chosen from high flow rate with low pressure ones. The water guided into a vertical diffuser so that the pressure provided by the pumps minimized, after the vertical diffuser water current passes thorough the flow meter and reaches the vertical turbine blades. The electric generator coupled to the blade vertical rotor but it is also attached to the experimental setup body in order to avoid its weight. The experimental setup is shown in Figure 2.
The vertical hydrokinetic turbine efficiency was increased by fixed guiding blade. It was assembled to the surface of the rotating blade surface. The fixed blade guides the water in to avoid effecting two blades at the same time. The theoretical design of vertical axis rotating blades with fixed rotating geometry is shown in Figure 3. Upstream flow is the water current entering to the turbine that has a higher velocity of downstream flow.
Vertical axis hydrokinetic turbines with straight blades expose low coefficient of power (Cp) with respect of tip speed ratio (TSR) [26]. Low flow rates such as 1.1–1.3 m/s may cause the generator to rotate at low speeds or even fail to generate electricity. In order to avoid these negative effects, a gear mechanism is installed at the input of the generator. This mechanism triples the rotation speed in the form of a gearbox before the generator. Figure 4 shows the principle of gearbox mechanism of the DC generator.

2.2. The Mathematical Model

The mathematical model of hydrokinetic turbines was based on generalized actuator disc theory. The most important parameter about hydrokinetic energy conversion systems was the non-dimensional power coefficient, Cp. The power coefficient represents the portion of energy that was converted from the water current by the hydrokinetic turbine. Equation (1) defines the coefficient of power;
C p = P 0.5   ρ V 3 A r
where P is the turbines power output, ρ is the density of water, V is the water velocity which is mentioned as upstream flow in Figure 2, and Ar is the cross sectional area of the rotor or the projected area of the rotor [27]. On the other hand, P can be calculated by two ways; mechanical calculation and electrical calculation;
Mechanical Calculation  P = wT
Electrical Calculation  P = Ve
where, w is the angular velocity, T is the torque, Ve is the electric voltage, I is the electrical current. The tip speed ratio, TSR is the ratio of rotor tangential velocity to upstream flow velocity and it is defined in Equation (4);
TSR = wR / V
where R is the radius of runner. TSR versus Cp diagrams shows the characteristics of hydrokinetic turbine. Also, clearance coefficient (Ch) which is defined as the ratio of water height above the turbine blades (H) to the blade height in runner (L) is an important characteristic of turbines.
C h = H L
It is possible to classify water flows as rivers, tides, ocean/sea, and man-made flow channels. The Manning equation expressing the flow in man-made channels is given in Equation (6) which is taken from the literature [28,29]. The equation is empirical and is a function of flow and geometry. It can be observed that the roughness of flow channel has a significant effect on flow rate in Equation (6).
Q = VA c = 1 n A c R 2 3 S
Q, is the flow rate (m3/s), Ac is the cross-sectional area of flow channel (m2), n is the Manning’s roughness coefficient, R is the hydraulic radius (m), S is the channel slope (m/m) in Equation (6).

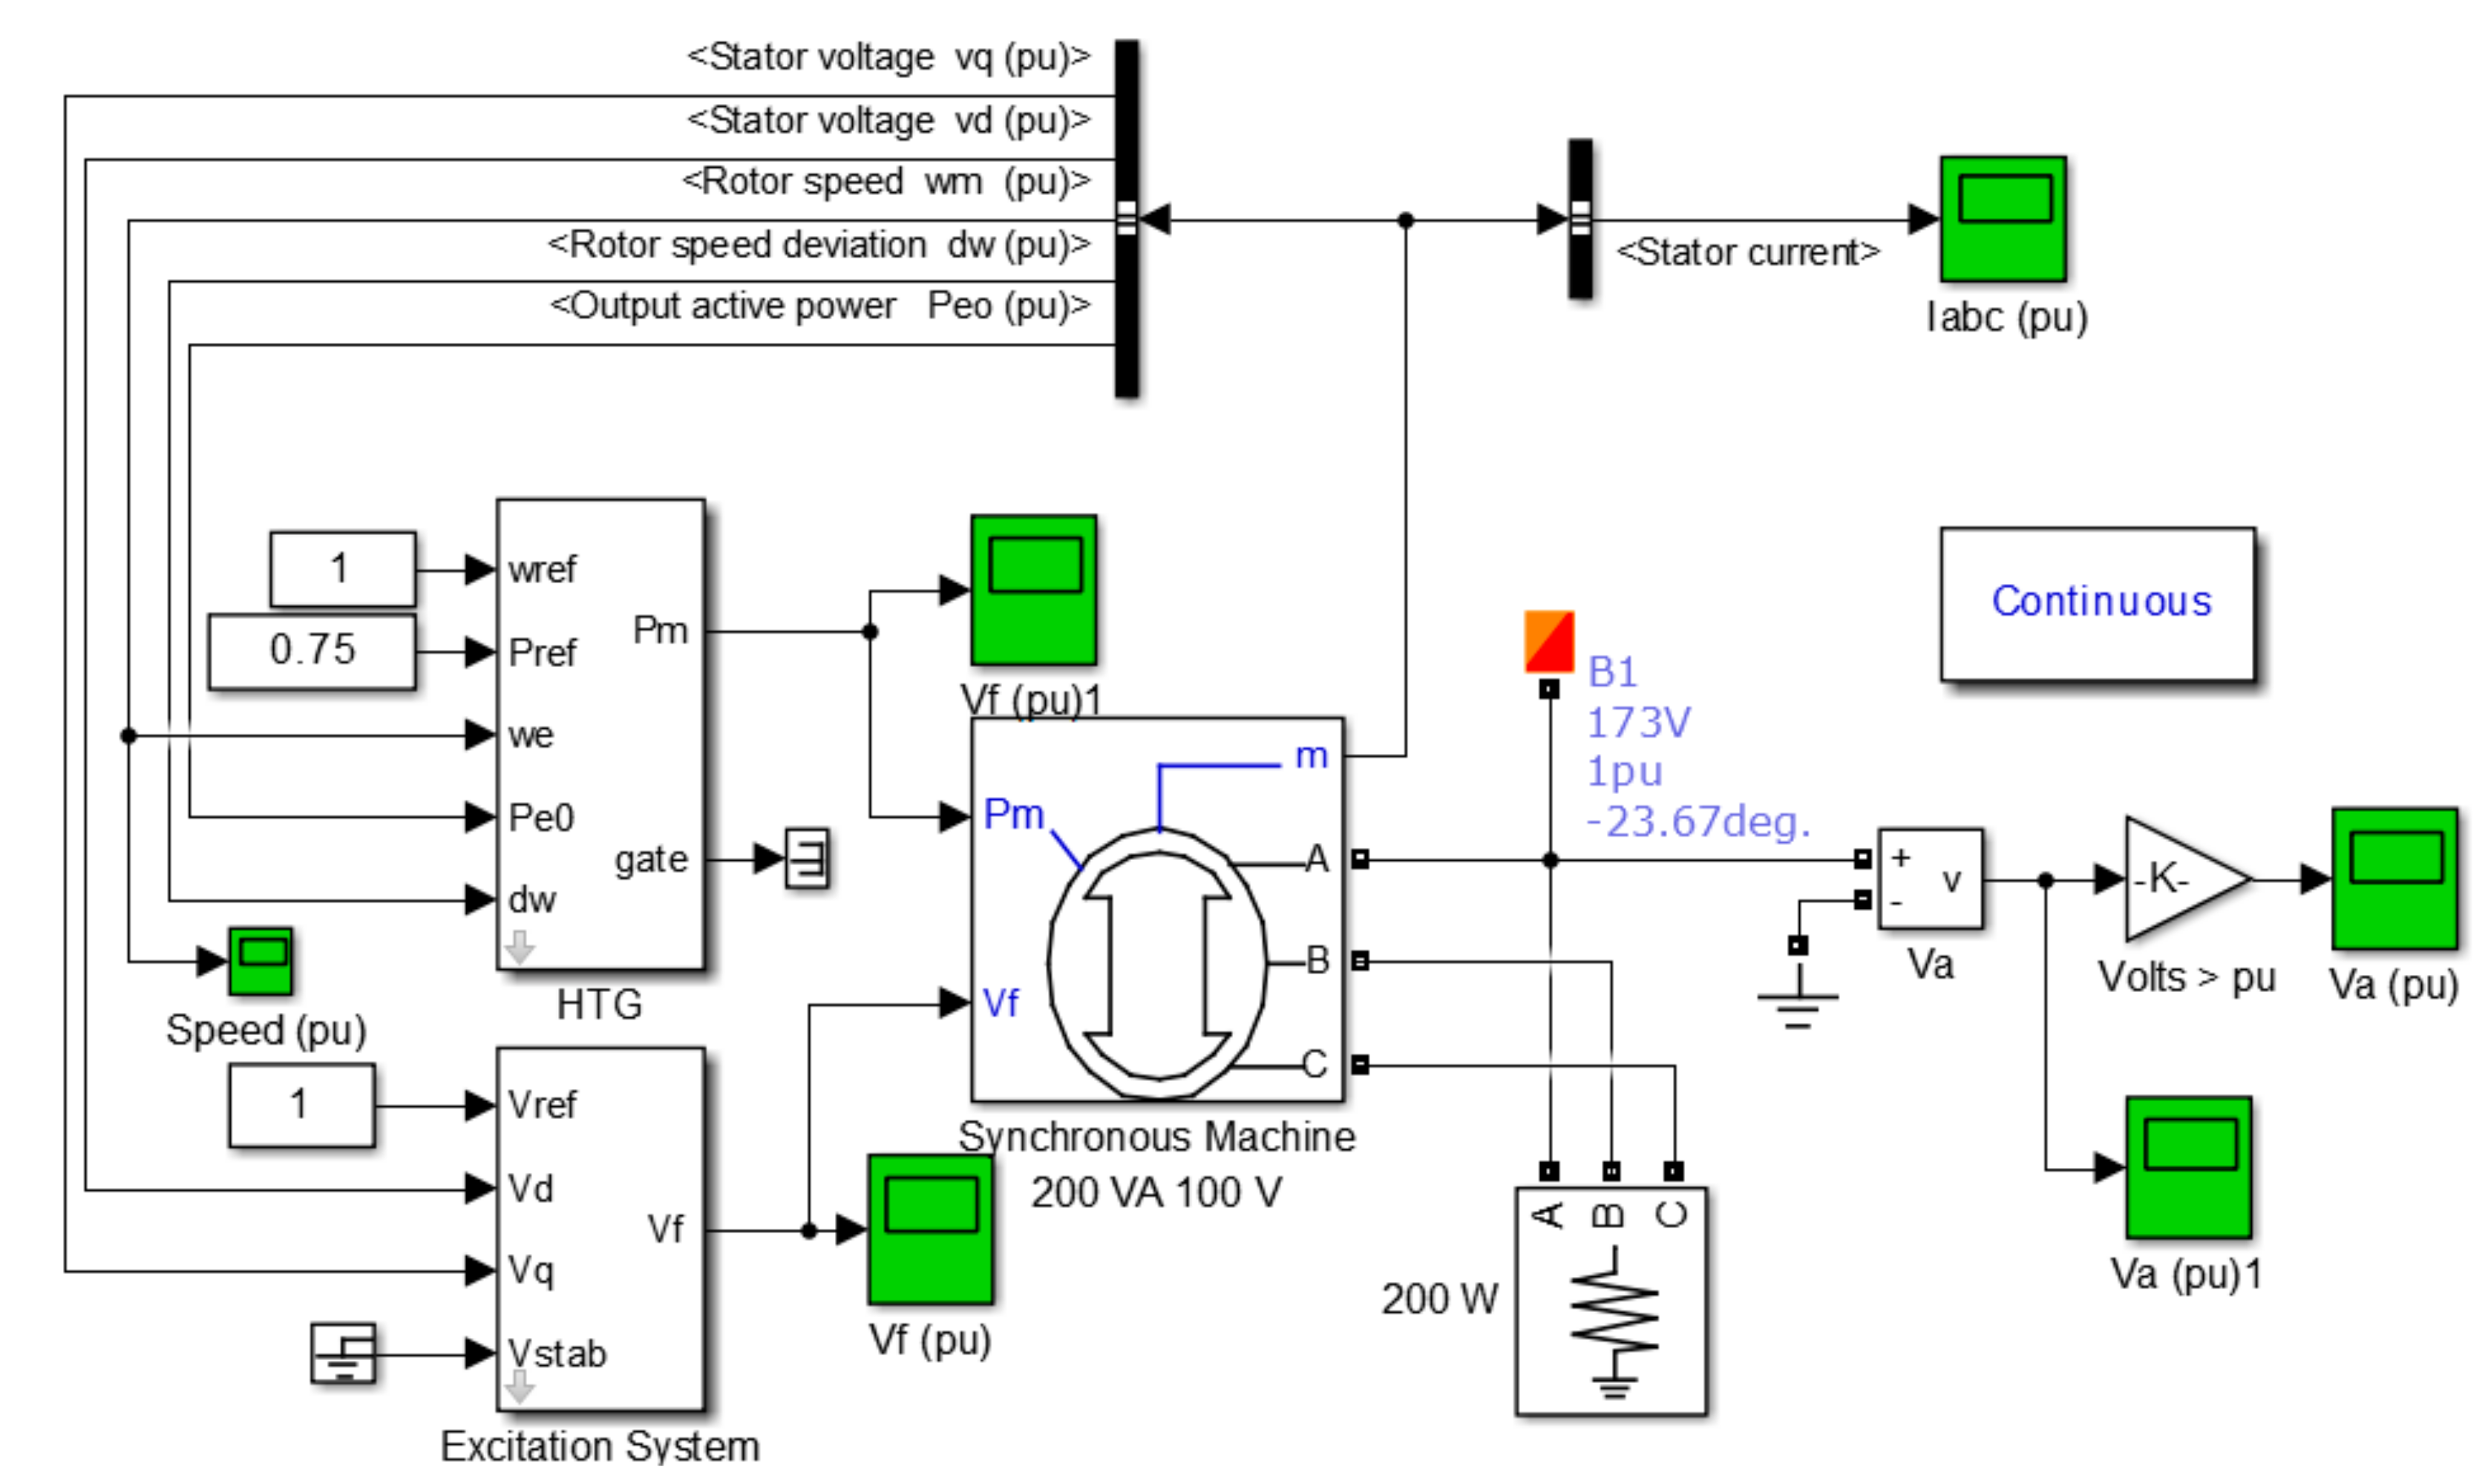
2.3. System Matlab/Simulink Model

In the experimental system, the battery and DC-DC converter system have been added to store the energy when the production is more than consumption in order to meet the interruptions in production caused by the variable water flow in the streams and to provide continuous energy to the loads. Since DC generator is used as the energy producing machine in the system, DC-DC converter is used for battery charging with the DC voltage produced. However, power generation in hydraulic power plants is mostly realized with synchronous generators. Therefore, in simulation, energy production is provided by direct synchronous generator.
Since the optimization of the system is a time-consuming process, the real model of the experimental setup is examined through numerical analyzes. The system is modeled in MATLAB SimElectrics environment for the process of optimizing experimental setup. All elements of the system are created in SimElectrics using MATLAB models. The main purpose of this stage is to provide the improvement and development requirements in the experimental setup before the experiments begin. Figure 5 shows the MATLAB/Simulink circuit with the parameters of the experimental system. The synchronous generator that converts the mechanical power of the turbine to electrical energy and produces an output power in the range of 200–210 W is used in the circuit. The turbine control system generates the necessary signals to the excitation system of the turbine according to the speed and power references given based on fuzzy logic.
Heuristic control rules are digitizing fuzzy logic control algorithm. Fuzzy logic can be evaluated uncertain, fuzzy sets and rules for expressing linguistic terms [30,31].
The fact that verbal variables should be used instead of numerical variables is the most important feature that distinguishes the concept of fuzzy set from the classical set concept. The fuzzy logic controller system of this study is generally shown in Figure 6a. The fuzzy logic controller consists of three basic parts. These are “Fuzzification,” “Rule Base,” and “Defuzzification” sections. Fuzzification is the section that converts the data obtained from the system into fuzzy values. The second part is the rule base, where fuzzy data is processed with fuzzy rules [32]. In the final phase, which is called defuzzification, the data is converted to a precise number of fuzzy results. The schematic model of fuzzy logic based turbine control system can be seen in Figure 6b.

3. Results

In this study, an experimental setup of vertical hydrokinetic turbine with fixed rotating blades was established to model electricity generation from rivers in high altitude areas. The mechanical data obtained by an electrical control unit and transferred to a computer. Main goal of the study was investigating a continuous and sustainable source of electricity for a house in high altitude region.

3.1. Experimental Results

In order to examine the mechanical performance of the vertical hydrokinetic turbine, tip speed ratio vs. coefficient of power diagram was performed. It can be seen from the graph in Figure 7 that the coefficient of power increase by a parabolic trend with the increase of flow speed. The trendline of the graph is getting almost parallel to the x axis meaning that it will not increase the efficiency by more flow speed increase. The highest value of TSR obtained from the experiments was 2.55 and the coefficient of power was 0.368 in this TSR value. The minimum TSR was 0.5 and the corresponding value of Cp was 0.048.
Cp values tend to increase parabolically till an extreme point and after that extreme point the tendency turn to decrease. In accordance with the data in the literature, it can be seen from Figure 7 that the efficiency of the vertical axis hydrokinetic turbine will go to maximum at a certain water flow and then the efficiency will decrease. Similar systems exposing 0.4 Cp can be designed but more sensitive production and higher quality materials rises up the cost of the hydrokinetic electricity generating system.
Another important data about the mechanical behavior of hydrokinetic turbine was the coefficient of clearance. The change of Ch versus TSR can be seen in Figure 8. The Ch value varies between −0.2 and 0.83 while TSR varies between 0.48 and 2.55. Ch value shows the water passing over the blade. While the TSR is low than 1, the amount of water current is not enough to fill the blade sweeping volume. Up to 2.27 of the TSR, the increase in Ch remained relatively slow and reached 0.4. From 2.27 to 2.55 of the TSR, the value of Ch doubled to 0.8.
The trendline of Ch was not similar to the trendline of Cp. The coefficient of clearance shows almost a linear increase while the coefficient of power shows a parabolic trendline by the increase of the TSR. As a sum of the results obtained so far can be said that turbine performance of the current study is compatible with the studies in the literature [33,34].
One method that can be applied to increase the overall efficiency of the system is to change the number of blades in order to increase the coefficient of power. Effects of different number of blades on system performance have been investigated in the literature [35,36].
The change of electric potential of system via flow speed is plotted. If literature is examined, it can be seen that flow speed over than 1 m/s is required to generate electrical voltage. In recent experimental setup the electric potential began to disclosure at 0.55 m/s. Although electric voltage appears to have disclosure at a lower value than the literature data, it is due to the presence of a gear mechanism coupled to the DC generator. This gear mechanism triples the frequency of turbine rotor. When the flow speed reaches to 1 m/s, the electric potential becomes 6 V. The relationship between electrical potential and flow rate shows a parabolic change also depending on the characteristics of the generator. This parabolic increase will become parallel to the horizontal axis after a point in the generator’s limits, i.e., the higher the flow speed, the higher the voltage. That is, no matter how much the flow speed increases after that point, the voltage will not increase with the same trend. When the experimental set up device is operated at maximum capacity of 30 m3/h flow rate, 214 W electricity is produced.

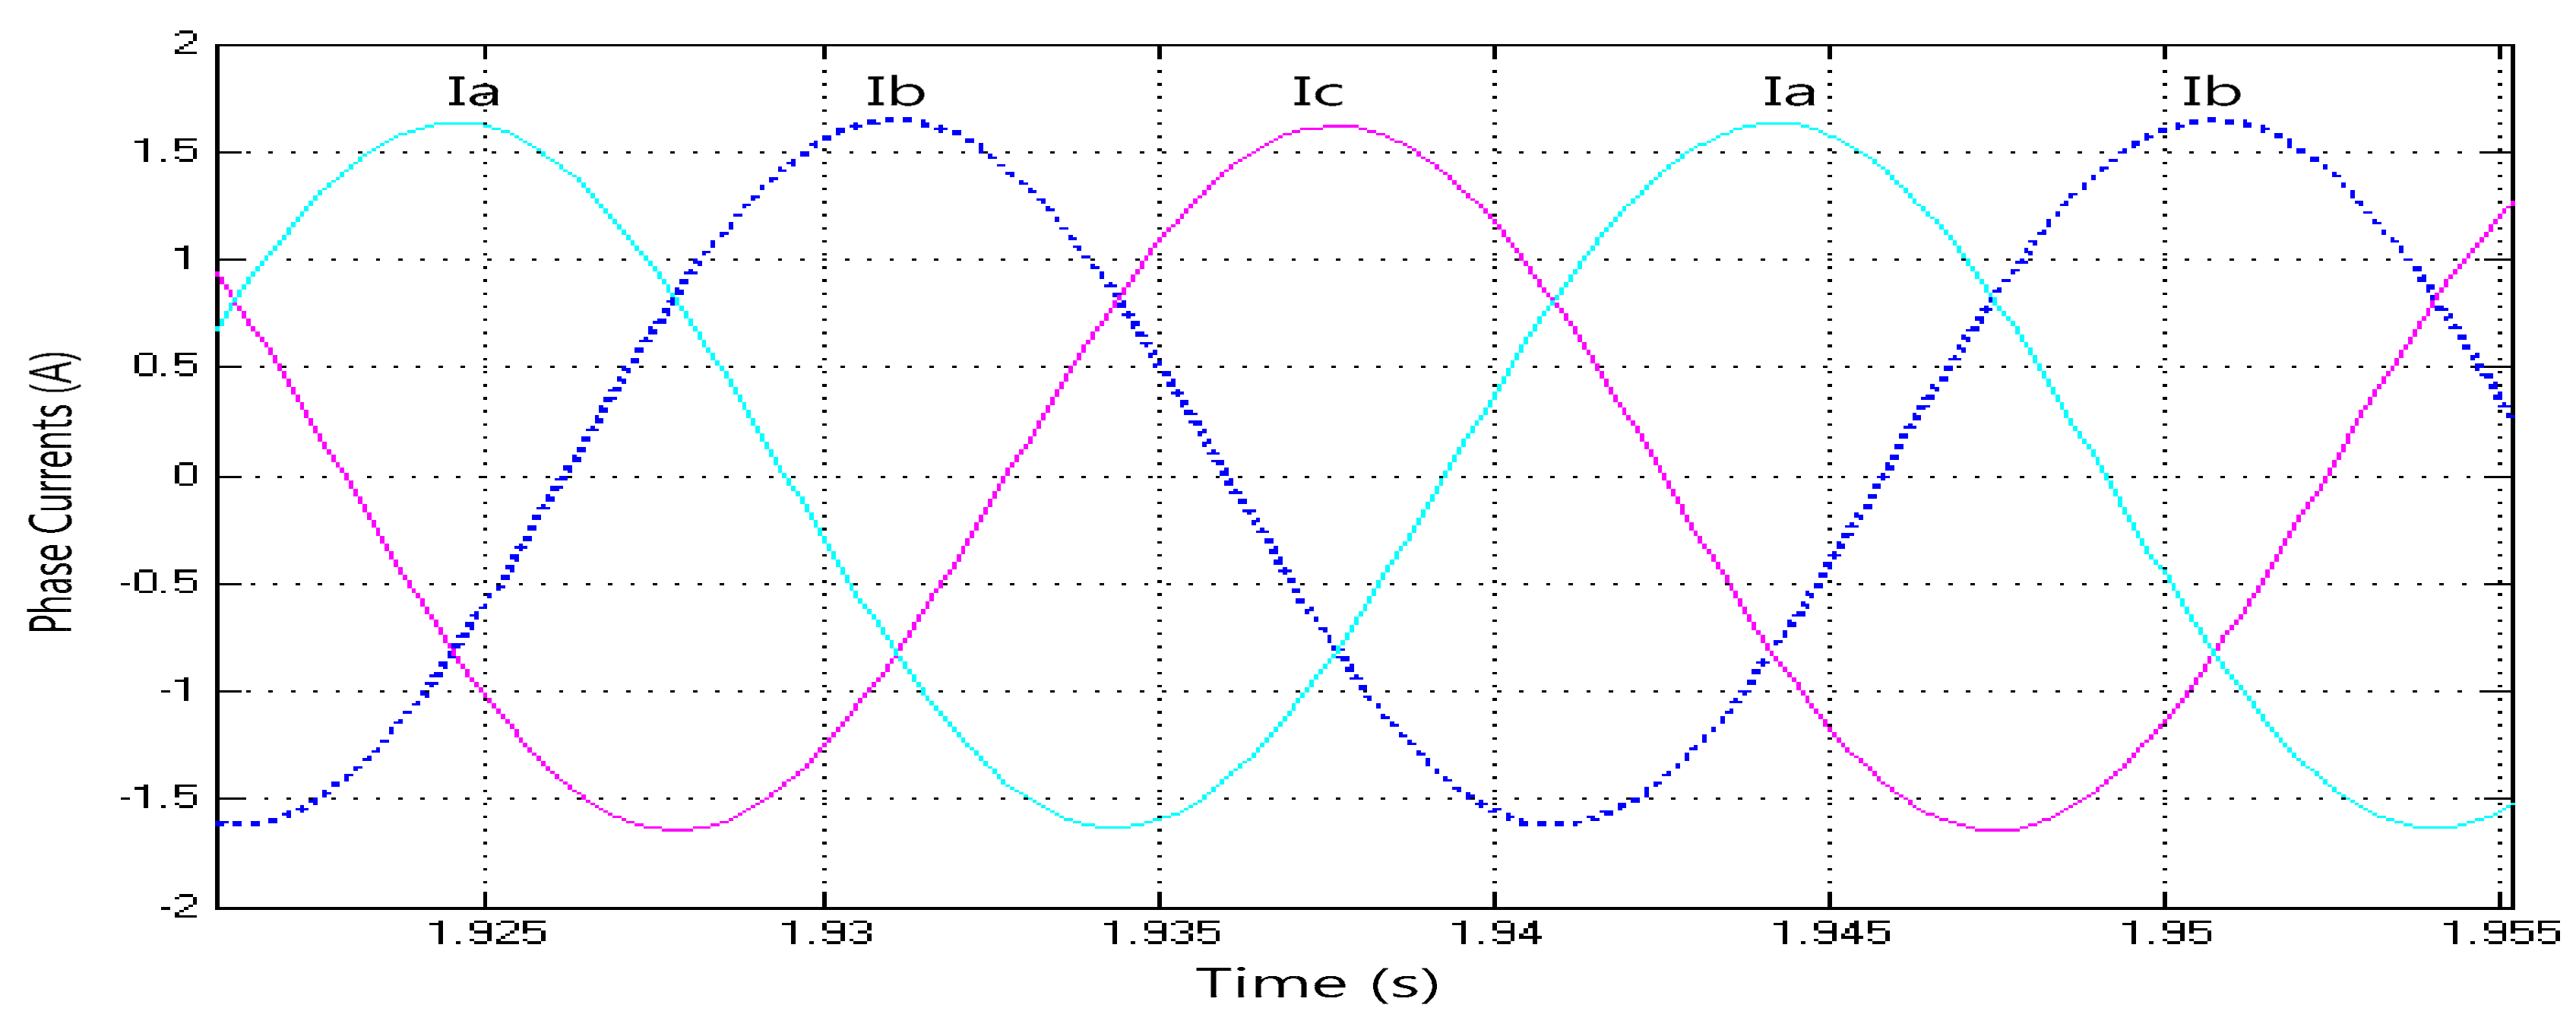
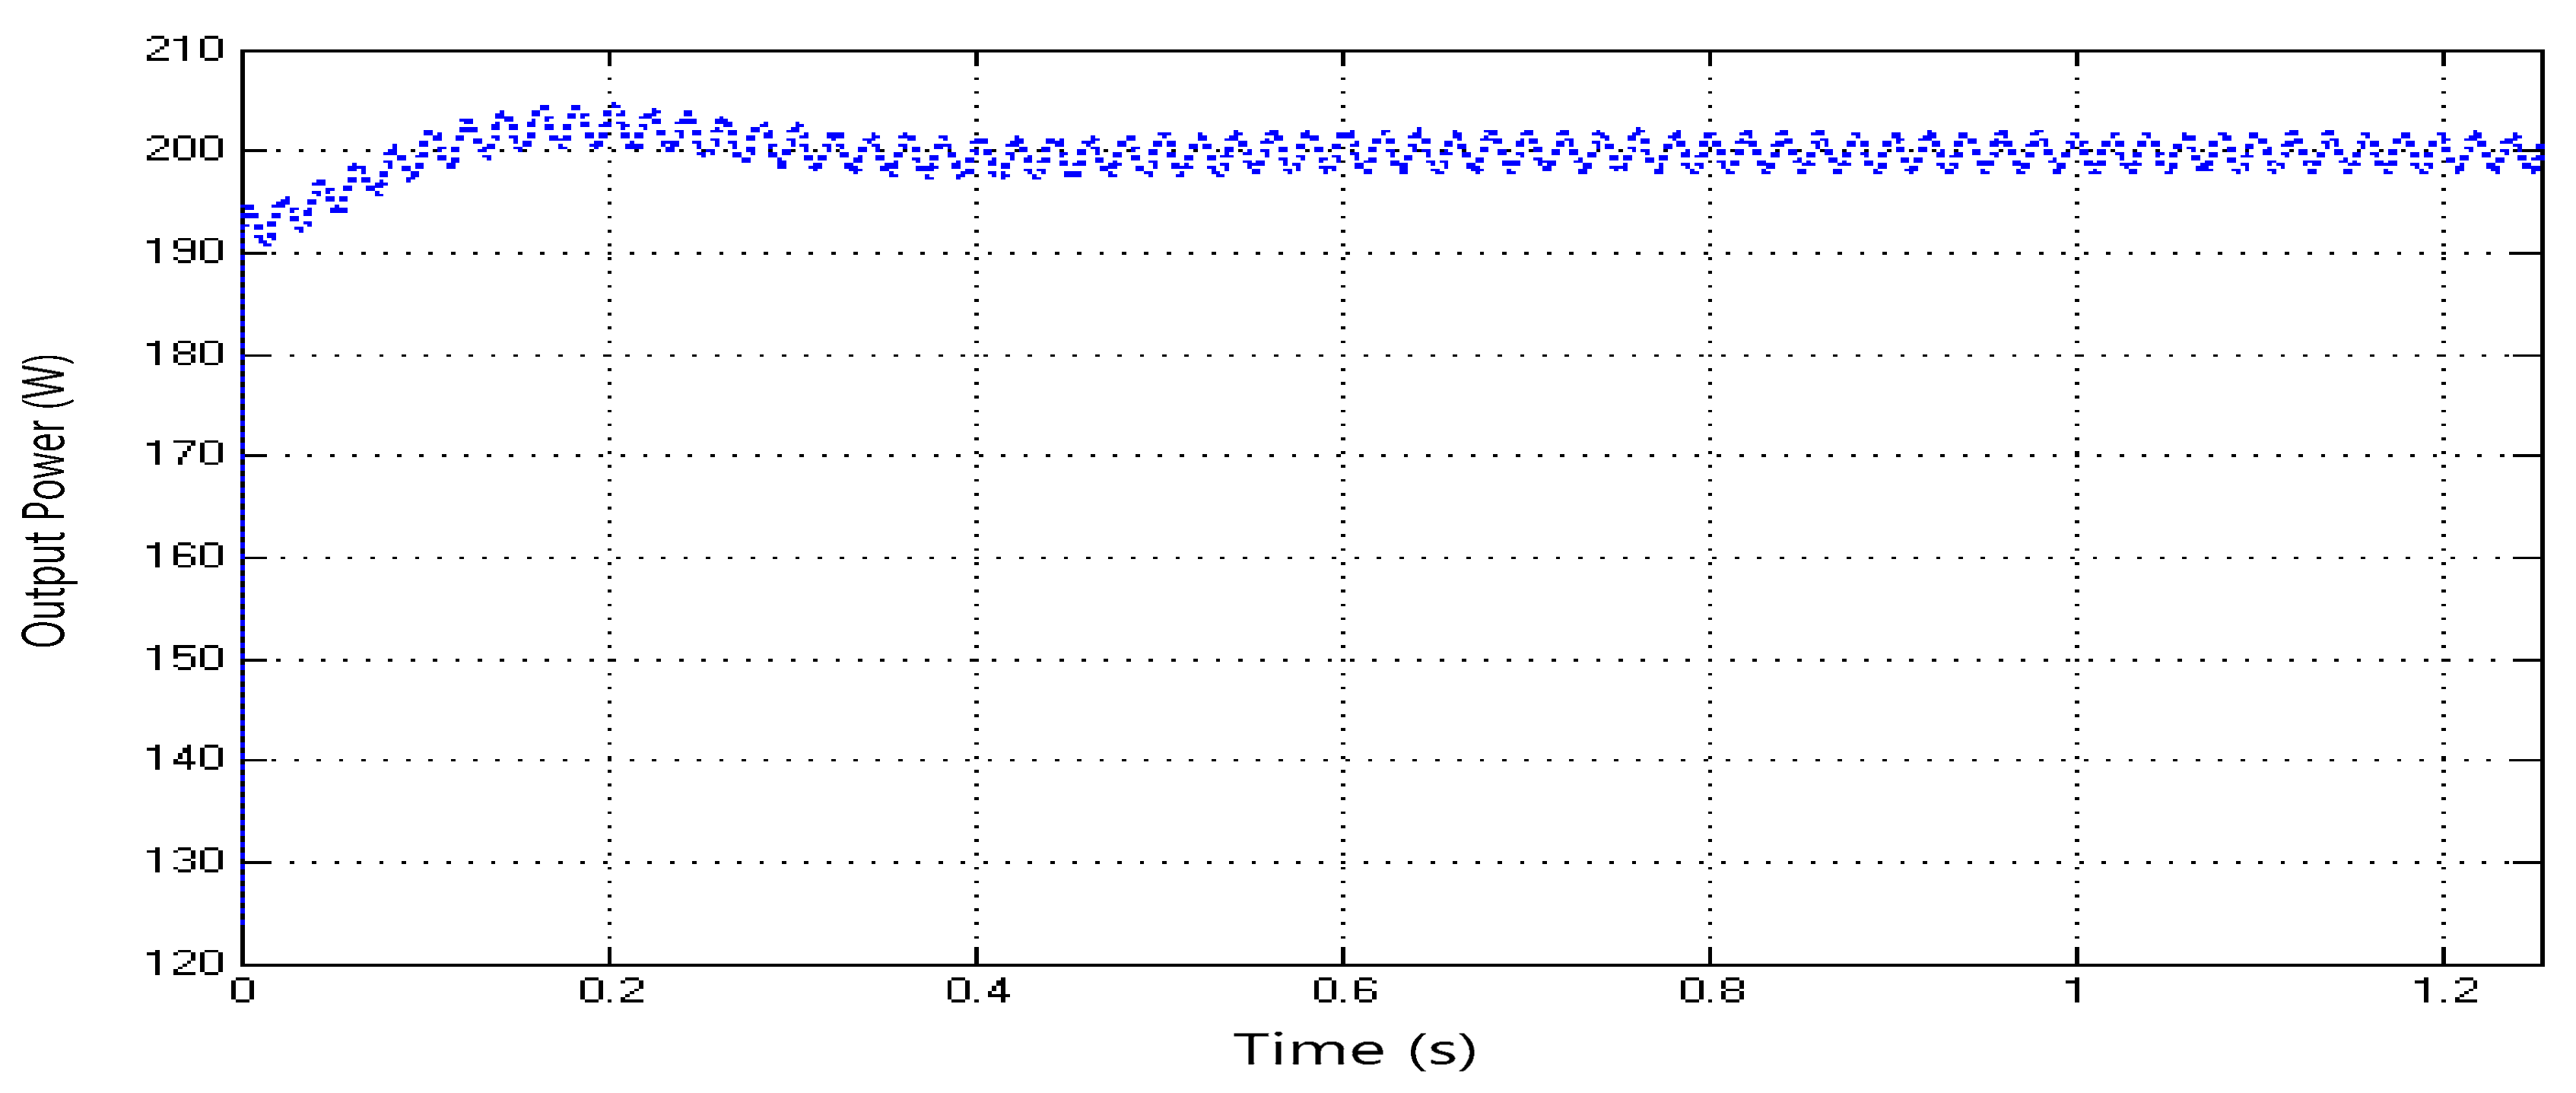
3.2. Simulink Results

MATLAB/Simulink analysis results from turbine control system based on fuzzy logic are given in this section. According to the data obtained from the analysis, the variation of generator winding currents over time is shown in Figure 9. The generator has a maximum amplitude of 1 pu per phase.
Figure 10 shows the phase currents of the load connected to the generator output obtained from the analysis results. The maximum value of the currents has an amplitude of about 1.7 (A). The current obtained here is equal to 1 pu of current obtained from the stator and verifies the system operation.
The voltage waveform of one of the generator windings is shown in Figure 11. The voltage amplitude is 80 V from the beginning of the analysis. The obtained voltage amplitude is consistent with the data obtained in the previous steps.
The instantaneous output power of the system is approximately 200 W that can be seen in Figure 11. As given in the data section of the experiments, 214 W power was obtained from the system, which indicates the compatibility of the experimental results with MATLAB/Simulink results. When the graph in Figure 12 is examined, there is a fluctuation in the power output at the beginning of the analysis but after a period of one second it reaches a stable and narrow amplitude.

3.3. Cost Analysis Results

The cost analysis was carried out to check whether the hydrokinetic turbine system meets the electric consumption of a house or not. The system cost was compared to the electricity production. For this purpose, the needs of a house and the cost of the system were determined.
The electric consumption of a house may differ because of the numbers of households and electrical appliances. Table 1 shows the average electric equipment and lists average consumption for a week in Wh.
First, it was checked whether the 214 W capacity obtained from the experimental setup meets the need of this average village house. In fact, another approach would be the reverse engineering approach to how much 214 W capacity would meet the needs. The power generated in any energy generation system cannot be transferred to consumption. The battery bank and inverter lose energy because of the efficiency of these devices. The efficiency of system (ηs) can be defined as the multiplication of the efficiency of battery bank (ηb) and the efficiency of inverter (ηi). The efficiency values for many battery banks and inverters traded globally can be taken as 85% and 90% respectively. In this case, the system efficiency can be taken as 0.765. Therefore, only 0.765, i.e., 164 W, of the 214 W power generated can be consumed.
η s = η b * η i
When the generated power is taken as 164 W, it means 3936 Wh per day and 27,552 Wh per week available electrical energy. Since the value in our sample house calculation is larger than the weekly consumption value calculated as 17,590 Wh, we can say that electric production is sufficient. The difference between 27,552 and 17,590 Wh shows that more electric appliances may be used or less water currents than 30 m3/h can be sufficient.
DC electrical energy produced by the DC generator or waiting for the ready in the batteries is converted to the AC electrical energy required for the loads (220 V-50 Hz) with an inverter. The standards required by the AC voltage sign produced by the inverter are important for the safe operation of electrical appliances such as washing machines, dishwashers, and refrigerators. Inverter power is chosen according to the instantaneous maximum power to be drawn from the system or the instantaneous total power of the devices that are thought to operate simultaneously. If you want to operate 0.8 kW washing machine, 90 W television, 100 W refrigerator, 125 W lamp, and 1 kW other loads for the selected inverter, a 2125 W inverter will be sufficient. However, considering that it may be necessary to use more electrical devices at the same time, a smart type inverter that produces 3 kW strong full sine was selected.
A battery that can produce electric energy for 3 days in case of electricity production ceases will be appropriate for the system. This means the battery capacity to meet 7551 Wh for a house with daily consumption of 2517 Wh according to the data in Table 1. The battery group labeled 24 V-200 Ah means that it can store 24 Volts × 200 Amp-hours = 4.800 Watts of power. Stored in batteries all or even more than 70% of energy using the battery disrupts the structure of the battery in a short time. Therefore, a GEL (gelled electrolyte sealed lead acid) type battery group of 2, 12V 200Ah will be ideal for the studied system.
Cable selection is very important in energy production and storage systems. It is one of the main factors that should be taken into consideration especially in the calculation of DC systems. When the system cost is examined, the value of the fittings is limited to about 5%. However, if the wrong choice is made in the connection products, they may suffer financial damage by facing fire risk and, more importantly, harm human life. In terms of wiring, the entire system can be divided into two parts: production-battery (GB) and battery-loads (BL). GB partition is installed with DC voltage and generally 12, 24, or 48 V DC. The electric current produced in the turbine of GB section is stored in the batteries via the charge controller. The current phase of 1000 W instant power in 12 V system means; I = 1000 W/17V = ~ 58 A current passes. Here, the current is calculated by dividing the panel power to the uncorrected voltage (17 V) formed in the panel and in the charge controller. The connection cable to be selected for this system must have a current carrying capacity of at least 58 A. Equation (8) should be used to calculate the cable cross section.
s = 0.0175 * 2 * l * P / f k * U 2
In Equation (8), s is cable cross-sectional area (mm2), fk is conductor loss (%), l is cable length (m), P is power (W), U is system voltage (V) and a specific coefficient of 0.0175 for copper (Ω.mm2/m). It is suitable for 1 kW up to 4 m length and 35 mm2. There may be a cable cross section to be used with the calculations made according to the given formula. As can be seen from the formula, it is appropriate to use NYY cable with 50 mm2 cross section for distances longer than 3 m for the system which has a current capacity of 176 A per hour and will transfer 3 kW of power to the battery per hour. In the BL section, there is 220 V AC voltage and only 13.63 A current passes through the cable that will transfer 3 kW power to the battery, and 2.5 mm2 NYY cable can be used safely for this current.
In addition to the turbine, battery bank, battery charging system, inverter, cables and connectors are also required for the test system to be used in a residential environment. From this perspective, the cost table for a highland house of the system is as follows (Table 2).
The regions where the system is planned to use are mostly away from the general distribution line or have supply problems. Therefore, it is difficult to compare in terms of cost analysis since the system is non-alternative in those regions. Nevertheless, in this study, it is compared with the cost in the general distribution line.
kWh cost of electricity in Turkey is almost 18 USD cents with taxes. Our system gives opportunity for 164 W electric energy consumption per hour. Thus, the system provides 3936 Wh of energy per day. This makes 258.6 $ for one year if the electricity production is considered. The total cost calculated in Table 2 is divided by this annual income in order to calculate the return time of the investment. It is calculated between 11–15 years of electricity consumption by this way. Although the return time seems very long, this system is planned to be used in remote locations.
In this study, the power consumption limiter was realized with computer control, which can also be seen in Figure 1. After limiting the power transferred to the load, the current and voltage of the load bus is measured and transferred to the computer with the data acquiring card, when all the data of the system exceeds the output power of the inverter since it is in MATLAB/Simulink environment. The software disables less priority loads with the designated output ports and control switches connected to them. However, in the event that the product is commercialized, a limiter will be needed.
If the consumption the house is more than our average calculation than there is a need for a higher flow rate resource. The electric power to be generated for higher flow flows was calculated using the experimental set and MATLAB Simulink. Because of the increase in power generation, the return on investment of the system is further reduced. In Figure 13, the relationship between water flow and time for meeting the investment cost is given.

4. Conclusions

Decreasing fossil energy sources and rising energy prices in the world highlight alternative resource use. From this perspective, Turkey’s exploitation of river flow, an alternative power sources to electricity generation from river currents of mountain regions were investigated in this study.
The hydrokinetic turbine with fixed rotating blades is examined in experimental and MATLAB/Simulink environments. The conclusions are given below. This section may be divided by subheadings. It provides a concise and precise description of the experimental results, their interpretation, as well as the experimental conclusions that can be drawn.
  • The experimental setup produced in this study showed that, a clean and renewable energy conversion system that can compete with solar energy conversion systems in terms of price, has electrical load-frequency stability can be produced especially for the small settlements which are not suitable for water accumulation.
  • Numerical analyses were performed by MATLAB/Simulink. Fuzzy logic circuits offer analysis data in a good agreement with experimental results.
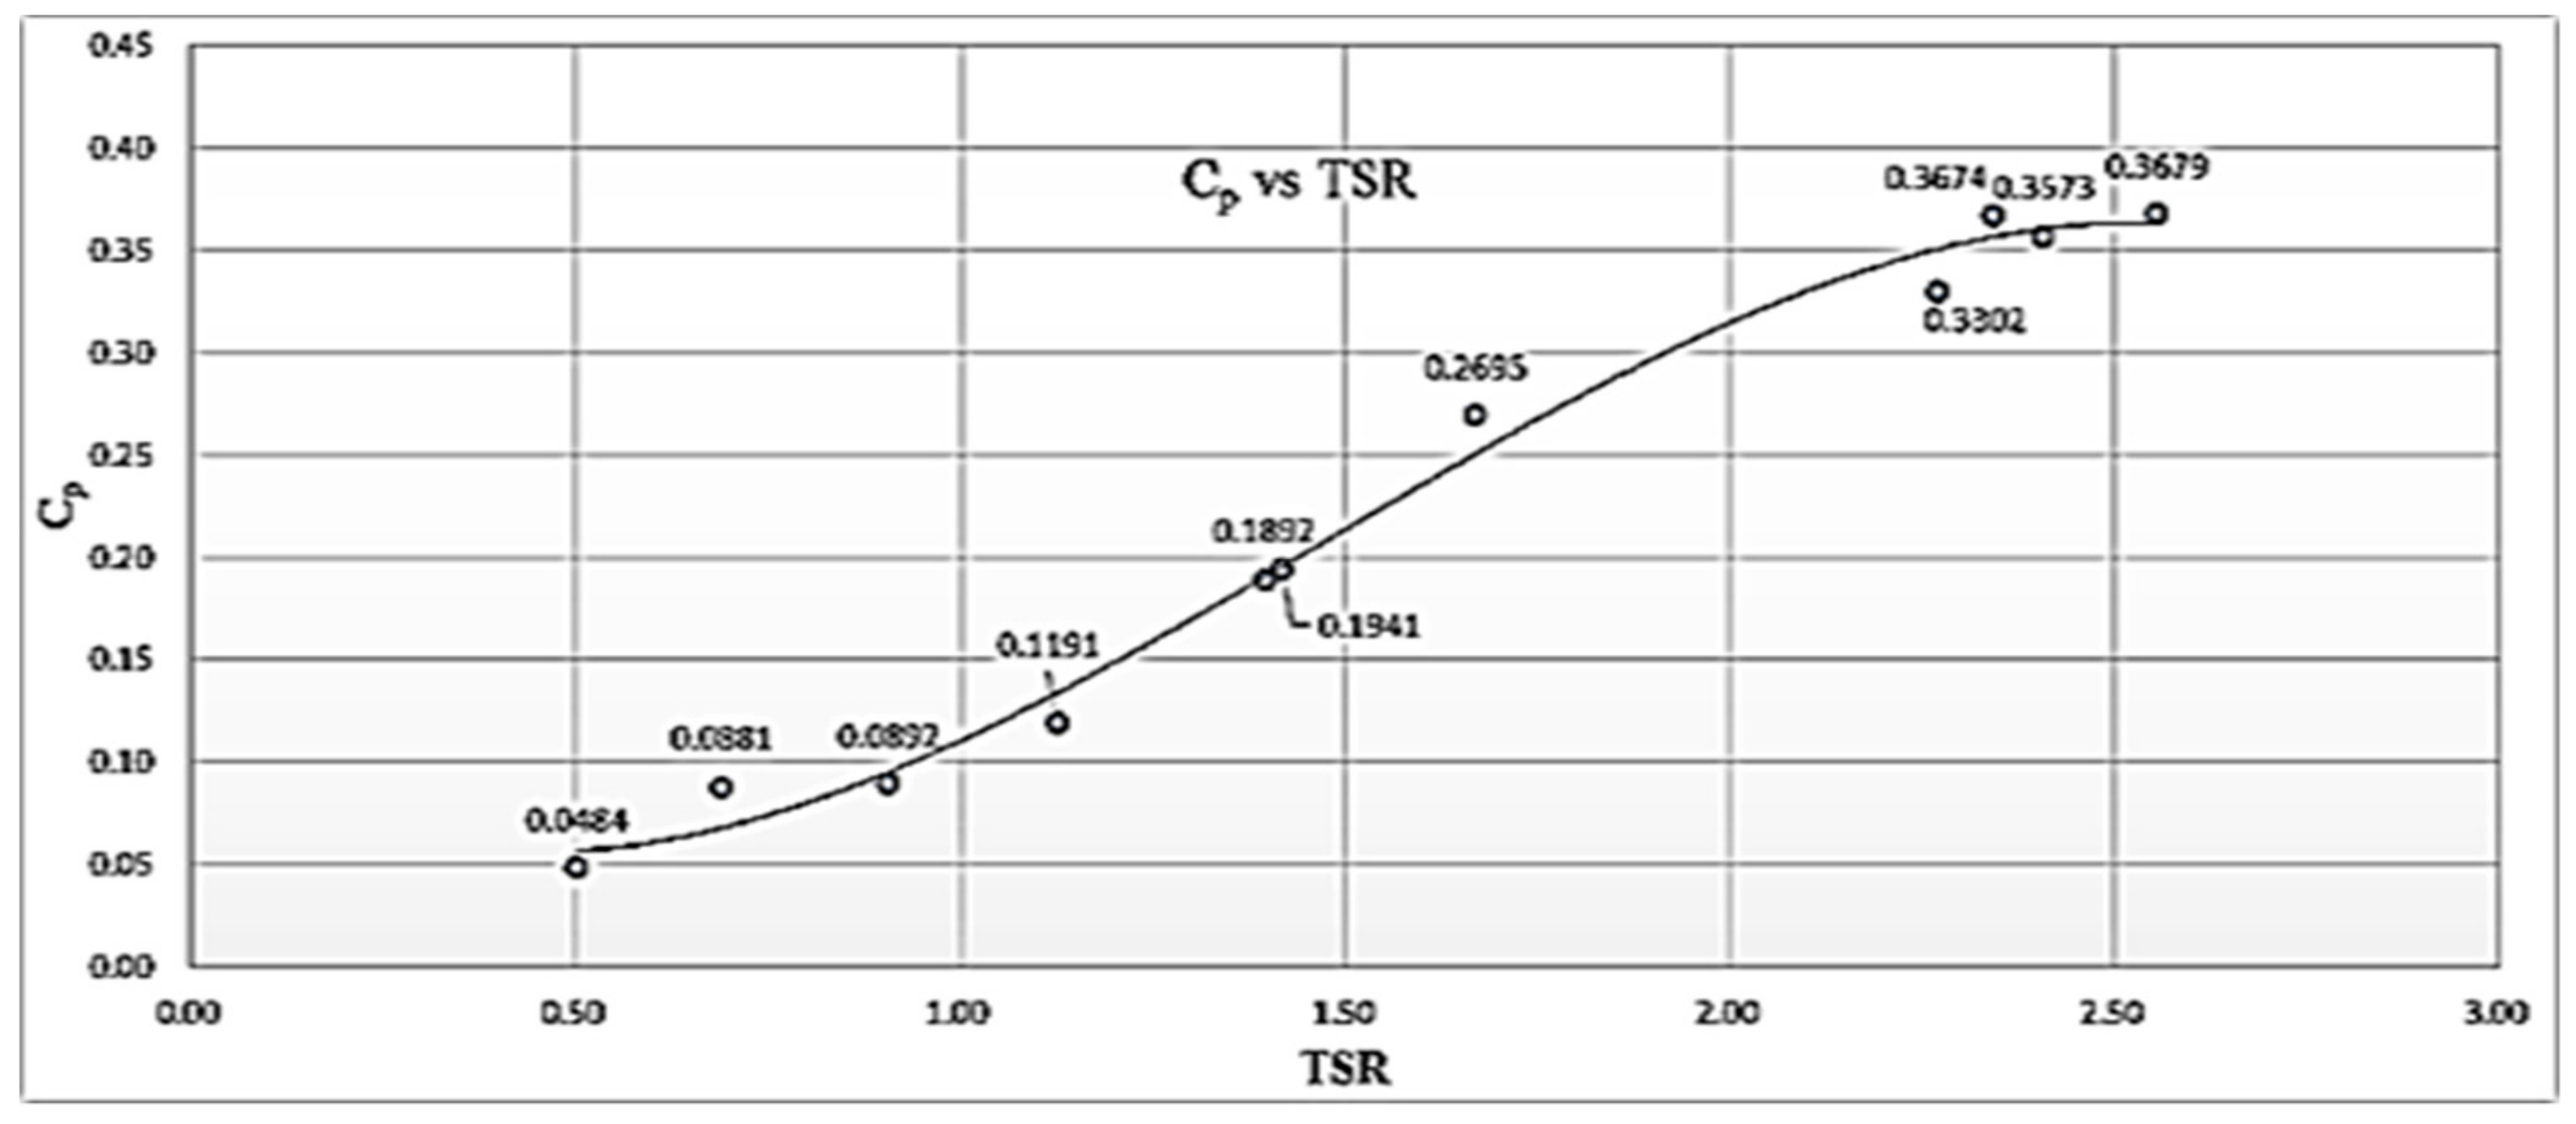
  • The efficiency parameter of the hydrokinetic turbine is coefficient of power and fixed rotating blades rises this parameter up to 0.4.
  • A renewable energy system that provides approximately 250 W energy will be enough for the electricity consumption of a village house.
  • It is calculated that the system to be established on a river with a water flow rate of 30 m3/h will meet the investment cost in 11–15 years.

Author Contributions

In this multidisciplinary study, researchers made mechanical, electrical and numerical works. F.G. worked on the mechanical design and calculations the study. Other researcher H.Z. worked on the electrical calculations and numerical analysis. All authors have read and agreed to the published version of the manuscript.

Funding

This research received no external funding.

Conflicts of Interest

The authors declare no conflict of interest.

References

  1. Fernandes, A.C.; Rostami, A.B. Hydrokinetic energy harvesting by an innovative vertical axis current turbine. Renew. Energy 2015, 81, 694–706. [Google Scholar] [CrossRef]
  2. Laws, N.D.; Epps, B.P. Hydrokinetic energy conversion: Technology, research, and outlook. Renew. Sustain. Energy Rev. 2016, 57, 1245–1259. [Google Scholar] [CrossRef] [Green Version]
  3. Van Els, R.H.; Junior, A.C.P.B. The brazilian experience with hydrokinetic turbines. Energy Procedia 2015, 75, 259–264. [Google Scholar] [CrossRef] [Green Version]
  4. Vermaak, H.J.; Kusakana, K.; Koko, S.P. Status of micro-hydrokinetic river technology in rural applications: A review of literature. Renew. Sustain. Energy Rev. 2014, 29, 625–633. [Google Scholar] [CrossRef]
  5. Güney, M.S.; Kaygusuz, K. Hydrokinetic energy conversion systems: A technology status review. Renew. Sustain. Energy Rev. 2010, 14, 2996–3004. [Google Scholar] [CrossRef]
  6. Lopes, J.J.A.; Vaz, J.R.P.; Mesquita, A.L.A.; Mesquita, A.L.A.; Blanco, C.J.C. An approach for the dynamic behavior of hydrokinetic turbines. Energy Procedia 2015, 75, 271–276. [Google Scholar] [CrossRef] [Green Version]
  7. Nunes, M.M.; Mendes, R.C.F.; Oliveira, T.F.; Junior, A.C.P.B. An experimental study on the diffuser-enhanced propeller hydrokinetic turbines. Renew. Energy 2019, 133, 840–848. [Google Scholar] [CrossRef]
  8. Riglin, J.; Carter, F.; Oblas, N.; Schleicher, W.C.; Daskiran, C.; Oztekin, A. Experimental and numerical characterization of a full-scale portable hydrokinetic turbine prototype for river applications. Renew. Energy 2016, 99, 772–783. [Google Scholar] [CrossRef]
  9. Guney, S.M.; Guner, F.; Altinkok, A.; Guler, B. Hydrokinetic technologies and application. Acta Tech. Corviniensis–Bull. Eng. 2018, 9, 63. [Google Scholar]
  10. Vásquez, M.; Oliveira, T.F.; Junior, A.C.P.B. On the electromechanical behavior of hydrokinetic turbines. Energy Convers. Manag. 2016, 115, 60–70. [Google Scholar] [CrossRef]
  11. Khan, M.J.; Bhuyan, G.; Iqbal, M.T.; Quaicoe, J.E. Hydrokinetic energy conversion systems and assessment of horizontal and vertical axis turbines for river and tidal applications: A technology status review. Appl. Energy 2009, 86, 1823–1835. [Google Scholar] [CrossRef]
  12. Guney, M.S. Evaluation and measures to increase performance coefficient of hydrokinetic turbines. Renew. Sustain. Energy Rev. 2011, 15, 3669–3675. [Google Scholar] [CrossRef]
  13. Yuksel, I. Renewable energy status of electricity generation and future prospect hydropower in turkey. Renew. Energy 2013, 50, 1037–1043. [Google Scholar] [CrossRef]
  14. Ladokun, L.L.; Sule, B.F.; Ajao, K.R.; Adeogun, A.G. Resource assessment and feasibility study for the generation of hydrokinetic power in the tailwaters of selected hydropower stations in nigeria. Water Sci. 2019, 32, 338–354. [Google Scholar] [CrossRef] [Green Version]
  15. Benelghali, S.; Benbouzid, M.E.H.; Charpentier, J.F.; Ahmed-Ali, T.; Munteanu, I. Experimental validation of a marine current turbine simulator: Application to a permanent magnet synchronous generator-based system second-order sliding mode control. IEEE Trans. Ind. Electron. 2011, 58, 118–126. [Google Scholar] [CrossRef] [Green Version]
  16. Eris, E.; Agiralioglu, N. Streamflow map of the eastern black sea region, turkey. Sci. Iran. 2017, 25, 1048–1056. [Google Scholar] [CrossRef] [Green Version]
  17. Baser, V. Yaylalardaki arazi kullanım değişiminin coğrafi bilgi sistemi İle analizi: Giresun örneği. Bitlis Eren Üniversitesi Fen Bilimleri Dergisi 2019, 8, 167–175. [Google Scholar] [CrossRef]
  18. Baser, V.; Biyik, C. The problems and resolution approaches to land management in the coastal and maritime zones of turkey. Ocean Coast. Manag. 2016, 119, 30–37. [Google Scholar] [CrossRef]
  19. Baser, V.; Biyik, C. Coastal and marine zone legislation within the concept of land management in turkey. Surv. Rev. 2018, 51, 502–513. [Google Scholar] [CrossRef]
  20. Tampier, G.; Troncoso, C.; Zilic, F. Numerical analysis of a diffuser-augmented hydrokinetic turbine. Ocean Eng. 2017, 145, 138–147. [Google Scholar] [CrossRef]
  21. Laß, A.; Schilling, M.; Kumar, J.; Wurm, F.-H. Rotor dynamic analysis of a tidal turbine considering fluid–structure interaction under shear flow and waves. Int. J. Nav. Archit. Ocean Eng. 2019, 11, 154–164. [Google Scholar] [CrossRef]
  22. Yeo, H.; Seok, W.; Shin, S.; Huh, Y.C.; Jung, B.C.; Myung, C.-S.; Rhee, S.H. Computational analysis of the performance of a vertical axis turbine in a water pipe. Energies 2019, 12. [Google Scholar] [CrossRef] [Green Version]
  23. Kang, S.; Borazjani, I.; Colby, J.A.; Sotiropoulos, F. Numerical simulation of 3d flow past a real-life marine hydrokinetic turbine. Adv. Water Resour. 2012, 39, 33–43. [Google Scholar] [CrossRef]
  24. Tescione, G.; Ferreira, C.J.S.; van Bussel, G.J.W. Analysis of a free vortex wake model for the study of the rotor and near wake flow of a vertical axis wind turbine. Renew. Energy 2016, 87, 552–563. [Google Scholar] [CrossRef]
  25. Ma, Y.; Hu, C.; Li, Y.; Li, L.; Deng, R.; Jiang, D. Hydrodynamic performance analysis of the vertical axis twin-rotor tidal current turbine. Water 2018, 10. [Google Scholar] [CrossRef] [Green Version]
  26. Hantoro, R.; Utama, I.K.A.P.; Arief, I.S.; Ismail, A.; Manggala, S.W. Innovation in vertical axis hydrokinetic turbine–straight blade cascaded (vaht-sbc) design and testing for low current speed power generation. J. Phys. Conf. Ser. 2018, 1022. [Google Scholar] [CrossRef]
  27. Birjandi, A.H.; Bibeau, E.L.; Chatoorgoon, V.; Kumar, A. Power measurement of hydrokinetic turbines with free-surface and blockage effect. Ocean Eng. 2013, 69, 9–17. [Google Scholar] [CrossRef]
  28. Kamal, T.P.B.; Ismail, A.R. A comparative study on river hydrokinetic turbines blade. IJERA 2015, 5, 1–10. [Google Scholar]
  29. Tjiu, W.; Marnoto, T.; Mat, S.; Ruslan, M.H.; Sopian, K. Darrieus vertical axis wind turbine for power generation i: Assessment of darrieus vawt configurations. Renew. Energy 2015, 75, 50–67. [Google Scholar] [CrossRef]
  30. Zadeh, A.L. Outline of a new approach to the analysis of complex systems and decision processes. IEEE Trans. Syst. Man Cybern. 1973, 1, 28–44. [Google Scholar] [CrossRef] [Green Version]
  31. Liu, W.; Chen, Z.; Cheng, X.; Wang, Y.; Amankwa, A.R.; Xu, J. Design and ballistic penetration of the ceramic composite armor. Compos. Part B Eng. 2016, 84, 33–40. [Google Scholar] [CrossRef]
  32. Zenk, H. Comparison of the Performance of Photovoltaic Power Generation-Consumption System with Push-Pull Converter under the Effect of Five Different Types of Controllers. Int. J. Photoenergy 2019, 2019, 1–15. [Google Scholar] [CrossRef]
  33. Tchakoua, P.; Wamkeue, R.; Ouhrouche, M.; Tameghe, T.; Ekemb, G. A new approach for modeling darrieus-type vertical axis wind turbine rotors using electrical equivalent circuit analogy: Basis of theoretical formulations and model development. Energies 2015, 8, 10684–10717. [Google Scholar] [CrossRef] [Green Version]
  34. Kolekar, N.; Banerjee, A. Performance characterization and placement of a marine hydrokinetic turbine in a tidal channel under boundary proximity and blockage effects. Appl. Energy 2015, 148, 121–133. [Google Scholar] [CrossRef]
  35. Asl, H.A.; Monfared, R.K.; Rad, M. Experimental investigation of blade number and design effects for a ducted wind turbine. Renew. Energy 2017, 105, 334–343. [Google Scholar] [CrossRef]
  36. Mahmoud, N.H.; El-Haroun, A.A.; Wahba, E.; Nasef, M.H. An experimental study on improvement of savonius rotor performance. Alex. Eng. J. 2012, 51, 19–25. [Google Scholar] [CrossRef] [Green Version]
Figure 1. Principle view of hydrokinetic energy conversion system.
Energies 13 00766 g001
Figure 2. Experimental setup of vertical hydrokinetic turbine.
Energies 13 00766 g002
Figure 3. The geometry of vertical axis hydrokinetic turbine with fixed guiding blade.
Energies 13 00766 g003
Figure 4. Gearbox mechanism of DC generator.
Energies 13 00766 g004
Figure 5. MATLAB/Simulink model of experimental setup.
Energies 13 00766 g005
Figure 6. (a) Basic configuration of a fuzzy logic control; (b) fuzzy logic based turbine control system.
Energies 13 00766 g006
Figure 7. Coefficient of power (Cp) vs. tip speed ratio (TSR).
Energies 13 00766 g007
Figure 8. Graph of clearance coefficient vs. TSR.
Energies 13 00766 g008
Figure 9. Stator phase current.
Energies 13 00766 g009
Figure 10. Load phase current of MATLAB/Simulink analyses.
Energies 13 00766 g010
Figure 11. The waveform of generator output voltage of Phase (A).
Energies 13 00766 g011
Figure 12. Output power graph of MATLAB/Simulink analysis.
Energies 13 00766 g012
Figure 13. Water flow vs. meeting the investment in year.
Energies 13 00766 g013
Table 1. Average electric consumption of a house.
Electric AppliancesWorking Hour (h)Power (W)Working DayWeekly Energy Consumption (Wh)
Refrigerator510073500
Television49072520
PC37571575
Iron0.2170031020
Owen1180011800
Home Lighting512574375
Washer18001800
Others1100022000
SUM 5690 17,590
Table 2. Cost table for hydrokinetic turbine power system.
ComponentPrice ($/unit)
Turbine1800
Battery Bank235
Battery Charger156
Inverter480
Cable72
Connector11
Consumption Limiter153
System Installation100
SUM2957

