1. Introduction
To meet the targets of the Paris Agreement, it is necessary to reduce dependence on fossil fuels and improve energy efficiency [
1]. In the past, energy conversion efforts have mainly focused on decarbonization of the power generation sector; however, the importance of greenhouse gas (GHG) reductions in the building sector has been emphasized recently. Substantial energy loss from space heating and cooling occurs in the building sector, leading to increased energy consumption and CO2 emissions [
2].
In most countries, the building sector accounts for over 40% of primary energy consumption and 28% of energy-related CO
2 emissions [
3]. In Korea, the building sector accounts for 20% of energy consumption and 25% of GHG emissions [
4]. Accordingly, several countries are implementing energy reduction policies in the building sector; including the improvement of energy efficiency by strengthening building energy standards and energy labeling for appliances, mandating zero-energy buildings (ZEBs), and expanding the supply of renewable energy [
5]. Europe, in particular, has set targets to increase the use of renewable energy and electrification in buildings, with a focus on heating and cooling [
6]. Korea aims to reduce 32.7% of CO
2 compared to the business as usual (BAU) scenario in the building sector; it has introduced a building energy efficiency rating system, ZEB certification system, and ZEB mandate roadmap [
4].
To reduce energy consumption in buildings, it is important to adopt appliances that use more efficient technology. In this regard, there is a clear trend toward the use of induction cooking appliances in Korea. The electric stove market expanded from 300,000 units in 2013 to 800,000 units in 2018, and the industry projected that 1 million units would be sold in 2019, exceeding gas stove sales [
7]. According to the Household Energy Standing Survey conducted by the Korea Energy Economics Institute (KEEI), liquified natural gas (LNG) remains the main cooking fuel in Korea; however, the proportion of electric stoves has increased sharply in recent years, from 0.5% in 2013 to 7.2% in 2017 [
8,
9]. This has been attributed to several factors. First, as citizens become more sensitive to indoor air quality, they tend to prefer induction ranges over gas ranges that emit NOx due to incomplete combustion during cooking (According to WHO (2010), “it was assumed that having a gas stove was equivalent to an increased average indoor level of 28 μg/m
3 compared to homes with electric stoves, and the meta-analysis showed that an increase in indoor nitrogen dioxide of 28 μg/m
3 was associated with a 20% increased risk of lower respiratory illness in children.”) [
7,
10]. Furthermore, as the proportion of one- to two-person households increases, along with the consumption of easy-to-cook foods, such as home meal replacements, the demand for cooking heat is decreasing [
11,
12]. Based on these trends, understanding the impact of the electrification of cooking methods on energy demand and GHG emissions is vital.
In the EU, the Ecodesign and Energy Labelling Regulations (respectively No 66/2014 and No 65/2014) for domestic cooking appliances using electricity or gas as energy sources have been applicable since 2015 [
13]. In addition, there have been several studies to compare energy consumption and greenhouse gas emissions attributable to different cooking methods, conducted mainly through experimental methods. The Electric Power Research Institute (2014) has developed an experimental procedure that is compatible with technology, representing actual cooking behaviors, to assess induction cooking efficiency [
14]. Martínez-Gómez et al. (2016) compared energy consumption for preparing the main eleven foods cooked in Ecuador, in LPG and induction stoves [
15]. Favi et al. (2018) evaluated a 20-year scenario of preparing a typical Italian four-person home lunch, comparing the environmental performances of gas and induction ranges [
16].
Unlike these previous studies, this study focused on measuring actual household energy consumption from cooking. It is meaningful to compare real-life energy consumption from cooking methods based on actual household usage patterns, because the differences in building energy balance can depend on the specific appliances and residents’ behaviors [
17]. Furthermore, real-life efficiency is not only influenced by the type and quantity of food being cooked and the appliance size, but also the users’ cooking habits [
18]. There is a study showing that usage differences can produce a variation in energy consumption of 30% among users with the same equipment [
19].
The objective of this study is to analyze the impact of the electrification of cooking methods on the energy and GHG emissions in Korea’s building sector. The annual electric cooking energy consumption data of all households in the Nowon Energy Zero (EZ) House Project, the first zero-energy housing complex in Korea, were compared with gas cooking energy consumption data from households surveyed by the KEEI [
20]. Based on the measured cooking energy consumption data of the two sample groups, calorie consumption and greenhouse gas emissions were calculated and compared. Furthermore, we project future GHG emissions in light of the trend towards cooking electrification considering changes in GHG emission factors and the total number of households in Korea.
3. Results
3.1. Energy Consumption Changes Following the Electrification of Cooking Methods
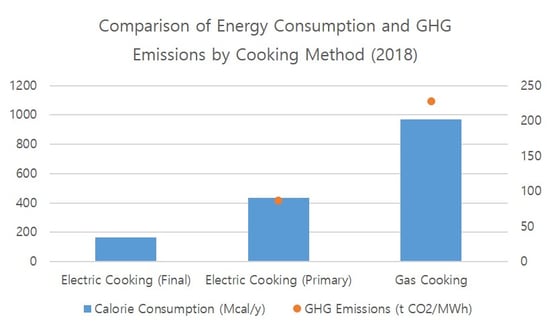
The power consumption of EZ Houses and the natural gas consumption of gas cooking households are compared on a calorific basis. As shown in
Figure 1 below, the average EZ House calorie consumption was lower compared to gas cooking households. On a final energy basis, gas cooking households (969.0 Mcal) consumed 6 times more calories than the average EZ House (162.8 Mcal). When considering primary energy, the gas cooking households consumed 2.2 times more calories than the average EZ House (433.6 Mcal). In summary, the energy consumption of the cooking sector was reduced by adopting electric cooking methods.
As the number of household members decreased, the difference in energy consumption between the two cooking methods tended to increase. The calorie consumption of gas cooking was 22.8, 7.1, 4.5, 4.6, and 4.4 times higher for one-, two-, three-, four-, and five-person households, respectively, on a final energy basis, compared to electric cooking. In terms of primary energy, gas cooking consumed 8.6 times more calories than electric cooking for one-person households, 2.7 times more for two-person households, and 1.7 times more for three- to five-person households.
3.2. GHG Emission Changes Following the Electrification of Cooking Methods
To compare EZ House GHG emissions with gas cooking households, the GHG emission factors of electricity for the three scenarios (2018, 2030 BAU, and 2030 Policy) were calculated. Because fossil fuels such as coal and LNG emit GHGs, factors were determined using the GHG emission factors and generation efficiency of bituminous coal (fuel) and LNG [
24,
25], and the power generation mix for each of the three scenarios as follows:
where
EF is the emission factor (t CO
2/MWh),
GE is the generation efficiency (%),
GM is the generation mix (%),
S is the scenario,
C is bituminous coal, and
G is LNG. For example, the 2018 emission factor for coal was 0.342 t CO
2/MWh, the generation efficiency was 40.60%, and the generation mix was 41.9% (see
Table 2). Using these values, 0.353 t CO
2/MWh was calculated according to the above equation. For LNG, the 2018 emission factor was 0.202 t CO
2/MWh, the generation efficiency was 50.97%, and the generation mix was 26.8%, yielding 0.106 t CO
2/MWh. To sum up the two values, the GHG emission factor of electricity in 2018 was calculated as 0.460 t CO
2/MWh. The other two scenarios are calculated in the same manner; the GHG emission factor of electricity in the 2030 BAU scenario, with a reduced fossil fuel share, is 0.399 t CO
2/MWh, and that in the 2030 Policy scenario, with a reduced coal share, is 0.379 t CO
2/MWh (
Table 5).
The GHG emissions of the two samples were calculated by multiplying the average household cooking energy consumption by the GHG emission factor. When cooking with electricity, the average household emits 87.0 kg CO2/year under the present scenario, 75.6 kg CO2/year under the 2030 BAU scenario, and 71.8 kg CO2/year under the 2030 Policy scenario. Emissions of the average gas cooking household are 227.4 kg CO2/year. Under the present scenario, gas cooking households emit 2.6 times more GHGs than electric cooking households and will emit 3.0 times more GHGs under the 2030 BAU scenario and 3.2 times more under the 2030 Policy scenario. As the share of fossil fuels, particularly coal, decreases in the power mix, the GHG emission factor of electricity will continue to decrease; GHG reductions from the electrification of cooking methods will improve further.
3.3. 2030 Cooking Scenario Analysis
The Korean 2030 cooking scenario analysis combined the share of electric cooking households (7.2, 10, and 20%) and the total number of households with 2030 power mix scenarios. The current total number of households in Korea is 19,979,188 and this is expected to grow to 22,036,338 by 2030 [
12]. Meanwhile, the current share of households using electric cooking is 7.2% and was considered at 10 and 20% for scenario analysis [
9].
Table 6 shows that the total cooking-related GHG emissions in 2018 was approximately 3.94 million t CO
2.
If the ratio of electric cooking households remains at current levels (7.2%), total household growth by 2030 would result in an increase of 0.26 million t CO2 of GHG emissions under the 2030 Policy scenario. Conversely, if the ratio of households using electric cooking increased to 20%, GHG emissions will be lower, despite the growth in household numbers. The lowest GHG emissions are under the 2030 Policy scenario, where the proportion of coal in the power mix is significantly reduced compared to the 2030 BAU scenario; in the former, fossil fuel usage is reduced due to the expansion of renewable energy. Under the 2030 Policy scenario, cooking-related GHG emissions are projected to be 3.79 million t CO2, approximately 3.8% lower than the present values. In summary, an increased adoption of electric cooking methods would reduce GHG emissions in synergy with the decarbonization of the power generation sector in Korea.
4. Discussion
This study indicates that the adoption of induction stoves could reduce energy demand and GHG emissions in Korea. This is attributed to the high efficiency of induction stoves compared to gas cooking [
14,
16,
18]. Cooking experiments by the Electric Power Research Institute show that induction has an efficiency of 74.9–77.6%, while natural gas appliances has a relatively low efficiency (30.2–41.7%) [
14].
The power mix has a critical impact on emissions from electric cooking methods. Several studies have demonstrated differences in the comparative results of GHG emissions from induction and gas stoves, depending on the proportion of fossil fuels in the power generation mix. In Ecuador, where hydropower will account for 83.61% of the power mix in 2022, switching from LPG gas cooking to induction is expected to significantly reduce CO
2 emissions associated with cooking energy [
26]. Conversely, Italy’s current power mix has a high proportion of fossil fuels; hence, induction cooking emits more GHGs than the gas cooking [
16]. However, the authors of this study commented that the shift from fossil fuels to renewable energy in the future will increase the benefits of induction cooking compared to gas [
16].
Currently, the share of renewable energy in the Korean power mix is 6.2%; however, the RE 3020 Plan of the Korean government has set a target of 20% renewable energy in the power generation mix by 2030 [
27]. Moreover, a 35% target for renewable energy by 2040 has been proposed in the Third Basic Energy Plan in 2019 [
28]. Accordingly, the GHG emission factor of electricity in Korea is expected to decrease in the future. In summary, where the share of renewable energy is expected to expand such as Korea, the electrification of cooking methods will promote decarbonization.
The European Union has presented the ‘Heating and Cooling Strategy’ to promote decarbonization of the building sector beyond the power sector by combining renewable energy and heating and cooling [
6]. In OECD countries, heating accounted for approximately half of the final energy consumption of the building sector in 2013, whereas cooking accounted for only 3% [
29]. Although cooking has a lower impact than heating on the GHG emissions of the building sector, it is expected to positively contribute to synergy with the expansion of renewable energy.
5. Conclusions
This study indicates that the trend towards households adopting electric cooking will have a positive impact on building energy conservation and GHG emission reduction in Korea. The average cooking energy consumption per household was 969.0 Mcal for gas cooking households, and 162.8 Mcal for electric cooking households (final energy basis), indicating a six-fold difference. When considering the primary energy basis, electric cooking households consumed 433.6 Mcal, comprising 44.7% of the gas cooking energy consumption. As the number of occupants per household decreases, energy savings from the electrification of cooking increase. Because household occupancy numbers are expected to continue to decline, this finding suggests that the benefits of electric cooking methods will increase over time.
The electrification of cooking methods will also reduce GHG emissions. Using the 2018 electricity GHG emission factor, gas cooking households emitted 227.4 kg CO2/year; 2.6 times more than electric cooking households (87.0 kg CO2/year). Under the 2030 Policy Scenario, this difference is projected to increase to 3.2 times. Under future scenarios, the expansion of electric cooking has greater potential to reduce GHG emissions in synergy with the decarbonization of the power generation sector in Korea.
According to the power mix and the share of electric cooking households in Korea, total CO2 emissions related to cooking were determined. Despite the increase in the total number of households by 2030, if the electric cooking ratio is increased to 20% and the 2030 Policy scenario is achieved, cooking will emit approximately 3.79 million t CO2; approximately 3.8% lower than the present. The reduction of fossil fuels, especially coal, in the power generation mix will lead to greater GHG reduction effects.
Owing to differences in sample characteristics and timing, there are some limitations in this study. The EZ House project is a suitable sample that reflects recent building energy policy trends; however, it has some unique characteristics which could influence our results. For example, the site is a zero-energy demonstration complex and several newlywed couples live there. Furthermore, data were sampled at different times because the most up-to-date gas cooking data was from 2013. However, gas range technology is mature, with no significant changes in equipment efficiency over the past few years; rather, the effect of usage patterns on actual efficiency has been shown to be more significant [
18,
19].
The average number of occupants in EZ House is 2.6, similar to the average occupancy of households in Korea (2.5) in 2017. Conversely, the average occupancy of gas cooking households sampled in this study was 3.3. This may have influenced the average cooking calorie consumption of this sample group. We accounted for this by classifying the number of household members when comparing energy consumption.
Despite these limitations, this study is meaningful as a first attempt to compare the energy consumption of different cooking methods based on actual household energy usage patterns. More sophisticated comparisons of energy consumption from cooking in similar environments with different cooking equipment are proposed for follow-up studies. Furthermore, an economic analysis of the comparative cost of each cooking method, including equipment price, energy price, and building design cost according to gas pipe installation, would facilitate a greater understanding of future trends in cooking methods.


