Article

Lithium-Ion Polymer Battery for 12-Voltage Applications: Experiment, Modelling, and Validation

Mechanical Engineering, Electric-drive Vehicle Engineering, Wayne State University, Detroit, MI 48202, USA
*
Author to whom correspondence should be addressed.
Energies 2020, 13(3), 638; https://doi.org/10.3390/en13030638
Submission received: 12 January 2020 / Revised: 25 January 2020 / Accepted: 27 January 2020 / Published: 3 February 2020
(This article belongs to the Special Issue Energy Storage Systems for Electric Vehicles)

Abstract

:
Modelling, simulation, and validation of the 12-volt battery pack using a 20 Ah lithium–nickel–manganese–cobalt–oxide cell is presented in this paper. The cell characteristics influenced by thermal effects are also considered in the modelling. The parameters normalized directly from a single cell experiment are foundations of the model. This approach provides a systematic integration of actual cell monitoring with a module model that contains four cells connected in series. The validated battery module model then is utilized to form a high fidelity 80 Ah 12-volt battery pack with 14.4 V nominal voltage. The battery cell thermal effectiveness and battery module management system functions are constructed in the MATLAB/Simulink platform. The experimental tests are carried out in an industry-scale setup with cycler unit, temperature control chamber, and computer-controlled software for battery testing. As the 12-volt lithium-ion battery packs might be ready for mainstream adoption in automotive starting–lighting–ignition (SLI), stop–start engine idling elimination, and stationary energy storage applications, this paper investigates the influence of ambient temperature and charging/discharging currents on the battery performance in terms of discharging voltage and usable capacity. The proposed simulation model provides design guidelines for lithium-ion polymer batteries in electrified vehicles and stationary electric energy storage applications.

1. Introduction

Lead–acid-based batteries have a long-term historical usage in the automotive and stationary standby power market, ranging from 12-volt high-power such as automotive starting–lighting–ignition (SLI) applications, low-power applications such as emergency lighting or uninterruptible power supplies (UPSs) for individual computers, to high-power, high-voltage electric energy storage in renewable energy systems or UPSs telecommunications facilities. Typical lead–acid batteries have several problems including high self-discharge rate, relatively heavy and large, and shallow depth of discharge (DOD). For the past decades, lithium-ion batteries have been widely used in portable electronics due to their features of high energy density, high discharge power, and long cycle life. The emerging applications of the lithium-ion batteries to electric-drive vehicles and large-scale energy storage systems for renewable energy make them a promising solution for challenges of environmental preservation and resource conservation [1,2]. The lithium-ion battery is also a suitable replacement for the conventional 12-volt SLI lead–acid battery; for example, Porsche offers an option of a lithium-ion SLI battery [3], and some medium-duty truck manufacturers use a lithium-ion battery for 12/24 V electrical systems [4,5]. The lithium-ion polymer battery uses a high conductivity semisolid (gel) polymer electrolyte instead of a liquid electrolyte. The battery cell voltage depends on the electrode material chemistries. The lithium–metal–oxide-based (such as LiCoO2) cell has 2.5–2.8 V fully discharged voltage and 4.2 V fully charged voltage, while the lithium–iron–phosphate-based (such as LiFePO4) cell has 1.8–2.0 V fully discharged voltage and 3.6–3.8 V fully charged [6,7]. The lithium polymer battery has higher specific energy than do other lithium-based batteries [6]. The polymer electrolyte gives the lithium polymer battery more stable performance under vibration conditions. These two features have led to the promotion of lithium polymer batteries in electric-drive vehicle applications.
The lithium-ion batteries, however, still encounter some roadblocks that complicate their applications. One of the major roadblocks is temperature influence on the operation of lithium-ion batteries. The operating temperature of a battery is the result of ambient temperature augmented by the heat generated by an electrochemical reaction. Operating temperatures from −20 °C to 60 °C is a typically acceptable range for lithium-ion batteries [8]. Pesaran et al. [9] presented that the optimal temperature range for lithium-ion batteries is from 15 °C to 35 °C, which is similarly comfortable for humans. To avoid a severe temperature gradient that might lead to different degradation rates and unbalanced cells, 5 °C should be set as the maximum temperature difference from cell to cell within a module [9,10]. The impacts of temperature can generally be considered as low and high temperature effects [11]. At low operating temperatures, the lithium-ion batteries experience slow chemical reaction and charged transfer-rate, which decrease ionic conductivity and diffusivity [12,13]. Therefore, the battery energy capacity and power are reduced at low temperatures. At high temperatures, the energy capacity and power are degraded, respectively, due to loss of the reduction of active materials and increase of internal resistance [14]. Self-ignition and even explosion caused by thermal runaway may happen if the temperature is too high. The effects caused by low battery temperature mostly occur during low ambient temperatures, while the effects induced by high battery temperature could occur either in low or high ambient temperatures. For an example, the battery temperature could highly increase at a large discharging current even in a low ambient temperature environment. The ambient temperature dominates in low temperature effects, and the battery internal temperature during operations plays a more important (than ambient temperature) role in high temperature effects.
The battery cell characteristics are determined by the electrode materials, electrolyte materials, cell size and shape, as well as the operating conditions including temperature, charging, discharging current, etc. The cell characteristics are essential parameters in battery pack design, thermal management system design, and battery management control. The battery cell characteristics typically are acquired through a series of charging and discharging experimental tests, which are time-consuming and require several pieces of equipment, such as a cycler, temperature chamber, and device for data acquisition. Analytical approach uses certain numbers of cell parameters gathered from less experimental tests to form a mathematical model. The battery model is also helpful for predicting parameters that cannot be directly measured by any sensors, such as state of charge (SOC), state of health (SOH), and state of life (SOL). Model-based estimation algorithms are usually used to compute or estimate theses parameters [15,16]. Nevertheless, a high-fidelity battery model is required to obtain accurate simulation results. Many battery models have been developed ranging from simple models with a few parameters to complex models having a large number of parameters [17,18,19,20,21,22,23,24,25,26,27]. The common battery modelling approaches are electrochemical, mathematical or analytical, and electric circuit-based model [28,29].
This paper describes the development and validation of an electric circuit-based Simulink model of the lithium–nickel–manganese–cobalt–oxide (LiNiMnCoO2)-based cell with 3.6 V nominal voltage and 20 Ah capacity. The thermal effects on cell characteristics are also considered in the model. The experiments apply several charging and discharging currents to the battery cell and module that are enclosed in a chamber with controlled temperatures of −20 °C, −10 °C, 0 °C, 20 °C, and 50 °C as the ambient temperatures. The experimental data are used to calibrate the model parameters. A 12-volt battery pack (14.4 V, 80 Ah) model is built based on validated simulation models of a battery cell and module. This SLI-type pack has four parallel-connected modules where each module (14.4 V, 20 Ah) consists of four cells connected in series. As the 12-volt lithium-ion battery packs might be ready for mainstream adoption in automotive SLI, micro-hybrid (or stop–start engine idling elimination), and UPS applications, this paper investigates the ambient temperature effect on the battery performance in terms of discharging voltage and usable capacity. The proposed simulation model provides design guidelines for lithium-ion polymer batteries in electric-drive vehicle and stationary UPS applications.

2. Battery Modelling from Cell to Pack

A high-fidelity single cell model is a foundation to form a reliable battery module and pack with statistical confidence. The equivalent circuit technique is commonly used for electrochemical impedance characterizations in a cell model. This study uses parameters normalized directly from single cell experiments, which provide a systematic integration of actual cell monitoring with a module model. The approach begins with single cell model development and validation. A module with four cells connected in series is also validated. A high fidelity SLI battery pack model is then achieved.

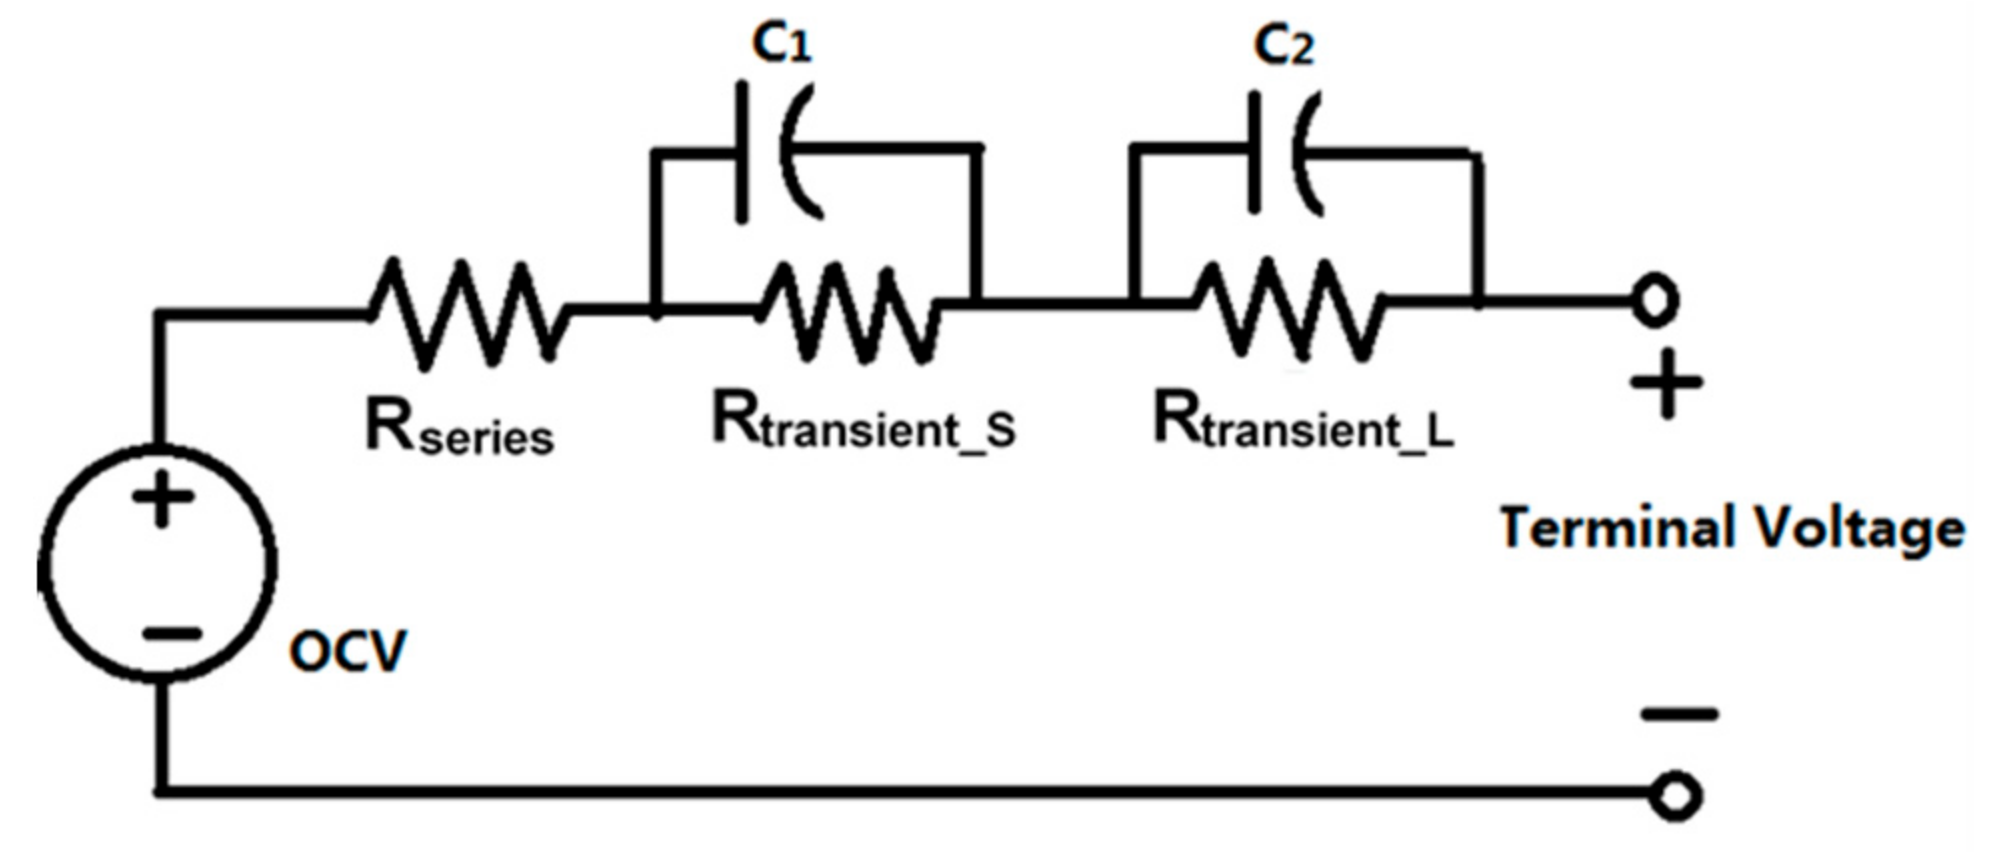
2.1. An Enhanced Equivalent Electric Circuit Cell Model

The equivalent electric circuit approach has been adopted by many researchers to model battery cells ranging from lead–acid to lithium-ion batteries. The most commonly used equivalent electric circuit models are the Thevenin-based model [17,18,19], impedance-based model [20,21,22], and the runtime-based model [23,24]. The Thevenin-based model can predict battery response to the transient load at a certain SOC due to a series resistor and resistor–capacitor parallel network in the model. An impedance-based model is formed by an AC-equivalent impedance model in the frequency domain and the electrochemical impedance spectroscopy method. The runtime-based model utilizes a capacitor and controllable current source to predict battery capacity, SOC, runtime, and open circuit voltage (OCV). The battery operation time and DC voltage response under a constant discharge C-rate also can be simulated by the runtime-based model. The advantages of the runtime-based model and Thevenin-based model are combined in a model presented by [26], as shown in Figure 1. Based on [27], an equivalent electric circuit model with improved features is presented in this paper. In the developed Simulink model shown in Figure 2, three inputs (discharging current, initial SOC ranging from 0 to 1, and battery capacity) replace the battery runtime model. Since the initial SOC is an input variable, the developed model can simulate batteries that are not fully-charged. The OCV is calculated according to real-time SOC, which is predicted from three inputs to the model. Subtracting both voltages of the resistor-capacitor (RC) parallel networks and series resistor (RS) from the OCV gives the cell terminal voltage (Vt), which is an output of the developed model. The real-time SOC, OCV, RC value, RC parallel network voltages, and series resistor voltage are calculated by five developed submodels.
Equation (1) calculates the real-time SOC, in which SOC0 denotes the initial SOC, I denotes the discharging current, and UC denotes the usable capacity. A submodel calculating SOC is presented in Figure 3a, in which three inputs are SOC0, I, and UC and output is real time SOC. Equation (2) is derived from numbers of experimental discharging curves using the method presented in [26] that provides relationship between the SOC and OCV. The interpolation–extrapolation lookup method is applied to calculate and determine the most suitable RC values, as a submodel presented in Figure 3b. The transient response of the battery cell voltage in the developed model is computed by the voltages of RC parallel networks. Equation (3) calculates the voltages of RC parallel networks in the s-domain, as a submodel shown in Figure 3c. For a typical lithium–metal–oxide polymer cell, the series resistor is 0–0.01 ohms in the 20%–100% SOC range, and 0.01–0.06 ohms within the 0%–20% SOC range [26]. Therefore, the developed model uses 0.001 ohms for 20%–100% SOC and 0.03 ohms for 0%–20% SOC in all discharging currents. The voltage on the series resistor (VS) is calculated by Equation (4) where RS is the series resistor resistance, and a submodel is presented in the Figure 3d. Equation (5) calculates the terminal voltage (Vt) of the battery cell. A more detail description of the submodels and their paraments is presented in [30].
SOC = SOC 0 I UC × 3600 dt
OCV = 1.031 e 35 × SOC + 3.685 + 0.2156 × SOC 0.1178 × SOC 2 + 0.3201 × SOC 3
V = 1 s I C V RC
V S = I × R S
V t = OCV V 1 V 2 V S

2.2. Cell Thermal Model

The lithium-ion polymer cell thermal model was built in the Simulink battery block platform, which implemented similar equations as those discussed in Section 2.1 with thermal effects. In the discharge model ( i   >   0 ), Equations (6)–(11) are implemented to represent the temperature effect on the battery model parameters [31]. The temperature tab requires several parameters, which are determined by battery discharging test under 20 °C ambient temperature. The initial cell temperature is set to the ambient temperature because each cell is cooled down or warmed up to the ambient temperature before starting the discharging test. The “nominal ambient temperature T1 (°C)” parameter is the ambient temperature during nominal operations. It is assumed that all parameters in the parameters tab are obtained at 20 °C ambient temperature. The procedures of establishing the cell thermal model in the Simulink platform are presented in [32]. Figure 4 shows the Simulink battery cell discharging model considering ambient temperature effects.
f 1 it ,   i ,   i ,   T ,   T a = E 0 T K T · Q T a Q T a it · i + it + A · exp B · it C · it
V batt T = f 1 it ,   i ,   i ,   T ,   T a R T · i
E 0 T = E 0 | T ref + E T T T ref
K T = K | T ref · exp α 1 T 1 T ref
Q T a = Q | T a + Δ Q Δ T · T a T ref
R T = R | T ref · exp β 1 T 1 T ref
where: T ref (K) nominal ambient temperature, T (K) cell or internal temperature, T a (K) ambient temperature, E / T (V/K) reversible voltage temperature coefficient, α Arrhenius rate constant for the polarization resistance, β Arrhenius rate constant for the internal resistance, (Ah/K) maximum capacity temperature coefficient, C Δ Q / Δ T (V/Ah) nominal discharge curve slope.

2.3. Battery Module and Pack Model

A battery module model containing four cells connected in series was created in the Simulink platform, as shown in Figure 5. The controlled current source, four battery cells, breakers with control algorithms to perform the battery management system (BMS) function, and voltage measurement with scopes are the four submodels in the module model. The charging and discharging current to each cell model are generated by the controlled current source sub-model, which has two parameters, namely DC source type and zero initial amplitude (A). The controlled current source block is connected to a constant block for generating a continuously constant charging or discharging current. A value in the constant block is the constant charging/discharging current. The pulse generator block is applied to generate a pulse charging/discharging current. Cell breaker, bypass breaker, cell voltage tag, and cell control tag form a BMS submodel for each cell. When the cell is charged to a voltage higher than 4.3 V or discharged to a voltage lower than 2.3 V, the control tag opens the cell breaker and closes the bypass breaker to prevent the cell from becoming over-charged or over-discharged. Each submodel contains one pair of tags for the breakers. Figure 5 shows only one pair of tags for a better display. Each cell voltage curve is shown in its scope and a terminal voltage is displayed in total voltage scope. All the parameters in this model are determined from the continuous and pulse discharge tests. A more detail description of the submodels and their paraments is presented in [33].

3. Experiment and Model Validation

The lithium-ion polymer cells used in this study were EiG ePLB C020 lithium–nickel–manganese–cobalt–oxide-based cathode and graphite-based anode with 3.6 V nominal voltage and 20 Ah capacity. Figure 6 shows the test equipment using in this study, namely a Digatron charge/discharge cycler, a computer with Digatron Battery Manager 4 (BM4) software (Battery Manager 4.0, Digatron Power Electronics Inc., Shelton, CT, USA) [34], and an Envirotronics temperature chamber. A fixture was designed to restrain the battery cells and cycler output cables inside the chamber. Three experimental procedures included calibration of battery cell model parameters, validation of the four series-connected battery module, and validation of the battery cell thermal model.

3.1. Battery Cell Model Calibration and Validation

An initial battery performance evaluation test was conducted on 27 cells disassembled from a hybrid electric vehicle battery pack. Each cell was charged to 4.17 V and then fully discharged to 2.46 V using 1 C rate in the initial evaluation test. The cell model parameter determination, correlation, and validation utilized six cells with best performance in the initial evaluation test. Figure 7a shows an experimental curve generated by averaging curve data for each testing case (1/3, 1/2, 1, 1.5, and 2 C discharging current). These tests were used to calibrate the cell model parameters. The determination of cell model parameters is presented in [30]. Examples of simulated and experimental discharging curves are shown in Figure 7b. A 7% or less discrepancy between simulations and experiments existed in the 0% to 80% DOD range during constant current discharge.

3.2. Cell Thermal Experiment and Validation

To ensure the battery cell completely cooled down or warmed up to a specific ambient temperature, the battery cell was kept charging by a small current to sustain its voltage in the neighbor of 4.17 V. The temperature chamber was then set to a specific temperature for 15 minutes before applying the discharging current. The validation process consisted of 12 discharging tests, which were 10 A, 20 A, and 40 A constant discharging currents, and each discharging test was conducted under 4 different ambient temperatures (−20, −10, 0, 20, and 50°C). The simulated discharging curves from each discharging current with specified ambient temperature were compared to corresponding experimental discharging curves. Examples of comparisons between simulated and experimental discharging curves using constant currents, 10 A, 20 A, and 40 A, under four different ambient temperatures are shown in Figure 8. A full comparison results is shown in [32]. In each discharging test, the experimental and the simulated discharging curves matched well in the range from 0% to 80% DOD (assuming 100% DOD at 2.5 V). The discrepancy between each comparison was under 7%. From the range of 80% to 100% DOD, the discrepancy became much larger. This large discrepancy might be due to the fact that battery model parameters were acquired in the nominal voltage of 3.6 V. The accuracy of the model was acceptable because most of the batteries only used up to 80% DOD. The experimental and simulated discharging time to reach 2.5 V were correlated in most test cases. Under higher ambient temperature (50 °C), the battery usable capacity increased so the total discharging time was longer than 1 hour for the one C-rate (20 A) discharging test. A similar phenomenon occurred in the one-half C-rate (10 A) test, which showed more than two hours discharging time. However, the Simulink model could not simulate the increase of battery usable capacity under high ambient temperature. Table 1 summarizes two correlated data under different ambient temperatures and discharging currents; discharging voltage at 50% DOD (assuming 100% DOD at 2.5 V) and total discharging time to reach 2.5 V are compared.

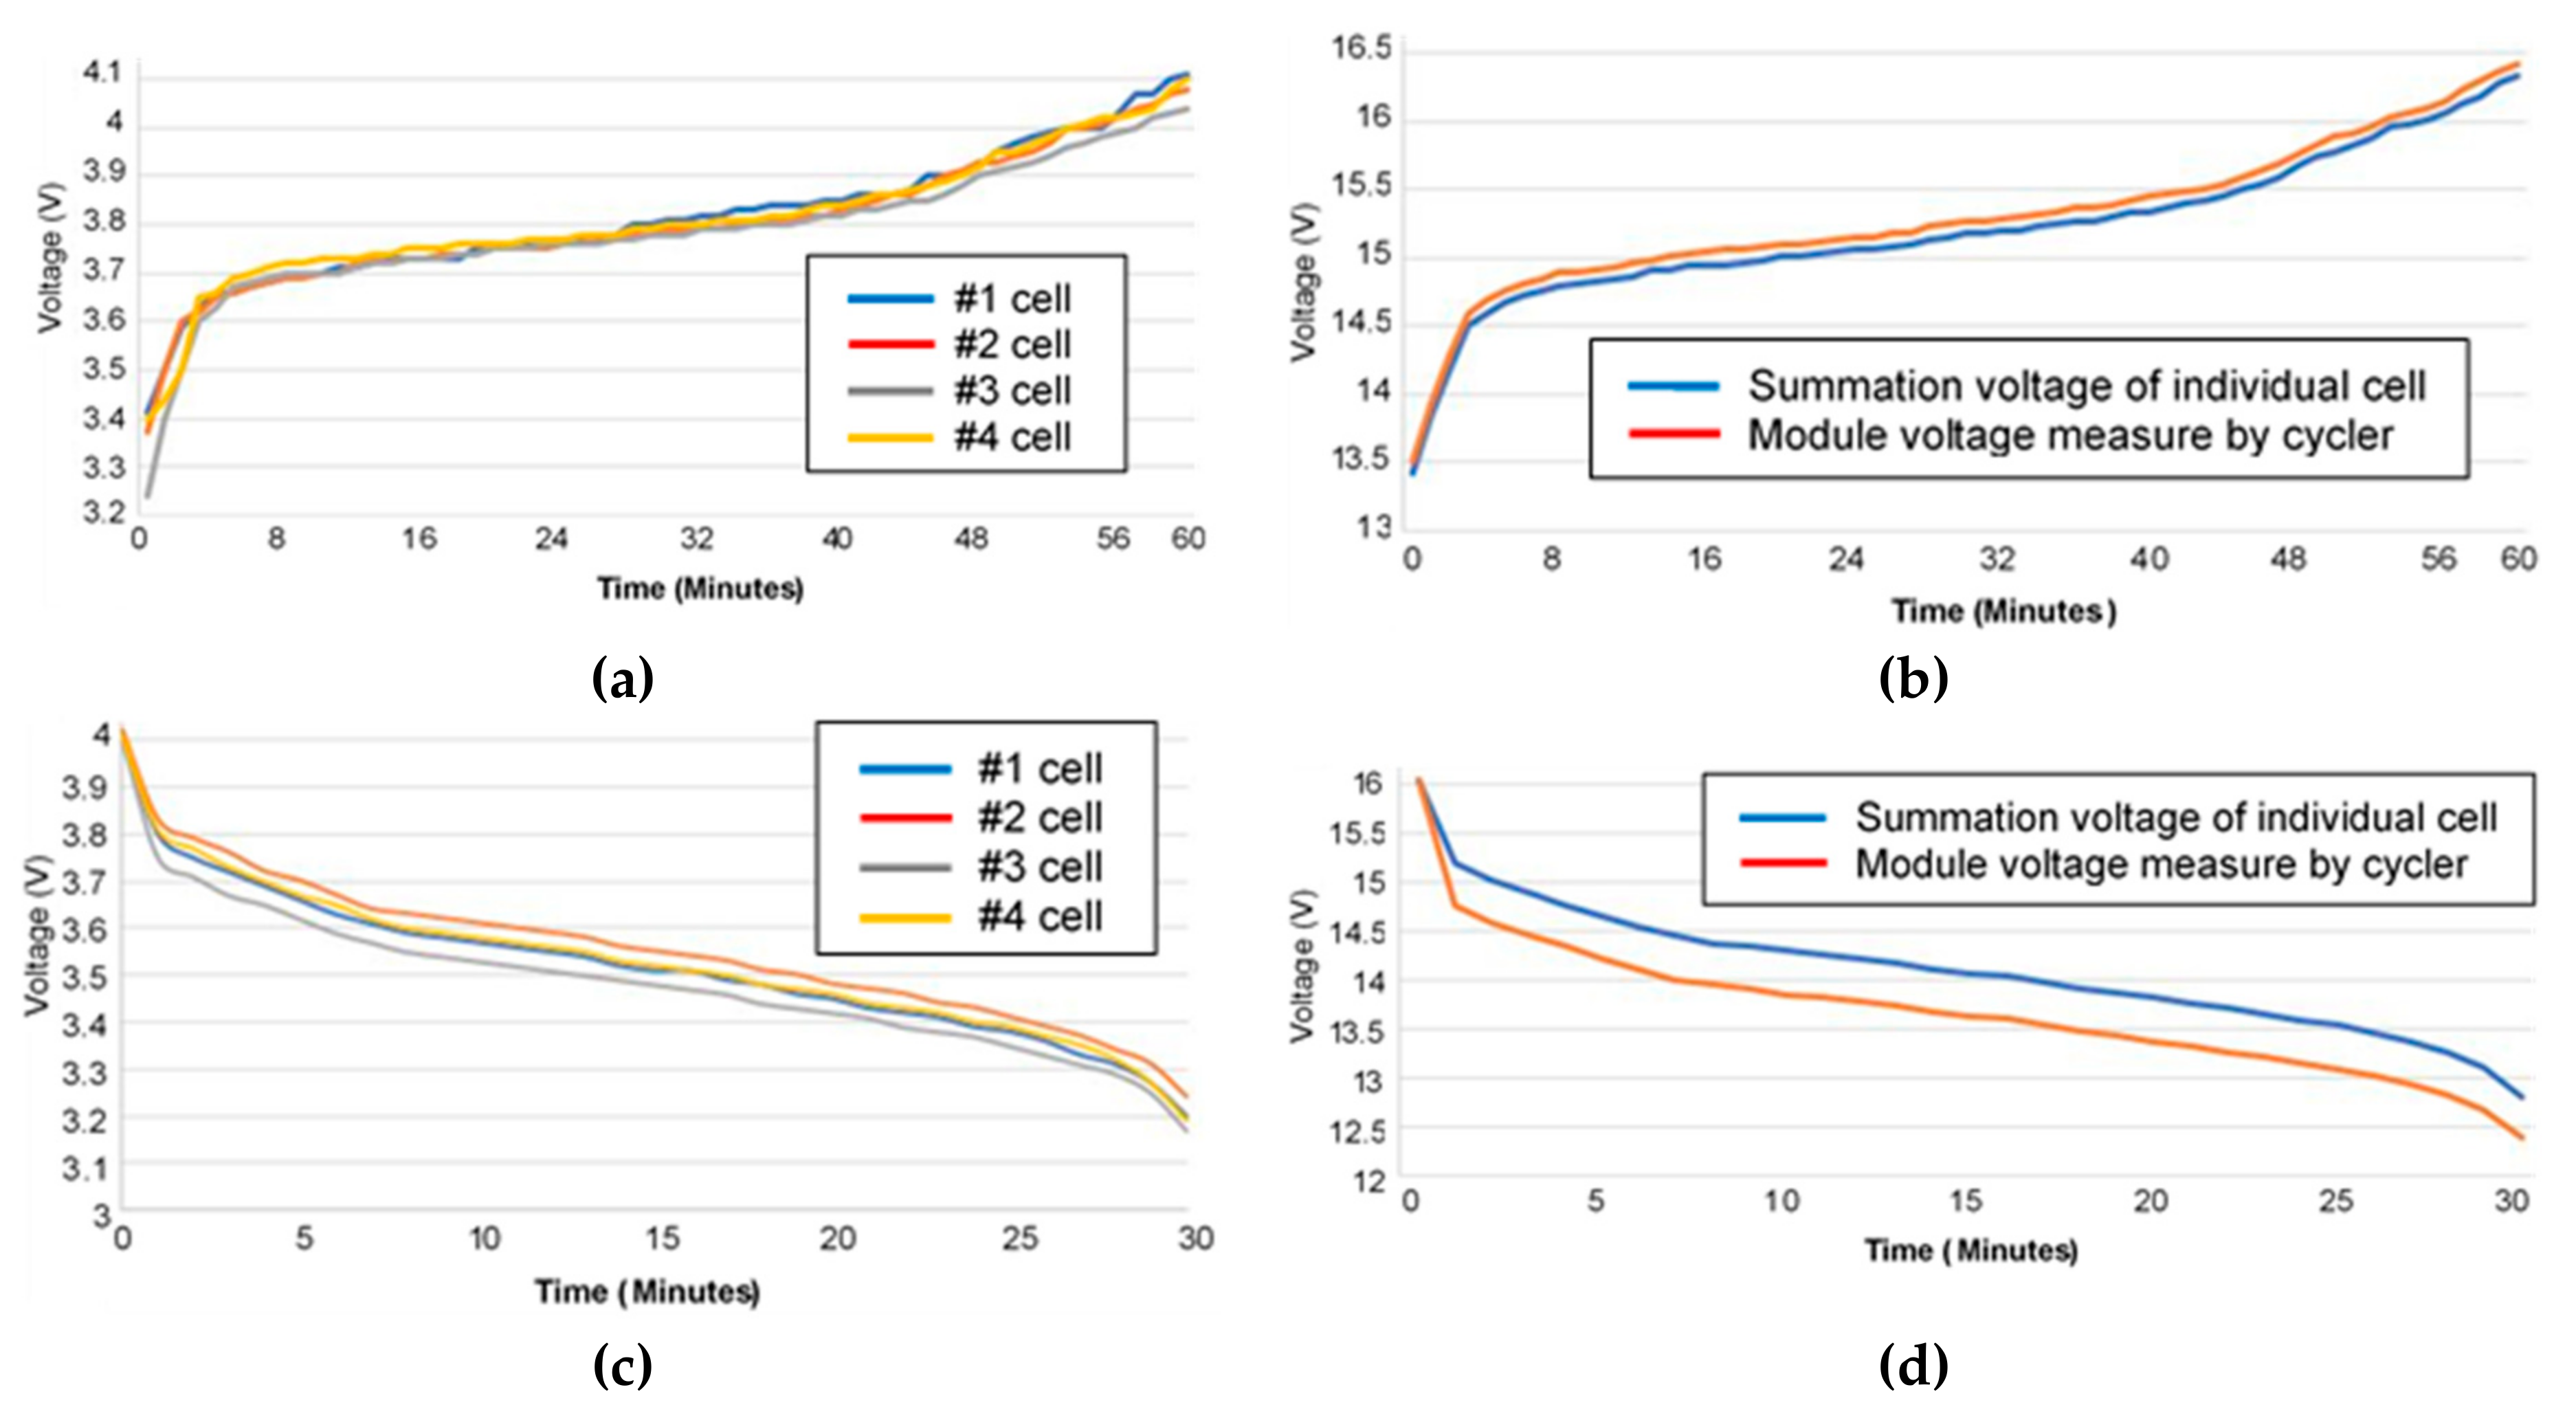
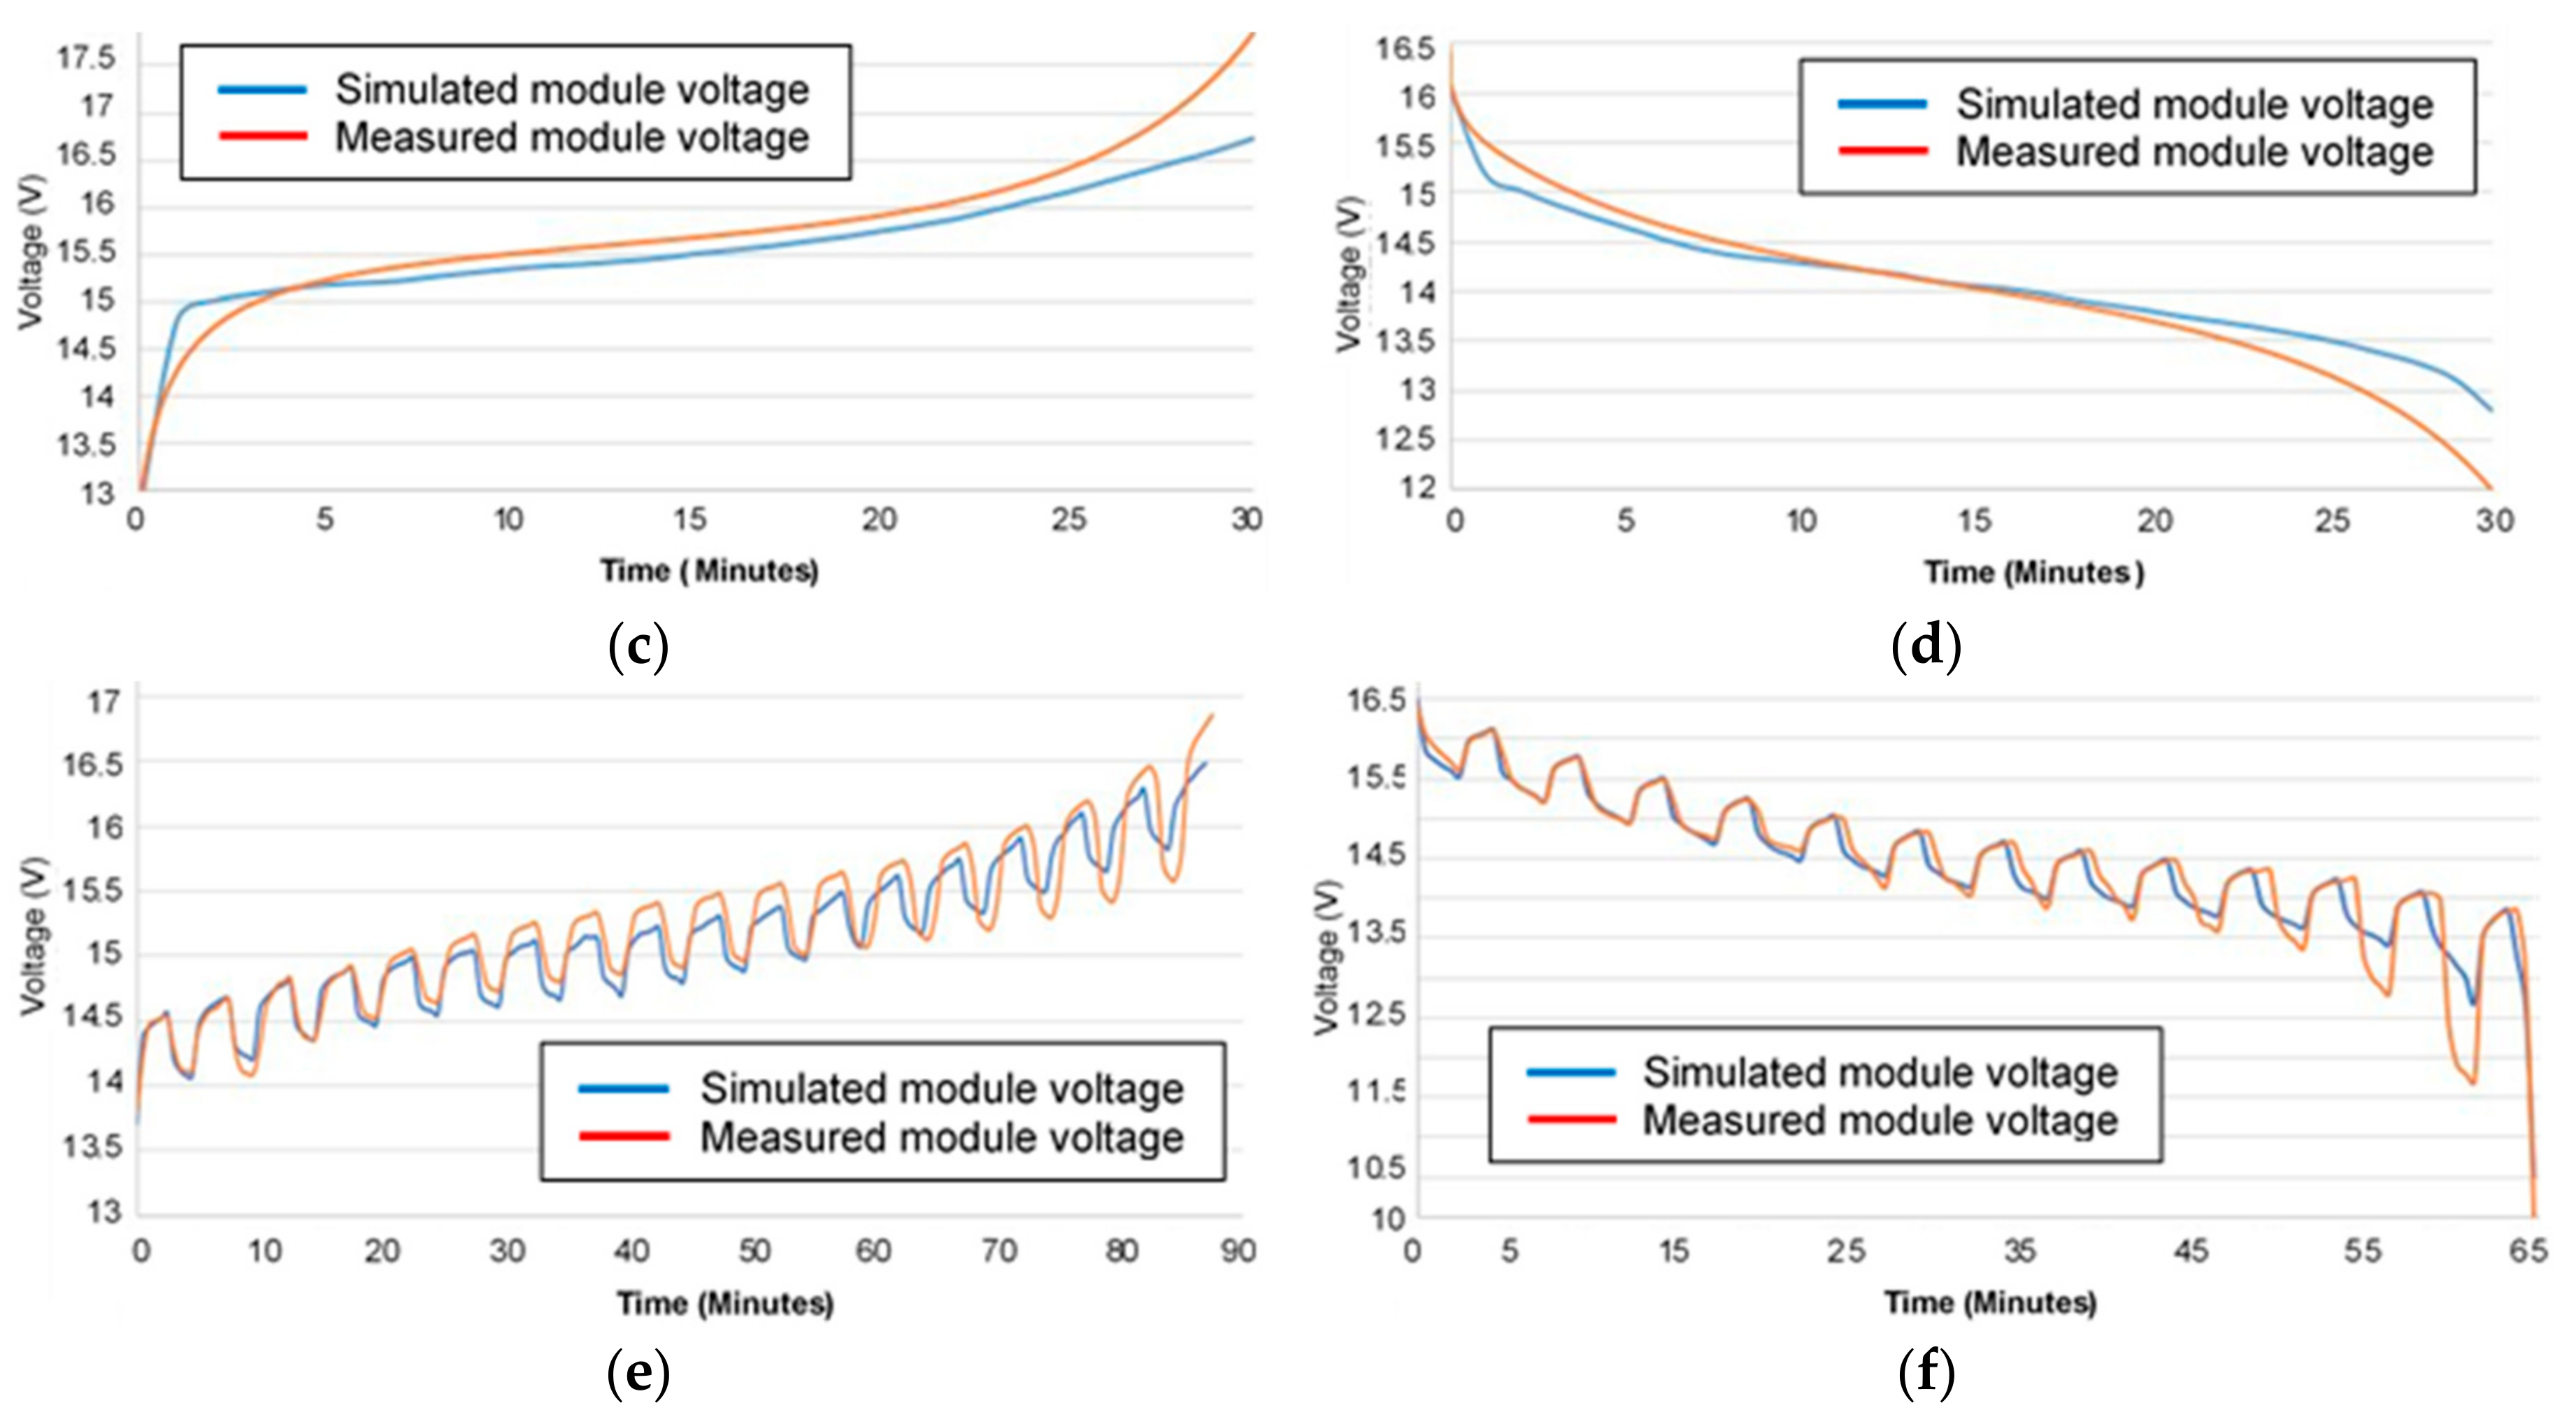
3.3. Battery Module Experiment and Validation

For the module testing, four series-connected cells formed a battery module, where the four cells were numbered from #1 to #4. This section was abstracted from [33]. The inconsistency of the cells was taken into account in the experiments and analytical models. All tests were conducted at a constant temperature of 25 °C in the chamber. Figure 6c shows the assembled-module experimental setup in the cycler. The four cells selected for the experiments had slightly different aging, internal resistance, and voltage, although they performed very similarly to each other (voltage variation between four cells was smaller than 0.08 V) under loads, as the example shows in Figure 9a. At any specific time, the difference between the highest and lowest voltage among the four cells was always no larger than 0.08 V. Figure 9b indicates that the module terminal voltage measured by the cycler was higher than the summation value of each cell terminal voltage (measured by individual voltmeter) during continuous charging. This phenonium might be due to internal resistances existing in the connecting wires between cells. The difference between cycler measurement and summation voltage became larger as the charging current increased (0.04 V for 10 A, 0.1 V for 20 A, 0.25 V for 30 A, and 0.5 V for 40 A). In continuously constant current discharge tests, each cell had very similar 10 A and 20 A discharging voltage curves. At any timeframe, the difference between the highest and lowest voltage among the four cells was always no larger than 0.15 V, as the example shows in Figure 9c. The internal resistances in the connecting wires between cells resulted in that module voltage measured by the cycler always being lower than the summation value of each cell terminal voltage measured by each individual voltmeter. As the discharging current increased, the voltage difference between the cycler measurement and summation became larger (0.05 V for 10 A, 0.2 V for 20 A, 0.3 V for 30 A, and 0.5 V for 40 A). This discrepancy was clearly observed during the 40 A discharging test shown in Figure 9d.
Comparing the simulated module voltage curves with experimental voltage curves generated by the summation of four individual cells was conducted for module model validation. The module voltage curve measured by the cycler was not used for comparison because it was affected by the resistance of the connecting wires. Figure 10a–d shows that all the simulated curves matched well with the experimental ones during continuous charging and discharging. An up to 9% discrepancy occurred at the end of each charging and discharging cycle. Figure 10e and f indicate that simulated pulse charging and discharging curves matched with the experimental ones, particularly in the beginning of the cycle. The largest discrepancy was 7.8%, which occurred at the end of the 30 A pulse discharge curve. The validation of the developed battery module model presented an acceptable discrepancy.
The BMS function was simulated in the battery module model with predefined initial conditions. In one example of 25 A continuous charge current to the model, Cell #4 reached 4.3 V earlier than other cells because Cell #4 had a higher initial voltage. Therefore, the BMS opened the cell breaker and closed the bypass breaker to prevent Cell #4 from being overcharged. The voltage of Cell #4 then dropped to 4.08 V, as shown in Figure 11a. In the other example of 35 A continuous discharge current, Cell #4 reached 2.3 V first because it had a lower initial voltage. The BMS opened the cell breaker and closed the bypass breaker to prevent Cell #4 from being overdischarged. The Cell #4 voltage then increased back to 2.8 V.

4. Twelve-Volt Battery Pack Model

The new designed or future vehicle needs an SLI battery with a higher capacity to support increasing vehicle accessory or auxiliary loads [35,36]. Additionally, the 12-volt battery pack could become a building module to form a high-voltage battery pack (such as 48-volts or higher) used in electrified vehicle and stationary electric energy storage for renewable energy. An 80 Ah SLT-type battery pack with 14.4 V nominal voltage is proposed in this study. This battery pack contains four modules connected in parallel where each module (14.4 V, 20 Ah) has four ePLB-C020 cells connected in series. A Simulink model of the proposed battery pack is shown in Figure 12.
The model scope displays the battery pack voltage, which is a summation of each module voltage. Both simulated battery pack and module have the same shapes of constant current charging/discharging voltage curves. Obviously, the pack has four times charging/discharging durations of the module. The pack voltage curves have large fluctuations in each pulse during 20 A pulse charge simulation (180 seconds charge, 120 seconds pause, and repeat) and 30 A pulse discharge simulation (180 seconds discharge, 120 seconds pause, and repeat), as indicated in Figure 13. Figure 14 shows the simulated discharging curves of a 14.4 V 80 Ah SLI battery with one C-rate (20 A) and two C-rate (40 A) under five ambient temperatures.

5. Conclusions

Modelling, simulation, and validation of SLT-type 12-volt lithium-ion polymer battery are presented in this paper. The MATLAB/Simulink-based modelling starts from using parameters deduced directly from single cell experiments, which provide convenient integration with actual cell monitoring, to a module containing four cells connected in series. A validated module model is utilized to model a high fidelity 80 Ah SLI-type battery pack with 14.4 V nominal voltage. The battery cell thermal effectiveness and battery management system functions are also considered. The experimental tests are carried out in an industry-scale setup with a charge/discharge cycler, temperature chamber, and computer-controlled software for battery testing.
In the cell-level model validation, either with or without thermal effectiveness, the experimental and the simulated discharging curves match well in the range from 0% to 80% DOD (assuming 100% DOD at 2.5 V). The discrepancy between each comparison is under 7%. From the range of 80% to 100% DOD, the discrepancy becomes much larger. The module model validation indicates a 9% or less discrepancy in all continuous and pulse charge/discharge simulation results. An 80 Ah SLI-type battery pack model with 14.4 V nominal voltage then can be achieved with statistical confidence.
The 12-volt lithium-ion battery packs might be ready for mainstream adoption in automotive SLI, stop–start engine idling elimination, and UPS applications. Additionally, the 12-volt battery pack could become a building module to form a high-voltage battery pack (such as 48-volts or higher) used in electrified vehicle and stationary electric energy storage for renewable energy. The proposed simulation model provides design guidelines for lithium-ion polymer batteries in electric-drive vehicle and stationary energy storage applications.

Author Contributions

Experiment, Software Simulation, Y.L.; Paper Writing, Y.L., Y.G.L.; Paper Review and Editing, Y.G.L., M.-C.L. All authors have read and agreed to the published version of the manuscript.

Funding

This work was supported in part by the National Science Foundation, ATE: Centers, under grant number DUE-1801150.

Conflicts of Interest

The authors declare no conflict of interest.

References

  1. Hesse, H.C.; Schimpe, M.; Kucevic, D.; Jossen, A. Lithium-ion battery storage for the grid - a review of stationary battery storage system design tailored for applications in modern power grids. Energies 2017, 10, 2107. [Google Scholar] [CrossRef] [Green Version]
  2. Larson, S. Energy Storage in Utility Systems. 2019. Available online: https://www.eiseverywhere.com/file_uploads/05612c1b0b638b14d1ede35138c07afc_EnergyStorage_HRS_2019-02-04.pdf (accessed on 20 August 2019).
  3. Porsche Offers Li-ion Starter Battery Option. 23 November 2009. Available online: http://www.greencarcongress.com/2009/11/porsche-liion-20091123.html (accessed on 30 May 2019).
  4. Ding, Y.; Zanardelli, S.; Skalny, D.; Toomey, L. Technical challenges for vehicle 14V/28V lithium ion battery replacement. In Proceedings of the SAE International 2011 World Congress, Detroit, MI, USA, 12–14 April 2011. Paper No. 2011-01-1375. [Google Scholar]
  5. Nunez, F.; Pugsley, J.; Shields, R.; Heilbrun, R.; Dobley, A. 6T format lithium ion batteries in 12V and 24V configurations. In Proceedings of the Joint Service Power Expo, Cincinnati, OH, USA, 26 August 2015. [Google Scholar]
  6. Reddy, T. (Ed.) Linden’s Handbook of Batteries, 4th ed.; McGraw Hill: New York, NY, USA, 2010; p. 27.3. [Google Scholar]
  7. Huggins, R. Energy Storage; Springer: Cham, Switzerland, 2016; pp. 323–338. [Google Scholar]
  8. Ji, Y.; Zhang, Y.; Wang, C.Y. Li-ion cell operation at low temperatures. J. Electrochem. Soc. 2013, 160, 636–649. [Google Scholar] [CrossRef]
  9. Pesaran, A.; Santhanagopalan, S.; Kim, G.H. Addressing the impact of temperature extremes on large format Li-ion batteries for vehicle applications. In Proceedings of the 30th International Battery Seminar, Ft. Lauderdale, FL, USA, 10–14 May 2013. [Google Scholar]
  10. Pesaran, A. Battery thermal models for hybrid vehicle simulations. J. Power Sources 2002, 110, 377–382. [Google Scholar] [CrossRef]
  11. Kim, J.; Oh, J.; Lee, H. Review on battery thermal management system for electric vehicles. J. Appl. Therm. Eng. 2019, 149, 192–212. [Google Scholar] [CrossRef]
  12. Belt, J.R.; Ho, C.D.; Miller, T.J.; Habib, M.A.; Duong, T.Q. The effect of temperature on capacity and power in cycled lithium ion batteries. J. Power Sources 2005, 142, 354–360. [Google Scholar] [CrossRef]
  13. Fan, J.; Tan, S. Studies on charging lithium-ion cells at low temperatures. J. Electrochem. Soc. 2006, 153, 1081–1092. [Google Scholar] [CrossRef]
  14. Ping, P.; Peng, R.; Kong, D.; Chen, G.; Wen, J. Investigation on thermal management performance of PCM-fin structure for Li-ion battery module in high-temperature environment. J. Energy Convers. Manag. 2018, 176, 131–146. [Google Scholar] [CrossRef]
  15. Li, J.; Mazzola, M.S. Accurate battery pack modelling for automotive applications. J. Power Sources 2013, 237, 215–228. [Google Scholar] [CrossRef]
  16. Githin, K.; Prasad, G.K.; Rahn, C.D. Reduced order impedance models of lithium ion batteries. J. Dyn. Sys. Meas. Control 2014, 136, 041012. [Google Scholar]
  17. Putra, W.S.; Dewangga, B.R.; Cahyadi, A. Current estimation using Thevenin battery model. In Proceedings of the Electric Vehicular Technology and Industrial, Mechanical, Electrical and Chemical Engineering Conference, Surakarta, Indonesia, 4–5 November 2015. [Google Scholar]
  18. Barsali, S.; Ceraolo, M. Dynamical models of lead-acid batteries: Implementation issues. IEEE Trans. Energy Convers 2002, 17, 16–23. [Google Scholar] [CrossRef]
  19. Schweighofer, B.; Raab, K.M.; Brasseur, G. Modelling of high power automotive batteries by the use of an automated test system. IEEE Trans. Instrum. Meas. 2003, 52, 1087–1091. [Google Scholar] [CrossRef]
  20. Buller, S.; Thele, M.; De Doncker, R.W.; Karden, E. Impedance based simulation models of supercapacitors and Li-ion batteries for power electronic applications. In Proceedings of the Industry Applications Conference, Salt Lake City, UT, USA, 12–16 October 2003. [Google Scholar]
  21. Baudry, P.; Neri, M.; Gueguen, M.; Lonchampt, G. Electro-thermal modelling of polymer lithium batteries for starting period and pulse power. J. Power Sources 1995, 54, 393–396. [Google Scholar] [CrossRef]
  22. Rao, R.; Vrudhula, S.; Rakhmatov, D.N. Battery modelling for energy-aware system design. Computer 2003, 36, 77–87. [Google Scholar]
  23. Benini, L.; Castelli, G.; Macii, A.; Macii, E.; Poncino, M.; Scarsi, R. Discrete-time battery models for system-level low-power design. IEEE Trans. VLSI Syst. 2001, 9, 630–640. [Google Scholar] [CrossRef]
  24. Gold, S. A PSPICE macromodel for lithium-ion batteries. In Proceedings of the Twelfth Annual Battery Conference on Applications and Advances, Long Beach, CA, USA, 14–17 January 1997; pp. 215–222. [Google Scholar]
  25. Camacho-Solorio, L.; Krstic, M.; Klein, R.; Mirtabatabaei, A.; Moura, S.J. State estimation for an electrochemical model of multiple-material lithium-ion batteries. In Proceedings of the ASME 2016 Dynamic Systems and Control Conference, Minneapolis, MN, USA, 12–14 October 2016. [Google Scholar]
  26. Chen, M.; Rincon-Mora, G.A. Accurate electrical battery model capable of predicting runtime and I-V performance. IEEE Trans. on Energy Convers. 2006, 21, 504–511. [Google Scholar] [CrossRef]
  27. Yao, L.W.; Aziz, J.A.; Kong, P.; Idris, N.R. Modelling of lithium-ion battery using MATLAB/Simulink. In Proceedings of the IECON 2013—39th Annual Conference of the IEEE Industrial Electronics Society, Vienna, Austria, 10–13 November 2013. [Google Scholar]
  28. Garcia-Valle, R.; Peças Lopes, J.A. Electric Vehicle Integration into Modern Power Networks; Springer Science+Business Media: New York, NY, USA, 2013; pp. 36–42. [Google Scholar]
  29. Dao, T.; Schmitke, C. Developing mathematical models of batteries in modelica for energy storage applications. In Proceedings of the 11th International Modelica Conference, Versailles, France, 21–23 September 2015. [Google Scholar]
  30. Liu, Y.; Liao, Y.G.; Lai, M.C. Development and validation of a lithium-ion polymer battery cell model for 12V SLI battery applications. In Proceedings of the ASME International Design Engineering Technical Conferences and Computer & Information in Engineering Conference, Quebec City, QC, Canada, 26–29 August 2018. [Google Scholar]
  31. MathWorks. Available online: https://www.mathworks.com/help/physmod/sps/powersys/ref/battery.html (accessed on 1 March 2019).
  32. Liu, Y.; Liao, Y.G.; Lai, M.C. Ambient temperature effect on performance of a lithium-ion polymer battery cell for 12-voltage applications. In Proceedings of the ASME International Mechanical Engineering Congress and Exposition, Salt Lake City, UT, USA, 11–14 November 2019. [Google Scholar]
  33. Liu, Y.; Liao, Y.G.; Lai, M.C. Modelling and validation of lithium-ion polymer SLI battery. In Proceedings of the SAE International 2019 World Congress, Detroit, MI, USA, 9–11 April 2019. Paper No. 2019-01-0594. [Google Scholar] [CrossRef]
  34. Battery Manager 4 Manual, Digatron Power Electronics, Inc. 2014. Available online: http://www.digatron.com/nc/en/home/ (accessed on 8 March 2019).
  35. Ceraolo, M.; Huria, T.; Pede, G.; Vellucci, F. Lithium-ion starting-lighting-ignition batteries: Examining the feasibility. In Proceedings of the 2011 IEEE Vehicle Power and Propulsion Conference, Chicago, IL, USA, 5–8 September 2011. [Google Scholar]
  36. Fehrenbacher, C. 12V Li-ion batteries—Ready for Mainstream adoption. In Proceedings of the Advanced Automotive Battery Conference, Mainz, Germany, 30 January 30–2 February 2017. [Google Scholar]
Figure 1. Thevenin with runtime-based model.
Energies 13 00638 g001
Figure 2. Developed cell model with three inputs.
Energies 13 00638 g002
Figure 3. Simulink submodels for developed cell model: (a) Calculation of R and C value; (b) Calculation of SOG; (c) Calculation of RC parallel voltage; (d) Calculation of VS.
Energies 13 00638 g003
Figure 4. Battery cell thermal model in Simulink.
Energies 13 00638 g004
Figure 5. A Simulink battery module model consisting of four series-connected cells.
Energies 13 00638 g005
Figure 6. Battery experimental test setup: (a) Cycler and chamber; (b) cell testing; (c) module testing.
Energies 13 00638 g006
Figure 7. Examples of simulated and experimental discharging curves: (a) Averaged constant current discharging curves from tests; (b) simulated and test constant current discharging curves; (c) simulated and test constant current discharging curves; (d) simulated and test pulse discharging.
Energies 13 00638 g007
Figure 8. Examples of comparisons between simulated and experimental 20A discharging curves in battery module: (a) 0 °C; (b) 50 °C.
Energies 13 00638 g008
Figure 9. Examples of cell and module charging/discharging curves from tests: (a) Individual cell voltage in 20 A charging; (b) module voltage in 20 A charging; (c) individual cell voltage in 40 A discharging; (d) module voltage in 40 A discharging.
Energies 13 00638 g009
Figure 10. Comparisons of module simulated and experimental charging/discharging curves: (a) Simulated and test of 20 A charging in module; (b) simulated and test of 20 A discharging in module; (c) simulated and test of 40 A charging in module; (d) simulated and test of 40 A discharging in module; (e) simulated and test of 20A pulse charge in module; (f) simulated and test of 30A pulse discharge in module.
Energies 13 00638 g010aEnergies 13 00638 g010b
Figure 11. Demonstration of BMS functions: (a) 25 A continuous charging; (b) 35 A continuous discharging.
Energies 13 00638 g011
Figure 12. Simulink model of an 80 Ah SLI-type battery pack.
Energies 13 00638 g012
Figure 13. Voltage curves of the 80 Ah SLI battery pack during pulse charging and discharging simulations: (a) Charging; (b) discharging.
Energies 13 00638 g013
Figure 14. Simulated discharging curves of a 14.4 V 80 Ah SLI battery under five ambient temperatures: (a) One C-rate (20 A); (b) two C-rate (40 A).
Energies 13 00638 g014
Table 1. Summary of comparisons between experimental and simulation results.
Discharging Current
10 A20 A40 A
Ambient Temp (°C)ExperimentSimulationExperimentSimulationExperimentSimulation
V (50% DOD) Dis. time (s)V (50% DOD) Dis. time (s)V (50% DOD) Dis. time (s)
–203.15; 42003.15; 40003.05; 20723.07; 20102.95; 10763.02; 1020
–103.17; 49553.22; 49453.14; 24103.16; 23193.07; 12203.12; 1235
03.32; 56603.37; 58933.38; 28353.32; 28563.17; 14273.26; 1436
203.56; 71433.57; 71933.54; 35333.54; 35953.45; 17123.46; 1788
503.71; 76023.80; 71753.62; 37013.76; 36003.52; 17453.68; 1799

