Article

Sludge Stabilization Process, Drying Depth and Polymeric Material Addition: Implication on Nitrogen Content, Selected Chemical Properties and Land Requirement in Sand Drying Beds

1
Department of Plant and Soil Sciences, University of Pretoria, Private Bag X 20, Hatfield, 0028 Pretoria, South Africa
2
Department of Crop and Soil Sciences, Washington State University, Puyallup, WA 99164-6420, USA
*
Authors to whom correspondence should be addressed.
Energies 2020, 13(24), 6753; https://doi.org/10.3390/en13246753
Submission received: 17 October 2020 / Revised: 25 November 2020 / Accepted: 8 December 2020 / Published: 21 December 2020
(This article belongs to the Special Issue Energy and Matter Recovery from Organic Waste Processing and Reuse)

Abstract

:
Drying beds are a simple and economical means to dewater municipal sludge and are widely used in places with a suitable climate for air-drying. However, research-based information on drying thickness/drying depth effects on nutrient content and land size requirements for sludge drying is scarce. In this study, aerobically digested (AeD), and anaerobically digested without polymer (AnDP0) and with polymer (AnDP1) sludge types were dried in sand drying beds at 5, 10, 15, 20 and 25 cm depths in South Africa. Measured nitrogen (N) fractions and other parameters were more strongly influenced by sludge types than by drying depth. Total N content followed the order of AeD > AnDP1 > AnDP0. Polymeric material addition tended to increase total and inorganic N content and reduce the length of sludge drying period and land size requirement. The study showed that larger land size is required to dry sludge at shallower depths, even though the sludge dried more quickly. Drying sludge at 15 cm was the best option across sludge types in winter, taking an average land area between 261 and 383 m2 over the fewest days of sludge drying, whereas in spring, drying at 20 to 25 cm depth was most favorable. The findings suggest that drying bed management can be based on land area requirements with little concern for biosolid quality changes. For wastewater treatment plants relying on drying in beds, adding polymeric materials may be beneficial where land area for drying beds is limited, but not otherwise. Therefore, land availability is critical in decision making for sustainable sludge drying thickness.

1. Introduction

Wastewater municipal sludge production is increasing globally. This has been attributed to the steady growth in the population [1], industry expansion [2], and urbanization [3]. Sludge post-treatment operations, such as handling, transportation, and sustainable disposal options, have become a global concern. Costs associated with these operations are prohibitive, particularly when sludge volumes are steadily accumulating. Innovations targeting the reduction of sludge volumes at minimal cost, for example, sludge drying [4], have been observed as a primary objective by several countries. The quest to produce high quality sludges that pose no risks to the environment and public health has also made sludge drying and other stabilization processes important and popular operations [5,6] in municipal wastewater management circles. The need to produce high quality and non-polluting sludges has incentivized various countries to implement policies and regulations that govern acceptable sludge quality, its handling and disposal compliance by wastewater treatment plants (WWTPs), and other stakeholders involved in the production and use of sludge.
In view of the need for curtailing environmental pollution from sludge disposal, improving sludge quality, and/or reducing sludge volumes, various treatment and post-treatment processes need to be observed. These include sludge drying [4,7], which is a post-treatment technology that reduces sludge volume, thus reducing costs of sludge handling, transportation, and land application [8]. Various technological options are currently available globally for post-treatment processes, including thermal drying, belt pressing, and drying in sand, concrete-lined and reed beds. Solar drying, which traditionally been in the form of sun drying on sand or concrete-lined and reed beds, is still commonly used in both developed and developing countries. Advantages of this system of drying sludge in beds are that it requires low operational skills and is associated with low running costs [9], whereas mechanical and conventional drying techniques have high establishment and operational costs, in addition to the need for a high-capacity external power supply [10].
By design, drying beds are shallow pond/basin structures of varying lengths and breadths (depending on land availability) that are mostly 25 to 30 cm in depth. Fundamentally, drying beds operate naturally, that is, sludge is dried using sun energy and circulating air. Evaporation and infiltration [11] are the major water content reduction pathways, particularly in sand beds. However, in concrete-lined drying beds, suspended supernatant is drained through drainage plugs soon after the solids are settled at the bottom of the beds, about 2–3 days after sludge has been loaded.
A large quantity of information has been documented regarding the physical, chemical, and biological changes that take place during drying, however, this is largely based on sludge drying in reed beds [8,12], an option that has been in global use for decades. Reed-bed drying is considered an environmentally friendly and cost-effective wastewater treatment system [13]. Reed beds are constructed basins lined with stones and gravel materials, and fitted with perforated drainage pipes [14]. Plants are then planted in the beds. Phragmites ausralis is the commonly chosen type of reed plant [15]. Such a choice is influenced by the capacity of Phragmites ausralis to increase aeration of the system, and its capability to enhance water, nutrient, and heavy metal uptake. In this kind of system, sludge loading is performed occasionally and continues for months or years, while dewatering and stabilization takes place continuously. This then results in increased sludge thickness in the beds due to periodic sludge accumulation. The thickness is largely determined by the length of the sludge loading period, in addition to the time required for beds to age before sludge is removed. In such systems, evapotranspiration and draining water through drainage pipes facilitate the dewatering process. Growing plants involved in this system take up nutrients and pollutants from the loaded sludges, and microorganisms facilitate the process of mineralization. In conjunction with organic matter humification, these form the primary drivers of the sludge stabilization process in reed beds. Sludges from this system have been extensively studied and a wide variation in sludge characteristics has been observed, largely due to the drying thickness and length of the period during which sludge is exposed to stabilization conditions.
In some instances, WWTPs use alternative dewatering techniques other than drying in beds, for example, belt pressing, which normally precedes stock-piling on land. To enhance dewatering during belt pressing, WWTPs add polymeric materials to liquid sludge before channeling it for pressing. Polymers used at WWTPs for wastewater treatment exist as organic or inorganic materials, which are either cationic, non-ionic, amphoteric, or anionically charged materials [16]. Their major purpose is to enhance effluent flocculation, which influences dewaterability for WWTPs that use belt pressing as their sludge dewatering technique [17]. Flocculation is a process involving aggregation of suspended particles using a bridging or patch mechanism [18]. This process was observed as a simple means of separating solid–liquid fractions during which suspended and dissolved solids, colloids, and organic matter are efficiently removed from wastewater [19]. Generally, the working principle of these polymers is based on their charged sites, which, upon application to wastewater, are attracted and attached to the negatively charged surfaces of the colloids, through which they neutralize these negatively charged particles and bridge the destabilized particles to form flocs [20,21].
As the formation of flocs takes place, it is believed that the flocs combine into large and dense agglomerates resulting in increased velocity of sludge water release [22]. This therefore means that sludges with polymers can dry faster due to the accelerated release of water from the sludge particles [22] compared to those without polymer.
Sludge drying in beds is a continuation of stabilization processes occurring in WWTPs. Thus, a potential change to physical, chemical, and biological sludge characteristics is expected during these stabilization processes. Some literature [8,23] has indicated that sludge drying in reed beds results in changes in nutrient composition and heavy metals with sludge layer depth. In another study in Saudi Arabia, Al-Malack [24] studied nutrient dynamics relative to drying thickness in sludge drying beds (conventional sand-drying beds). However, there is still little knowledge on the implications of drying thickness on the dynamics of chemical properties, particularly sludge nutrient composition in conventional sand drying beds. In addition, to the best of the authors’ knowledge, it is not yet known how addition of polymeric material affects sludge nutrient content, either during stock-piling or when such sludges are dried in drying beds. Although the current study has some similarity to that undertaken by Al-Malack [24], the climatic conditions (the driver of the drying process in drying beds) are completely different between Saud Arabia and South Africa. More importantly, sludge is a complex organic material that is dynamic and unique [25]. This implies that even when different types of sludge are subjected to similar stabilization processes, differences in their properties should be expected. Therefore, this justifies the need for independent site- or region-specific studies, rather than generalizing conclusions across regions based on results obtained from a single study or studies carried out elsewhere.
Land is a scarce resource in cities and towns, yet WWTPs require land to establish sufficient drying beds to handle their sludge production. WWTPs need to effectively run their operations at minimum cost, which implies maximum utilization of available land for drying beds during sludge drying. There is lack of locally generated information on the most suitable and sustainable sludge drying depth corresponding with maximum land utilization while retaining crucially required nutrients, such as N, in sludges targeted for agricultural use. The novelty of this study relates to resource recovery from municipal wastewaters, that is, nutrient retention during drying of sludge targeted for agricultural use, and elucidating the sludge drying thickness that enhances maximum land utilization when designing sand drying beds.
Therefore, in the current study, the objectives were as follows: (1) To assess the effect of (a) drying depth/thickness and (b) sludge type (based on wastewater treatment/stabilization process and polymer addition) on nitrogen content and other selected sludge chemical properties during sludge drying in sand-drying beds in winter and spring. (2) To determine sustainable sludge drying land size requirements based on the drying cycle (number of days required to dry a single sludge loading) of each drying depth. Anaerobic without polymer (AnDP0), anaerobic with polymer (AnDP1), and aerobic (AeD) sludges treated and collected from a single WWTP were used for this study. The following hypotheses were made: (i) N and other nutrient concentrations will increase with increasing drying depth. This hypothesis assumes that the shorter the time sludge takes to dry, the fewer nutrients are mineralized; hence, shallower depths are expected to result in lower mineral N concentrations relative to deeper drying depths. (ii) Land required for sludge drying will be inversely proportional to drying depth.

2. Materials and Methods

2.1. The Site

The sludge drying experiment was conducted at one of the East Rand Water Care works, south of Johannesburg in Gauteng province, South Africa. The site is located at 26°26.212′ S and 28°06.124′ E.

2.1.1. Experimental Layout

The experiment was conducted at five drying thicknesses/depths, once in winter and once in spring. The winter drying phase was from May to July, and the spring drying phase was conducted from August to September, all in 2017. Drying thicknesses of 5, 10, 15, 20, 25 cm were compared. Three sludge types (aerobic sludge (AeD), and anaerobic digested sludge without polymer (AnDP0) and with polymer (AnDP1)) collected from a single source (WWTP) were used for the study. The polymer applied to AnDP1 sludge by the WWTP was FLOPAM™ FO 4490. This is an organic cationic polymeric flocculant. Each drying depth was replicated three times for each sludge type. Each sludge type was assigned to drying beds in a randomized complete block design and dried at once for each drying phase. Each phase was constituted of 5 drying depths × 3 sludge treatments × 3 replications resulting in a total of 45 drying beds. Samples of liquid sludge were collected at the beginning of each drying phase and these were the initial samples, then followed by dried samples collected from dried sludges in drying beds.
The drying cycle of each phase depended on the maximum number of days (drying period) taken by each sludge type’s deepest depth/maximum thickness (25 cm) to reach 90% solid concentration (10% moisture content) in drying beds. Sand drying beds were used and, by design, these measured 0.5 m for their length, width, and depth. The basement and walls of the drying beds were lined with a geo-fabric material that only allowed liquid to drain while retaining all of the solids to avoid soil–sludge contact.

2.1.2. Weather Data

An automatic weather station was installed within the vicinity of the experimental site to automatically collect weather data. The weather station consisted of an LI200X pyranometer model PY4034 (LiCor, Lincoln, NE, USA) for measuring solar radiation, an electronic relative humidity sensor (Thermistor Humitter 50Y) and temperature sensor installed in a Gill screen, an electronic cup anemometer and wind vane to measure wind speed and wind direction, respectively (R.M. Young, MN, USA), and an electronic rain gauge Model TR-525M-R2 (Texas Electronic Inc., Dallas, TX, USA). The data was collected and stored in a CR800 series data-logger (Campbell Scientific Inc., Logan, UT, USA) which was programmed to collect the data on hourly and daily bases (after every 24 h), which was downloaded for analysis soon after the scheduled drying phases.

2.1.3. Sampling and Storage

During sludge drying, samples were collected from the drying beds for analysis of targeted physical and chemical properties. The first sampling for initial samples was performed on day 1, that is, on the initial day of loading wastewater into the drying beds. At each drying phase, the initial samples were liquid sludge collected as fractions from the whole lot that was loaded into the drying bed. About 20 L of each sludge type was collected on each initial day of laying out the experiment from which the sub-samples (initial samples) were taken for analyses. The second or final samples per drying depth were then collected once the sludge reached 10% moisture content. At this point, the experiment was then terminated once the thickest (25 cm) drying depth reached the target moisture content or attained 90% solid concentration. Samples were collected (about 500 g dry sludge) into white plastic containers, closed, and transported for storage under a controlled temperature (4 °C) in cold rooms at the University of Pretoria until laboratory tests were conducted. Initial samples were also kept under the same storage conditions before analyses.
Between day 1 and the final sampling day, random moisture changes were monitored on a weekly basis. During the moisture content (MC%) change monitoring period, moisture was determined using the gravimetric method:
M C % = ( W e t   s a m p l e   ( g ) D r y   s a m p l e   ( g ) ) W e t   s a m p l e   ( g ) × 100
Thus, a portion was taken from each treatment, weighed, and dried in an oven at 105 °C for 24 h in the laboratory after which the moisture content was determined. At each sampling, the collected portion was a slice running down from the surface to the base of the drying sludge. This was done to provide a general moisture measurement covering the whole depth of a specific drying thickness.

2.1.4. Land Size Requirement Computation

The land size requirement for sludge drying per given drying depth was computed based on several considerations. The factors considered included drying depth, length of drying period for each drying depth, average daily wastewater inflow, average daily sludge production, and drying cycle (maximum number of days needed to dry sludge at 25 cm drying depth to target moisture content). In conjunction with the above factors, the following assumptions based on the work by Andreoli et al. [26] were taken into consideration to simplify the computations: (a) The WWTP receives wastewater inflow from a city of 100,000 inhabitants. Each inhabitant contributes 0.4 L of liquid waste per day. (b) The sludge produced and loaded to drying beds after treatment is of 3.5% solid content. (c) Sludge is loaded to drying beds on a daily basis with a daily average of 1.4 m3 wet solid sludge load per day. The summary of the computations performed are shown in Section 3.7.

2.1.5. Analytical Procedures

Initial samples were analyzed in their liquid state for all parameters, with the exception of total N and total C. For the analyses done in the liquid state of the initial samples, portions of approximately 10 mL were taken from well homogenized composite samples, which were analyzed in their original state without water dilution. The other parameters were analyzed after oven drying. Oven drying was performed at ±30 °C to the desired moisture content. Dried sludges were milled and sieved through a 2 mm sieve to homogenize the samples. Electrical conductivity (EC) was measured by the EC meter, and pH reading was conducted using a pH meter. These were measured in a sludge–water suspension prepared at 1:2.5 (m/v) sample-to-water ratio for dried sludge or directly from liquid portions for initial sludge. Ammonium N (NH4-N) was analyzed using the colorimetric method with a Lachat Auto-analyzer (Lachat Quick Chem Systems, Milwaukee, WI USA). Nitrate N (NO3-N) was analyzed by ion chromatography. These inorganic N fractions were determined after 1 M KCl extraction. Total C (TC) and total N were analyzed using the total combustion method with a Carlo Erba Na1500 C/N analyzer (Carlo Erba Strumentazione, Milan, Italy). An inductively coupled plasma-optical emission spectrometer (ICP-OES) was used for total P analysis after the samples were subjected to a microwave-assisted nitric and perchloric acid mixture digestion.

2.1.6. Statistical Analyses

The SigmaPlot 13.0 version statistical package was used to test the treatment effects on N nutrient content and the other selected parameters analyzed. The data was subjected to a two-way analysis of variance (ANOVA) at a threshold p value of 0.05 with sludge type and drying depths as main factors. Where treatment effects were significant, the Duncan multiple range test (α = 0.05) was used to separate the means.

3. Results and Discussion

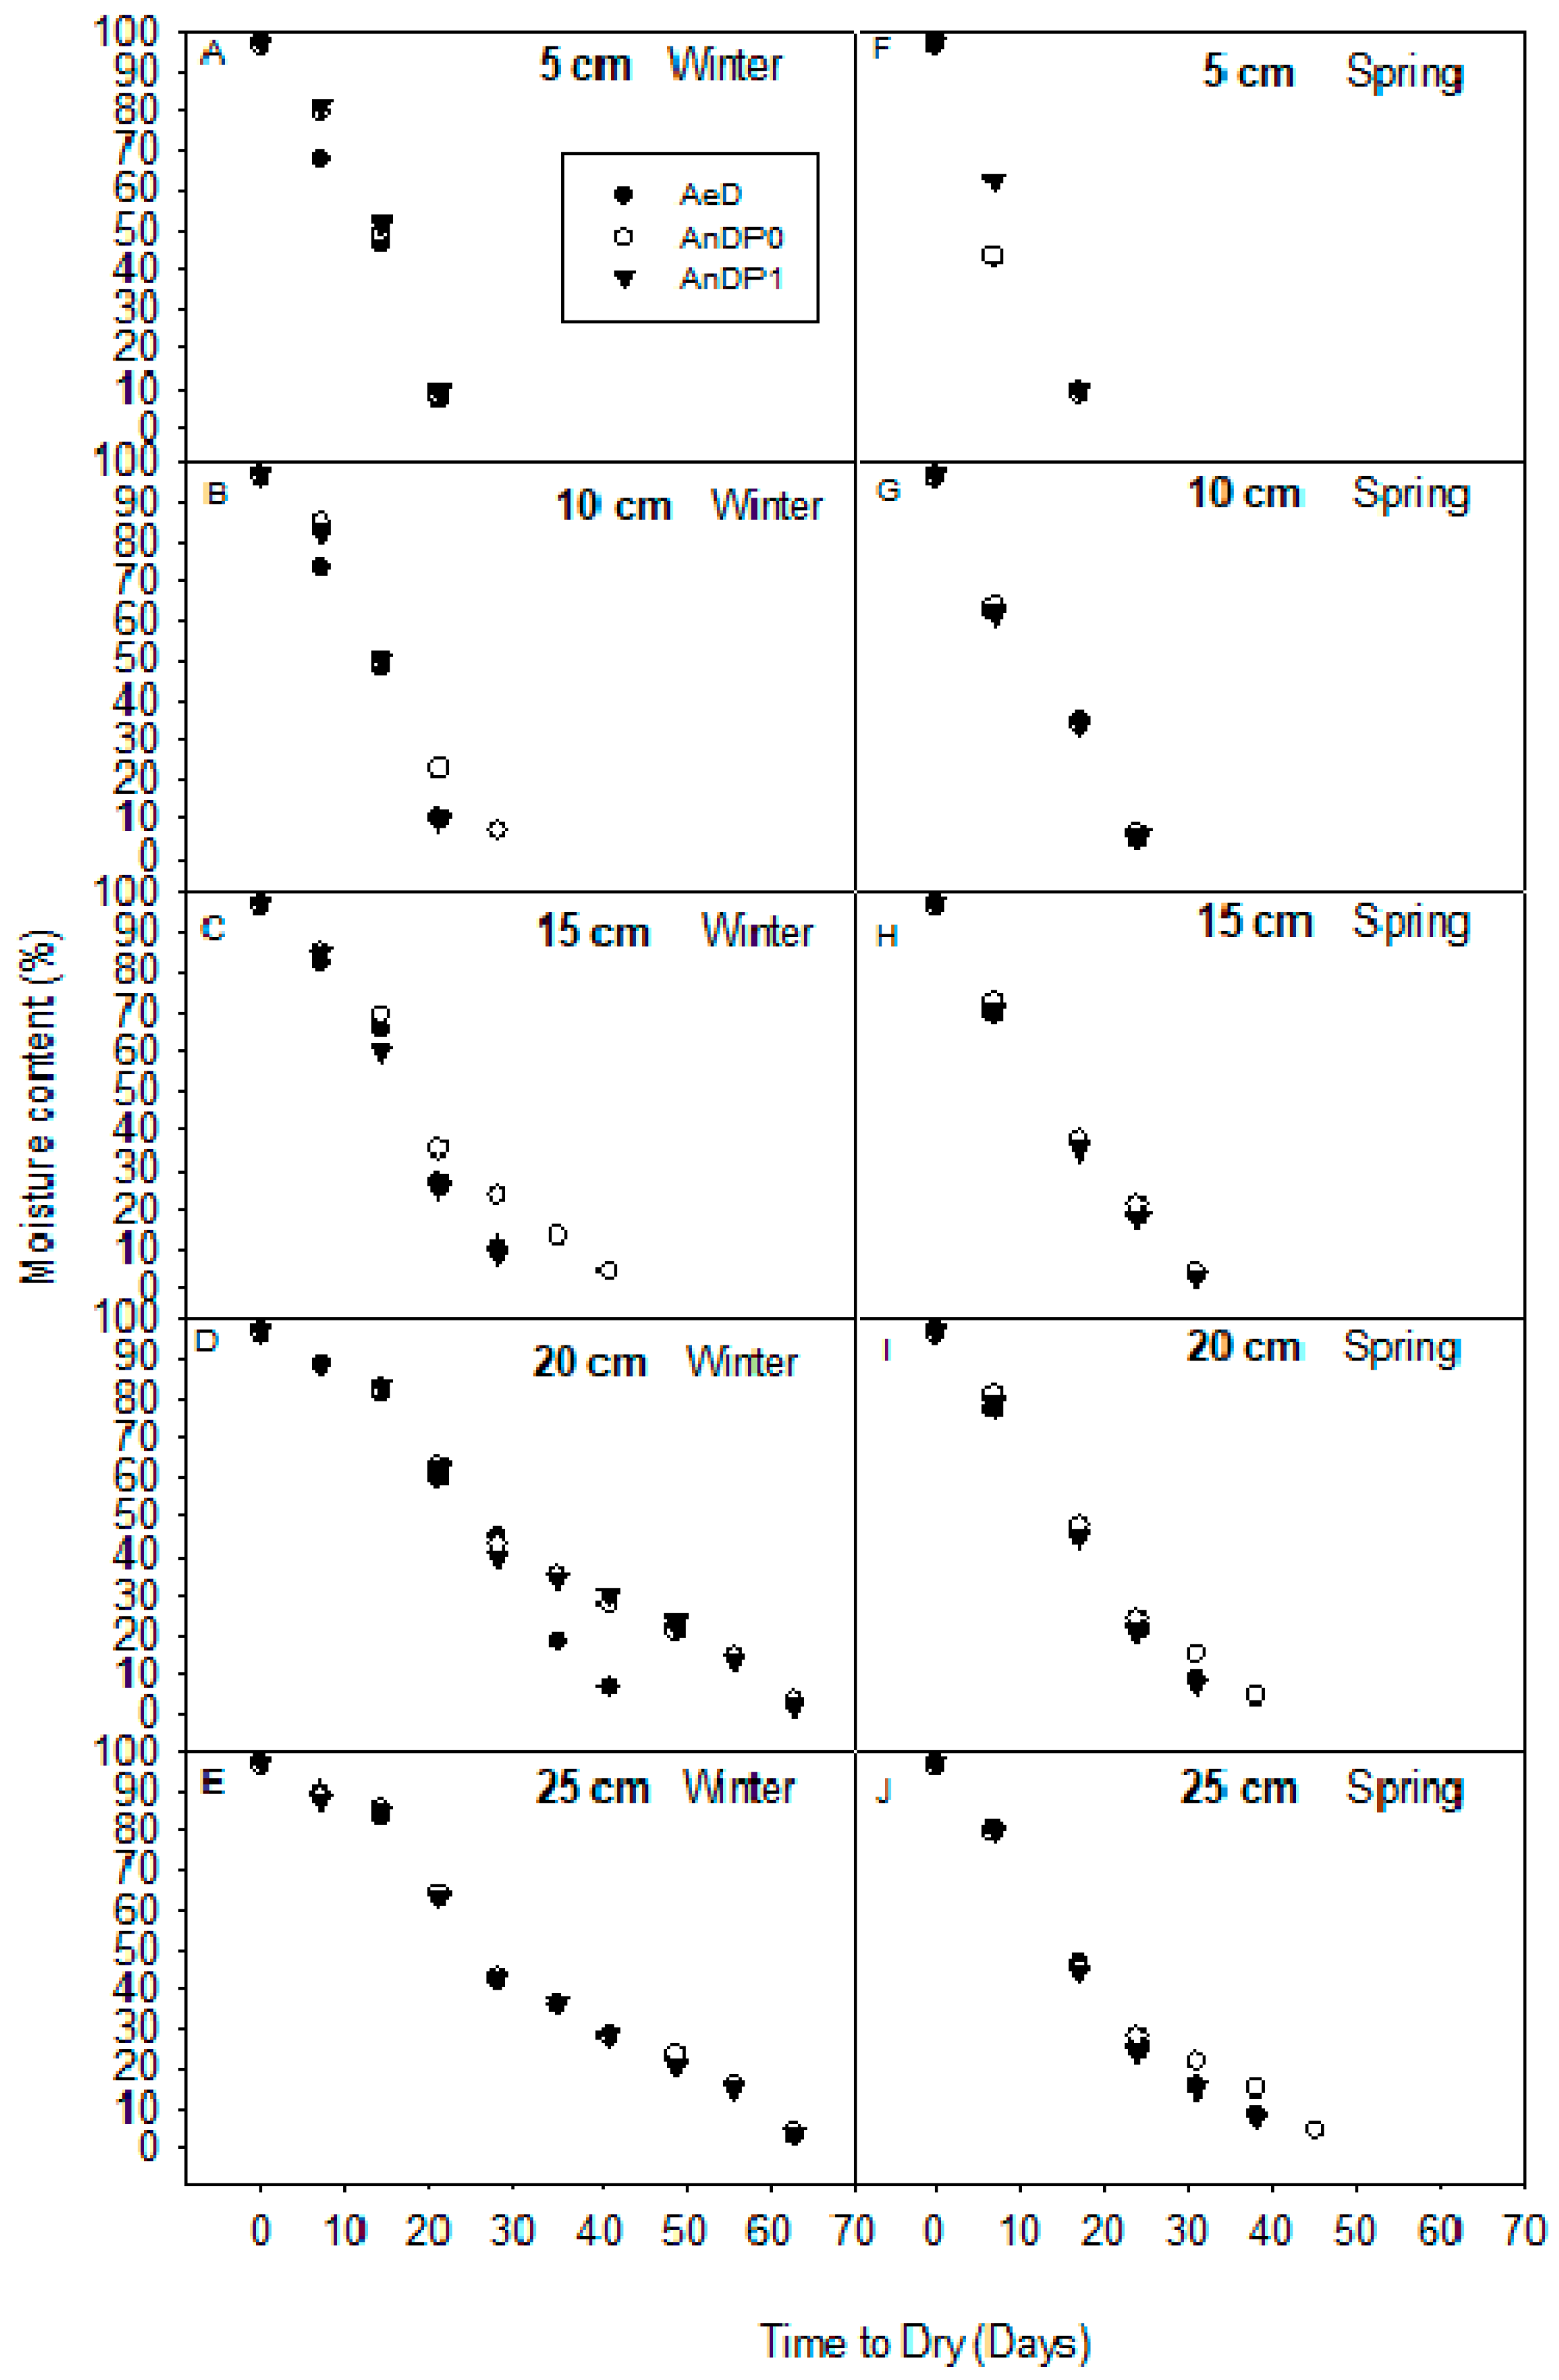
3.1. Drying and Weather Conditions

Weather conditions during the drying phases are summarized in Figure 1A,B and Figure 2A–J shows the dynamics of sludge moisture content over time during the drying period. The first drying phase was in winter and was conducted from May to July (Figure 1A). As expected, the temperatures were low in winter (ranging from 6.1 to 14.4 °C), however, this drying phase may have been extended due to the rainfall received during the first two weeks (Day 12–14) of the drying period. The spring drying phase did not receive any effective rainfall for the whole drying period. The shorter drying period experienced in the spring drying phase was attributed to the rising temperatures (11.2 to 24.5 °C) coupled with little rainfall during the drying period.
Sludge drying in winter took a longer period than in spring (Figure 2). For deeper depths, it took a maximum of 63 days to dry sludge to ≤10% moisture content level during winter. This was observed at 20 cm depth for AnD (Figure 2D) and for 25 cm on both AnD and AeD sludges (Figure 2E). Spring drying was carried out in August to September and took 45 days for the maximum depth/drying thickness of 25 cm to reach the target moisture content level, particularly for AnDP0. Anaerobically digested sludge without polymer often dried more slowly than anaerobic sludge with polymer, as observed at 10 and 15 cm (winter), and 20 and 25 cm drying depths in spring.

3.2. Changes in Sludge Total N and Inorganic N during Sludge Drying

3.2.1. Total N

A two-way ANOVA (Table 1) showed significant sludge type × drying depth interaction effects (p = 0.008 in winter) and (p = 0.042 in spring) on TN. Sludge type had the stronger degree of influence on TN compared to drying depth. Generally, AeD sludge had significantly higher TN than AnD sludges in both winter and spring (Table 2). Similar observations were previously reported by Černe, Palčić [27]. Neither drying process nor drying depth showed a significant influence on TN in the winter drying season (Table 2). Differences were observed in AeD sludge with 20 and 25 cm showing significantly lower TN than the other drying depths, and in AnP0 where 5 and 10 cm showed the lowest TN content, whereas no significant differences were observed across depths in AnDP1 sludge during winter drying. Spring drying had little effect on TN for AeD sludge. There was a slight increase in TN when drying the AnD sludges in spring, however, no significant effect of drying bed depth was observed. There was little difference observed between sludges with or without polymer.

3.2.2. Inorganic Nitrogen

Inorganic nitrogen dynamics during sludge drying were assessed and are presented in Table 2. The inorganic N fraction was dominated by NH4-N relative to NO3-N. This was expected because as sludges’ inorganic N is known to be characterized by high NH4-N concentration compared to other N fractions. A two-way ANOVA showed a strongly significant interaction effect (p < 0.001) of sludge type × drying depth (Table 1) on NH4-N during both winter and spring drying phases. Before drying, AeD sludge was lower in NH4-N compared to AnD sludges in the winter drying phase. The opposite was observed in the spring, which showed AeD sludge recording NH4-N of 7.7 g kg−1, which was significantly higher than the AnD sludges’ initial NH4-N concentrations.
During the two sludge drying phases, NH4-N was significantly lower in the dried AeD compared to the dried AnD sludges. This was observed at all depths in the two drying phases. Sludge type and the drying process itself had greater influence on NH4-N concentration than drying depth. This is evidenced mostly by the non-significant differences in NH4-N concentrations across drying depths within the three sludge types, particularly during spring (Table 2). During winter drying, there was a small but significant trend of NH4-N concentration increasing as depth increased from 5 to 25 cm, which was observed in each of the three sludge types. This may have been caused by slow drying and the subsequently longer drying time in winter (Figure 2), which allowed a longer time for mineralization, particularly for the greater depths. In addition, in a comparison of the shallower and deeper depths, it is likely that there was less ammonia volatilization at greater depths (less surface per volume), allowing them to accumulate higher NH4-N concentrations than at shallower depths.
During spring, drying increased NH4-N concentration for AnD sludges, however, there was no significant effect of drying depth or significant difference in NH4-N regardless of sludge being treated with or without polymeric material, with the exception of their initial samples (Table 2). The non-significant differences across drying depths could have been due to the faster sludge drying experienced during spring, hence reducing the difference in concentration between depths. The initial AeD sludge had higher NH4-N concentration than the dried AeD samples, and in comparison with the initial AnD sludges. The NH4-N was five times higher in the initial samples than the dried samples within the AeD sludge. However, for all other drying bed samples, AnD sludges remained significantly higher in NH4-N than the AeD sludge. Pu, Bell [28] previously also documented high NH4-N concentration in aerobic sludges relative to anaerobic sludges, and this was attributed to stabilization status of these sludge types. Although a similar trend of AnDP1 > AnDP0 > AeD in NH4-N observed in winter was also noted in spring drying, it is clear that in the spring phase, there was no ultimate increase in NH4-N concentration in relation to drying depth (Table 2).
The increase in NH4-N concentration with depth generally observed in winter drying reflects ammonification taking place during the drying period. Greater depths showed higher concentrations of NH4-N, implying more ammonification in these depths relative to shallower ones. Furthermore, the presence of higher NH4-N concentration implies that the longer the period taken to dry to the required moisture content in greater depths, the higher the exposure of the sludges to the drivers of ammonification, thus resulting in higher NH4-N concentration relative to that at shallower depths. Additionally, the longer drying time experienced in winter is likely to have influenced higher NH4-N losses through volatilization than during spring drying, which had shorter drying periods for similar sludge thicknesses.
NO3-N concentration was low relative to NH4-N across all sludge types and drying depths (Table 2). Significant sludge type × drying depth interaction effect (Table 1) on NO3-N in both winter (p < 0.001) and spring (p < 0.01) drying was observed. The concentration in winter was significantly lower in AeD compared to AnDP0 and AnDP1 sludges. Similar to the observation of NH4-N concentration, there was an increase in NO3-N with depth in winter. Generally, NO3-N concentration was positively correlated with drying depth and this was observed in winter in each of the three sludge types, and in spring for AeD and AnDP1 (Table 2). NO3-N increased to a higher concentration than initial levels during drying, however, the final levels remained low relative to the observations made for NH4-N and TN. This implies that at some point during drying, conditions were favorable for a small amount of biological nitrification to occur (presence of oxygen and adequate moisture). The observed increase in NO3-N indicates the occurrence of the nitrification process during drying, and nitrification was greater in winter, which clearly showed a higher magnitude of increase in concentration with depth compared to spring drying. In the spring drying phase, there was apparently less nitrification as evidenced by the low NO3-N concentrations. The observed difference in magnitude of NO3-N increase between winter and spring drying is attributed to quicker sludge drying in spring that could have reduced the window for biological conditions suitable for nitrification.

3.3. Electrical Conductivity Status during Sludge Drying

During both winter and spring drying phases, sludge type × drying depth showed a strongly significant interaction effect (p < 0.001) (Table 1) on EC. AeD recorded significantly lower EC after drying in both winter and spring relative to AnD sludges, despite having recorded similar initial EC values before drying (Table 2). There was a significant decrease in EC for AeD sludge between initial and dried sludges in both winter and spring drying (Table 2). Generally, there was a strongly positive influence of drying depth on EC for both AnD sludges in the winter and for AnDP1 in the spring drying phase. The observed opposite trends of EC response to drying depth, despite being drawn from a similar wastewater source (influent), indicate the impact of wastewater treatment technology on the physical and chemical characteristics of sludge in influencing its properties after the treatment and drying processes.
The rise in EC with drying depth for AnD may be caused by a larger portion of the soluble cations and anions that could have leached out of the sludge matrix during the first few days in the shallower depths compared to deeper depths. According to Sánchez-Monedero, Roig [29], EC can also be influenced by nutrient concentration. They reported a strong positive correlation between EC and NO3-N production. Because EC is influenced by dissolved salts (cations and anions), it is therefore possible that the observed increase in EC in the current study was due to the increased NH4-N and NO3-N concentrations, which were seen to increase with depth during drying, particularly in winter. However, AeD sludge had variable EC values that were inconsistent with drying depth, and this can be attributed to the decrease in NH4-N in this sludge type. The competing factors of mineralization and volatilization may also have affected the NH4-N and EC values for AeD.

3.4. pH Status during Sludge Drying

There was no significant interaction effect (p > 0.05) (Table 1) of sludge type × drying depth on pH in the two sludge drying phases. However, the main effects were strongly significant (p < 0.001) with sludge type showing a stronger influence on pH than drying depth. pH values among the three sludges were significantly different with AnDP0 recording the highest of 6.4, followed by 6.3 for AnDP1 and AeD sludge, with the lowest of 6 in winter drying. As was observed in winter, AeD pH was significantly lower than the AnD pH level in spring, however, during this drying phase, the two AnD sludges showed no significant differences in their pH (Table 3). In comparison with the initial sludge, pH decreased during drying in the two drying phases. During both drying phases, initial sludges had significantly higher pH levels relative to 5–25 cm depths. However, looking at 5–25 cm depths, a significant (p < 0.05) effect of drying depths on sludge pH was observed in winter. During winter drying, the pH level increased with depth although there was no statistical difference between 15–25 cm and 5–10 cm sludge pH levels. During spring drying, pH did not show significant (p > 0.05) differences among drying depths (Table 3).
Ammonia volatilization during drying in beds likely contributed to reduced sludge pH. However, this was likely to be more important in the shallower depths. It is also possible that lower pH levels with depth were caused by nitrifying bacteria through nitrification during drying. Nitrifying bacteria are reported to release hydrogen ions during nitrification [29] and this is likely to have occurred more at greater depths once aerobic conditions were created after water drainage. This corresponds well with the observed increase in NO3-N with depth. Ammonia volatilization would likely be the more important factor in the shallow drying beds, and nitrification in the deeper beds. pH is an important parameter in sludges due to its influence on the solubility of heavy metals and subsequently their uptake by plants. Mobility of heavy metals increases with low pH [8], as such, acidic sludges limit their application to agricultural lands. Generally, drying of sludge in this study did not significantly change the sludge pH to such critical levels that would enhance heavy metal mobility within the soil systems and uptake by plants.

3.5. Total C Content Dynamics during Sludge Drying

There was a significant (p < 0.001) sludge type × drying depth interaction (Table 1) effect on TC concentration in winter. However, in spring, there was no significant (p > 0.05) interaction effect observed. In both drying phases, sludge type influenced TC content more compared to drying depth (Table 3). AeD recorded higher TC than AnD sludges in both drying phases. The dominance in TC content observed in AeD over AnD sludge could be attributed to the general stability status of organic matter in these different sludge types. AeD tends to be characterized with high C content because, in most cases, it is not a well stabilized sludge material compared to AnD sludge. During winter, TC content was observed to follow the order of AeD > AnDP1 > AnDP0, whereas in spring drying, AnDP0 had a significantly higher TC than AnDP1 (Table 3). For drying depth effect, the only major difference was seen between initial sludge TC and dried sludges in the winter. The observed decrease in TC content reflects stabilization and mineralization processes that could have occurred as a result of OM decomposition during drying [8]. During spring, sludge dried quicker than in winter, which did not allow enough time for decomposition to happen; hence, little significant change was observed in this phase relative to winter. Therefore, sludge drying had no significant (p > 0.05) effect on TC changes in spring. In addition, drying bed depth (5–25 cm) had no significant effect on TC in either winter or spring (Table 3).

3.6. Dynamics of Total P during Sludge Drying

There was no significant (p > 0.05) sludge type × drying depth interaction effect on total P. There were, however, significant (p < 0.001) sludge type and drying depth main effects on TP (Table 1) both in winter and spring. Total P content varied significantly between the three sludge types in this study and followed the order of AeD > AnDP1 > AnDP0 in winter and AeD > AnDP0 > AnDP1 in spring drying (Table 3). Higher TP in aerobic over anaerobic sludge has also been reported in previous work [27]. AnD sludges underwent thermochemical treatment in anaerobic digesters, and TP in sludge was reported to be transformed into various forms during high temperature treatment [30], in which AeD was not exposed to such conditions during the treatment process. A strong significant effect of drying depth on TP was observed in winter compared to the spring drying. The 25 cm depth of winter dried sludge had the highest TP (22.8 g kg−1) relative to all other drying depths. During spring drying, the only difference was between the initial and dried sludges, with higher TP observed before drying. However, the reason for these variable effects of drying is not clear in this study.

3.7. Land Size Requirements Per Sludge Drying Depth While Retaining Favourable Sludge N Content

Sludge total N content did not change significantly with drying depth in the three sludge types. However, differences in total N concentrations were much greater among sludge types than among drying depths (Table 2). Therefore, in these land requirement computations for sludge drying beds, N content was not considered as a determining factor between depths for a specific sludge type. The focus was centered on the drying depth that would require minimum land for drying beds per drying cycle within a sludge type and drying season. It is evident that the land requirement was largely driven by drying thickness (drying depth) and drying season, which together were the factors that determined the observed drying cycles (Table 4). Considering that wastewater inflow and sludge production is uniform regardless of drying depth, sludge volume dried per unit area of land is observed to be higher with an increase in depth, resulting in smaller land area requirement per day for deeper depths than the shallower depths (Table 4). Therefore, on a daily basis computation, greater depths are the favorable options for sludge drying in beds, even though shallower drying thickness had quicker drying times relative to deeper depths (Figure 2).
Drying sludge at 5 and 10 cm depths took, on average, 21 days for sludge to reach the target moisture content, whereas 15 cm required a medium period, and drying at 20 and 25 cm took the maximum of 63 days in winter drying. Generally, it took fewer days to dry sludge of the same thickness in spring than in winter (Figure 2). During spring, the length of the drying period was reduced by 4, 3, 10, and 25 days for the 5, 15, 20, and 25 cm drying depths, respectively, compared to winter for AeD and AnDP1 sludges, and drying was 18 days quicker for spring at 25 cm depth for AnDP0 sludge (Table 4). For the 10 cm depth, there was an increase of 3 days in the drying length in spring above winter. This is unlikely and was not expected. However, it is likely that the required moisture target could have been achieved earlier than the 24 days recorded, however the collection of the samples for this 10 cm depth could have been delayed.
When considering only the drying time, drying at shallower depths is favorable compared to deeper depths because sludges dry significantly more quickly at the shallowest depth, with almost 75% and 50% fewer days in winter and spring drying seasons, respectively. However, cost reduction and land area requirement are the major issues of focus and should be the basis of decision-making regarding sludge drying depth, particularly under the assumption that sludge loading to drying beds is likely to be done on a daily basis. It was shown clearly that land required to dry sludge at shallower depths is larger than that for drying at deeper depths (Table 4), with 5 cm requiring the largest land size, and the smallest land size required when drying is undertaken at 15 to 25 cm depth range. During the winter drying season, it is apparent that drying sludge at 15 cm would be the best option across sludge types. At this drying depth, it would take an average of 28 days and 261.3 m2 land area for AeD and AnDP1 sludge, and 41 days and 382.7 m2 for AnDP0 sludge (Table 4). Drying sludge at 20 cm depth was found to be the most sustainable option in spring although it would require 4.2 m2 more land for AeD and AnDP1 sludges than drying them at 25 cm (Table 4). This is because of the shorter drying cycle, which was 7 days shorter at 20 cm relative to drying at 25 cm. This implies that sludge drying at 20 cm would relieve pressure on drying beds compared to 25 cm drying.
Polymer addition to sludge was found to have an impact on the length of the drying period required, as was observed in winter at 10 and 15 cm and in spring at 25 cm depths. Polymeric materials are commonly used by many WWTPs globally, particularly when initial sludge dewatering is performed using belt pressing rather than drying beds. This is an indication that the need for polymers outweighs its costs. For the WWTPs that rely on drying beds, the use of polymeric materials is not significant because it represents a non-crucial additional cost to incur. However, where land for drying beds is a challenge, the use of polymers is something WWTPs should consider. Drying sludge at shallower depths would result in quicker drying than deeper depths; however, it is evident that it is also more expensive considering the land size required to construct several drying beds. Furthermore, the costs for offloading sludge from drying beds are likely to be higher relative to greater depths because more frequent offloading is required for shallower depths.

4. Conclusions

Sludge type had greater influence on all measured parameters relative to drying depth. AeD was indicated to be a good organic material to use for soil amendment in agriculture, as revealed by its observed higher levels of TN and C compared to AnD sludges. Overall, the drying depth effect was small on measured parameters, however, it remains a factor to consider in winter drying. Drying depth was observed to positively influence N fractions during drying, which suggests that sludge drying should be undertaken in deeper depths when targeting higher nutrient concentration retention. Therefore, the hypothesis of N increasing with drying depth was accepted. Adding polymeric material to sludge proved to be favorable because it positively influenced N fractions and other nutrients during sludge drying. More importantly, it should be considered during winter or when drying sludge at deeper depths because it influences sludge drying time in beds by reducing the drying period. It also helps to reduce the land area required for sludge drying due to the reduced length of drying time (fewer days) compared to sludge without polymer. The costs of adding polymer need to be weighed against these benefits.
Drying sludge at shallower depths is expensive because it requires a larger land area for drying beds, and more frequent sludge loading and offloading from beds, relative to drying at deeper depths. Drying sludge at a 15 cm depth is a favorable option in winter and requires a smaller land size than other depths. However, in spring drying, a 20 cm drying depth is the best option because it requires fewer days and a smaller land size. The hypothesis stating that the land size requirement will be inversely proportional to drying depth was rejected. The findings imply that the stabilization process (sludge type) influences sludge drying behavior and length of drying time in drying beds. Due to the small effect of drying depth on measured sludge parameters, the results suggest that management of sludge drying depth in beds can be based on land area requirements with little concern for quality changes of biosolids.

Author Contributions

T.B.: Writing—Original draft, Methodology, Investigation, Formal analysis, Validation, Data curation. E.H.T.: Conceptualization, Resources, Writing—Review and Editing, Supervision, Validation, Project administration, Funding acquisition. C.C.: Writing—Review and Editing, Supervision, Validation. All authors have read and agreed to the published version of the manuscript.

Funding

The research was funded by Water Research Commission (WRC) of South Africa (Project title: Quantifying the fertilizer value of municipal sludges for agriculture. Grant number K5/2131/3). The authors would like also to sincerely acknowledge funding from EnviSafeBioC project-contract No PPI/APM/2018/1/00029/U/001; a project financed by the Polish National Agency for Academic Exchange.

Acknowledgments

The authors are grateful to WRC–South Africa for funding the project. Acknowledgements also go to ERWAT for supplying land, security and other facilities enabled the carrying out of the experiment.

Conflicts of Interest

The authors declare no conflict of interest.

References

  1. Hanjra, M.A.; Blackwell, J.; Carr, G.; Zhang, F.; Jackson, T.M. Wastewater irrigation and environmental health: Implications for water governance and public policy. Int. J. Hyg. Environ. Health 2012, 215, 255–269. [Google Scholar] [CrossRef] [PubMed]
  2. Wei, Y.; Liu, Y. Effects of sewage sludge compost application on crops and cropland in a 3-year field study. Chemosphere 2005, 59, 1257–1265. [Google Scholar] [CrossRef] [PubMed]
  3. Qadir, M.; Wichelns, D.; Raschid-Sally, L.; Mccornick, P.G.; Drechsel, P.; Bahri, A.; Minhas, P. The challenges of wastewater irrigation in developing countries. Agric. Water Manag. 2010, 97, 561–568. [Google Scholar] [CrossRef] [Green Version]
  4. Kurt, M.; Aksoy, A.; Sanin, F.D. Evaluation of solar sludge drying alternatives by costs and area requirements. Water Res. 2015, 82, 47–57. [Google Scholar] [CrossRef]
  5. Flaga, A. Sludge drying. In Proceedings of the Polish-Seminars 2005, Cracow, Poland, 16–18 March 2005. [Google Scholar]
  6. Mathioudakis, V.; Kapagiannidis, A.; Athanasoulia, E.; Paltzoglou, A.; Melidis, P.; Aivasidis, A. Sewage sludge solar drying: Experiences from the first pilot-scale application in Greece. Dry. Technol. 2013, 31, 519–526. [Google Scholar] [CrossRef]
  7. Yoshida, H.; Nielsen, M.P.; Scheutz, C.; Jensen, L.S.; Christensen, T.H.; Nielsen, S.; Bruun, S. Effects of sewage sludge stabilization on fertilizer value and greenhouse gas emissions after soil application. Acta Agric. Scand. Sect. B Soil Plant Sci. 2015, 65, 506–516. [Google Scholar] [CrossRef]
  8. Caicedo, P.; Rahman, K.; Kuschk, P.; Blumberg, M.; Paschke, A.; Janzen, W.; Schüürmann, G. Comparison of heavy metal content in two sludge drying reed beds of different age. Ecol. Eng. 2015, 74, 48–55. [Google Scholar] [CrossRef]
  9. Radaideh, J.A.; Ammary, B.Y.; Al-Zboon, K.K. Dewaterability of sludge digested in extended aeration plants using conventional sand drying beds. Afr. J. Biotechnol. 2010, 9, 4578–4583. [Google Scholar]
  10. Stefanakis, A.; Akratos, C.S.; Tsihrintzis, V.A. Vertical Flow Constructed Wetlands: Eco-Engineering Systems for Wastewater and Sludge Treatment; Newnes: Amsterdam, The Netherlands, 2014. [Google Scholar]
  11. Tchobanoglus, G.; Burton, F.; Stensel, H.D. Wastewater Engineering: Treatment and Reuse, 4th ed.; McGraw-Hill Co.: New York, NY, USA, 2003. [Google Scholar]
  12. Uggetti, E.; Llorens, E.; Pedescoll, A.; Ferrer, I.; Castellnou, R.; García, J. Sludge dewatering and stabilization in drying reed beds: Characterization of three full-scale systems in Catalonia, Spain. Bioresour. Technol. 2009, 100, 3882–3890. [Google Scholar] [CrossRef]
  13. Uggetti, E.; Ferrer, I.; Molist, J.; García, J. Technical, economic and environmental assessment of sludge treatment wetlands. Water Res. 2011, 45, 573–582. [Google Scholar] [CrossRef] [PubMed]
  14. Stefanakis, A.I.; Tsihrintzis, V.A. Effect of various design and operation parameters on performance of pilot-scale Sludge Drying Reed Beds. Ecol. Eng. 2012, 38, 65–78. [Google Scholar] [CrossRef]
  15. Peruzzi, E.; Macci, C.; Doni, S.; Masciandaro, G.; Peruzzi, P.; Aiello, M.; Ceccanti, B. Phragmites australis for sewage sludge stabilization. Desalination 2009, 246, 110–119. [Google Scholar] [CrossRef]
  16. Lee, C.S.; Robinson, J.; Chong, M.F. A review on application of flocculants in wastewater treatment. Process Saf. Environ. Prot. 2014, 92, 489–508. [Google Scholar] [CrossRef]
  17. Jiang, Z.; Zhu, J. Cationic polyacrylamide: Synthesis and application in sludge dewatering treatment: A review. Asian J. Chem. 2014, 26, 629–633. [Google Scholar] [CrossRef]
  18. Sharma, B.; Dhuldhoya, N.; Merchant, U. Flocculants—An ecofriendly approach. J. Polym. Environ. 2006, 14, 195–202. [Google Scholar] [CrossRef]
  19. Renault, F.; Sancey, B.; Charles, J.; Morin-Crini, N.; Badot, P.-M.; Winterton, P.; Crini, G. Chitosan flocculation of cardboard-mill secondary biological wastewater. Chem. Eng. J. 2009, 155, 775–783. [Google Scholar] [CrossRef]
  20. Suopajärvi, T.; Liimatainen, H.; Hormi, O.; Niinimäki, J. Coagulation–flocculation treatment of municipal wastewater based on anionized nanocelluloses. Chem. Eng. J. 2013, 231, 59–67. [Google Scholar] [CrossRef]
  21. Chong, M.F. Direct Flocculation Process for Wastewater Treatment, in Advances in Water Treatment and Pollution Prevention; Sharma, S.K., Sanghi, R., Eds.; Springer: Dordrecht, The Netherlands, 2012; pp. 201–230. [Google Scholar]
  22. Kopp, J.; Dichtl, N. Prediction of full-scale dewatering results by determining the water distribution of sewage sludges. Water Sci. Technol. 2000, 42, 141–149. [Google Scholar] [CrossRef]
  23. Yubo, C.; Tieheng, S.; Lihui, Z.; Jiang, T.; Zhang, L. Performance of wastewater sludge ecological stabilization. J. Environ. Sci. 2008, 20, 385–389. [Google Scholar]
  24. Al-Malack, M.H. Effect of Sludge Initial Depth on the Physical and Chemical Characteristics of Dried Municipal Sludge. Curr. Environ. Eng. 2014, 1, 30–44. [Google Scholar] [CrossRef]
  25. Badza, T.; Tesfamariam, E.H.; Cogger, C.G. Agricultural use suitability assessment and characterization of municipal liquid sludge: Based on South Africa survey. Sci. Total Environ. 2020, 721, 137658. [Google Scholar] [CrossRef] [PubMed]
  26. Andreoli, C.V.; Von Sperling, M.; Fernandes, F.; Ronteltap, M. Sludge Treatment and Disposal; IWA Publishing: London, UK, 2007. [Google Scholar]
  27. Černe, M.; Palčić, I.; Pasković, I.; Major, N.; Romić, M.; Filipović, V.; Igrc, M.D.; Perčin, A.; Ban, S.G.; Zorko, B. The effect of stabilization on the utilization of municipal sewage sludge as a soil amendment. Waste Manag. 2019, 94, 27–38. [Google Scholar] [CrossRef] [PubMed]
  28. Pu, G.; Bell, M.; Barry, G.; Want, P. Fate of applied biosolids nitrogen in a cut and remove forage system on an alluvial clay loam soil. Soil Res. 2008, 46, 703–709. [Google Scholar] [CrossRef]
  29. Sánchez-Monedero, M.A.; Roig, A.; Paredes, C.; Bernal, M.P. Nitrogen transformation during organic waste composting by the Rutgers system and its effects on pH, EC and maturity of the composting mixtures. Bioresour. Technol. 2001, 78, 301–308. [Google Scholar] [CrossRef]
  30. Li, R.; Yin, J.; Wang, W.; Li, Y.; Zhang, Z. Transformation of phosphorus during drying and roasting of sewage sludge. Waste Manag. 2014, 34, 1211–1216. [Google Scholar] [CrossRef] [PubMed]
Figure 1. Weather conditions in winter and spring during sludge drying.
Energies 13 06753 g001
Figure 2. Moisture content change over time during sludge drying at 5 to 25 cm drying depth in winter (AE) and spring (FJ).
Energies 13 06753 g002
Table 1. Analysis of variance for the measured parameters during the study in winter and spring drying phases as influenced by factors (sludge type and drying depth) and their interactions.
Winter
pHECTNNH4-NNO3-NTPTC
Sludge Type (ST)*********************
Drying Depth (DD)******ns************
ST × DDns**********ns***
Spring
Sludge Type*********************
Drying Depth*****************ns
ST × DDns*********nsns
*, ** and *** indicate significance at p < 0.05, p < 0.01 and p < 0.001 respectively. ns indicates no significant difference at p = 0.05.
Table 2. Changes in N and electrical conductivity (EC) as influenced by the interaction effects of sludge type and drying depth during sludge drying in winter and spring.
Sludge TypeDrying Depth (cm)WinterSpring
TN (%)NH4-N
(g kg−1)
NO3-N
(mg kg−1)
EC (mS m−1)TN (%)NH4-N
(g kg−1)
NO3-N
(mg kg−1)
EC (mS m−1)
AeDInitial 6.1(0.02) g2.9(0.04) bc8(2.99) ab671(20.8) efg6.7(0.05) ef7.67(0.7) cde4.18(0.11) abcd732(29.3) de
55.9(0.05) g0.93(0.07) a1.69(0.07) a220(15.3) ab6.9(0.00) ef2.27(0.03) a6.76(0.34) efg248(43.5) a
106(0.07) g0.79(0.1) a1.54(0.13) a155(72.7) ab7.1(0.04) f1.83(0.1) a5.76(0.09) def208(39.5) a
156.1(0.09) g0.91(0.16) a1.76(0.07) a110(48.8) a6.8(0.03) ef1.97(0.14) a8.57(1.28) gh250(22.9) a
205.8(0.24) fg1.37(0.53) a8.22(5.13) ab241(23.7) b6.7(0.08) e2.12(0.14) a7.23(0.38) fgh309(19.1) a
255.5(0.40) f2.19(0.51) b18.1(3.14) bc428(74.3) c6.9(0.17) ef2.33(0.16) a8.59(1.58) gh243(17.0) a
AnDP0Initial3.4(0.01) cd3.18(0.07) c1.44(0.17) a612(25.4) def3.7(0.05) a1.83(0.06) a4.21(0.31) abcd822(26.6) ef
52.5(0.09) a2.91(0.36) bc13.88(5.25) ab509(28.8) cd4.6(0.07) bcd7.06(0.06) c2.85(0.29) ab829(77.6) ef
102.8(0.07) ab3.51(0.23) cd36.66(5.79) d72913.2) fgh4.6(0.05) bcd7.72(0.19) cde2.76(0.06) ab885(39.6) efg
153.2(0.18) bc4.35(0.11) e25.88(4.62) cd719(103.3) fgh4.7(0.05) cd7.76(0.15) cde3.2(0.21) abc802(102.7) ef
203.4(0.15) c4.59(0.16) efg17.18(2.70) bc844(20) hij4.6(0.05) bcd7.46(0.18) cde5.74(0.88) def851116.7) efg
253.3(0.08) c4.63(0.14) efg34.96(8.44) d878(5) ij4.2(0.04) b7.16(0.18) cd4.66(0.10) bcde937(23.1) fg
AnDP1Initial3.8(0.03) e4.5(0.05) ef1.37(0.12) a830(11.8) hi3.9(0.01) a4.01(0.05) b2.33(0.24) a573(79.0) cd
53.8(0.06) de3.25(0.40) c2.4(0.54) a587(68.1) de4.7(0.23) cd7.04(0.26) c4.49(0.36) bcd507(22.2) bc
103.9(0.04) e4.06(0.02) de4.54(0.56) a748(32) gh4.7(0.19) cd8.16(0.42) e5.1(0.56) cde933(40.9) fg
153.9(0.1) e5.26(0.42) g16.62(2.94) bc838(22.5) hi4.8(0.17) d8.19(0.63) e4.86(0.08) bcde868(117.8) efg
204(0.01) e5.18(0.23) fg58.48(4.73) e915(28.6) ij4.6(0.24) bcd7.63(0.62) cde6.05(0.89) def792(42.5) ef
254(0.04) e5.32(0.15) g83.02(8.31) f968(10) j4.4(0.15) bc8.05(0.43) de9.19(1.75) h1031(1.7) g
Initial stands for the samples collected on the day of setting the experiment, never dried. Means followed by the same alphabet letter within each drying phase across sludge types and drying depth are not significantly different at p < 0.05. Numbers in parenthesis are standard error of means (SEM) at n = 3.
Table 3. Main effects of sludge type and drying depths pH, total P, and total C during sludge drying in winter and spring.
Main EffectsTreatmentsWinterSpring
pH (-)Total P
(g kg−1)
Total C (%)pH (-)Total P
(g kg−1)
Total C (%)
Sludge typeAeD6.0(0.15) a 19.9(1.04) c33.8(0.77) c5.9(0.12) a24.1(0.84) c38.2(0.30) c
AnDP06.4(0.13) c16.9(1.27) a22.9(1.28) a6.6(0.17) b20(0.91) b33.9(0.21) b
AnDP16.3(0.12) b18.1(0.81) b27.2(0.35) b6.6(0.09) b19.1(0.47) a32.3(0.24) a
Drying DepthInitial 6.9(0.07) d15.5(1.72) a30.5(2.16) b6.9(0.29) b24.7(2.13) b34.2(1.35) a
5 cm6(0.09) a16.7(1.11) b26.8(4.45) a6.5(0.29) a20.7(1.57) a35.2(1.36) b
10 cm6.1(0.12) ab18.6(0.79) c27.7(3.93) a6.3(0.21) a21.1(1.35) a35.4(1.73) b
15 cm6.2(0.17) bc18.4(0.58) c28(3.35) a6.3(0.32) a20.7(1.57) a34.6(2.03) ab
20 cm6.2(0.14) c18(0.59) bc28.3(2.10) a6.2(0.27) a19.8(1.58) a34.5(1.93) ab
25 cm6.3(0.13) c22.8(1.18) d27(1.77) a6.2(0.22) a20.5(1.56) a34.5(1.78) ab
Initial stands for the samples collected on the day of setting the experiment, never dried, and analyzed in their liquid state. Means followed by the same alphabet letter within sludge type or drying depth are not significantly different at p < 0.05. Numbers in parenthesis are standard error of means (SEM) at n = 3.
Table 4. Land size requirement and sludge drying duration for sludge drying per season based on sludge drying depth and sludge type.
Sludge TypeDrying Depth (m)
a
Sludge Volume (m3)
b
Sludge Drying Duration (days)
c
Land Required for Drying (m2 day−1)
d
Land Required for Drying (m2 drying cycle−1)
e
WinterSpringWinterSpring
AeD0.050.0125211728588476
0.10.025212414294336
0.150.037528319.3261289
0.20.0541317287217
0.250.062563385.6353213
AnDP00.050.0125211728588476
0.10.025282414392336
0.150.037541319.3383289
0.20.0563317441217
0.250.062563455.6353252
AnDP10.050.0125211728588476
0.10.025212414294336
0.150.037528319.3262289
0.20.0563317441217
0.250.062563385.6353213
a is Drying depth or drying thickness. b Sludge volume loaded into drying beds per drying depth during the experiment (a × 0.5 × 0.5 m). c is the maximum number of days to dry sludge per season and drying depth to target moisture content. d Sludge volume production per day (1.4 m3 day−1) divided by b (sludge volume loaded during experiment) multiplied by the land size per drying bed (0.25 m2). e = c × d. A small city of 100,000 individuals is the source of wastewater to the WWTP at 0.4 L per person per day. Solid content of 3.5% is assumed after digestion and thickening during treatment of wastewater. Sludge daily production (1.4 m3 day−1 of wet solid sludge) = ((0.4 L/day × 100,000 inhabitants)/1000 kg m−3) × 3.5/100. Sludge is loaded to drying beds on daily basis. Cycle = number of days required to dry sludge per given drying thickness (c) to the required moisture content.
Publisher’s Note: MDPI stays neutral with regard to jurisdictional claims in published maps and institutional affiliations.

