Article

Potential for Shock-Wave Generation at Diesel Engine Conditions and Its Influence on Spray Characteristics

1
Department of Energy and Environment, National Institute of Advanced Industrial Science and Technology (AIST), Tsukuba East, 1-2-1 Namiki, Tsukuba, Ibaraki 305-8564, Japan
2
Department of Mechanical Engineering, Inha University, 100 Inha-ro, Michuhol-gu, Incheon 22212, Korea
3
School of Engineering, Tokai University, 4-1-1 Kitakaname, Hiratsuka-shi, Kanagawa 259-1292, Japan
*
Author to whom correspondence should be addressed.
Energies 2020, 13(23), 6465; https://doi.org/10.3390/en13236465
Submission received: 17 November 2020 / Revised: 1 December 2020 / Accepted: 3 December 2020 / Published: 7 December 2020
(This article belongs to the Special Issue Internal Combustion Engine Performance)

Abstract

:
Increasing the fuel injection pressure is currently the most effective way to achieve a better fuel–air mixing quality in modern engines. Systems capable of delivering fuels at a pressure of over 250 MPa have been widely adopted in diesel engines. At such high injection pressures, the shock-wave generation during fuel injection has been noticed. Investigations can be found widely discussing on how the shock-wave generation during fuel injection would affect the spray dynamics. However, the argument remains whether the shock wave can occur at diesel engine conditions since the diesel engine is operated at very high ambient temperature and density. Even if it could occur, how significantly the spray-induced shock wave affects the spray characteristics is rarely known. To address these concerns, this study was proposed. First, experiments were conducted to obtain the detailed spray dynamics from the nozzle exit to spray downstream field by taking advantage of the X-ray phase-contrast imaging (XPCI) and schlieren imaging techniques. It is found that supersonic and subsonic ligaments coexist in one spray. Increasing the injection pressure or reducing the ambient density would extend the supersonic part in the spray. Multiple shock waves occur subsequently from the nozzle exit, where the spray has the highest local velocity. Shock-wave generation during fuel injection could enhance spray penetration, whereas this effect depends on the length of the supersonic part in the spray. Finally, a diagram was proposed to predict the potential for the shock-wave generation and discuss the possible effect on spray characteristics at diesel engine conditions.

1. Introduction

Fuel injection systems in modern engines have evolved towards higher injection pressures to achieve a better quality of mixture combustion. With the elevated fuel injection pressures, sprays possess a high level of turbulence, which can enhance the air entrainment and fuel breakup [1,2,3]. On the other hand, the higher injection pressure results in faster spray penetration that can improve air utilization and combustion speed [4]. Systems that are capable of delivering the fuel at an injection pressure of over 250 MPa have been widely adopted in diesel engines, while the ones in development are being tested to endure an injection pressure of 300 MPa or even higher [5,6,7].
The continuous increase in fuel injection pressure results in the generation of supersonic spray, which can induce the shock wave during fuel injection. Nakahira et al. [8] first noted the possible existence of the spray-generated shock waves in their experiment using an optical diesel engine. In the subsequent studies, the characteristics of the spray-generated shock waves have been examined in many aspects. By using the X-ray radiograph measuring technique, MacPhee et al. [9] found that there exists an average of a 15% variance in the gas density across the leading shock front. Afterward, a numerical model was proposed by Im et al. [10] to interpret the underlying mechanism reported by MacPhee et al. Based on an experiment under the schlieren imaging setup, Song et al. [11] reported that the spray-generated shock waves have a positive effect on the development of the spray tip penetration and mass of the entrained air. Huang et al. [12,13] submitted similar studies to Song et al.’s. Additionally, using the schlieren imaging setup, Li et al. [14] studied the effect of the reflected shock waves on spray characteristics and claimed that the reflected shock waves significantly suppress the development of the spray in the radial direction, while it barely affects the development of the spray tip penetration. Jia et al. [15,16] reported that there exists a gradually decreasing tendency in the peak velocity of the sequentially-generated shock waves, which is thought to be because of the weakened wave intensity caused by energy loss. Most recently, Salvador et al. [17] proposed a model to scale the spray tip penetration at supersonic conditions. It is noted that the studies aforementioned were mostly focusing on the characteristics of the leading shock wave and its effect on the spray. However, it is clearly observed in all the relevant investigations that multiple shock waves are generated sequentially during the fuel injection. Discussions are still missing at present to understand how the multiple shock waves are generated and how they affect the spray as a whole. This shortage is likely because detailed spray-dynamics measurements are still missing, which encountered a significant challenge, especially at the near-nozzle spray field, due to the incapability of the conventional measurement techniques.
Another important subject that deserves careful consideration is the potential for the shock-wave generation during fuel injection at diesel engine conditions. As it is well known, the ambient temperatures and pressures in the combustion chamber are critical. High ambient temperature increases the sound speed of ambient mixture, while high ambient density and pressure result in a fast spray deceleration. Both effects suppress the shock-wave generation during fuel injection. To the best of the authors’ knowledge, the most relevant investigation of this subject was reported by Kook et al. [18], which suggested that spray-generated shock waves may not be expected at injection timings typical of a diesel engine. However, their discussions did not take full account of the spray dynamics in the near-nozzle region due to a lack of experimental results, which is found to vary significantly from those in the downstream spray field [19,20].
Regarding the increasingly powerful fuel-injection systems in development, to predict the shock-wave generation at diesel engine conditions has become of great significance. Additionally, it deserves further classification as to how significantly the spray-induced shock wave can affect spray characteristics once it occurs. To address this purpose, first, experiments were conducted to obtain the detailed spray dynamics from the nozzle exit to spray downstream field by taking advantage of the X-ray phase-contrast imaging (XPCI) and schlieren imaging techniques. The XPCI is an incomparable technique that ensures a direct measurement of the near-nozzle spray dynamics. This method has been proved valid through many previous investigations [21,22,23,24], but for the first time, it was used to examine the spray dynamics in a supersonic-spray point of view. The shock-wave generation during fuel injection was observed using a schlieren imaging setup, which is most typically used to examine the shock-wave characteristics. Afterward, the results from the two separate experiments were linked to unveil the relationship between near-nozzle spray dynamics and multiple shock-wave generations. Then, discussions were extended to evaluate the potential for the shock-wave generation and the possible influence at diesel engine conditions.

2. Description of Experiments

2.1. Experimental Setup

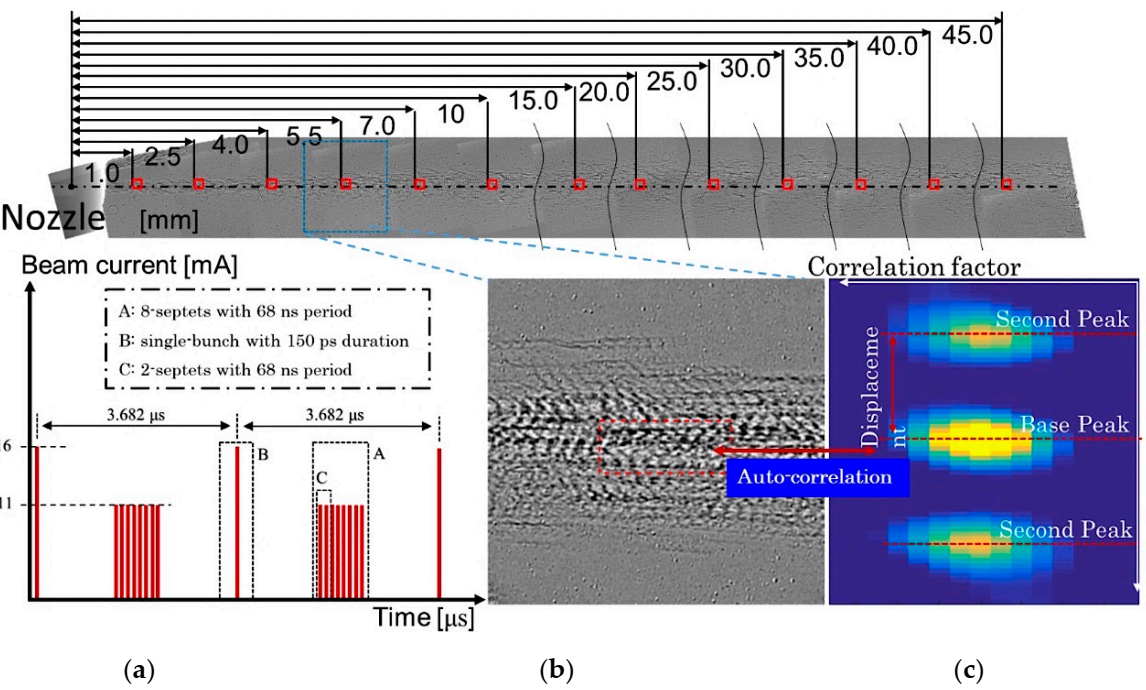
2.1.1. X-ray Phase-Contrast Imaging (XPCI) Technique

In this study, the spray velocities in the near-nozzle region were examined using the XPCI technique at the 7ID-B station at Advanced Photon Source (APS). First, a brief introduction to the mechanism of XPCI will be presented. In the X-ray regime, the refractive indices are lower than but very close to 1. This feature is critical in terms of the fuel spray imaging because it prevents the multiple scattering that happens using the conventional light sources. Owing to the nature of X-ray, X-ray imaging can observe directly the liquid-phase core veiled by the dense spray droplets cloud, especially in the near-nozzle region. When X-rays propagate through an object, the energy absorption and phase shift of X-rays occur. Regarding the soft-material object, like fuel spray, the X-ray phase-shift after propagating through the object is generally three orders of magnitude larger than its energy attenuation. In terms of this fact, the XPCI technique is particularly effective to image the primary spray breakup in the near-nozzle field with highly temporal resolution.
The XPCI experimental setup is illustrated in Figure 1. The storage ring is a circular tube where the electrons circle for hours whose speed is close to the speed of light. As the electrons travel around the ring, they pass through different types of magnets, and in the process, they produce X-rays. A mechanical shutter is settled in the beam path to ensure X-rays can enter the imaging system only at the imaging instant (8 ms opening duration). This is necessary to protect the imaging system from the heat-load of X-rays. The X-ray phase-shift cannot be imaged directly by conventional optical lenses. Instead, a scintillator crystal (LuAg:Ce) is used to convert the X-ray phase-shift into the intensity variations of visible light. The visible-light image is reflected by a 45° mirror and captured using a high-speed camera (Model SA-Z, Photron Limited., Tokyo, Japan). The imaging specifications were fixed at a frame rate of 67,889 Hz (one-fourth of synchrotron revolution frequency), an image resolution of 512 × 512, and a spatial resolution of 2.54 μm/pixel.
XPCI technique can extract the spray velocity in the near-nozzle field. The calculation method is described below. In the Hybrid-Singlet beam mode of APS, an irregular pulse pattern is generated with a periodicity of 3.682 μs. Figure 2a shows the details of this pulse pattern, which consists of a single-bunch with a 150 ps duration and a 16 mA current isolated from the remaining eight groups of seven consecutive bunches (eight septets) with 11 mA current per group and periodicity of 68 ns. By appropriately adjusting the timings of the camera shutter gate and the fuel injection relative to the X-ray signal, two septets of X-rays can be imaged in one single frame. In other words, an X-ray double-exposed image is obtained, as shown in Figure 2b. Then, the spray velocities are extracted from the images under an analysis resembling the particle imaging velocimetry (PIV). To be specific, the auto-correlation calculation is performed in the region of interest (ROI), which detects the displacement vector of the imaged features of spray during the 68 ns time interval, as shown in Figure 2c. Different from the PIV technique that uses the droplets as tracers, the XPCI uses the instability-wave features in the spray as tracers. Due to the line-of-sight nature of XPCI, all features of spray along the beam path are recorded in one frame. The velocity result obtained from XPCI is believed to present the velocity of the largest features in the beam path located in the local spray center. Detailed explanations can be found in our previous publication [21,22,23,24].

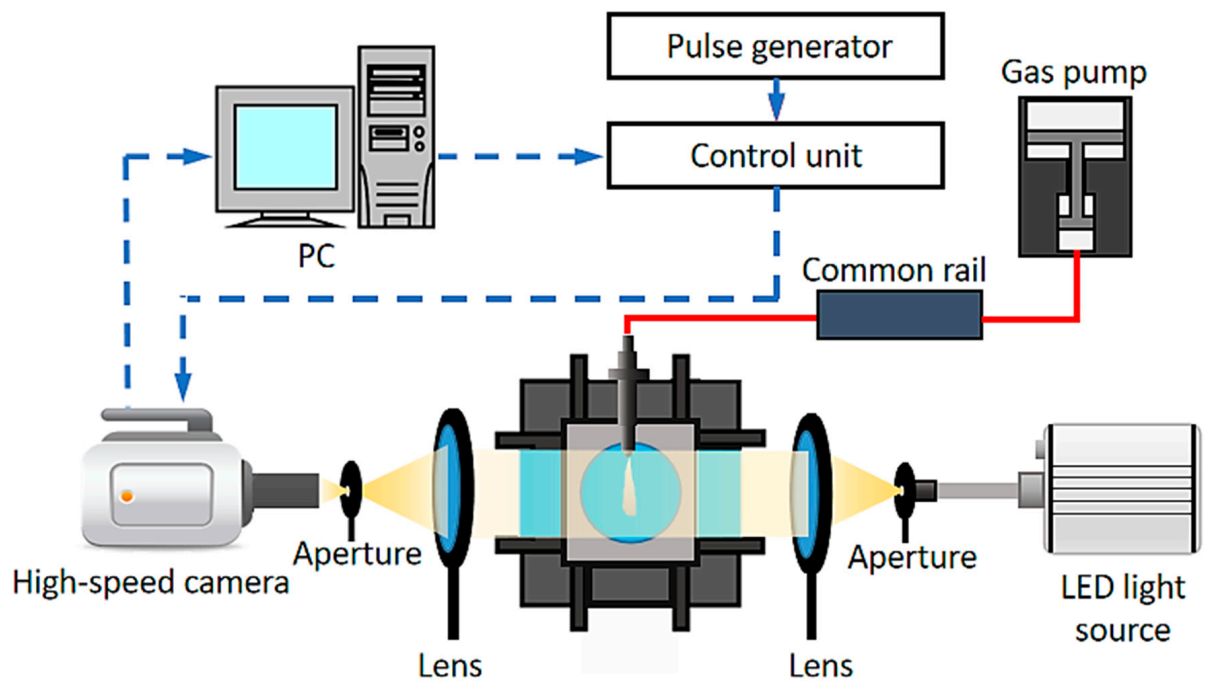
2.1.2. Schlieren Imaging Technique

Shock waves are a type of propagating disturbance that can be characterized by an abrupt, nearly discontinuous change in pressure, temperature, and density of the medium. According to its physical nature, shock waves are observed typically using a schlieren imaging setup, which appears like the interference patterns in images. Figure 3 shows schematically the schlieren imaging setup used in this study. The entire test rig consists of a common rail injection system, a control unit, a constant volume vessel, and a LED-based imaging system. The schlieren images of shock waves were captured using the same high-speed camera (Model SA-Z, Photron Limited, Tokyo, Japan) as that in the XPCI experiment, and the image specifications were decided as a frame rate of 200,000 Hz, an image resolution of 384 × 176 pixels, and a pixel size of 130 μm. To the best of the authors’ knowledge, these extremely high imaging specifications cannot be found in relevant investigations. By making good use of the high-performance of the high-speed camera, observing the detailed characteristics of the multiple shock waves during fuel injection was expected.
A set of MATLAB codes was created to enhance the contrast of the shock-wave images according to [18]. Figure 4 shows the sampling images before and after image processing with different post-processing methods. In method A, the spray image was divided by an image before the injection event, whereas in method B, the spray image was divided by the previous-frame image. It is considered that Method B works better to distinguish shock waves from the nonuniform background. This nonuniform background created by refractive-index gradients would become even more severe at the higher gas temperature and density conditions. To address this issue, method C is proposed that combines the post-processed images by methods A and B to illustrate the spray and shock waves both clearly. As a result, method B and method C were mainly used in this study to observe the shock-wave generation during fuel injection.
The spray tip penetration ( S ) was used to characterize the spray characteristics in the schlieren imaging experiments. A set of MATLAB codes shared from Engine Combustion Network (ECN) was employed for the parameter calculations. Detailed introductions to these codes can be found on its official website [25] and a previous publication [26]. In the calculation codes, the penetration is defined as the distance along the spray axis to a location where 1/2 of the pixels on an arc of θ /2 centered on the spray axis are dark. The spray angle, θ , is defined by the following relationship:
θ 2 = tan 1 A p ,   S / 2 S / 2 2
where A p ,   S / 2 is the projected spray area of the upstream half of the spray in an image. The definition of the spray parameters is shown schematically in Figure 5. It is found that using the current code can extract the spray boundary well and ensures to obtain the spray parameters in high accuracy.

2.2. Experimental Conditions

In previous investigations, single-hole nozzles are extensively used to investigate the spray-generated shock waves in favor of the simplified optical diagnostics. However, in practice, the single-hole nozzles are rarely adopted in engines because they are incapable of injecting the required fuel mass within a limited duration. To achieve consistency with the usage in engines, a commercial multiple-hole nozzle was used in this study, which was capped with a spray blocker. Using the spray blocker can assure only the targeting spray of interest passing through it and prevent the multiple spray plumes from obstructing the imaging. In the XPCI experiments, the ambient gas was fixed using N2. It is known that the spray dynamics are sensitive to the ambient gas density rather than the type of ambient gases, whereas N2 can provide a high-level phase contrast of X-ray due to its nature of a small-sized molecular. At every condition, the measurement was repeated 10 times and the averaged data were used for the analysis. In the schlieren imaging experiments, N2, CO2, and SF6 were used as the ambient gas to obtain three distinct sound-speed conditions. The sound speed in an ideal gas is attainable using the following relationship [18].
C = γ · R · T M
where R is the universal gas constant, and T is the temperature of the gas. The gas properties are described by γ the specific heat ratio, M the molecular mass. The sound speed of a mixture gas depends on chemical constituents and gas temperature. Then, Equation (2) will contain the sum of each gas constituent, γi, and Mi, and xi is the fraction of the i constituent [27].
γ = i N x i · γ i ,   M = i N x i · M i
It is noted that the spray-generated shock-wave has been rarely examined at high ambient-temperature and the mixture-gas conditions, in which engines work typically. To address this shortage, a high-temperature with the gas-mixture condition was included in this study. The experiment firstly used a premixed gas mixture to generate high temperature and pressure inside the spray chamber. The reactant constituents of the premixed gas mixture have 5.9% C2H4, 35.5% O2, and 58.6% CO2 in mole fractions, while the equilibrium combustion products consisted of 12% H2O, 18% O2, and 70% CO2 in mole fractions. The gas temperature (Tc) after a premixed burn was estimated based on a relationship proposed by Naber et al. [28], which involves the chamber wall temperature (Tw), and the mass averaged bulk temperature (Tb).
T c T b = 1 + a 1 T w T b + b T b T w 1
a = 0.108 ρ ρ r e f 0.295 ,   b = V c V
T b , n = P n P n 1 T b , n 1
where T w   was fixed at 378 K in the current experiment. The term a is an empirical parameter and was found to be dependent on density ( ρ ), varying with density to the 0.295 power ( ρ r e f = 20.4 kg/m3). The term b is a constant equal to the ratio of the chamber crevice volume ( V c ) to the total chamber volume ( V ). A value of b = 0.05 was used in the current experiment according to an estimation of the spray chamber. The chamber pressure, Pn, was monitored using a pressure sensor (Kistler 6125B) coupled with a Kistler model 5011B charge amplifier at a sampling rate (n) of 100 kHz. Before the formal experiment, several trying-out experiments were necessary to obtain the history of average chamber pressure. Then, chamber-pressure results (Pn) were imported to calculate the bulk temperature (Tb) and the gas temperature (Tc). Afterward, in the formal experiment, fuel was injected at a targeting ambient-gas condition, which was at 500 K and 6.3 kg/m3 in this study, and the results were used further for discussions. At every condition, the measurement was repeated five times and the averaged data were used for the analysis. Experimental conditions are summarized in Table 1.

3. Results and Discussion

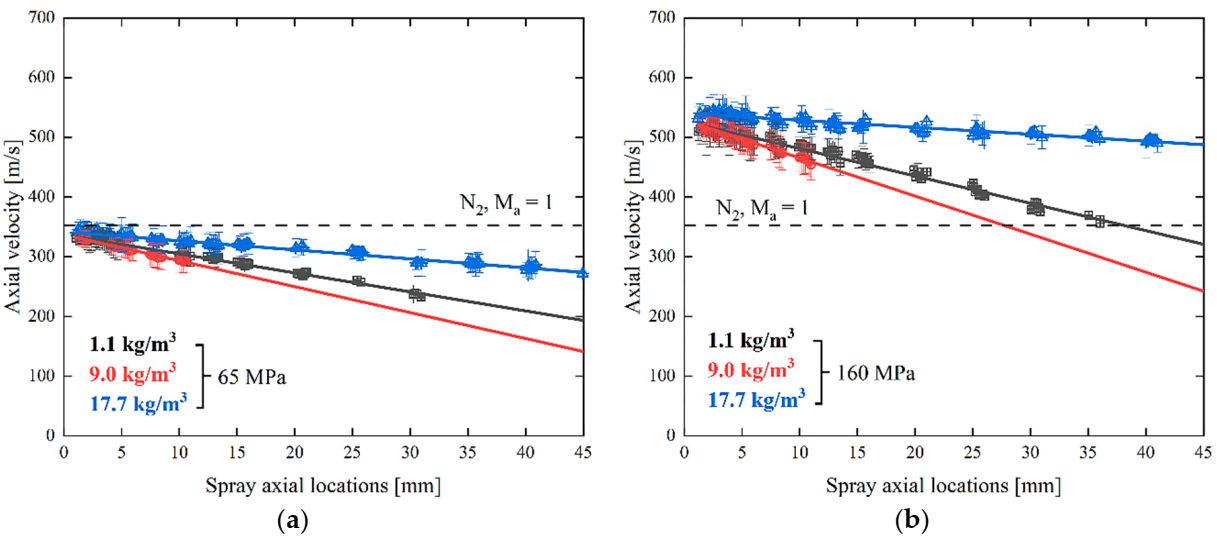
3.1. Spray Velocity Characteristics

Figure 6 shows the spray velocities at the nozzle exit. These results were measured in the XPCI experiments. Ma denotes the sound speed of N2, equaling to 352 m/s at the experimental conditions. It is found that the nozzle-exit spray velocities at the injection beginning are subsonic regardless of the injection pressure. Afterward, spray velocities rise quickly with time and become supersonic in case of the 135 and 160 MPa injection pressures. The injection pressure of 65 MPa seems to be a transition condition that turns the spray velocities from subsonic to supersonic.
Spray velocities at the nozzle exit remain constant when the ambient density increases from 1.1 to 17.7 kg/m3, as shown in Figure 6b. According to the Bernoulli principle [29], the spray velocity at the nozzle exit is proportional to the root of the pressure drop across the nozzle hole, i.e., the differential pressure between the sac and ambient gas. In the diesel-injection scenario, the ambient-gas pressure is a hundred times smaller compared to the sac pressure. Thus, although the ambient pressure was increased to obtain high ambient densities, the pressure drop across the nozzle hole was almost unchanged. As a result, the phenomenon that spray velocities at the nozzle exit are insensitive to the ambient density can be understood.
Figure 7 shows that the spray axial velocities in the center of spray. Results were derived from the XPCI experiments, and they were the time-averages within the steady-state (1.0–2.0 ms). It is found that spray velocities decrease gradually in the center of spray with distances. The higher ambient density causes a faster deceleration of spray velocities. When using an injection pressure of 65 MPa, spray velocities are subsonic except those in the near-nozzle region, whereas they are mostly supersonic at 160 MPa except in the downstream spray field. These results indicate that sprays can have a supersonic core at the high-injection pressure conditions regardless of the ambient density. Moreover, it is of particular interest that there is a state that supersonic and subsonic ligaments coexist in one spray. Increasing the injection pressure or reducing the ambient density would extend the supersonic part in the spray.
Next, the spray tip velocities derived from the schlieren imaging experiments are examined. The spray tip velocity is one essential parameter that has been extensively used to characterize the spray-generated shock waves. As shown in Figure 8, the maximum of the spray tip velocity is found to be within 100–250 m/s under the injection pressures ranging from 30 to 160 MPa. It is worth noting that the experiments using CO2 and SF6 have a lowered charging pressure of the spray chamber due to their larger molecular mass compared to N2. This was to keep identical ambient densities. However, no apparent difference in spray tip velocity is found among using various ambient gases, which indicates that the spray tip velocities are insensitive to the types of ambient gases and the charging pressures. Furthermore, it is noted that the spray tip velocities are subsonic except the ones in the SF6 experiments.

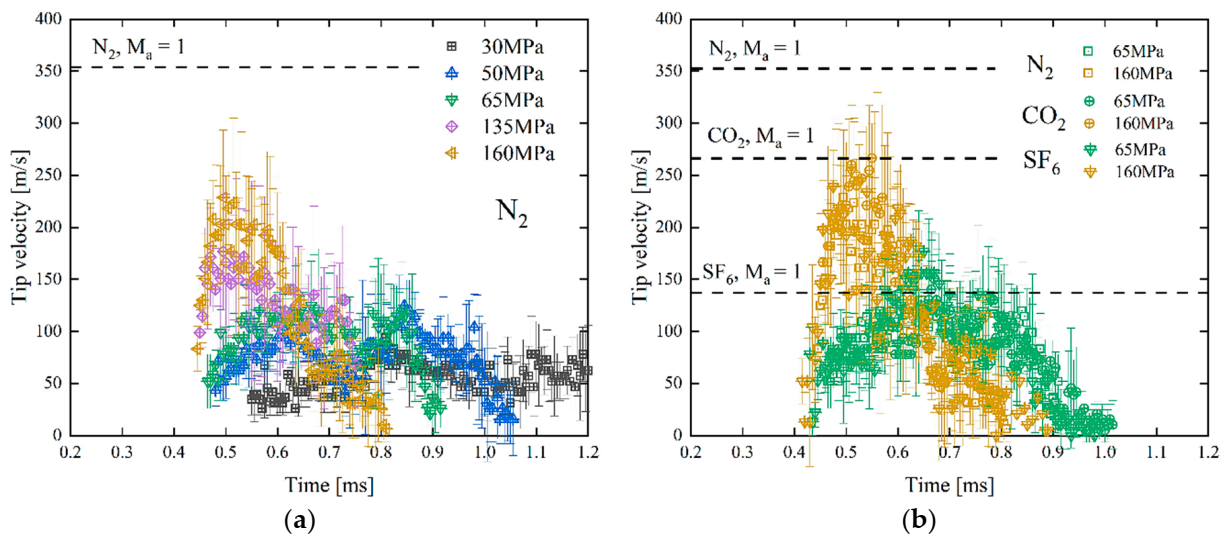
3.2. Shock-Wave Generation during Fuel Injection

The spray images from the experiments at an injection pressure of 65 MPa are selected to reveal the generation of spray-induced shock waves, as shown in Figure 9. Spray velocities at the nozzle exit (from the XPCI experiments) and spray tip (from the schlieren imaging experiments) are presented as well. In the experiment of SF6, the nozzle-exit spray velocity is supersonic at the injection beginning. Accordingly, the multiple-shock-wave generation appears. The spray tip velocity rises with time and becomes supersonic from timing 2 when the shock wave attaches to the spray frontier. At timing 3, the spray tip velocity drops to be subsonic again. Simultaneously, the shock wave is found to detach the spray frontier. Subsequent shock waves keep generating from the nozzle exit. The one that appears in a later timing seems to have a sharper angle. This can be explained by the fact that spray velocities at the nozzle exit are increasing from timing 1 to timing 4. Larger spray velocity results in a sharper shock-wave angle. The shock-wave angle is otherwise known as the Mach angle, which is proportional to the speed of a supersonic object [30].
In contrast to that of SF6, the spray tip velocities in the experiment of N2 and CO2 are subsonic during the entire injection, whereas the nozzle-exit spray velocities do not reach supersonic until timing 5 and timing 2, respectively. Interference patterns near the nozzle exit are observed on timing 5 and timing 2′s images, which represent the generation of shock waves. When comparing the spray characteristics at various ambient gases, it is noted that the spray in the experiment of SF6 has a faster spray penetration and narrower spray angle compared to those in N2 and CO2. However, this variance of spray characteristics seems not to appear until sprays have penetrated downstream, i.e., until timing 4. Apparent changes in spray characteristics are not observed before and after the shock-wave generation. More discussions on the shock-wave effect on spray characteristics are presented later.
It might be notable that some weak waveforms are appearing in the timing 2 and 3’s images of the N2 experiments. Those waveforms are acoustic pressure waves rather than shock waves. The reason lies in the fact that shock waves represent a sudden and violent change in stress, density, and temperature. Owing to its nature, shock waves are illustrated as bright interference patterns in schlieren images. However, the waveforms in timing 2 and 3 have a quite similar intensity with the image background. The difference can be easily distinguished in images. As a result, it is believed that those waveforms are acoustic pressure waves, which also occur even if the spray is subsonic. Similar discussions can be seen in [16].
It is worth noting that in the experiment of N2, shock waves appear so late that the spray tip penetration has exceeded 45 mm. Besides, shock waves in this condition are observed only in the near-nozzle region, and their intensity, i.e., the gray level in images, attenuates fast as it propagates along the spray axial direction. Figure 10 shows how the spray axial velocity and shock waves change in the center of spray. It is found that the shock-wave intensities increase slightly first from the nozzle exit and then sharply drop after certain distances from the nozzle exit. The locations where the strong shock waves disappear are close to the positions that spray velocities change from supersonic to subsonic. In other words, these results reveal that once shock wave detaches spray, its intensity reduces quickly.
Figure 11a shows the spray tip penetration and spray angle at various conditions. These results are the averaged results from five repetitions. It is noted that the spray tip penetration in SF6 (160 MPa) is approximately 23.5% higher than those in N2 near the observing limit (T2 = 0.65 ms). The spray characteristics in CO2 are between those in N2 and SF6. This resulting trend is consistent with previous reports [11,17], which have discussed that this behavior is related to the density gradient appearing across the shock-wave. However, it is worth noting that the previous reports mainly discussed the spray characteristics and its link with the spray-frontier shock wave. Owing to an extraordinary high frame rate applied in the current experiment (four times of that in [11] and five times of that in [17]), this study noted that the variance in spray characteristics further relates to the supersonic-part length in the spray. Evidence can be found in the images to support this argument. Figure 11b shows a sequence of spray images at 160 MPa. The spray penetrations of three ambient gases remain identical at T1 = 0.55 ms. T1 represents a time that the shock wave is detaching from the spray frontier in the N2 condition. Shortly after T1, the spray penetration in SF6 and CO2 exceeds that in N2. Then, at T2 = 0.60 ms, the shock wave is detaching from the spray frontier in the CO2 condition. Simultaneously, the spray penetration in SF6 starts to exceed that in the CO2 condition, and the variance keeps enlarging until T4 = 0.65 ms.
During the fuel injection process, fuel ligaments are injected sequentially from the nozzle, while the supersonic ones may induce shock waves. As the ligament velocities in the spray are low at the injection beginning, the first-appearing shock wave is emitted from the spray frontier shortly, as seen the ‘First s.w. (shock wave)’ indicated in the image. As the needle further opens, the injected ligaments have an increasingly higher velocity until reaching a steady state. These ligaments propagate downstream and substitute the frontal ligaments. Thus, the velocity of the spray frontier keeps increasing, and the supersonic-part length of ligaments in the spray extends. Once the ligaments at the spray frontier obtain a supersonic velocity, the shock wave remains attached to the spray frontier.
On the other hand, the shock wave is induced continuously from the nozzle exit, and these subsequent shock waves are observed to merge to the spray frontier, which is more evident by watching the animation of the spray images. It is worth noting that while there exists a shock wave remaining at the spray frontier, the spray has a sharp tip shape, which behaves like the ligaments at spray frontier are dragged forward by the attached shock wave. This is probably explainable in terms of the fact that there exists a low-density zone behind the shock wave. Multiple shock waves are generated during the fuel injection, whereas a similar process should repeat for every supersonic ligament. Thus, the longer the supersonic-part length, the further the ligaments have been boosted to penetrate. As a result, the fastest spray tip penetration was observed in SF6, where the entire spray is supersonic, and the supersonic-part length exceeds 45 mm.

3.3. Potential for Shock-Wave Generation at Diesel Engine Conditions

In this section, the potential for shock wave generation and its possible influence at diesel engine conditions are being considered. First of all, the results above indicate clearly that the multiple shock waves during fuel injection are induced from the nozzle exit. The spray velocities at the nozzle exit (Vexit) in various injection pressures are derived according to Bernoulli’s principle (Equation (7)).
V e x i t = C v × P i n P b ρ f
where Pin, Pb, and ρf are the injection pressure, ambient gas pressure, and fuel density, respectively. Cv is the velocity coefficient, which stands for the velocity decrease from the theoretical value due to the energy loss when the fuel is passing through the nozzle hole. Based on the experimental results, it is found that the nozzle used in this study has a Cv of 0.89 approximately. The effect of gas density has not been considered in this calculation because it barely affects the spray velocities at the nozzle exit. Finally, the predictions of the spray velocities at the nozzle exit can be obtained, as shown in Figure 12a. It is known that the supersonic sprays occur at the nozzle exit when the injection pressures approximately exceed 65, 40, and 10 MPa in the experiments of N2, CO2, and SF6, respectively.
Figure 12b shows the images showing the shock-wave generation in various injection pressures. It is found that shock waves appear in the experiments of N2 and CO2 from the injection pressures of 65 and 40 MPa, respectively. This result matches well with the predictions shown in Figure 12a. In the experiments of SF6, shock waves appear from an injection pressure of 30 MPa, which is the lowest injection pressure enabled by our fuel injection system. As predicted in Figure 12a, a 10 MPa injection pressure would be enough to induce the shock wave during fuel injection. Therefore, the shock-wave generation at 30 MPa of the SF6 experiments is reasonable.
Moreover, the shock-wave generation during fuel injection was examined in a high-temperature and gas-mixture condition. First, a premixture was burned to increase the ambient temperature inside the spray chamber. Then, fuel was injected into the after-combustion mixture at a targeting ambient temperature, which was 500 K in this study. The equilibrium combustion products consisted of 12% H2O, 18% O2, and 70% CO2 in mole fractions. The sound speed of the after-combustion mixture can be calculated using Equations (1)–(3). It equals to 371 m/s at the experimental condition. Meanwhile, the sound speed of the after-combustion mixture is also attainable according to the shock-wave propagating speed in the medium. As seen in Figure 13a, these two shock-wave velocity results are very close, which indicates excellent reliability of current validations.
On the other hand, it is predictable using Equation (7) that a minimum injection pressure of approximately 80 MPa is needed to generate shock waves at the current combustion condition. This prediction has been validated, the results of which are shown in Figure 13b. It is confirmed that shock waves can be observed using an injection pressure of 80 MPa. Thus, it is still feasible to predict the shock-wave generation during fuel injection by examining whether the spray velocities at the nozzle exit can reach supersonic. It might be of concern that at diesel engine conditions, the ambient temperatures of typical injection timings are higher than 500 K. However, the schlieren-image background is so much disturbed by the high-temperature gas that the shock waves can barely be distinguished. More discussions are presented in a later section based on an analytic calculation.
The possible supersonic-part length in the spray deserves careful consideration because it has been proposed that the longer the supersonic part in the spray, the larger the variance exists in spray characteristics. Based on the XPCI results, the spray-center velocity at different axial locations   V s can be estimated using Equation (8)
V s / V e x i t = k · S / d e q  
where d e q = d · ρ f / ρ a , and d is the nozzle hole diameter. ρ f and ρ a are fuel density and air density, respectively. This relationship originates from the gas jet theory, which has been modified to suit the scenario of the near-nozzle spray dynamics [31,32]. Equation (8) can be converted to an expression linking the local spray velocity ( V ) with the Bernoulli injection velocity ( V b ), i.e., the theoretical velocity under an injection pressure, by combining Equations (7) and (8).
V s / V b = C v · k · S / d e q  
Based on the results in Figure 6, it is known that the nozzle currently used has a Cv of 0.89 approximately. Then, the spray velocity in different axial locations can be replotted against d e q , as shown in Figure 14. It is clear that the spray velocity decelerates along the axis at an identical slope, k, regardless of the conditions. Moreover, V s / V b   at S = 15, 25, and 45 mm can be known in terms of various ambient densities, as shown in Figure 14b. The further the downstream location, and the higher the ambient density, the lower the local spray velocity exists.
Next, an operating scenario of a diesel engine is proposed that has the ambient conditions of 350 K, 1 bar, and 1.1 kg/m3 at the Bottom Dead Center (BDC), and a compression ratio of 16. Following an ideal gas and adiabatic compression assumption, it is easy to calculate the ambient conditions, i.e., T C A , P C A ,   ρ C A   (CA means the crank angle), in the compression stroke of this diesel engine. It is worth noting that the ambient temperature inside the engine chamber decides the sound speed of the mixture (according to Equations (2)–(4)), whereas the ambient density and pressure vary the spray propagation, i.e., the velocity of the entire spray (according to Equation (9)).
The critical injection pressure is proposed, which represents the minimum injection pressure to induce shock waves at a given condition. The critical injection pressure is attainable through an inverse calculation of the Bernoulli equation with the sound speed as input. Furthermore, the calculation can be extended to consider the supersonic-part length of the spray. Based on Equation (9), it is feasible to predict the local velocity within the spray against the injection pressure and the ambient density. In contrast, the injection pressure to reach supersonic spray at a given location is known by setting the sound speed as the local velocity at a specific location.
The calculation results are presented in Figure 15, and the result at 900 K is used for detailed explanations here, which represents a typical ambient temperature at the injection timing of diesel engines. First, regarding an injector having a theoretical injection velocity, an injection pressure of approximately 150 MPa is needed to generate shock waves during the fuel injection. The theoretical injection velocity can be otherwise known as that the injector has a Cv equaling to 1, whereas, typically, the Cv of diesel injectors is within 0.85–0.95. Cv gets higher as the injection pressure increases, or the nozzle has a high needle-lift and improved nozzle-geometry designs [33,34,35]. The lower Cv means the more energy lost during the fuel passing through the nozzle hole, which results in a lower injection velocity. In practice, engineers are devoted to increasing the nozzle Cv, which is beneficial to reduce the injection duration and pumping-energy loss while delivering the same amount of fuel. The shorter the injection duration, the faster the combustion occurs, which can improve the combustion quality and engine efficiency.
Regarding an injector with a Cv of 0.85, an injection pressure of approximately 210 MPa is required to induce shock waves during fuel injection (indicated as the top edge of the gray zone in Figure 15). Despite such high injection pressure needed for the shock-wave generation, it has been well established by major common rail suppliers that their products can provide an injection pressure up to 250 MPa [5,6,7]. Simultaneously, the powerful systems that can deliver fuels at even higher injection pressure than current products are still in development. As a result, it should not be surprising that the shock waves appear during fuel injection at diesel engine conditions. On the other hand, to obtain a supersonic-part length in the spray of S s u p e r s o n i c = 15, 30, and 45 mm, the injection pressure should exceed 313, 525, and 1040 MPa, respectively. Given the fact that these injection pressures are incredibly high, the shock wave would appear mainly in the near-nozzle region, and the supersonic part in the spray is short. Thus, it is not expected that the shock-wave existence could significantly affect the spray characteristics, regarding an injection timing that is close to the Top Dead Center (TDC) when the ambient temperature and ambient density are both high.
However, it is also worth noting that the sophisticated combustion modes in modern engines have been investigated for long to achieve a further improved combustion quality, for instance, HCCI (homogeneous charge compression ignition) or RCCI (reactivity controlled compression ignition). These combustion modes require advanced injection timings when the ambient temperatures and densities are relatively low, where shock waves could more easily appear during fuel injection. For instance, at an advanced injection condition that was −20° before the Top Dead Center (TDC) when the ambient conditions are 590 K and 4.1 kg/m3, to obtain a local supersonic velocity at S = 15, 30, and 45 mm, the critical injection pressure could be as low as 173, 224, and 302 MPa, respectively. In that scenario, the supersonic part in the spray would largely extend, and the shock-wave effect on the spray characteristics might be no longer ignorable.

4. Conclusions

In this study, the potential for the shock-wave generation, and the possible influence at diesel engine conditions was examined. First, by taking advantage of the X-ray phase-contrast imaging (XPCI), experiments were conducted to obtain the spray-velocity characteristics from the nozzle exit to spray downstream field. Then, the shock-wave generation during fuel injection was observed using the schlieren imaging technique. Based on the results from two separate experiments, discussions were presented to understand the characteristics of the multiple shock waves. Accordingly, a diagram was proposed to predict possible shock-wave generation at diesel engine conditions. The key findings of the current study are summarized below.
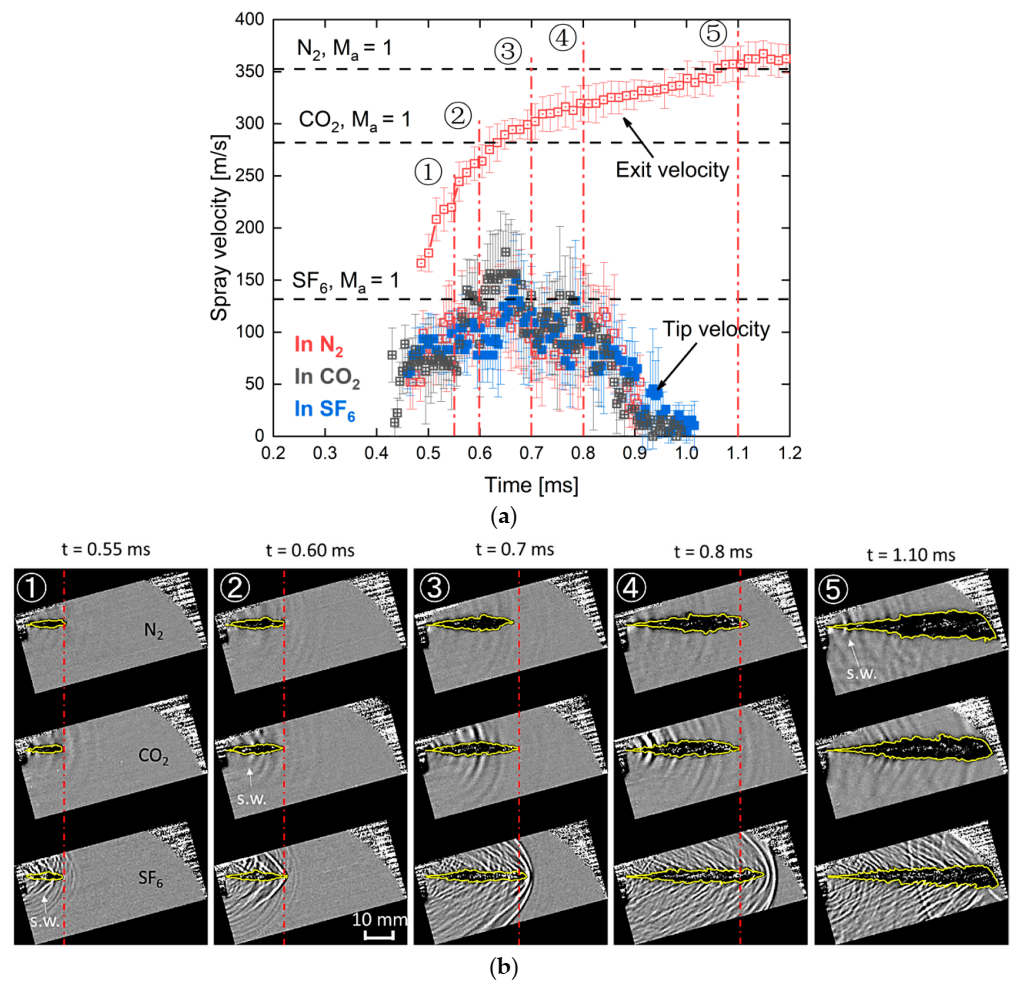
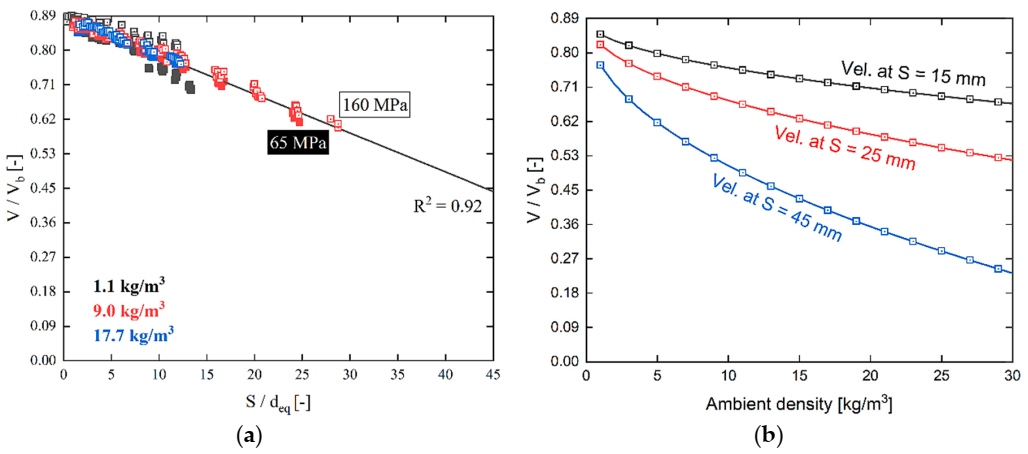
  • Spray velocity has the maximum value at the nozzle exit then decreases gradually with distances in the center of spray. Increasing the ambient density results in the faster deceleration of spray velocity, but it barely affects the spray velocity at the nozzle exit. This can be understood by the fact that the spray velocity at the nozzle exit mainly depends on the pressure drop across the nozzle hole, which is insensitive to the change in ambient pressures since they are relatively small compared to the fuel pressures inside the nozzle. It is much more difficult for the supersonic spray generation in spray frontier than that at the nozzle exit.
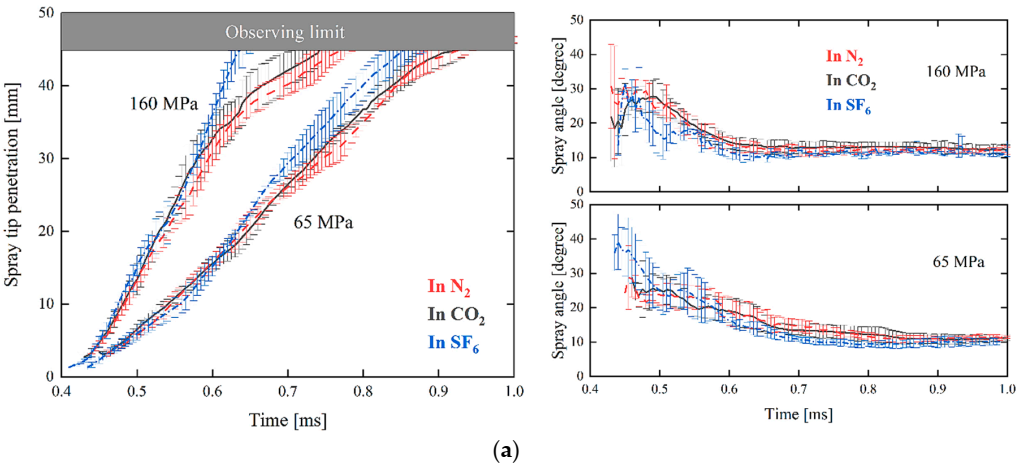
  • Supersonic and subsonic ligaments coexist in one spray. Increasing the injection pressure or reducing the ambient density would extend the supersonic part in the spray. Multiple shock waves are generated during the fuel injection, and they most likely occur from the nozzle exit where the spray has the highest local velocity. Shock-wave generation during fuel injection could increase the spray penetration and reduce the spray angle. This effect gets enhanced as there is a longer supersonic part in the spray.
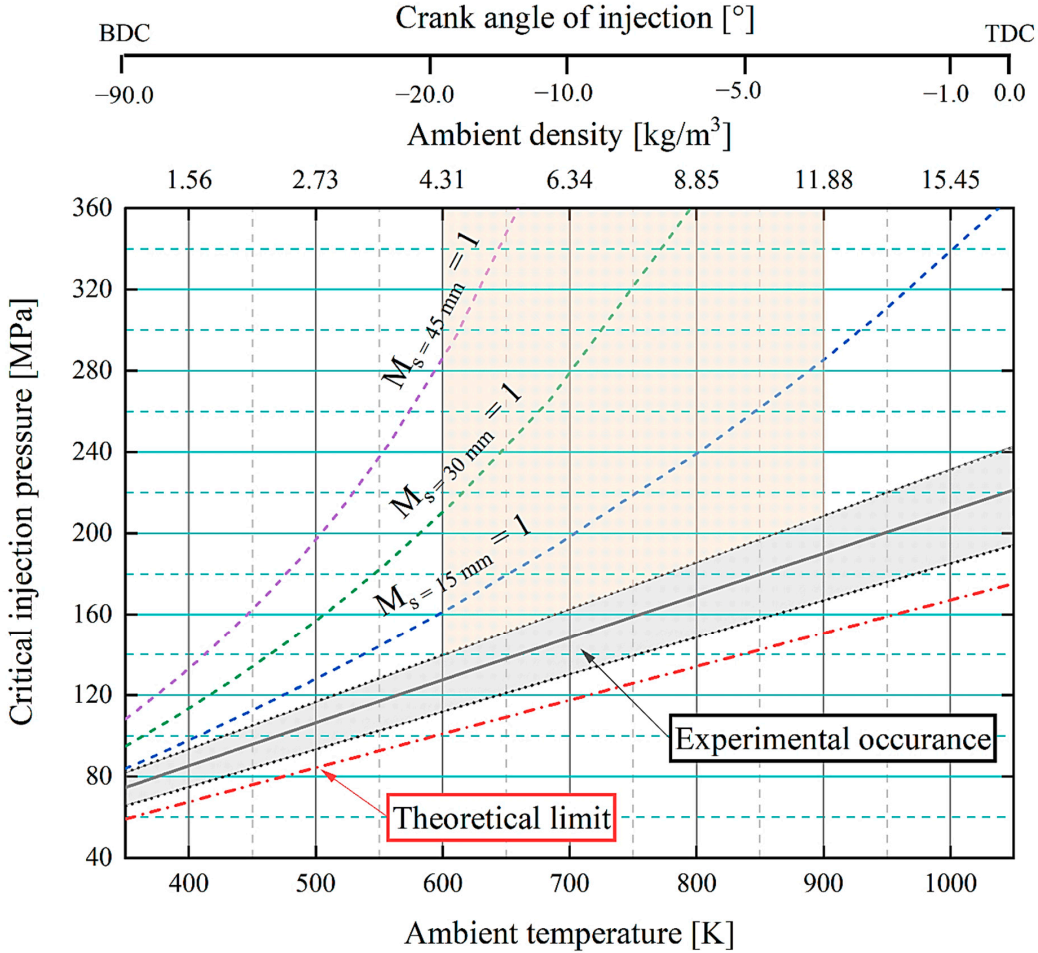
  • A diagram was proposed to predict possible shock-wave generation at diesel engine conditions. Based on that, it is noted that the shock wave can likely be induced during the fuel injection at diesel engine conditions. However, under a late injection timing, the supersonic part in the spray is short, and thus, significant changes in spray characteristics by the shock-wave generation is not expected. In contrast, the supersonic part in the spray extends largely under an advanced injection timing, when the shock-wave effect on the spray characteristics might be no longer ignorable.

Author Contributions

Conceptualization, W.H.; methodology, W.H.; validation, W.H. and H.G.; formal analysis, W.H.; investigation, W.H., H.G. and K.T.; data curation, W.H. and H.G.; writing—original draft preparation, W.H.; writing—review and editing, R.H.P., S.M. and Z.C. All authors have read and agreed to the published version of the manuscript.

Funding

This research received no external funding.

Acknowledgments

This work was supported by Isuzu Motors Ltd. and Isuzu Advanced Engineering Center 363 Ltd. We are grateful for the technical supports from Isuzu.

Conflicts of Interest

The authors declare no conflict of interest.

References

  1. Ghasemi, A.; Barron, R.M.; Balachandar, R. Spray-induced air motion in single and twin ultra-high injection diesel sprays. Fuel 2014. [Google Scholar] [CrossRef]
  2. Yang, J.; Rao, L.; Zhang, Y.; De Silva, C.; Kook, S. Flame image velocimetry analysis of reacting jet flow fields with a variation of injection pressure in a small-bore diesel engine. Int. J. Engine Res. 2020. [Google Scholar] [CrossRef]
  3. Fuyuto, T.; Taki, M. Noise-canceling spike between pilot and main-pressure-rise peaks of multiple-injection diesel combustion. Int. J. Engine Res. 2019, 20, 788–804. [Google Scholar] [CrossRef]
  4. Nishida, K.; Zhu, J.; Leng, X.; He, Z. Effects of micro-hole nozzle and ultra-high injection pressure on air entrainment, liquid penetration, flame lift-off and soot formation of diesel spray flame. Int. J. Engine Res. 2017. [Google Scholar] [CrossRef]
  5. DENSO Develops a New Diesel Common Rail System with the World’s Highest Injection Pressure|News|DENSO Global Website. Available online: https://www.denso.com/global/en/news/news-releases/2013/130626-01? (accessed on 8 June 2020).
  6. Xu, Q.; Xu, M.; Hung, D.; Wu, S.; Dong, X.; Ochiai, H.; Zhao, Z.; Wang, C.; Jin, K. Diesel Spray Characterization at Ultra-High Injection Pressure of DENSO 250 MPa Common Rail Fuel Injection System. SAE Tech. Pap. 2017. [Google Scholar] [CrossRef]
  7. Wang, L.; Lowrie, J.; Ngaile, G.; Fang, T. High injection pressure diesel sprays from a piezoelectric fuel injector. Appl. Therm. Eng. 2019, 152, 807–824. [Google Scholar] [CrossRef]
  8. Nakahira, T.; Komori, M.; Nishida, M.; Tsujimura, K. The shock wave generation around the diesel fuel spray with high pressure injection. SAE Tech. Pap. 1992, 101, 741–746. [Google Scholar]
  9. MacPhee, A.G.; Tate, M.W.; Powell, C.F.; Yue, Y.; Renzi, M.J.; Ercan, A.; Narayanan, S.; Fontes, E.; Walther, J.; Schaller, J.; et al. X-ray imaging of shock waves generated by high-pressure fuel sprays. Science 2002. [Google Scholar] [CrossRef] [Green Version]
  10. Im, K.S.; Cheong, S.K.; Liu, X.; Wang, J.; Lai, M.C.; Tate, M.W.; Ercan, A.; Renzi, M.J.; Schuette, D.R.; Gruner, S.M. Interaction between supersonic disintegrating liquid jets and their shock waves. Phys. Rev. Lett. 2009. [Google Scholar] [CrossRef] [Green Version]
  11. Song, E.; Li, Y.; Dong, Q.; Fan, L.; Yao, C.; Yang, L. Experimental research on the effect of shock wave on the evolution of high-pressure diesel spray. Exp. Therm. Fluid Sci. 2018, 93, 235–241. [Google Scholar] [CrossRef]
  12. Huang, W.; Wu, Z.; Gao, Y.; Li, Z.; Li, L. Shock wave generation and its influencing parameters based on diesel injector. Chin. Sci. Bull. 2014, 59, 3504–3510. [Google Scholar] [CrossRef]
  13. Huang, W.; Wu, Z.; Gao, Y.; Zhang, L. Effect of shock waves on the evolution of high-pressure fuel jets. Appl. Energy 2015, 159, 442–448. [Google Scholar] [CrossRef]
  14. Li, Y.; Dong, Q.; Wang, X.; Song, E.; Fan, L.; Yao, C. Experimental research on the effect of reflected shock waves on the evolution of a high-pressure diesel spray. Exp. Therm. Fluid Sci. 2019, 103, 329–336. [Google Scholar] [CrossRef]
  15. Jia, T.M.; Li, G.X.; Yu, Y.S.; Xu, Y.J. Propagation characteristics of induced shock waves generated by diesel spray under ultra-high injection pressure. Fuel 2016, 180, 521–528. [Google Scholar] [CrossRef]
  16. Jia, T.M.; Yu, Y.S.; Li, G.X. Experimental investigation of effects of super high injection pressure on diesel spray and induced shock waves characteristics. Exp. Therm. Fluid Sci. 2017, 85, 399–408. [Google Scholar] [CrossRef]
  17. Salvador, F.J.; De la Morena, J.; Taghavifar, H.; Nemati, A. Scaling spray penetration at supersonic conditions through shockwave analysis. Fuel 2020, 260, 116308. [Google Scholar] [CrossRef]
  18. Kook, S.; Pickett, L.M. Effect of ambient temperature and density on shock wave generation in a diesel engine. At. Sprays 2010, 20, 163–175. [Google Scholar] [CrossRef]
  19. Ghiji, M.; Goldsworthy, L.; Brandner, P.A.; Garaniya, V.; Hield, P. Numerical and experimental investigation of early stage diesel sprays. Fuel 2016, 175, 274–286. [Google Scholar] [CrossRef]
  20. Moon, S.; Zhang, X.; Gao, J.; Fezzaa, K.; Durfresne, E.; Wang, J.; Xie, X.; Wang, F.; Lai, M.-C. Morphological Exploration of Emerging Jet Flows From Multi-Hole Diesel Injectors At Different Needle Lifts. At. Sprays 2015, 25, 375–396. [Google Scholar] [CrossRef]
  21. Huang, W.; Moon, S.; Ohsawa, K. Near-nozzle dynamics of diesel spray under varied needle lifts and its prediction using analytical model. Fuel 2016, 180, 292–300. [Google Scholar] [CrossRef] [Green Version]
  22. Huang, W.; Moon, S.; Gao, Y.; Li, Z.; Wang, J. Eccentric needle motion effect on near-nozzle dynamics of diesel spray. Fuel 2017, 206, 409–419. [Google Scholar] [CrossRef]
  23. Huang, W.; Moon, S.; Gao, Y.; Wang, J.; Ozawa, D.; Matsumoto, A. Hole number effect on spray dynamics of multi-hole diesel nozzles: An observation from three- to nine-hole nozzles. Exp. Therm. Fluid Sci. 2019, 102, 387–396. [Google Scholar] [CrossRef]
  24. Huang, W.; Moon, S.; Wang, J.; Murayama, K.; Arima, T.; Sasaki, Y.; Arioka, A. Nozzle tip wetting in gasoline direct injection injector and its link with nozzle internal flow. Int. J. Engine Res. 2019, 146808741986977. [Google Scholar] [CrossRef]
  25. Engine Combustion Network|Download Code. Available online: https://ecn.sandia.gov/download-code/ (accessed on 2 July 2020).
  26. Naber, J.D.; Siebers, D.L. Effects of gas density and vaporization on penetration and dispersion of diesel sprays. SAE Tech. Pap. 1996. [Google Scholar] [CrossRef] [Green Version]
  27. Suchenek, M.; Borowski, T. Measuring Sound Speed in Gas Mixtures Using a Photoacoustic Generator. Int. J. Thermophys. 2018. [Google Scholar] [CrossRef] [Green Version]
  28. Naber, J.D.; Siebers, D.L.; Caton, J.A.; Westbrook, C.K.; Di Julio, S.S. Natural gas autoignition under diesel conditions: Experiments and chemical kinetic modeling. SAE Tech. Pap. 1994. [Google Scholar] [CrossRef]
  29. Nurick, W.H. Orifice cavitation and its effect on spray mixing. J. Fluids Eng. Trans. ASME 1976. [Google Scholar] [CrossRef]
  30. Jia, T.M.; Li, G.X.; Yu, Y.S.; Xu, Y.J. Effects of ultra-high injection pressure on penetration characteristics of diesel spray and a two-mode leading edge shock wave. Exp. Therm. Fluid Sci. 2016, 79, 126–133. [Google Scholar] [CrossRef]
  31. Moon, S. Novel insights into the dynamic structure of biodiesel and conventional fuel sprays from high-pressure diesel injectors. Energy 2016, 115, 615–625. [Google Scholar] [CrossRef]
  32. Abani, N.; Reitz, R.D. Unsteady turbulent round jets and vortex motion. Phys. Fluids 2007, 19. [Google Scholar] [CrossRef]
  33. Payri, R.; García, J.M.; Salvador, F.J.; Gimeno, J. Using spray momentum flux measurements to understand the influence of diesel nozzle geometry on spray characteristics. Fuel 2005, 84, 551–561. [Google Scholar] [CrossRef]
  34. Desantes, J.M.; Payri, R.; Salvador, F.J.; Gil, A. Development and validation of a theoretical model for diesel spray penetration. Fuel 2006, 85, 910–917. [Google Scholar] [CrossRef]
  35. Salvador, F.J.; Gimeno, J.; Pastor, J.M.; Martí-Aldaraví, P. Effect of turbulence model and inlet boundary condition on the diesel spray behavior simulated by an eulerian spray atomization (ESA) model. Int. J. Multiph. Flow 2014. [Google Scholar] [CrossRef]
Figure 1. Experimental setup for the X-ray phase-contrast imaging.
Energies 13 06465 g001
Figure 2. Spray velocity calculation based on a double-exposed image of X-ray imaging. (a) X-ray bunch mode; (b) double-exposed image (c) auto-correlation calculation to derive spray velocity.
Energies 13 06465 g002
Figure 3. The schlieren imaging test rig.
Energies 13 06465 g003
Figure 4. Images processing method. From the left, the raw spray images of Im(0), Im(i), and Im(i + 1), the intermediate-processing images, and the processed image are shown. The raw images were obtained under an ambient-gas temperature of 500 K and a density of 6.3 kg/m3.
Energies 13 06465 g004
Figure 5. Definition of spray tip penetration (S) and spray angle ( θ ): (a) Raw image of spray; (b) definition of spray tip penetration and spray angle.
Energies 13 06465 g005
Figure 6. Spray velocities at 2 mm from the nozzle exit. (a) Injection pressure effect; (b) ambient density effect. Ma denotes the sound speed of gas. (Ambient gas condition: N2 and 297 K; Local sound speed: 354 m/s).
Energies 13 06465 g006
Figure 7. Spray axial velocities under various ambient densities. (a): 65 MPa; (b): 160 MPa. (Ambient gas condition: N2 and 297 K; Local sound speed: 352 m/s).
Energies 13 06465 g007
Figure 8. Spray tip velocities under different injection pressures: (a) spray tip velocities at various injection pressures; (b) spray tip velocities against various ambient gases. (Ambient gas condition: 297 K and 9.0 kg/m3; Local sound speed: 352 m/s at N2; 267 m/s at CO2; 135 m/s at SF6).
Energies 13 06465 g008
Figure 9. Spray velocity (a) and the shock-wave generation vs. time (b); ambient gas conditions: 297 K and 9.0 kg/m3; injection pressure: 65 MPa. ‘s.w.’ stands for the shock wave. The red dash-dot line represents the spray leading edge of CO2.
Energies 13 06465 g009
Figure 10. Spray velocity in axial axis (a); the shock-wave generation at steady state (b) and images timings from top to bottom: 1.100, 1.125, 1.150 ms; ambient gas conditions: 297 K and 9.0 kg/m3; injection pressure: 65 MPa.
Energies 13 06465 g010
Figure 11. Shock wave generation effect on the spray penetration and spray angle (a), and a sequence of spray images at 160 MPa (b). Ambient gas conditions: 297 K and 9.0 kg/m3. The red dash-dot line represents the spray leading edge of CO2.
Energies 13 06465 g011aEnergies 13 06465 g011b
Figure 12. Spray velocity at the nozzle exit (predictions) and the maximum of spray tip velocity (experiments) in various injection pressures (a); shock-wave generation vs. injection pressure; ambient gas condition: 297 K and 9.0 kg/m3 (b).
Energies 13 06465 g012
Figure 13. Shockwave generation in the high ambient temperature condition (a); ambient gas condition: mixture (12% H2O; 18% O2; 70% CO2), 500 K and 6.3 kg/m3 (b).
Energies 13 06465 g013
Figure 14. Spray velocity in different axial locations: (a) spray velocity vs. axial location; (b) spray velocity vs. ambient density.
Energies 13 06465 g014
Figure 15. Critical injection pressure to induce a shock wave in a diesel engine. Ambient gas condition: mixture (21% O2; 79% N2); engine conditions in reference: 350 K BDC temperature, 16 compression ratio, and 1061 K TDC temperature. M s = 15   m m means the Mach number at S = 15 mm.
Energies 13 06465 g015
Table 1. Experimental conditions.
Injector Specifications
TypeDiesel Solenoid Injector
NozzleEight holes
Nozzle diameter0.11 mm
XPCI Experiments
Ambient gasN2
Ambient condition1.1, 9.0, 17.7 kg/m3 at 297 K
Injection pressure65, 135, 160 MPa
Injection duration2 ms
Schlieren Imaging Experiments
Ambient gasN2CO2SF6Mixture: 12% H2O; 18% O2; 70% CO2
Ambient condition9.0 kg/m3 at 297 K6.3 kg/m3 at 500 K
Injection pressure30, 40, 50, 65, 135, 160 MPa65, 80, 100, 135 MPa
Injection duration1 ms
Publisher’s Note: MDPI stays neutral with regard to jurisdictional claims in published maps and institutional affiliations.

