1. Introduction
Under the current energy and environmental conditions, researchers are intensively investigating the replacement of fossil fuels with renewable energy resources. In addition, studies of distributed energy resources (DERs) in microgrids are proceeding rapidly in accordance with the de-carbonation policy. Contrarily, renewable energy sources, such as solar and wind power, are characterized by the fluctuating power generation. The expansion of renewable energy in the distribution network causes a mismatch in power supply and demand, and as the size of the ancillary service market inevitably increases, the supply opportunities of economic and stable power sources are reduced. In addition, the demand for global energy is steadily increasing every year; however, the expansion of power-generation and power-transmission infrastructure cannot keep up with this pace. In general, the grid system is excessively designed to overcome peak demand consumption, which only requires a few hours during a one-year period [
1]. For instance, 20% of the generator-rated capacity in the energy market is reserved with respect to spinning or non-spinning conditions to support the peak demand that occurs during 5% of the total one-year period [
2]. Under uncertain and irregular energy production conditions of the renewable energy resources, the stability of the grid system must be secured and the peak load demand must be reduced; the realization of both these factors is important to achieve economic balance of supply and demand. As a solution, we propose a mechanism called the demand response (DR).
The DR is defined as the change in electricity usage patterns by end customers in response to the changes in the price of electricity over time or incentive payments designed to induce lower electricity use during high wholesale market prices or when system reliability is jeopardized [
3]. Current DR programs can be classified into two types: incentive-and price-based. Customers participating in the incentive-based DR program either reduce energy directly in response to the request signal or adopt a contract that provides part of the control to the utility company [
4]. In price-based DR programs, customers offer a DR bidding amount and price based on hourly changes in the electricity rates. They are encouraged to manage their loads by reducing power consumption or shifting consumption schedules to less-congested periods [
5]. Based on the aforementioned DR operating categories, the customer’s power demand may be adjusted according to electricity-price changes, incentives, or emergency situations in grid stability [
6]. As a result, both utility companies and customers can benefit from the implementation of DR in terms of reduced energy use and costs, reduced investments in generators and network systems, and reduced power generation costs [
7]. In recent years, with the rapid increase in the share of renewable energy, a new need for demand flexibility program (DFP) as a solution to rapid oversupply or peak load has been emphasized. For example, DFP can mitigate spikes in demand caused by a sharp drop in PV generation that usually occurs during the evening hours [
8].
The types of resources involved in a DR can be largely divided into industrial, general, and residential uses. Industrial loads, which account for the largest proportion of capacity in a DR, are classified based on the mechanical characteristics of the process as follows [
9]:
Mechanical 1: An industrial load that includes the application of a mechanical force during a specified cycle, including cutting operations such as hydraulic units, press machines, and grinders. Although the load cannot be adjusted, if necessary, the power can be switched on or off over a long time.
Mechanical 2: An industrial load that applies consistent forces to the mobile media, including the manufacturing process such as pumps, fans, blowers, and air compressors. The load can be adjusted through the control.
Thermal: An industrial load that changes the phase, composition, or chemical characteristics of a raw material and is continuously running unless interrupted by maintenance or production schedule change, including smelter, metal heat treatment furnaces, electrolytic cells, and induction melting furnaces.
Therefore, a clear analysis of the load characteristics (e.g., periodicity, patterns of loads that vary from process to process) must precede the use of DR resources for each type of industrial load. Despite the ability to collect data for the use of industrial loads by developing sensing and data-communication technologies, to the best of our knowledge, no studies have yet evaluated the potential of DFP based on the analysis results of industrial load data. Since data are not utilized due to industrial information security policies, experiments to create a virtual industrial process model based on statistical theory has conducted for replacing empirical data. For example, few studies have investigated the improvement in the DR operation by simply designing the process characteristics of cement, refinery, paper, and steel industries [
10,
11,
12,
13,
14]. Therefore, a method must be developed to estimate and evaluate DR potential flexibility based on the data-analysis results of industrial-load resources.
Based on the aforementioned literature overview, the main objectives and contributions of this work are as follows.
A novel method is proposed for evaluating the DR potential flexibility of industrial loads based on guaranteed DR potential estimation.
A new data analysis framework is suggested for the industrial load data to verify the evaluation of DR potential flexibility.
The remainder of this paper is organized as follows.
Section 2 presents a potential score-estimation method for evaluating the DR potential flexibility and the subsequent associated mathematical formulation. This is followed by a description of the test system and industrial load data information in
Section 3. In
Section 4, the results are presented to demonstrate and interpret the effectiveness of the proposed model. Conclusions are drawn in
Section 5.
3. Test System
The electricity cost of a typical cement plant covers approximately 30% of its total cost [
16]. Thus, the cement industry, one of the major consumers of energy, is highly advantageous for use as a DR resource.
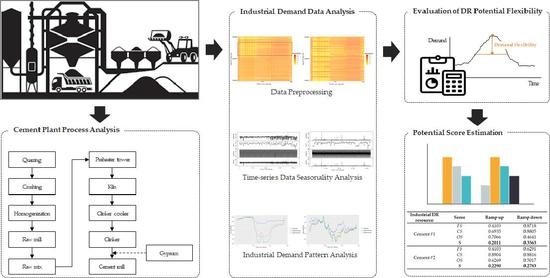
Figure 2 displays a simple diagram presenting different processes in a typical cement plant [
17], which is mainly composed of four processes: (1) crushing and grinding of the raw materials, (2) blending of the materials in the correct proportions, (3) burning of the prepared mix in a kiln, and (4) grinding of the burned product, known as clinker, together with some gypsum of 5%. An overview of the cement process is as follows:
In the first process, limestone obtained through quarrying is first crushed, often in two stages, and then ground in a raw mill.
The fine powders of limestone and subsidiary materials such as iron and clay are blended to reinforce the deficiencies in terms of strength and viscosity.
The blended materials are burned in the kiln to form a clinker, a half-finished cement product.
The burned product (clinker) then passes from the kiln into the coolers.
In the final process, cement products are made by grinding the clinker with addition of gypsum capable of controlling the rate of hardening of the cement.
Among these, quarrying and grinding (i.e., raw and cement mills, respectively) can be selected as the most electricity-intensive processes. In cement plants, a large potential of DR is found in large-scale grinding mills, especially in non-continuous processes such as quarrying operations, raw mills, clinker mills, and fuel mills. Therefore, cement plants can achieve DR potential by shifting the grinding process schedule. The suitability of DFP resource in cement plants can be verified through the analysis of operation characteristics based on high-time resolution of demand data.
4. Results and Discussions
4.1. Results of Data Analysis
4.1.1. Data Description
This study utilized the data of two cement plants (i.e., cement #1 and #2) in Korea to evaluate the adequacy and potential level from the perspective of DFP resources utilization.
The data of the aforementioned industrial loads were measured at 1-min intervals for a total of seven months from 1 March to 30 September, 2019. During the data-acquisition periods, a DR event was organized on 13 June, and the cement plants implemented their demand reduction in accordance with the instructions. Heat maps for the electricity-demand data of the cement plants are illustrated as
Figure 3. The proportion of missing data (NA) in cement #1 and #2 was measured as 0.4% (NA observations: 1219) and 0.22% (NA observations: 685), respectively, owing to the omission of specific days. Out of seven months, the number of days of omission for cement #1 and #2 was 3 days (15 March, 17 April, and 23 April), and 2 days (9 September and 10 September), respectively.
4.1.2. Analysis of Data Characteristics
Characteristic analysis of electricity-demand data, including trend, seasonality, demand pattern, and daily demand variance, was conducted to determine the suitability of cement plants as a DFP resource.
First of all, load data were decomposed into trends, seasonality and white noise through additive decomposition. The additive decomposition method is one of the time series analysis methods for estimating the seasonal effect and trend of a time series, and allows the time series data to be composed of the sum of trend, seasonal, and random values (white noise). As a result of the additive decomposition of cement plants data, we can identify the daily seasonality and no trends over the measured time. The results of the additive decomposition are shown in
Figure 4, confirming the absence of a trend and daily seasonality. The comparison between the demand profile and actual demand shows the variances based on the profile to be 159.56 and 23.64 kWh, respectively, showing that the actual demand does not significantly deviate from the demand profile. Accordingly, the power consumption of the cement plants showed a consistent daily pattern. Weekly seasonality was not observed owing to the operation of the industrial characteristics regardless of the weekdays or weekends, as confirmed by the similar profiles for all days. As observed, cement plant #2 showed little difference in terms of power consumption on weekdays and weekends, and power consumption during daytime on weekends is higher than on weekdays. It was also confirmed that the cement #1 plant of the power consumption gap during daytime between weekdays and weekends was wider compared to the cement #2 plant.
In addition, an analysis was conducted on the reasons why the demand pattern was shown, as in
Figure 5, and it was confirmed that this was closely related to industrial electricity rates. Therefore, both cement plants identified a significant reduction in power consumption during the morning and daytime, which is due to the electricity rate plan paid by cement factories. The electricity rate plan of industrial customers (i.e., cement plants) is termed as Time-of-use (TOU) pricing, in which the unit price of electricity changes according to the time of day and rate level that vary depending on the off-peak load, mid-load, and peak load time. As cement plants operate properly in response to the TOU rate, they reduce their electricity consumption during the peak time (between 10:00 and 12:00) and activate the equipment mainly during the off-peak time (between 13:00 and 23:00). The load profiles of the total number of days, weekdays, and weekends for the two cement plants are shown in
Figure 5. The comparison of the ramp-up period (between 12:00 and 17:59) and ramp-down period (between 18:00 and 21:00) of the designed flexible DR program shows that the cement plants have sufficient DR potential to be utilized as a resource through shifting operation schedules.
4.2. Comparison of DR Potential Score
To estimate the DR potential flexibility score of cement industrial loads, the seasonal load characteristics of summer and winter were reviewed, and the potential score was calculated separately based on the ramp-up and ramp-down of the DR interval. In this study, the potential scores of cement #1 and #2 were evaluated and compared only for the summer season based on the data obtained for the limited experimental period. The calculation of potential score was performed using the proposed method in
Section 2. As shown in
Table 1, the potential score for both loads averaged at approximately 0.2662. The
FS for the ramp-down DR was significantly higher than that for the ramp-up DR, and this served as the most significant factor in determining the difference between the potential scores,
S, of ramp-up DR and ramp-down DR. The aforementioned result was derived from the fact that both cement #1 and #2 responded well to the time of use (TOU) rate plan and lowered the power consumption during the ramp-down DR period with high rate.
To estimate the DR potential flexibility score of cement industrial loads, the seasonal load characteristics of summer and winter were reviewed, and the potential score was calculated separately based on the ramp-up and ramp-down of the DR interval. In this study, the potential scores of cement #1 and #2 were evaluated and compared only for the summer season based on the data obtained for the limited experimental period. The calculation of potential score was performed using the proposed method in
Section 2. As shown in
Table 1, the potential score for both loads averaged at approximately 0.2662. The
FS for the ramp-down DR was significantly higher than that for the ramp-up DR, and this served as the most significant factor in determining the difference between the potential scores,
S, of ramp-up DR and ramp-down DR. The aforementioned result was derived from the fact that both cement #1 and #2 responded well to the TOU rate plan and lowered the power consumption during the ramp-down DR period with a high rate.
The potential score is a value between 0 and 1, and a score estimated close to 1 indicates that the potential amount available to participate in DFP is large. However, the evaluation of the potential scores showed that the estimation of the practical capacity level of load resources or the ratio of the potential amount to total capacity is impossible. To verify this, an experiment should be conducted on the actual ramp-up or ramp-down of the DR for the resources.
4.3. Discussion of Actual DR Performance
To identify the significance of the potential scores, the level of demand reduction was analyzed from the data collected on the days of ramp-down of the DR issuance for cement #1 and #2. The issuance of DR lasted for 1 h from 18:00 to 19:00 on 13 June 2019. The power-consumption profiles of the cement load and customer baseline load (CBL) calculated as Max 4/5 are described in
Figure 6.
During the DR period, demand reduction of 45,000 and 13,000 kWh was requested for cement #1 and #2, respectively, and their corresponding reduction performances were calculated as 51,198 and 18,540 kWh, respectively. Similar to the results in which the potential score of cement #1 for ramp-down DR was higher than that for cement #2, the load-reduction rate of cement #1 in this case was higher. The load-reduction ratios of the two resources were measured as 68.81% and 53.27%, respectively, based on the CBL, confirming that both have the ability to reduce load by more than half.
The performance rates, namely the ratio of reduction amount to the contracted capacity, of the resources both exceeded 100%, which was attributed to conservatively contracting capacity, to avoid penalties arising from failure to reduce. The performance results of the actual DR compared to the DR requests are shown in
Table 2.
The actual performance level of ramp-up DR is expected to be lower than that of ramp-down DR with the same potential score, as additional costs are required for the demand increase. As discussed in the aforementioned data-analysis results, as the peak power consumption of the cement-production process occurred during the nonpeak period at night, a low potential score, S, was calculated because of the small OS value with low DR responsiveness. Accordingly, although the linearity of the relationship between the potential score and DR reduction rate of both cement #1 and #2 could not be determined, a similar score could be derived from the same industrial process. In addition, this relationship is expected to converge at a specific point based on sufficiently extended data. To ensure the validity of the aforementioned discussions, the following conditions and experiments should be supplemented:
Large amounts of heterogeneous data investigations with multidimensional industry, period, season, and time resolution.
Demonstration results of large DR events.
5. Conclusions
This paper proposed a DR potential flexibility evaluation model for industrial loads. The proposed methodology derives results with scores between 0 and 1, and it is designed such that the closer the score is to 1, the higher is the potential. The value of an industrial resource was quantified from the perspective of data analysis, reflecting the frequency of power consumption, consistency of power consumption, and DR operation. Prior to the DR potential flexibility evaluation, demand characteristic analysis was performed for two cement plants, which are industrial demands. As a result, daily seasonality was confirmed, but weekly seasonality was not identified as they worked regardless of weekdays and weekends. There was also no trend in the demand load of the two cement plants because average power consumption does not increase unless additional processes or equipment are increased. In addition, the daily patterns of the two cement plants were closely related to the industrial electricity rate they have been paying for. The potential scores were calculated for two cement plants, cement #1 and #2, and were compared with the demand-reduction performance result. The results confirmed that a load reduction of more than half of the usual power consumption is possible if the potential score on ramping down the demand for cement loads is 0.27. The proposed method can be used as an indicator to determine whether an industrial load is adequate to participate in DFP. However, this study has certain limitations: the level of resource capacity was not considered, although the rates load reductions and increases in the power consumption for a single industrial load were reflected as a potential flexibility evaluation indicator. For both the cement plants, similar scores were shown through a case study despite a difference of almost two times in the amount of load reduction. Thus, in the future, further research is needed to apply an additional indicator of resource capacity in the estimation of the potential score.


