Design, Valuation and Comparison of Demand Response Strategies for Congestion Management

Abstract
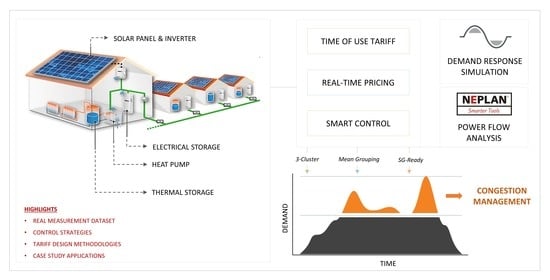
:
1. Introduction
2. Methodology
2.1. Data Processing and Selection
2.2. Case Study
2.3. Demand Response Strategies
2.3.1. Real-Time Tariff Design
2.3.2. Time of Use (ToU) Tariff Design
2.3.3. Smart Control via Distribution Network Monitoring
2.3.4. Managing Congestion Using Solar Panels and Batteries
3. Results
3.1. Impact of LCTs on Secondary Substation
- ▪
- HP_ToU_Full signifies the scenario where 100% of the consumers adhere to the time of use signals, charging their heat battery at night between 11 pm–6 am and at daytime between 11 am–4 pm.
- ▪
- HP_ToU_Half signifies the scenario where only half of the consumers adhere to the time of use tariff or if all consumers are responding half of the time.
- ▪
- HP_ToU_1_Charge signifies the scenario where half of the consumers respond to the time of use tariff, but only charge their heat battery at night (no day charge), and the charged battery is used only to meet the evening demand.
3.2. Load Flow Results
3.3. Impact of LCTs on Primary Substation
3.4. Managing Backflows and Excess Generation
3.5. CO2 Emissions
3.6. Price of Flexibility
4. Conclusions
Author Contributions
Funding
Acknowledgments
Conflicts of Interest
References
- CCC. Net Zero The UK’s Contribution to Stopping Global Warming; CCC: London, UK, 2019. [Google Scholar]
- GOV.UK. Spring Statement 2019: What You Need to Know; GOV: London, UK, 2019. [Google Scholar]
- GOV.UK. PM Outlines His Ten Point Plan for a Green Industrial Revolution for 250,000 Jobs; GOV: London, UK, 2020. [Google Scholar]
- Picciariello, A.; Reneses, J.; Frias, P.; Söder, L. Distributed generation and distribution pricing: Why do we need new tariff design methodologies? Electr. Power Syst. Res. 2015, 119, 370–376. [Google Scholar] [CrossRef]
- Housing Executives. Housing Condition Survey; Housing Executives: Newtownards, UK, 2018. [Google Scholar]
- Housing Executives. Home Energy Conservation Authority Annual Progress Report 2018; Housing Executives: Newtownards, UK, 2018. [Google Scholar]
- Haque, A.N.M.M.; Nguyen, P.H.; Vo, T.H.; Bliek, F.W. Agent-based unified approach for thermal and voltage constraint management in LV distribution network. Electr. Power Syst. Res. 2017, 143, 462–473. [Google Scholar] [CrossRef] [Green Version]
- El Geneidy, R.; Howard, B. Contracted energy flexibility characteristics of communities: Analysis of a control strategy for demand response. Appl. Energy 2020, 263, 114600. [Google Scholar] [CrossRef]
- Zhang, L.; Good, N.; Mancarella, P. Building-to-grid flexibility: Modelling and assessment metrics for residential demand response from heat pump aggregations. Appl. Energy 2019, 233–234, 709–723. [Google Scholar] [CrossRef]
- Agbonaye, O.; Keatley, P.; Huang, Y.; Bani-Mustafa, M.; Ademulegun, O.O.; Hewitt, N. Value of demand flexibility for providing ancillary services: A case for social housing in the Irish DS3 market. Util. Policy 2020, 67, 101130. [Google Scholar] [CrossRef]
- Krishnamurthy, D.; Uckun, C.; Zhou, Z.; Thimmapuram, P.; Botterud, A.; Uckun, C.; Zhou, Z.; Thimmapuram, P.; Botterud, A. Energy Storage Arbitrage Under Day-Ahead and Real-Time Price Uncertainty Reduced number of DA price forecast scenarios. IEEE Trans. Power Syst. 2017, 33, 84–93. [Google Scholar] [CrossRef]
- Jia, L.; Tong, L. Dynamic Pricing and Distributed Energy Management for Demand Response. IEEE Trans. Smart Grid 2016, 7, 1128–1136. [Google Scholar] [CrossRef]
- Klaassen, E.A.M.; van Gerwen, R.J.F.; Frunt, J.; Slootweg, J.G. A methodology to assess demand response benefits from a system perspective: A Dutch case study. Util. Policy 2017, 44, 25–37. [Google Scholar] [CrossRef] [Green Version]
- Schreiber, M.; Wainstein, M.E.; Hochloff, P.; Dargaville, R. Flexible electricity tariffs: Power and energy price signals designed for a smarter grid. Energy 2015, 93, 2568–2581. [Google Scholar] [CrossRef]
- Eid, C.; Koliou, E.; Valles, M.; Reneses, J.; Hakvoort, R. Time-based pricing and electricity demand response: Existing barriers and next steps. Util. Policy 2016, 40, 15–25. [Google Scholar] [CrossRef] [Green Version]
- Ruppert, M.; Hayn, M.; Bertsch, V.; Fichtner, W. Impact of residential electricity tariffs with variable energy prices on low voltage grids with photovoltaic generation. Int. J. Electr. Power Energy Syst. 2016, 79, 161–171. [Google Scholar] [CrossRef]
- Brown, T.; Faruqui, A.; Grausz, L. Efficient tariff structures for distribution network services. Econ. Anal. Policy 2015, 48, 139–149. [Google Scholar] [CrossRef]
- Abdelmotteleb, I.; Gómez, T.; Chaves Ávila, J.P.; Reneses, J. Designing efficient distribution network charges in the context of active customers. Appl. Energy 2018, 210, 815–826. [Google Scholar] [CrossRef]
- Passey, R.; Haghdadi, N.; Bruce, A.; MacGill, I. Designing more cost reflective electricity network tariffs with demand charges. Energy Policy 2017, 109, 642–649. [Google Scholar] [CrossRef]
- Ademulegun, O.O.; Keatley, P.; Agbonaye, O.; Moreno Jaramillo, A.F.; Hewitt, N.J. Towards a sustainable electricity grid: Market and policy for demand-side storage and wind resources. Util. Policy 2020, 67, 101116. [Google Scholar] [CrossRef]
- Chao, H. Price-Responsive Demand Management for a Smart Grid World; Elsevier Inc.: Amsterdam, The Netherlands, 2010; Volume 23, pp. 7–20. [Google Scholar]
- Fridgen, G.; Kahlen, M.; Ketter, W.; Rieger, A.; Thimmel, M. One rate does not fit all: An empirical analysis of electricity tariffs for residential microgrids. Appl. Energy 2018, 210, 800–814. [Google Scholar] [CrossRef] [Green Version]
- Bartusch, C.; Wallin, F.; Odlare, M.; Vassileva, I.; Wester, L. Introducing a demand-based electricity distribution tariff in the residential sector: Demand response and customer perception. Energy Policy 2011, 39, 5008–5025. [Google Scholar] [CrossRef]
- Allcott, H. Rethinking real-time electricity pricing. Resour. Energy Econ. 2011, 33, 820–842. [Google Scholar] [CrossRef] [Green Version]
- Ozaki, R. Follow the price signal: People’s willingness to shift household practices in a dynamic time-of-use tariff trial in the United Kingdom. Energy Res. Soc. Sci. 2018, 46, 10–18. [Google Scholar] [CrossRef]
- Maggiore, S.; Gallanti, M.; Grattieri, W.; Benini, M. Impact of the enforcement of a time-of-use tariff to residential customers in Italy. In Proceedings of the 22nd International Conference and Exhibition on Electricity Distribution (CIRED 2013), Institution of Engineering and Technology, Kistamässan, Sweden, 10–13 June 2013; Volume 2013, p. 0320. [Google Scholar]
- Reiss, P.C.; White, M.W. Household electricity demand, revisited. Rev. Econ. Stud. 2005, 72, 853–883. [Google Scholar] [CrossRef]
- Gyamfi, S.; Krumdieck, S.; Urmee, T. Residential peak electricity demand response—Highlights of some behavioural issues. Renew. Sustain. Energy Rev. 2013, 25, 71–77. [Google Scholar] [CrossRef] [Green Version]
- Torriti, J. Price-based demand side management: Assessing the impacts of time-of-use tariffs on residential electricity demand and peak shifting in Northern Italy. Energy 2012, 44, 576–583. [Google Scholar] [CrossRef]
- Gu, C.; Yan, X.; Yan, Z.; Li, F. Dynamic pricing for responsive demand to increase distribution network efficiency. Appl. Energy 2017, 205, 236–243. [Google Scholar] [CrossRef] [Green Version]
- Kim, B.; Zhang, Y.; Member, S.; Van Der Schaar, M.; Lee, J.; Member, S. Scheduling With Reinforcement Learning. IEEE Trans. Smart Grid 2016, 7, 2187–2198. [Google Scholar] [CrossRef]
- Haque, A.N.M.M.; Nguyen, P.H.; Bliek, F.W.; Slootweg, J.G. Demand response for real-time congestion management incorporating dynamic thermal overloading cost. Sustain. Energy Grids Netw. 2017, 10, 65–74. [Google Scholar] [CrossRef]
- Wang, A.; Li, R.; You, S. Development of a data driven approach to explore the energy flexibility potential of building clusters. Appl. Energy 2018, 232, 89–100. [Google Scholar] [CrossRef]
- Fischer, D.; Wolf, T.; Wapler, J.; Hollinger, R.; Madani, H. Model-based flexibility assessment of a residential heat pump pool. Energy 2017, 118, 853–864. [Google Scholar] [CrossRef]
- Turvey, N.; Clarke, C.; Calder, C. Freedom Project Final Report; Wales & West Utilities: Newport, UK, 2018. [Google Scholar]
- Papadaskalopoulos, D.; Strbac, G. Decentralized optimization of flexible loads operation in electricity markets. In Proceedings of the 2013 IEEE Grenoble Conference PowerTech, Grenoble, France, 16–20 June 2013. [Google Scholar]
- Papadaskalopoulos, D.; Fatouros, P.; Strbac, G. Addressing demand response concentration under dynamic pricing. In Proceedings of the 2015 IEEE Eindhoven PowerTech, Eindhoven, The Netherlands, 29 June–2 July 2015. [Google Scholar]
- Karlsen, S.S.; Hamdy, M.; Attia, S. Methodology To Assess Business Models of Dynamic Pricing Tariffs in All-Electric Houses. Energy Build. 2020, 207, 1–22. [Google Scholar] [CrossRef]
- Jankowiak, C.; Zacharopoulos, A.; Brandoni, C.; Keatley, P.; MacArtain, P.; Hewitt, N. Assessing the benefits of decentralised residential batteries for load peak shaving. J. Energy Storage 2020, 32, 101779. [Google Scholar] [CrossRef]
- Pallonetto, F.; De Rosa, M.; Milano, F.; Finn, D.P. Demand response algorithms for smart-grid ready residential buildings using machine learning models. Appl. Energy 2019, 239, 1265–1282. [Google Scholar] [CrossRef]
- Sunamp Ltd. Uniq Heat Batteries Reference Manual_V2.3; Sunamp Ltd.: Tranent, UK, 2018. [Google Scholar]
- Summerfield, R.A.; Biddulph, P.; Stone, A. Analysis of Data from Heat Pumps Installed via the Renewable Heat Premium Payment (RHPP) Scheme to the Department of Energy and Climate Change (DECC); DECC RHPP Detailed Analysis Report; University College London: London, UK, 2016; pp. 2013–2015. [Google Scholar]
- Love, J.; Summerfield, A.; Biddulph, P.; Wingfield, J.; Martin, C.; Gleeson, C.; Lowe, R. Investigating Variations in Performance of Heat Pumps Installed via the Renewable Heat Premium Payment (RHPP) Scheme; University College London: London, UK, 2017; pp. 2013–2015. [Google Scholar]
- sonnenBatterie. Technical Data sonnenBatterie; sonnenBatterie: Wildpoldsried, Germany, 2019. [Google Scholar]
- Power NI Electricity Unit and Tariff Rates and Prices; Power NI Energy: Belfast, Iceland, 2020.
- SEMO Integrated Single Electricity Market MO Tariffs & Charges and Imperfections Charge; Southeast Missouri State University: Cape Girardeau, MO, USA, 2020; pp. 2019–2021.
- NieNetworks. Statement of Charges for use of the Northern Ireland Electricity Networks Ltd Electricity Distribution System by Authorised Persons; NieNetworks: Belfast, Ireland, 2019. [Google Scholar]
- SONI. TUoS Statement of Charges; SONI: Ulster, UK, 2019. [Google Scholar]
- Steele, P. Agile Pricing Explained; Octopus Energy: London, UK, 2019. [Google Scholar]
- Le, K.X.; Huang, M.J.; Wilson, C.; Shah, N.N.; Hewitt, N.J. Tariff-based load shifting for domestic cascade heat pump with enhancedsystem energy efficiency and reduced wind power curtailment. Appl. Energy 2020, 257, 113976. [Google Scholar] [CrossRef]
- Salies, E. Real-Time Pricing when Consumers Have Saving Costs; SciencesPo: Paris, France, 2012. [Google Scholar]
- Oprea, S.V.; Bara, A. Setting the Time-of-Use Tariff Rates with NoSQL and Machine Learning to a Sustainable Environment. IEEE Access 2020, 8, 25521–25530. [Google Scholar] [CrossRef]
- Kodinariya, T.M.; Makwana, P.R.D. Review on Determining of Cluster in K-means Clustering Review on determining number of Cluster in K-Means Clustering. Int. J. Adv. Res. Comput. Sci. Manag. Stud. 2016, 1, 90–95. [Google Scholar]
- López, I.G.; Zubia, H.U.; González, J.R.; Lartategui, I.A.; Sanz, M.H.; Sánchez, A.P. Low Voltage Supervision Systems: Technology, Applications, Use Cases And Deployment. In Proceedings of the 25th International Conference on Electricity Distribution, Madrid, Spain, 3–6 June 2019; pp. 3–6. [Google Scholar]
- Electricity North West. Low Carbon Network Fund Project ENWT1001-The Smart Fuse Closedown Report; Electricity North West: Warrington, UK, 2014. [Google Scholar]
- Electricity North West. Smart Street: Project Closedown Report; Electricity North West: Warrington, UK, 2019. [Google Scholar]
- Muhanji, S.O.; Flint, A.E.; Farid, A.M.; Muhanji, S.O.; Flint, A.E.; Farid, A.M. eIoT as a Solution to Energy-Management Change Drivers; Springer: Berlin/Heidelberg, Germany, 2019; ISBN 9783030104269. [Google Scholar]
- WPD. Learning Generated from the OpenLV Project Trials by All Methods; WPD: Bristol, UK, 2020. [Google Scholar]
- EURISCO; DTI. Standardisation-Conformance Testing-Smart Grid Ready SGO Final Report (WP6); EURISCO, DTI: Taastrup, Denmark, 2016. [Google Scholar]
- EA Technology. Development of the Transform Model for Northern Ireland; EA Technology: Chester, UK, 2016. [Google Scholar]
- HOC; NI Affairs Committee. Electricity Sector in Northern Ireland; HOC, NI Affairs Committee: London, UK, 2017. [Google Scholar]
- Sattarpour, T.; Nazarpour, D.; Golshannavaz, S.; Siano, P. A multi-objective hybrid GA and TOPSIS approach for sizing and siting of DG and RTU in smart distribution grids. J. Ambient Intell. Humaniz. Comput. 2018, 9, 105–122. [Google Scholar] [CrossRef]
- SunSpec Alliance. Communicating the Customer Benefits of Information Standards: A Guide to Defining How Standards Reduce Cost and Eliminate Risk in Solar Installations April; SunSpec Alliance: San Jose, CA, USA, 2012. [Google Scholar]
- Delta-ee. Technical Feasibility of Electric Heating in Rural Off-Gas Grid Dwellings; Delta-ee: London, UK, 2018; Volume 44. [Google Scholar]
- Daikin UK Daikin UK Product Catalogue 1; Daiki Tech: London, UK, 2010.
- NIE Networks. Technical Requirements For Customer Export Limiting Schemes (Based On G100); NIE Networks: Belfast, Ireland, 2018. [Google Scholar]
- EirGrid EirGrid Group plc. Smart Grid Dashboard; EirGrid EirGrid Group plc.: Dublin, Ireland, 2020. [Google Scholar]
- EirGrid. Tomorrow’s Energy Scenarios 2019 Ireland; EirGrid: Dublin, Ireland, 2019; pp. 1–86. [Google Scholar]
- Fonteijn, R.; van Amstel, M.; Nguyen, P.; Morren, J.; Maarten Bonnema, G.; Slootweg, H. Evaluating flexibility values for congestion management in distribution networks within Dutch pilots. J. Eng. 2019, 2019, 5158–5162. [Google Scholar] [CrossRef]
- Fonteijn, R.; Bernards, R.; Nguyen, P.; Morren, J.; Slootweg, H. Flexibility for Congestion Management: An Operational Decision-Making Process. In Proceedings of the 25th International Confefernece Electricity Distribution (CIRED), Madrid, Spain, 3–6 June 2019; pp. 3–6. [Google Scholar]
- Schachter, J.A.; Mancarella, P.; Moriarty, J.; Shaw, R. Flexible investment under uncertainty in smart distribution networks with demand side response: Assessment framework and practical implementation. Energy Policy 2016, 97, 439–449. [Google Scholar] [CrossRef]
- Utility Regulator Assessment of RP6 Network Investment Direct Allowances; Utility Regulator Electricity Gas Water: London, UK, 2017.
- Koliou, E.; Bartusch, C.; Picciariello, A.; Eklund, T.; Söder, L.; Hakvoort, R.A. Quantifying distribution-system operators’ economic incentives to promote residential demand response. Util. Policy 2015, 35, 28–40. [Google Scholar] [CrossRef]
- Valenzuela, J.; Thimmapuram, P.R.; Kim, J. Modeling and simulation of consumer response to dynamic pricing with enabled technologies. Appl. Energy 2012, 96, 122–132. [Google Scholar] [CrossRef]
- Pimm, A.J.; Cockerill, T.T.; Taylor, P.G. Time-of-use and time-of-export tariffs for home batteries: Effects on low voltage distribution networks. J. Energy Storage 2018, 18, 447–458. [Google Scholar] [CrossRef]
- Schwenen, S.; Boom, A. Is Real-time Pricing Smart for Consumers? Department of Economics, Copenhagen Business School: Frederiksberg, Denmark, 2020. [Google Scholar]


| Social Housing Estates | 11/0.4 kV Transformer | Rating | No of Houses Per Feeder | |
|---|---|---|---|---|
| 79/94 | 79/87 | |||
| BALLYSALLY ESTATE | Glenvara Drive | 500 kVA | 217 | - |
| Rochester Court | 300 kVA | 91 | - | |
| Sprucefield Drive | 500 kVA | - | 135 | |
| Elms Park | 315 kVA | - | 70 | |
| Ballygallin Park | 500 kVA | - | 161 | |
| MILLBURN ESTATE | Rosemary Place | 315 kVA | 166 | - |
| Willow Drive | 500 kVA | 160 | - | |
| Total (1000) | 634 | 366 | ||
| Time | 1 am | 2 am | 3 am | 4 am | 5 am | 6 am | 7 am | 8 am | 9 am | 10 am | 11 am | 12 am |
|---|---|---|---|---|---|---|---|---|---|---|---|---|
| RT_Actual (p) | 12.42 | 12.61 | 12.73 | 12.55 | 13.47 | 14.49 | 18.77 | 19.50 | 16.32 | 12.55 | 12.45 | 13.71 |
| RT_Approx (p) (nearest 0.5 p) | 12.50 | 12.50 | 12.50 | 12.50 | 13.50 | 14.50 | 19.00 | 19.50 | 16.50 | 12.50 | 12.50 | 13.50 |
| RT_Mean (p) (nearest 0.5 p) | 12.55 | 12.55 | 12.55 | 12.55 | 13.59 | 14.49 | 18.77 | 19.50 | 16.32 | 12.55 | 12.55 | 13.59 |
| RT_Actual | RT_Approx (nearest 0.5 p) | RT_Approx (nearest 1 p) | RT_Mean (nearest 0.5 p) | RT_Mean (nearest 1 p) | |
|---|---|---|---|---|---|
| MPE | - | 0.0% | 0.1% | 0.0% | 0.0% |
| MAPE | - | 0.9% | 1.8% | 0.4% | 1.1% |
| ALH | 1.32 | 2.93 | 3.76 | 2.93 | 3.76 |
| ACLH | 1.31 | 2.83 | 3.66 | 2.83 | 3.66 |
| ANLP | 1.01 | 1.08 | 1.10 | 1.08 | 1.10 |
| Date | Scenarios | Loguestown Primary | Feeder 79/94 | Glenvara Drive | |||
|---|---|---|---|---|---|---|---|
| kW | kVAr | kW | kVAr | kW | kVAr | ||
| Winter Peak 22/01/2018 17:00:00 | Base Load | 6639.68 | 735.68 | 1338.84 | 72.30 | 390.37 | 124.92 |
| HP_Default | 7713.98 | 1018.49 | 2019.94 | 297.06 | 623.50 | 201.85 | |
| PV_HP_Smart | 5249.68 | 735.68 | 457.58 | 72.30 | 88.74 | 124.92 | |
| PV_HP_ToU | 7234.48 | 789.38 | 1715.94 | 72.30 | 519.44 | 124.92 | |
| Summer Min 19/05/2018 14:00:00 | Base Load | 568.54 | 499.17 | 473.73 | 73.33 | 105.20 | 33.66 |
| Base Load + PV | −1190.47 | 499.17 | −641.47 | 73.33 | −276.51 | 33.66 | |
| PV_HP_Smart | −1038.47 | 546.07 | −533.00 | 107.06 | −235.07 | 46.63 | |
| PV_HP_ToU | −1041.80 | 535.80 | −547.22 | 96.56 | −244.24 | 41.61 | |
| Oil | HP_Default | HP_ToU | HP_RT | HP_Smart | |
|---|---|---|---|---|---|
| CO2 Emissions (Kg) | 2648.45 | 1342.57 | 1369.38 | 1365.52 | 1427.00 |
| % Reduced | 49.31% | 48.29% | 48.44% | 46.12% |
| HP_Default | HP_ToU (Flat Tariff) | HP_ToU (3 Cluster) | HP_RT | |
|---|---|---|---|---|
| Total Annual Heat Electricity cost for Portfolio (1000 HPs) | £630,331 | £639,670 | £513,342 | £522,900 |
| Savings/Consumer/Year | −£9.3 | £117.0 | £107.4 |
Publisher’s Note: MDPI stays neutral with regard to jurisdictional claims in published maps and institutional affiliations. |
© 2020 by the authors. Licensee MDPI, Basel, Switzerland. This article is an open access article distributed under the terms and conditions of the Creative Commons Attribution (CC BY) license (http://creativecommons.org/licenses/by/4.0/).
Share and Cite
Agbonaye, O.; Keatley, P.; Huang, Y.; Bani Mustafa, M.; Hewitt, N. Design, Valuation and Comparison of Demand Response Strategies for Congestion Management. Energies 2020, 13, 6085. https://doi.org/10.3390/en13226085
Agbonaye O, Keatley P, Huang Y, Bani Mustafa M, Hewitt N. Design, Valuation and Comparison of Demand Response Strategies for Congestion Management. Energies. 2020; 13(22):6085. https://doi.org/10.3390/en13226085
Chicago/Turabian StyleAgbonaye, Osaru, Patrick Keatley, Ye Huang, Motasem Bani Mustafa, and Neil Hewitt. 2020. "Design, Valuation and Comparison of Demand Response Strategies for Congestion Management" Energies 13, no. 22: 6085. https://doi.org/10.3390/en13226085